Results Presentation 6M August Dr. Immo Querner, CFO
|
|
|
- Tyrone Franklin
- 6 years ago
- Views:
Transcription

1 Results Presentation 6M August 2014 Dr. Immo Querner, CFO
2 Agenda I II III IV Group Highlights Segments Investments / Capital Outlook Appendix Mid-term Target Matrix 6M 2014 Additional Information 2
3 I 6M 2014 Remaining on track for FY2014 targets Adjusted for last year s SwissLife effect, net income of 381m ahead of 6M 2013 level Top-line growth regains momentum as GWP grew by 0.8% in Q (6M 2014: +0.1%). International activities in Industrial Lines and in retail more than offset negative currency effects (6M 2014 currency-adjusted: +2.1%) Storm Ela and above-average Industrial Lines Property claims - largely in June - affect combined ratios mainly in Primary Insurance. In sum, Talanx Group remained comfortably within its large loss budget for the first half 2014 End of June 2014, shareholders equity grew to 7,645m (FY2013: 7,184m) or per share (FY2013: 28.42) FY2014 net income outlook of at least 700m confirmed 3
4 I 6M 2014 results Key financials Summary of 6M 2014 m, IFRS 6M M 2013 Change Gross written premium 14,975 14, % Net premium earned 11,308 11,498 (2) % Net underwriting result (775) (716) n/m Net investment income 1,948 1, % Operating result (EBIT) 1,005 1,032 (3) % Net income after minorities (7) % Key ratios 6M M 2013 Change Combined ratio non-life insurance and reinsurance 96.4% 96.1% 0.3%pts Return on investment 4.0% 4.0% 0.0%pts Balance sheet 6M 2014 FY2013 Change Investments under own management 90,252 86, % Goodwill 1,109 1, % Total assets 139, , % Technical provisions 96,829 91, % Total shareholders' equity 11,925 11, % Shareholders' equity 7,645 7, % Comments GWP virtually flat (+0.1%), negatively impacted by currency effects (currency-adj.: +2.1%) and more selective Reinsurance underwriting. However, apart from Life/Health Reinsurance, all segments most recently with positive growth momentum Positive growth contribution from Industrial Lines and Retail International Combined ratio slightly increased by 0.3%pts to 96.4%, impacted by above-average man-made large losses, and impact from storm Ela Return on investment remained flat at 4.0% 6M 2014 net income ( 381m) exceeds 6M 2013 level, when adjusting for the base effect of partial disposal of SwissLife stake (~ 100m) Shareholders equity up to 7,645m, or per share. Solvency I ratio up to 224.8% (FY2013: 210.2%) Note: numbers adjusted on the basis of IAS8 6M 2014 in line with target significant base effect from SwissLife disposal in
5 I Large losses 1 in 6M 2014 ( m, net) 1 definition large loss : in excess of 10m gross Primary insurance Reinsurance Talanx Group Snowstorm, Japan 08 February 9 9 Storm Ela German, Belgium, France Aviation Property Total man-made losses June Total Nat Cat Total large losses Impact on combined ratio (incurred) 5.2% pts 3.1% pts 4.1% pts Total large losses (6M 2013) Total large loss burden of 250m (6M 2013: 419m) Industrial Lines was affected by various large losses in Property. Storm Ela impacted Industrial Lines and Retail Germany (each ~ 20m) and Reinsurance ( 33m) Net burden of manmade large losses of 105m in Industrial Lines and 63m in Reinsurance 2014 net income outlook with implied capacity to bear in sum another ~ 650m of large losses in H
6 I Combined ratios Development of net combined ratio 1 Combined ratio by segment/selected carrier M M 2013 Q Q Industrial Lines 99.4% 102.1% 108.6% 103.9% Retail Germany 101.2% 99.9% 102.1% 104.6% 68.9% 70.6% 75.1% 68.6% 67.7% 70.8% Retail International 95.3% 94.9% 95.6% 95.7% HDI Seguros S.A., Brazil 97.7% 94.6% 97.9% 93.5% HDI Seguros S.A., Mexico % 87.6% 92.6% 95.0% TUiR Warta S.A., Poland % 94.6% 94.6% 95.6% 26.3% 26.6% 25.7% 26.8% 26.7% 27.7% TU Europa S.A., Poland % 77.2% 84.0% 86.6% HDI Sigorta A.Ş., Turkey 104.0% 106.9% 103.7% 107.2% Q1 Q2 Q3 Q4 Q1 Q HDI Assicurazioni S.p.A., Italy 95.3% 99.9% 96.0% 100.4% Expense ratio Loss ratio Non-Life Reinsurance 95.1% 94.2% 95.7% 94.3% 1 incl. net interest income on funds withheld and contract deposits 2 Warta acquisition closed on 1 July 2012; numbers incl. HDI Asekuracia TU S.A. (legal merger on 28 Dec 2012) 3 TU Europa acquisition closed on 1 June numbers incl. Metropolitana Note: numbers adjusted on the basis of IAS8 Despite large losses in Property, Group combined ratio well below the 100% level 6
7 I GWP trend GWP development ( bn) Seasonal pattern unchanged In Q2 2014, some slight GWP improvement (+0.8%) vs. Q despite still negative currency effects (0.2) (0.2) (0.2) (0.2) (0.2) (0.2) Q1 Q2 Q3 Q4 Q1 Q Industrial Lines Retail Germany Retail International Non-Life Reinsurance Life/Health Reinsurance Corporate Functions and Consolidation Uptick in Q growth momentum results mainly from Industrial Lines, various entities in Retail International and Non-Life Reinsurance Q regains growth momentum 7
8 I Group Key quarterly financials Summary of Q m, IFRS Q Q Change Gross written premium 6,561 6, % Net premium earned 5,709 5,783 (1) % Net underwriting result (405) (464) n/m Net investment income 938 1,002 (6) % Operating result (EBIT) (11) % Net income after minorities (19) % Key ratios Q Q Change Combined ratio non-life insurance and reinsurance 98.4% 97.1% 1.3%pts Return on investment 3.8% 4.2% -0.4%pts Balance sheet 6M 2014 FY2013 Change Investments under own management 90,252 86, % Goodwill 1,109 1, % Total assets 139, , % Technical provisions 96,829 91, % Shareholders equity 7,645 7, % Comments Combined ratio slightly up by 1.3%pts to 98.4%, mainly as Industrial Lines faces a number of man-made large losses Decline in quarterly extraordinary investment income in Retail Germany Life business largely explains the improved net underwriting result in the quarter In Q2 2013, Group functions included a 75m positive EBIT effect (~70% in investment income, ~30% in currency result) from the SwissLife disposal Note: numbers adjusted on the basis of IAS8 EBIT decline due to SwissLife base effect 8
9 Agenda I II III IV Group Highlights Segments Investments / Capital Outlook Appendix Mid-term Target Matrix 6M 2014 Additional Information 9
10 II Segments Industrial Lines P&L for Industrial Lines m, IFRS 6M M 2013 Δ Q Q Δ Gross written premium 2,497 2,399 +4% % Net premium earned % % Net underwriting result 6 (19) n/m (45) (18) n/m Net investment income % % Operating result (EBIT) % (13%) Group net income % (13%) Return on investment (annualised) Combined ratio* 100% 104% 4.3% 3.1% +1.2%pts 4.5% 3.1% +1.4%pts FY2013: 101% 117% 87% 88% 81% 84% 98% 61% 69% 6M 2014: 99% 109% 81% 19% 20% 18% 26% 19% 27% Q Q Q Q Q Q Expense ratio Loss ratio *incl. net interest income on funds withheld and contract deposits Note: numbers adjusted on the basis of IAS8 Comments Top-line in Q with catch-up effects, growing 10.4% y/y; 6M GWP +4.1% (curr.-adj: +5.2%), well in line with the segment s mid-term growth target Main growth contribution resulting from international activities, mainly in Western Europe Increase of self-retention to above 50% in 6M 2014 (6M 2013: 47.8%) Positive IAS8 EBIT adjustment in Q ( +45m), offset by charges against 2013 earnings and equity 6M 2014 combined ratio strongly impacted by Ela ( 20m) as well as by significant man-made large losses ( 105m); total combined ratio impact: 13.5%pts; close to 2/3 of the man-made large losses materialised in June M 2014 result burdened by a significant accumulation of man-made losses 10
11 II Segments Retail Germany P&L for Retail Germany m, IFRS 6M M 2013 Δ Q Q Δ Gross written premium 3,563 3,623 (2%) 1,536 1,510 +2% of which Life 2,536 2,585 (2%) 1,317 1,307 +1% of which Non-Life 1,027 1,038 (1%) % Net premium earned 2,613 2,663 (2%) 1,326 1,340 (1%) Net underwriting result (808) (733) n/m (378) (436) n/m of which Life (801) (734) n/m (371) (420) n/m of which Non-Life (7) 1 n/m (7) (16) n/m Net investment income % (10%) Operating result (EBIT) % % Group net income % % Return on investment (annualised) Combined ratio* 4.4% 4.3% +0.1%pts 4.0% 4.7% (0.7%)pts FY2013: 102% 6M 2014: 101% 95% 105% 105% 105% 100% 102% 59% 69% 76% 64% 67% 70% 36% 35% 29% 41% 33% 32% Q Q Q Q Q Q Expense ratio Loss ratio *incl. net interest income on funds withheld and contract deposits Comments Premium decline stopped in Q2 thanks to slight growth in Life business and 8% y/y growth in Non- Life Large losses of 20m from storm Ela in June 2014 affect 6M combined ratio by ~3%pts Cost ratio in 6M 2014 declined by 3.0%pts. to 32.8% y/y Slight improvement in 6M RoI to 4.4% (6M 2013: 4.3%) ~50% of anticipated 2014 ZZR allocation booked (forecast of ~ 308m for FY2014; FY 2013: 313m, both according to HGB). Total ZZR stock expected to rise to slightly above the 1bn-level until year-end 2014 Sound profit contribution, also resulting from improved ordinary capital gains 11


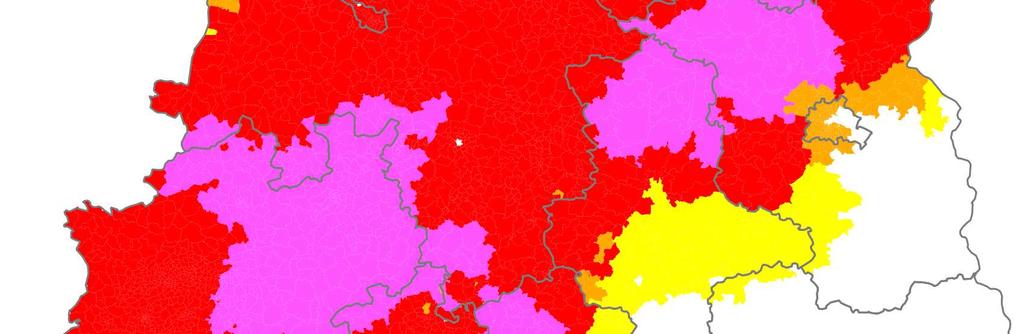
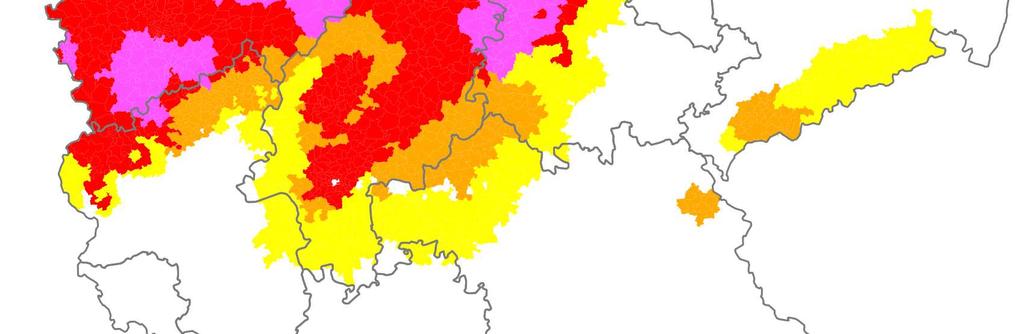

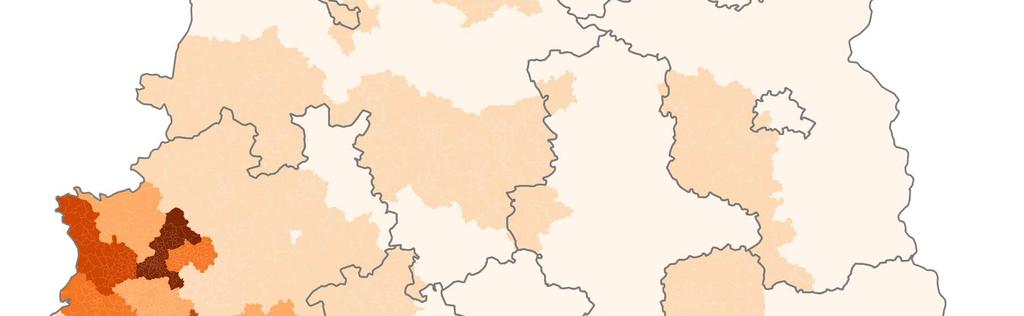


12 II Segments Retail Germany Storm Ela : Regional exposure of Retail Germany Source: Perils AG, Talanx Nat Cat Survey 2014 (basis: ) Storm Ela hit areas where Retail Germany is most exposed 12
13 II Segments Retail International P&L for Retail International m, IFRS 6M M 2013 Change Q Q Change Gross written premium 2,255 2,151 +5% 1,091 1,095 (0%) of which Life % % of which Non-Life 1,428 1,439 (1%) (1%) Net premium earned 1,912 1,748 +9% % Net underwriting result (18%) 6 (0) n/m of which Life (40) (42) n/m (21) (25) n/m of which Non-Life (10%) % Net investment income % % Operating result (EBIT) % % Group net income % % Return on investment (annualised) Combined ratio* 4.8% 5.1% (0.3%)pts 4.8% 4.9% (0.1%)pts FY2013: 96% 6M 2014: 95% 94% 96% 98% 96% 95% 96% 67% 67% 67% 64% 65% 65% 27% 29% 30% 32% 30% 30% Q Q Q Q Q Q Expense ratio Loss ratio *incl. net interest income on funds withheld and contract deposits Comments 6M 2014 top-line growth of 5% burdened by currency effects (currency-adj.:+10.7%). Q was flat Significant GWP improvement in Brazil, gaining further momentum in Q Life-wise, strong single-premium business in Italy continues, while lower momentum in Poland 6M 2014 combined ratio slightly up by 0.4%pts due to initial consolidation effects. Adj. combined ratio improved by 1%pt to 95.6% Ordinary investment income benefits from higher interest rates in Brazil, slightly compensated by interest rate decline in Poland Turkey continues positive trend in Q (6M 2014 EBIT: 1.5m) Retail International delivering another strong quarter - Turkey continues its positive trend 13
14 II Segments Non-Life Reinsurance P&L for Non-Life Reinsurance Comments m, IFRS 6M M 2013 Change Q Q Change Gross written premium 4,078 4,097 (0%) 1,970 1,899 +4% Net premium earned 3,370 3,404 (1%) 1,739 1,712 +2% Net underwriting result (18%) (25%) Net investment income % % Operating result (EBIT) (6%) (18%) Group net income (0%) (20%) Return on investment (annualised) Combined ratio * 3.2% 3.0% +0.3%pts 3.1% 2.8% +0.3%pts FY2013: 95% 6M 2014: 95% 94% 94% 97% 95% 95% 96% 69% 69% 72% 72% 69% 70% 26% 26% 25% 23% 26% 26% Q Q Q Q Q Q Expense ratio Loss ratio * incl. net interest income on funds withheld and contract deposits 1 EBIT margins reflect a Talanx Group view Pleasing underwriting result in a competitive market environment 6M 2014 GWP slightly down by -0.5% y/y (adj. for currency effects: +2.0%) with growth effects mainly from Southeast Asia and China. NPE -1.0% y/y (curr.-adj.:+1.6%) Large losses of 105m (3.1% of NPE) below budget ( 276m for 6M 2014) Conservative loss reserving policy maintained in particular for the large loss budget Net investvent income increased mainly due to normalised results from inflation swaps Other income/expenses in line with expectations; not impacted by positive currency effects as in 2013 EBIT margin 1 of 15.8% (6M 2013: 16.6%) is well above target 14
15 II Segments Life/Health Reinsurance P&L for Life/Health Reinsurance m, IFRS 6M M 2013 Change Q Q Change Gross written premium 2,987 3,130 (5%) 1,470 1,570 (6%) Net premium earned 2,469 2,787 (11%) 1,188 1,398 (15%) Net underwriting result (147) (172) n/m (60) (104) n/m Net investment income (5%) (4%) Operating result (EBIT) % % Group net income % % Return on investment 4.0% 4.1% (0.1%)pts 4.0% 3.9% +0.1%pts EBIT ( m) Q Q Q Q Q Q EBIT and EBIT margin reflect a Talanx Group view Comments 6M GWP: -1.8% on curr.-adj. level, mainly due to reduced premiums from enhanced annuities business, single large transactions, run-off of US mortality block (ING); increased volume from UK-BAT Technical result benefited mainly from improved result in US mortality Net investment income at expected level, minor impact from ModCo derivatives Other income improved mainly due to reduced collateral cost for our US business Strong increase in EBIT 1 by ~17%. EBIT margins 1 in financial solutions/longevity business as well as in mortality and morbidity business ahead of targets Significantly improved result in Life/Health Reinsurance 15
16 Agenda I II III IV Group Highlights Segments Investments / Capital Outlook Appendix Mid-term Target Matrix 6M 2014 Additional Information 16
17 III Investments Breakdown of investment portfolio Asset allocation as of 30 June % Other Equities 9% 90% Fixed income securities Total: 90.3bn Fixed-income-portfolio split Breakdown by type Other 28% 33% Covered bonds Corporate bonds Government bonds 2% Total: 81.3bn Breakdown by rating 19% 24% 25% 37% 33% BBB and below A AA AAA Comments Fixed-income securities continue to dominate the investment portfolio (portfolio share Q2 2014: 90%; 2013: 91%); just 1% invested in equities 81% (FY2013: 81%) of fixedincome portfolio invested in A or higher-rated bonds 16% of investments under own management are held in USD, 29% overall in non-euro currencies Slight increase in GIIPS sovereign exposure to 1.8% of total assets (from 1.7% in Q1 2014) Investments under own management up by +5% y/y Prudent investment style remains unchanged 17
18 III Net investment income Net investment income Talanx Group m, IFRS 6M M 2013 Change Q Q Change Ordinary investment income "thereof current investment income from interest" "thereof profit/loss from shares in associated companies" Realised net gains on investments "Write-ups/write-downs on investments" "Unrealised net gains/losses on investments" 1,554 1,553 +0% (0%) 1,438 1,435 +0% (0%) 6 6 0% 2 5 (60%) (5%) (62%) (16) (36) n/m (7) (22) n/m 41 (47) n/m 25 (51) n/m Investment expenses (102) (93) +10% (48) (50) (4%) "Income from investments under own management" Income from investment contracts "Interest income on funds withheld and contract deposits" 1,781 1,697 +5% (6%) 2 4 (37%) % (6%) (7%) Total 1,948 1,877 +4% 938 1,002 (6%) Comments Ordinary investment income virtually unchanged vs 6M 2013 despite further drop in interest rates, supported by higher asset base Realised net gains of 304m - mainly used to finance the ZZR charge slightly below the level of 6M 2013 (containing ~ 70m capital gain from SwissLife transaction). Significantly lower realised gains in Q vs. Q Solid return on investment of 4.0% in 6M 2014 (6M 2013: 4.0%) Unrealised gains helped by contribution from reinsurance derivatives: in Q2 2014: ModCo 3m (Q2 2013: - 5m) and inflation swaps 6m (- 38m); in 6M 2014: ModCo: 5m (6M 2013: 1m); inflation swap 5m ( -40m) 6M 2014 RoI of 4.0% unchanged vs. 6M despite 2013 SwissLife disposal effect 18
19 III Equity and capitalization Solid equity base Optimized capital structure Capital breakdown ( bn) Mar June Sep Dec Mar June 14 Shareholders equity Minorities Subordinated liabilities Shareholders equity is up by 1.4% vs. Q and flat vs. FY2013. Effects of dividend payment (~ 300m) were overcompensated by net earnings. OCI effects from rates and currencies add an additional 382m Goodwill stands at 1,109m. When deducting non-controlling interests, the amount reduces to 1,102m Book value per share stands at 30.24, while NAV 1 per share is at the end of June 2014 Both figures do not contain off-balance sheet reserves. After the recent decline in interest rates, these amount to ~4.3bn (see next page), or 1.59 per share (shareholder share only) 1 NAV calculated as shareholders equity minus shareholder share in goodwill Note: Figures adjusted due to IAS8 Shareholders equity up by ~ 320m vs. FY2013 based on strong earnings and OCI effects 19
20 III Equity and capitalization Unrealised gains Unrealised gains and losses (off and on balance sheet) as of 30 June 2014 ( m) 3, ,741 8,082 4, (324) 4,340 Loans and receivables Held to maturity Investment property Real estate own use Subordinated loans Off balance sheet reserves Available for sale Other assets On balance sheet reserves Total Total unrealised gains (losses) 31 Dec 13 2, (250) 2,867 1, ,940 4,808 market value vs. book value Talanx s off-balance sheet reserves significantly up by ~ 1.5bn since FY2013 ( 2.9bn) 20
21 Agenda I II III IV Group Highlights Segments Investments / Capital Outlook Appendix Mid-term Target Matrix 6M 2014 Additional Information 21
22 IV Outlook for Talanx Group ,3 Gross written premium % Return on investment 3.4% Group net income 700m Return on equity ~ 10% Dividend payout ratio 35-45% target range net income outlook with implied capacity to bear in sum another ~ 650m of large losses in H On divisional level, Talanx expects gross written premium growth of +3-5% in Industrial Lines, -(1-2)% in Retail Germany, +4-8% in Retail International and a flat to low single-digit growth rate in Reinsurance 3 The outlook is subject to a thorough assessment of the Life Insurance Reform Act ( LIRA ) impact on German retail activities Targets are subject to no large losses exceeding budget (cat), no turbulences on capital markets (capital), and no material currency fluctuations (currency) 22
23 Agenda I II III IV Group Highlights Segments Investments / Capital Outlook Appendix Mid-term Target Matrix 6M 2014 Additional Information 23
24 Mid-term Target Matrix Segments Key figures Strategic targets Group Industrial Lines Retail Germany Retail International Non-life reinsurance Life & health reinsurance Return on equity 750 bps above risk free 1 Group net income growth ~ 10% Dividend payout ratio 35-45% Return on investment 2 3.5% Gross premium growth 3 3-5% Combined ratio 96% EBIT margin 4 10% Retention rate 60-65% Gross premium growth 0% Combined ratio (non-life) 97% New business margin (life) 2% EBIT margin 4 4.5% Gross premium growth 3 10% Combined ratio (non-life) 96% Value of New Business (VNB) growth 5-10% EBIT margin 4 5% Gross premium growth 3-5% Combined ratio 96% EBIT margin 4 10% Gross premium growth 3 5-7% Value of New Business (VNB) growth 10% EBIT margin 4 financing and longevity business 2% EBIT margin 4 mortality and health business 6% 1 Risk-free rate is defined as the 5-year rolling average of the 10-year German government bond yield 2 Derived from actual asset duration. Currently ~ 6.5 years, therefore the minimum return is the 13-year average of 13-year German government bond yield. Annually rolling 3 Organic growth only; currency neutral 4 EBIT/net premium earned Note: growth targets are on p.a. basis. They are based on 2012 results. 24
25 6M 2014 Additional Information - Segments Industrial Lines Retail Germany Retail International m, IFRS 6M M 2013 Change P&L Gross written premium 2,497 2,399 +4% Net premium earned % Net underwriting result 6 (19) n/m Net investment income % Operating result (EBIT) % Net income after minorities % Key ratios Combined ratio non-life insurance and reinsurance 99.4% 102.1% (2.7%)pts Return on investment 4.3% 3.1% 1.2%pts 6M M 2013 Change 3,563 3,623 (2%) 2,613 2,663 (2%) (808) (732) n/m % % % 101.2% 99.9% 1.3%pts 4.4% 4.3% 0.1%pts 6M M 2013 Change 2,255 2,151 +5% 1,912 1,748 +9% (18%) % % % 95.3% 94.9% 0.4%pts 4.8% 5.1% (0.3%)pts Note: Differences due to rounding may occur. 25
26 6M 2014 Additional Information - Segments (continued) m, IFRS 6M M 2013 Change P&L Gross written premium 4,078 4,097 (0%) Net premium earned 3,370 3,404 (1%) Net underwriting result (18%) Net investment income % Operating result (EBIT) (6%) Net income after minorities (0%) Key ratios Combined ratio non-life insurance and reinsurance Non-Life Reinsurance 95.1% 94.2% 0.9%pts Return on investment 3.2% 3.0% 0.2%pts Life and Health Reinsurance 6M M 2013 Change 2,987 3,130 (5%) 2,469 2,787 (11%) (147) (172) n/m (5%) % % % 4.1% (0.1%)pts Group 6M M 2013 Change 14,975 14,966 +0% 11,308 11,498 (2%) (775) (716) n/m 1,948 1,877 +4% 1,005 1,032 (3%) (7%) 96.4% 96.1% 0.3%pts 4.2% 4.0% 0.0%pts Note: Differences due to rounding may occur. 26
27 6M 2014 Additional Information GWP of main risk carriers Retail Germany GWP, m, IFRS 6M M 2013 Change Retail International GWP, m, IFRS 6M M 2013 Change Non-life Insurance 1,027 1,038 (1%) HDI Versicherung AG (1%) Life Insurance 2,536 2,585 (2%) HDI Lebensversicherung AG 1,084 1,101 (2%) neue leben Lebensversicherung AG (8%) TARGO Lebensversicherung AG % PB Lebensversicherung AG % Total 3,563 3,623 (2%) Non-life Insurance 1,428 1,439 (1%) HDI Seguros S.A., Brazil (4%) TUiR Warta S.A. 3, Poland (1%) TU Europa S.A. 4, Poland % HDI Assicurazioni S. p. A., Italy (P&C) (1%) HDI Seguros S.A. De C.V., Mexico (5%) HDI Sigorta A.Ş., Turkey % Life Insurance % TU Warta Zycie S.A., Poland (31%) TU Europa Zycie 4, Poland (44%) Open Life (13%) 1 Entity results from Sept 2012 merger of HDI Direkt Versicherung AG and HDI-Gerling Firmen und Privat Versicherung AG 2 Talanx ownership 67.5% 3 includes HDI Asekuracja TU S.A., Poland; Talanx ownership of 75.74% 4 Talanx ownership 50% + 1 share; closed on 1 June includes Metropolitana 6 includes HDI-Gerling Zycie, Poland; Talanx ownership of 75.74% HDI Assicurazioni S. p. A., Italy (Life) % Total 2,255 2,151 +5% Numbers for main carriers represent data entry values, fully consolidated 27
28 Q Additional Information Details on GIIPS exposure Total GIIPS exposure (30 June 2014) m Government bonds Corporate bonds GIIPS exposure Sovereign Semi- Sovereign Financial Corporate Covered Other Total Greece Ireland Italy 1, ,354 Portugal Spain ,136 Total 2, , ,235 Details on sovereign exposure in m Total: 2,229m (amortized cost), 2,452m (fair value) Total unrealised gain: 223m Greece Ireland Italy Portugal Spain Amortized cost 1,466 1,322 Fair value Comments Total GIIPS exposure incl. private sector assets at ~4.5% of total assets GIIPS sovereign exposure at 1.8% of total assets (Q2 2013: 0.8%, FY2013: 1.2%) Talanx may top up its sovereign exposure to selected GIIPS government issuers to up to 3% of total assets in the course of 2014 Talanx over time has slightly raised its exposure to Italian and Spanish issuers very selectively, while Ireland and Portugal issuers are slightly reduced Since 31 Dec additional investments of ca. 1.7bn mainly in sovereign ( ~0.9bn) and semisovereign ( ~0.4bn), but also in selected financial and corporate issuers Total unrealised gains increased by ~ 80m since 31 March 2014 Slight increase in GIIPS investments significant increase in unrealised gains 28
29 Group Key quarterly financials Summary Talanx Group (restated numbers) m, IFRS Q Q Q Q FY2013 Q Q Gross written premium 8,458 6,508 6,414 6,771 28,151 8,414 6,561 Net premium earned 5,715 5,783 5,605 6,010 23,113 5,599 5,709 Net underwriting result (252) (464) (513) (391) (1,619) (370) (405) Net investment income 875 1, ,792 1, Operating result (EBIT) , Net income after minorities Key ratios Q Q Q Q FY2013 Q Q Combined ratio non-life insurance and reinsurance 95.1% 97.1% 100.7% 95.3% 97.1% 94.3% 98.4% Return on investment 3.7% 4.2% 4.0% 4.1% 4.0% 4.3% 3.8% Balance sheet Q Q Q Q FY2013 Q Q Investments under own management 86,568 85,670 86,070 86,310 86,310 88,069 90,252 Goodwill 1,149 1,121 1,102 1,105 1,105 1,103 1,109 Total assets 134, , , , , , ,699 Technical provisions 92,340 91,935 92,009 91,717 91,717 95,127 96,829 Shareholders equity 7,339 6,768 6,960 7,184 7,184 7,532 7,645 Numbers for Talanx Group are restated for 2013 and Q according to IAS 8 effect 29
30 Segments Industrial Lines P&L for Industrial Lines (restated numbers) m, IFRS Q Q Q Q FY2013 Q Q Gross written premium 1, ,835 1, Net premium earned , Net underwriting result (1) (18) (74) 51 (43) 50 (45) Net investment income Operating result (EBIT) (20) Group net income (14) Return on investment (annualised) 3.2% 3.1% 3.4% 4.4% 3.6% 4.2% 4.5% Loss Ratio 81.2% 84.3% 98.1% 61.4% 81.8% 69.1% 81.3% Expense Ratio 19.1% 19.7% 18.4% 25.9% 20.6% 18.6% 27.2% Combined Ratio 100.1% 103.9% 116.5% 87.2% 102.4% 87.7% 108.6% Numbers for Industrial Lines are restated for 2013 and Q according to IAS 8 effect 30
31 Disclaimer This presentation contains forward-looking statements which are based on certain assumptions, expectations and opinions of the management of Talanx AG (the "Company") or cited from third-party sources. These statements are, therefore, subject to certain known or unknown risks and uncertainties. A variety of factors, many of which are beyond the Company s control, affect the Company s business activities, business strategy, results, performance and achievements. Should one or more of these factors or risks or uncertainties materialize, actual results, performance or achievements of the Company may vary materially from those expressed or implied as being expected, anticipated, intended, planned, believed, sought, estimated or projected in the relevant forward-looking statement. The Company does not guarantee that the assumptions underlying such forward-looking statements are free from errors nor does the Company accept any responsibility for the the actual occurrence of the forecasted developments. The Company neither intends, nor assumes any obligation, to update or revise these forward-looking statements in light of developments which differ from those anticipated. Where any information and statistics are quoted from any external source, such information or statistics should not be interpreted as having been adopted or endorsed by the Company as being accurate. Presentations of the company usually contain supplemental financial measures (e.g., return on investment, return on equity, gross/net combined ratios, solvency ratios) which the Company believes to be useful performance measures but which are not recognised as measures under International Financial Reporting Standards, as adopted by the European Union ("IFRS"). Therefore, such measures should be viewed as supplemental to, but not as substitute for, balance sheet, statement of income or cash flow statement data determined in accordance with IFRS. Since not all companies define such measures in the same way, the respective measures may not be comparable to similarly-titled measures used by other companies. This presentation is dated as of 14 August Neither the delivery of this presentation nor any further discussions of the Company with any of the recipients shall, under any circumstances, create any implication that there has been no change in the affairs of the Company since such date. This material is being delivered in conjunction with an oral presentation by the Company and should not be taken out of context. 31
Results Presentation FY March Herbert K. Haas, CEO Dr. Immo Querner, CFO
 Results Presentation FY2013 24 March 2014 Herbert K. Haas, CEO Dr. Immo Querner, CFO Agenda I Group Highlights II Segments III Investments / Capital IV Outlook Appendix 2 I FY2013 Robust results Talanx
Results Presentation Q May Herbert K. Haas, CEO Dr. Immo Querner, CFO
 Results Presentation Q1 2014 15 May 2014 Herbert K. Haas, CEO Dr. Immo Querner, CFO Agenda I II III IV V Group Highlights Segments Investments / Capital Essentials Risk Management Reports 2013 Outlook
9M 2018 Results 12 November Torsten Leue, CEO Dr. Immo Querner, CFO
 2018 Results 12 November 2018 Torsten Leue, CEO Dr. Immo Querner, CFO All segments except Industrial Lines contribute to significantly higher operating result EBIT (+33%) and Group net income (+10%) well
6M 2017 Results 14 August Herbert K. Haas, CEO Dr. Immo Querner, CFO
 2017 Results 14 August 2017 Herbert K. Haas, CEO Dr. Immo Querner, CFO Key essentials: 2017 results significantly up triggering the increase in FY Outlook 2017 Group net income up 15% y/y to EUR 463m all
Q Results 11 May Torsten Leue, CEO Dr. Immo Querner, CFO
 2018 Results 11 May 2018 Torsten Leue, CEO Dr. Immo Querner, CFO Overall good underpins FY2018 Group net income Outlook of ~EUR 850m Retail International and Reinsurance with strong start into the new
6M 2018 Results 13 August Torsten Leue, CEO Dr. Immo Querner, CFO
 2018 Results 13 August 2018 Torsten Leue, CEO Dr. Immo Querner, CFO Talanx well on track to achieve Group net income Outlook of ~EUR 850m Strong EBIT growth supported by the Group s improved combined ratio
FY2016 Results 20 March Herbert K. Haas, CEO Dr. Immo Querner, CFO
 FY206 Results 20 March 207 Herbert K. Haas, CEO Dr. Immo Querner, CFO Agenda I II III IV A Group Highlights Segments Investments / Capital Outlook Appendix Mid-term Target Matrix Additional Information
Q Results 15 May Herbert K. Haas, CEO Dr. Immo Querner, CFO
 Q1 2017 Results 15 May 2017 Herbert K. Haas, CEO Dr. Immo Querner, CFO Agenda I II III IV A Group Highlights Segments Investments / Capital Outlook Appendix Mid-term Target Matrix Additional Information
Q Results 11 May Torsten Leue, CEO Dr. Immo Querner, CFO
 2018 Results 11 May 2018 Torsten Leue, CEO Dr. Immo Querner, CFO Overall good underpins FY2018 Group net income Outlook of ~EUR 850m Retail International and Reinsurance with strong start into the new
Conference Call on Q1/2018 results
 Conference Call on Q1/2018 results Hannover, 7 May 2018 Favourable start to 2018 EBIT increase of +8.5% outperforms NPE growth GWP 4,547 in m. NPE in m. EBIT in m. Group net income in m. 5,345 +17.6% 3,738
Conference Call on Interim Report 3/2017
 Conference Call on Interim Report 3/2017 Hannover, 8 November 2017 Q3 losses absorbed within quarterly earnings Positive Q3 result supported by sale of listed equities Group Gross written premium: EUR
Warburg German Ideas Day. Dr. Immo Querner, CFO 19 November 2014
 Warburg German Ideas Day Dr. Immo Querner, CFO 19 November 2014 Talanx - Key Investment Highlights Global insurance group with leading market positions and strong German roots Leading and successful B2B
Press Conference. Annual Results Hannover, 7 March 2019
 Press Conference Annual Results 2018 Hannover, 7 March 2019 Agenda 1 2 3 4 5 6 7 Group overview Property & Casualty reinsurance Life & Health reinsurance Investments Solvency II reporting as at 31 December
Conference Call on Half-yearly Report 2016
 Conference Call on Half-yearly Report 2016 Hannover, 4 August 2016 Half-year results in line with full-year targets...... but Q2/2016 performance weaker than previous quarters Group Gross written premium:
Talanx announces strong nine-month results
 Talanx announces strong nine-month results Operating profit (EBIT) up around 83 percent to EUR 1.3 billion Almost all segments deliver double-digit growth in gross premium Investment income significantly
9M 2017 Results 13 November Herbert K. Haas, CEO Dr. Immo Querner, CFO
 2017 Results 13 November 2017 Herbert K. Haas, CEO Dr. Immo Querner, CFO Talanx achieves 2017 result of EUR 444m despite very significant NatCat losses 2017 Group net income down by ~30% to 444m - Industrial
Berenberg Goldman Sachs German Corporate Conference
 Berenberg Goldman Sachs German Corporate Conference Dr. Immo Querner, CFO Munich, 9 September 206 Founded as a lead insurer by German corporates Group structure History Large German corporates, e.g. Free
Performance and Results
 018 Performance and Results Quarterly Statement as at 31 March 2018 THE TALANX GROUP AT A GLANCE Group key figures Unit 2018 2017 +/ 2018 to 2017 Gross written premiums 10,560 9,752 +8.3 by region Germany
Investor Presentation July 2017
 Investor Presentation July 207 Founded as a lead insurer by German corporates Group structure History Large German corporates, e.g. Free float 2.0% Industrial Lines Retail Germany (P/C and Life) V.a.G.
Hannover Re's Analysts' Conference
 Hannover Re's Analysts' Conference Annual Results 2018 London, 7 March 2019 Agenda 1 2 3 4 5 6 7 Group overview Property & Casualty reinsurance Life & Health reinsurance Investments Solvency II reporting
Quarterly statement as at 31 March 2017
 http://www.presentationworks.de Image: Getty Images/fStop 9 May 2017 Jörg Schneider Agenda 1 Munich Re (Group) 2 3 Reinsurance 12 2 ERGO 8 4 Outlook 17 2 Munich Re (Group) Financial highlights Q1 2017
Goldman Sachs European Financials Conference. Dr Immo Querner, CFO Madrid, 10 June 2014
 Goldman Sachs European Financials Conference Dr Immo Querner, CFO Madrid, 0 June 04 Talanx - Key Investment Highlights Global insurance group with leading market positions and strong German roots Leading
Dr. Kalliwoda Capital Markets Conference. Marcus Sander, IR Warsaw, 15 January 2015
 Dr. Kalliwoda Capital Markets Conference Marcus Sander, IR Warsaw, 5 January 205 Founded as a lead insurer by German corporates Group structure History Large German corporates, e.g. Free float V.a.G. German
FY2017 Results 19 March Herbert K. Haas, CEO Dr. Immo Querner, CFO
 2017 Results 19 March 2018 Herbert K. Haas, CEO Dr. Immo Querner, CFO Talanx with very satisfying 2017 Group results given the significant NatCat losses dividend increase proposed 2017 Group net income
ABN AMRO Insurance meets Capital
 ABN AMRO Insurance meets Capital Alik Hertel, Head of Group Treasury Marcus Sander, Senior Investor Relations Manager Amsterdam, 9 April 207 Founded as a lead insurer by German corporates Group structure
Welcome to Hannover Re's Analysts' Conference
 Welcome to Hannover Re's Analysts' Conference Frankfurt/London, 15 March 2012 Group Non-life reinsurance Life and health reinsurance Investments Outlook 2012 Appendix Strong financial performance with
Roadshow Vienna. Carsten Werle, IR Marcus Sander, IR Vienna, 26 November 2013
 Roadshow Vienna Carsten Werle, IR Marcus Sander, IR Vienna, 6 November 03 Talanx Strong roots, dynamic growth Where are we coming from? Where do we stand today? 3 What is special about us and what makes
performance and results
 018 performance and results Quarterly Statement as at 30 September 2018 The Talanx Group at a glance Group key figures unit 6M 2018 Q3 2018 2018 6M 2017 Q3 2017 2017 +/ % 2018 v. 2017 Gross written premiums
Quarterly statement as at 31 March 2018
 http://www.presentationworks.de Image: Getty Images/Oaltindag 8 May 2018 Jörg Schneider Agenda 1 Munich Re (Group) 2 4 Outlook 20 2 ERGO 7 5 Backup 22 3 Reinsurance 13 2 Munich Re (Group) Financial highlights
Welcome to Hannover Re's Analysts' Conference. Annual Results 2017
 Welcome to Hannover Re's Analysts' Conference Annual Results 2017 Frankfurt, 13 March 2018 Satisfactory result despite exceptionally high NatCat losses RoE at 10.9% exceeds target GWP 16,354 in m. NPE
Quarterly statement as at 30 September 2017
 Image: Getty Images/fStop 9 November Agenda 1 Munich Re (Group) 2 3 Reinsurance 11 2 ERGO 7 4 Outlook 15 2 Munich Re (Group) Financial highlights Nat cats dominate Capitalisation remains strong Munich
Quarterly statement as at 30 September 2017
 Image: Getty Images/fStop 9 November Jörg Schneider Agenda 1 Munich Re (Group) 2 5 Backup 19 2 ERGO 7 3 Reinsurance 13 4 Outlook 17 2 Munich Re (Group) Financial highlights Nat cats dominate Capitalisation
Quarterly statement as at 31 March 2018
 http://www.presentationworks.de Image: Getty Images/Oaltindag 8 May 2018 Jörg Schneider Agenda 1 Munich Re (Group) 2 3 Reinsurance 11 2 ERGO 7 4 Outlook 16 2 Munich Re (Group) Financial highlights Q1 2018
Deutsche Bank German, Swiss & Austrian Conference. Dr. Immo Querner 18 June 2015
 Deutsche Bank German, Swiss & Austrian Conference Dr. Immo Querner 8 June 205 Founded as a lead insurer by German corporates Group structure History Large German corporates, e.g. Free float V.a.G. German
Morgan Stanley European Financials Conference. Herbert K. Haas 24 March 2015
 Morgan Stanley European Financials Conference Herbert K. Haas 24 March 205 Founded as a lead insurer by German corporates Group structure History Large German corporates, e.g. Free float V.a.G. German
Preliminary key figures 2017 and January renewals
 Image: Getty Images/fStop 6 February 2018 Jörg Schneider Munich Re (Group) Financial highlights 2017 Dividend stable at 8.60 per share 1, despite nat cat losses Price and volume increase in January renewals
Preliminary financial statements as at 31 December 2016
 plainpicture/fstop/ralf Hiemisch 7 February 2017 Jörg Schneider Munich Re (Group) Financial highlights 2016 2016 net result of 2.6bn meets annual guidance Increased dividend of 8.60 per share 1 Munich
Roadshow Vienna. Marcus Sander, CFA, Senior Investor Relations Manager 6 September 2017
 Roadshow Vienna Marcus Sander, CFA, Senior Investor Relations Manager 6 September 2017 Founded as a lead insurer by German corporates Group structure History Large German corporates, e.g. German Mittelstand
The directors of Talanx acknowledge their responsibility for the preparation of this disclosure document.
 MCEV Market Consistent Embedded Value Report 2014 Content 1 Introduction 1 Covered business 2 Definition 3 Results 3 Market Consistent Embedded Value 4 New Business Value 6 Analysis of Market Consistent
Talanx satisfied with the first quarter
 Talanx satisfied with the first quarter Gross written premium after three months: EUR 8.4 (8.5) billion EBIT: EUR 509 (530) million Good Group net income of EUR 192 (208) million Outlook for the full year
Talanx achieves nine-month net income of EUR 444 million despite severe impact of natural catastrophes
 Talanx achieves nine-month net income of EUR 444 million despite severe impact of natural catastrophes Gross written premiums up by 6.3 percent to EUR 25.2 (23.7) billion Industrial Lines and Property/Casualty
Investor Conferences. Dr Immo Querner, CFO Munich, 24/25 September 2018
 Investor Conferences Dr Immo Querner, CFO Munich, 24/25 September 2018 Founded as a lead insurer by German corporates Group structure Large German corporates, e.g. Free float 21.0% 1 Industrial Lines Retail
Talanx increases its net income for the first half of the year and raises its outlook
 Talanx increases its net income for the first half of the year and raises its outlook Gross written premiums increase by 6.9 percent to EUR 17.6 (16.4) billion Net return on investment at 3.7 percent Low
Half Year Earnings Press conference August 2, 2018
 Half Year Earnings 2018 Press conference August 2, 2018 IMPORTANT LEGAL INFORMATION AND CAUTIONARY STATEMENTS CONCERNING FORWARD-LOOKING STATEMENTS Certain statements contained herein may be forward-looking
Bank of America Merrill Lynch Conference. Herbert K. Haas, CEO / Torsten Leue, CEO Talanx International London, 26 September 2017
 Bank of America Merrill Lynch Conference Herbert K. Haas, CEO / Torsten Leue, CEO Talanx International London, 26 September 2017 Founded as a lead insurer by German corporates Group structure Large German
Rising dividend after good result Preliminary financial statements as at 31 December 2014
 Rising dividend after good result 5 February 205 Jörg Schneider Munich Re (Group) Financial highlights Q4 204 Good annual profit of 3.2bn Dividend increasing to 7.75 per share Munich Re (Group) Q4 204
Market Consistent Embedded Value Report 2016
 Market Consistent Embedded Value Report 2016 Allianz Group Market Consistent Embedded Value Report CONTENT Introduction 2 1.1 Basis of preparation 2 1.2 Covered business 2 Overview of results 3 2.1 Introduction
Analysts conference call 8 May 2007
 8 May 2007 First Quarter 2007 results Today s agenda Introduction Susan Holliday, Head IR Group results George Quinn, CFO Q&A George Quinn, CFO Slide 2 First Quarter 2007 results Executive summary Performance
Roadshow Munich / Edinburgh / Dublin. Herbert K. Haas, CEO 8-10 July 2013
 Roadshow Munich / Edinburgh / Dublin Herbert K. Haas, CEO 8-0 July 03 Talanx the new kid on the block Where are we coming from? Where do we stand today? 3 What is special about us and what makes us different
GROUPAMA GROUP FULL YEAR 2017 RESULTS PRESENTATION. Analysts Conference Call 16 March 2018
 FULL YEAR 2017 PRESENTATION Analysts Conference Call 16 March 2018 Key messages SIGNIFICANT INCREASE IN THE OPERATING INCOME Premium income 13.8bn Increase of premium income (+2.9%) in both Property &
Talanx Strategy Frankfurt, 23 October Torsten Leue, CEO
 Talanx Strategy Frankfurt, 23 October 2018 Torsten Leue, CEO Key messages We commit to an increased RoE of 800 bps above risk-free an annual EPS-growth 5% on average 35% to 45 % payout of IFRS earnings
Half Year 2013 Earnings
 Half Year 2013 Earnings August 2, 2013 Presentation Table of contents Introduction & highlights Page A4 by Henri de Castries, Chairman and CEO financial performance by Denis Duverne, Deputy CEO & Gérald
Press Release 06 November 2013 N
 (p.1/6) SCOR delivers a strong performance for the first nine months of 2013, recording net income of EUR 302 million In the first nine months of 2013, SCOR records strong results and good progress towards
Roadshow. Alik Hertel, Head of Group Treasury Marcus Sander, Senior Investor Relations Manager London, 5/6 February 2018
 Roadshow Alik Hertel, Head of Group Treasury Marcus Sander, Senior Investor Relations Manager London, 5/6 February 2018 Founded as a lead insurer by German corporates Group structure Large German corporates,
AXA HALF YEAR 2016 EARNINGS. Presentation. August 3, 2016
 AXA HALF YEAR 2016 EARNINGS Presentation August 3, 2016 Certain statements contained herein are forward-looking statements including, but not limited to, statements that are predictions of or indicate
The directors of Talanx acknowledge their responsibility for the preparation of this disclosure document.
 Market Consistent Embedded Value Report 2013 Content 1 Introduction 1 Covered business 2 Definition 3 Results 3 Market Consistent Embedded Value 3 New Business Value 5 Analysis of Market Consistent Embedded
Group financial results 1Q 2014
 Group financial results 1Q 2014 Dieter Wemmer Chief Financial Officer Journalists conference call May 14, 2014 1 Group financial results 1Q 2014 1 Highlights 2 Additional information a) Group b) Property-Casualty
Half Year 2017 Earnings presentation. August 3, 2017
 Half Year 2017 Earnings presentation August 3, 2017 IMPORTANT LEGAL INFORMATION AND CAUTIONARY STATEMENTS CONCERNING FORWARD-LOOKING STATEMENTS Certain statements contained herein may be forward-looking
In good shape. Clement B. Booth Member of the Board of Management. Morgan Stanley European Financials conference March 27th, 2012
 In good shape Clement B. Booth Member of the Board of Management Morgan Stanley European Financials conference March 27th, 2012 A 1 2 3 2011 assessment Strategic priorities 2012 Sovereign debt crisis Business
Content. 03 Overview of results. 17 Regional analysis of embedded value. 54 Independent Opinion Basis of preparation 02 1.
 Market Consistent Embedded Value Report 2012 Content 02 Introduction 02 1.1 Basis of preparation 02 1.2 Covered business 03 Overview of results 03 2.1 Embedded value results 04 2.2 New business 06 2.3
Talanx. The New Standard in Insurance and Investments.
 Talanx. The New Standard in Insurance and Investments. About Talanx About Talanx Anyone who wants to make the big leap ahead needs a decisive personality and focus. They should assess the risk, have an
Investments. Maximilian Zimmerer Member of the Board of Management Allianz SE. Analyst conference call February 19, 2016
 Investments Maximilian Zimmerer Member of the Board of Management Allianz SE Analyst conference call February 19, 2016 C Investments 1 Allianz Investment Management 2015 2 Portfolio information High quality
Thomas Buberl Group CEO, AXA. Bank of America Merrill Lynch Conference London September 27, 2018
 Thomas Buberl Group CEO, AXA Bank of America Merrill Lynch Conference London September 27, 2018 IMPORTANT LEGAL INFORMATION AND CAUTIONARY STATEMENTS CONCERNING FORWARD-LOOKING STATEMENTS Certain statements
HDI Group (regulatory view)
") HDI Group Solvency and Financial Condition Report 2017 AT A GLANCE The HDI Group uses an approved partial internal model and shows a very strong capitalisation. The HDI Group s so-called risk kernel the
HDI Group Solvency and Financial Condition Report 2017 AT A GLANCE The HDI Group uses an approved partial internal model and shows a very strong capitalisation. The HDI Group s so-called risk kernel the
Preliminary key figures 2018 and January renewals
 Image: Getty Images/Oaltindag Preliminary key figures 2018 and January renewals 6 February 2019 Christoph Jurecka Torsten Jeworrek Munich Re (Group) Financial highlights 2018 Pleasing net income fully
Results Reporting for the Three Months to March 31, 2009
 Results Reporting for the Three Months to March 3, 2009 Analysts and Media Presentation Disclaimer and cautionary statement By participating in this conference call you agree to be bound by the following
Full Year 2017 Earnings. Press Conference February 22, 2018
 Full Year 2017 Earnings Press Conference February 22, 2018 IMPORTANT LEGAL INFORMATION AND CAUTIONARY STATEMENTS CONCERNING FORWARD-LOOKING STATEMENTS Certain statements contained herein may be forward-looking
Half-year financial report as at 30 June 2018
 Image: Getty Images/Oaltindag 8 August 2018 Agenda 1 Executing business opportunities 2 3 ERGO 14 2 Munich Re (Group) 9 4 Reinsurance 20 5 Backup 26 2 Executing business opportunities Strategic priorities
Half Year 2014 Earnings
 Half Year 2014 Earnings August 1, 2014 Presentation Cautionary note concerning forward-looking statements Certain statements contained herein may be forward-looking statements including, but not limited
UNIQA Versicherungen AG. Group Embedded Value 2008
 UNIQA Versicherungen AG Group Embedded Value 2008 Supplementary information on Group Embedded Value results for 2008 Table of Contents 1. INTRODUCTION... 3 2. SUMMARY OF 2008 RESULTS... 4 2.1 GROUP EMBEDDED
UniCredit Kepler Cheuvreux German Corporate Conference. Dr. Immo Querner, CFO Frankfurt, 16 January 2018
 UniCredit Kepler Cheuvreux German Corporate Conference Dr. Immo Querner, CFO Frankfurt, 16 January 2018 Founded as a lead insurer by German corporates Group structure Large German corporates, e.g. Free
Investor Presentation January 2016
 Investor Presentation January 206 Founded as a lead insurer by German corporates Group structure History Large German corporates, e.g. Free float 2.0% Industrial Lines Retail Germany V.a.G. 79.0% German
GROUPAMA GROUP FULL YEAR 2016 RESULTS PRESENTATION. Analysts Conference Call 17 March 2017
 FULL YEAR 2016 PRESENTATION Analysts Conference Call 17 March 2017 Introduction GROUPAMA GROUP AS AT 31/12/2016 Strategy driven by profitable growth in a difficult environment: operating efficiency, controlled
QUARTERLY FINANCIAL STATEMENTS AS AT 30 JUNE 2011
 QUARTERLY FINANCIAL STATEMENTS AS AT 30 JUNE 2011 Telephone conference with analysts and investors 4 August 2011 Agenda Overview 2 Financial reporting 2011 Munich Re (Group) 6 Primary insurance 12 Munich
September 2018 Financial results
 September 2018 Financial results Analyst and investor presentation November 8 th, 2018 Key Figures > 9M 2018 9M 2018 Δ Δ (constant exchange rates) Revenue 20,297-4.7% 1.4% Total written and accepted premiums
Preliminary key figures 2017 and January renewals
 Image: Getty Images/fStop 6 February 2018 Jörg Schneider Munich Re (Group) Financial highlights 2017 Dividend stable at 8.60 per share 1, despite nat cat losses Price and volume increase in January renewals
Munich Re Group. Quarterly financial statements as at Changing Gear A first interim status report. Media conference
 Munich Re Group Quarterly financial statements as at 30.6.2007 A first interim status report Media conference Lothar Meyer Jörg Schneider 6 August 2007 Agenda 3 10 years of ERGO Excellently positioned
Genworth Mortgage Insurance Australia
 Genworth Mortgage Insurance Australia 1Q 2016 Financial results presentation 29 April 2016 2016 Genworth Mortgage Insurance Australia Limited. All rights reserved. Disclaimer This presentation contains
12M 2013 Financial results
 12M 2013 Financial results Financial analysts meeting February 13, 2014 1 1 Highlights 2 Commercial & Risk overview 3 Quarterly results 4 Year-to-date results 5 Shareholders equity & Economic solvency
Profitability & solidity
 Profitability & solidity Group Treasury & Corporate Finance Group Investor Relations Allianz SE Bank of America Merrill Lynch European Credit Conference London, September 2018 Allianz Investor Relations
Balance Sheet Review. Shareholders equity increased by 8.6 bn to 53.6 bn. Strong solvency ratio up by 18 percentage points to 197 %.
 Balance Sheet Review Shareholders equity increased by 8.6 bn to 53.6 bn. Strong solvency ratio up by 18 percentage points to 197 %.1 Shareholders equity 2 Shareholders equity C 057 mn 70,000 + 19.2 % 60,000
Combined ratio improved; Consolidated profit increased to EUR 243.3m
 UNIQA Insurance Group AG FY18 Preliminary Results Combined ratio improved; Consolidated profit increased to EUR 243.3m 21 February 2019 Andreas Brandstetter, CEO Kurt Svoboda, CFO/CRO, CEO UNIQA Austria
GENERALI GROUP 2018 First Half Results
 GENERALI GROUP 2018 First Half Results The like for like change of written premiums, life net inflows, new business volumes and value is on equivalent terms (on equivalent exchange rates and consolidation
Operating and financial review Zurich Financial Services Group Half Year Report 2011
 Operating and financial review 2011 Half Year Report 2011 2 Half Year Report 2011 Operating and financial review The information contained within the Operating and financial review is unaudited. This document
Allianz Group Financial information as of 31 March 2018
 Allianz Group Financial information as of 31 March 2018 Reporting by business segments and quarters (starting from 1Q 2017) Consolidated Balance Sheets Asset allocation Allianz Group overview Property-Casualty
3M 2014 Results Presentation
 3M 2014 Results Presentation Conference call for the results of the first quarter 2014 Vienna, 27 May 2014 Presenting team and topics Presenting team Martin Simhandl, CFO Peter Höfinger, Member of the
BFF Banking Group 1H2017 Results. 2 nd August 2017
 BFF Banking Group 1H2017 Results 2 nd August 2017 Disclaimer This presentation may contain written and oral "forward-looking statements", which includes all statements that do not relate solely to historical
Nomura Financial Services Conference Fitter. Stronger
 Nomura Financial Services Conference 2011 Fitter Stronger 1 Disclaimer Cautionary statements: This should be read in conjunction with the documents filed by Aviva plc (the Company or Aviva ) with the United
1 Jan 2018 Property & Casualty Treaty Renewals. and guidance update 2017 and 2018
 Property & Casualty Treaty Renewals and guidance update 2017 and 2018 Renewals Conference Call Hannover, 7 February 2018 Reinsurance markets Our results Our portfolio Structured reinsurance Outlook 2018
Vienna Insurance Group Focused on Growth in CEE and Austria. CA-IB Emerging Europe Conference, 19/20 March, 2007
 Vienna Insurance Group Focused on Growth in CEE and Austria CA-IB Emerging Europe Conference, 19/20 March, 2007 Vienna Insurance Group Focused on Growth in CEE and Austria 2 Leading Austrian insurance
Munich Re Group. Changing Gear
 Annual Press Conference Preliminary figures Changing Gear Nikolaus von Bomhard Jörg Schneider February 008 Agenda Overview 4th record result in a row Preliminary results Munich Re Group in total segment
AXA FULL YEAR 2014 EARNINGS. Presentation. February 25, 2015
 AXA FULL YEAR 2014 EARNINGS Presentation February 25, 2015 Certain statements contained herein are forward-looking statements including, but not limited to, statements that are predictions of or indicate
Half Year Results Reporting 2008
 Half Year Results Reporting 2008 Analysts and Media Presentation Zurich, August 3, 2008 Disclaimer and cautionary statement Certain statements in this document are forward-looking statements, including,
For personal use only Genworth Mortgage Insurance Australia
 Genworth Mortgage Insurance Australia 3Q 2016 Financial Results Presentation 4 November 2016 2016 Genworth Mortgage Insurance Australia Limited. All rights reserved. Disclaimer This presentation contains
2016 Annual Results. SCOR records net income of EUR 603 million, increases its dividend to EUR 1.65 and envisages share buy-backs
 2016 Annual Results SCOR records net income of EUR 603 million, increases its dividend to EUR 1.65 and envisages share buy-backs In 2016, SCOR delivers a strong set of results and continues to successfully
GENERALI GROUP 9M 2014 Results
 GENERALI GROUP 9M 2014 Results Please note that prior year s figures have been restated throughout the whole presentation to reflect the new perimeter of the Group. Net income, Shareholders Equity, Solvency
ING Bank. Credit update. Amsterdam 6 November
 ING Bank Credit update Amsterdam 6 November 2013 www.ing.com Key points ING advanced further into end phase of restructuring ING Group s stake in ING U.S. has been further reduced to 57% Divestment Insurance/IIM
THE TALANX GROUP AT A GLANCE
 Talanx Group Interim Report as at 30 September 2015 THE TALANX GROUP AT A GLANCE Group key figures unit 6M 2015 Q3 2015 9M 2015 6M 2014 Q3 2014 9M 2014 +/ % 9M 2015 vs 9M 2014 Gross written premiums EUR
EUROPEAN EMBEDDED VALUE 2006
 MUNICH RE GROUP EUROPEAN EMBEDDED VALUE 2006 SUPPLEMENTARY INFORMATION REGARDING LIFE AND MEDICAL EMBEDDED VALUE RESULTS 2006 4 May 2007 Contents 1 Introduction...4 1.1 Scope of disclosure...4 1.2 Covered
Group financial results for the first nine months 2003
 Group financial results for the first nine months 2003 Helmut Perlet, Chief Financial Officer Analysts Conference Call November 14, 2003 The first nine months 2003 Key developments Substantial progress