INTEGRATED ANNUAL REPORT & FINANCIAL STATEMENTS FOR THE YEAR ENDED 30 JUNE Part of everyday life
|
|
|
- Cameron Owens
- 6 years ago
- Views:
Transcription


1 INTEGRATED ANNUAL REPORT & FINANCIAL STATEMENTS FOR THE YEAR ENDED 30 JUNE 2016 Part of everyday life


2 Our Value Statements Vision To be the market leader in the provision of reliable, safe, quality and competitively priced electric energy in the Eastern Africa region. Mission To efficiently generate competitively priced electric energy using state of the art technology, skilled and motivated human resource to ensure financial success. We shall achieve market leadership by undertaking least cost and environmentally friendly capacity expansion. Consistent with our corporate culture, our core values will be adhered to in all operations. Our Philosophy We promise to create value for all our stakeholders cutting across our shareholders, employees, communities neighbouring our plants and our fellow citizens. We will continue focusing in achieving sustainability in value creation from the present generation of Kenyans to the next and future generation of Kenyans. Our long-term commitment is to empower our people and our economy with reliable, safe and competitively-priced electric energy that is environmentally friendly and continue being a socially responsible Company. Professionalisim Safety Culture Core Values Integrity Team Spirit

3 Contents 1. Our Profile Core Business 2 Significant Facts 3 Our Milestones 4-5 Who We Are 6-11 Financial Highlights Corporate Information Report of the Directors Leadership Overview Who Governs Us Report of the Chairman Ripoti ya Mwenyekiti Who Leads Us Managing Director & CEO s Statement Taarifa ya Mkurugenzi Mkuu na Afisa Mkuu Mtendaji Statistics Historical Performance Installed Capacity 195 Units Sent Out Weighted Factors % Shareholder Calendar Notice of the Annual General Meeting Ilani ya Mkutano Mkuu wa Kila Mwaka Proxy Form 206 Fomu ya Uwakilishi 207 Shareholder Notifications 208 Dematerialisation of Shares Bank Details 211 Unclaimed Dividends Corporate Governance Statement Review of our Performance Our Strategic Direction Our Plan Growing Our Business Powering from the Earth 81 Securing Our Future 82 Sustaining the Business Building Talent Getting Value for Our Money Sustainability Sustainability Highlights 96 Social Sustainability Environment Sustainability Operational Management 105 Social Management Social Sustainability Investment Business Sustainability 111 Risk Management Financial Statements Statement of Directors Responsibilities 119 Report of the Auditor General Statement of Profit or Loss and other Comprehensive Income 122 Statement of Financial Position Statement of Changes in Equity 125 Statement of Cash Flows 126 Notes to the Financial Statements

4 Core Business Kenya Electricity Generating Company Limited (KenGen) is the largest power producer in Kenya and East Africa. With an installed capacity of 1,630 MW the Company commands a market share of 69% and generated 80% of national energy consumption as at 30 June Thermal Wind Hydro 253 (16%) (2%) (50%) Geothermal (32%) 2
5 Significant Facts Significant Facts Largest Geothermal Producer making Kenya the 7th in the World Developed the Single Largest Geothermal Project in the World (Olkaria 280 MW) Champion in the development of Geothermal Wellhead Technology Operationalised 83MW capacity of geothermal wellhead modular plants, the largest in the world Drilled the largest Geothermal Well in Africa: 30MW Executed the first Commercial Geothermal Drilling Contract Diversified Revenue Streams through geothermal consultancy works Commissioned a natural geothermal spa in Kenya ISO QMS 9001:2008 and EMS 14001:2004 certified The only company in Kenya to earn carbon asset funds under the Clean Development Mechanism (CDM) Largest Wind Power Producer in East Africa Awards Africa Power Utility Company of the Year 2015 by Africa Utility Africa Power Utility of the Year 2015 by East African Power Industry Convention (EAPIC) 2015 Clean Energy Project of the Year by EAPIC 2015 Best Practice in Board Diversity Award by NSE 2015 Financial Reporting (Corporate Governance Category) by FiRe Awards 2015 Financial Reporting (IFRS Public Sector Entities) by FiRe Awards 2015 Financial Reporting (State Corporations & Semi-Autonomous Government Agencies Category) by FiRe Awards
 Mesco Hydro Power Plant (0.")

6 Our Milestones Kenya Power Company (KPC) incorporated as a company in 1954 Wanjii Power station 7.4MW was commissioned First Ngong Wind Farm 0.35MW commissioned Turkwel 106MW Hydro Power Plant commissioned Kiambere Hydro Power Plant 144MW commissioned Ndula, first Hydro Power Plant; commissioned (2MW) Mesco Hydro Power Plant (0.38MW) Drilling of geothermal wells in Olkaria kicked off Gogo 2MW Hydro Power Plant commissioned Sagana Hydro Power Plant 1.5MW Sosiani Hydro Power Plant 0.4MW Completed the First post-independence Power Plant on the Tana River: Kindaruma 40MW Hydro Plant Completed the first three geothermal exploration wells in Africa within Olkaria Geothermal Field Nairobi South 13.5MW Thermal Plant commissioned First 15MW Geothermal Unit in Olkaria I installed and a total of 45MW completed in MW Gitaru Units 2 & 3 commissioned Masinga Hydro power plant 40MW. Masinga dam, the main reservoir on Tana River cascade, has a capacity of 1.56 billion cubic metres of water. Kamburu Hydro power plant 94.2MW commissioned Kenya Power Company rebranded as KenGen following a restructuring in the Power Sub-sector Becomes the First Kenyan Parastatal to be ISO: 9001 Standard certified Kipevu 1 with installed capacity of 73.5MW commissioned Gitaru unit 180MW was commissioned, in addition to Gitaru unit 2 and 3 commissioned earlier, this made Gitaru Hydro power plant the Largest Hydro Plant in Kenya at 225MW 4
7 Our Milestones Ground breaking ceremony for the Single Largest Geothermal Project in the World (Olkaria 280 MW) Largest Wind Farm in Kenya Completed: Ngong 25.5MW Ambitious Resettlement Action Plan (RAP) for 150 households in Olkaria completed Innovative Wellhead Technology Project of 75MW Rolled Out Drilled the largest Geothermal 30MW Well in Africa Quickest Thermal Power Plant in East Africa commissioned in record 14 months: Kipevu III 120MW Largest Public Infrastructure Bond in Kenya; successfully raised over Kshs.26 billion Deepened Kenya s Capital Markets through successful public listing with 336% subscription rate on the Nairobi Stock Exchange 60MW Sondu Miriu Hydro Power Plant a run-off the river plant with a 17km penstock tunnel commissioned Olkaria II 70MW commissioned Commissioned Sang oro Hydro Power Plant 21.2MW Upgraded Kiambere Hydro Power Station from 144MW to 168MW Upgraded Kindaruma Hydro Power Station from 40MW to 72MW Upgraded Tana Hydro Power Station from 14.4MW to 20MW Commissioned Supervisory Control and Data Acquisition (SCADA) phase I system for all major hydro power plants. Decommissioned Nairobi south in bid to reduce on thermal generation Rehabilitation of MESCO Hydro Power Plant 0.45MW 2015 Completed the Single Largest Geothermal Project in the World (Olkaria 280 MW) ISO QMS 9001:2008 and EMS 14001:2004 recertified Commissioning of natural Geothermal Spa 5
 with 100% government ownership.")
8 Who We Are Kenya Electricity Generating Company (KenGen), a limited liability company incorporated under the laws of Kenya, is in the business of generating electricity through the development, management and operation of power plants. KenGen was incorporated in 1954 under the Companys Act of the Laws of Kenya as Kenya Power Company (KPC) with 100% government ownership. The shareholders of the company later contracted East Africa Power & Lighting Company (EAP&L) to manage KPC. EAP&L later changed to Kenya Power & Lighting Company (KPLC) in In 1996, the government initiated major reforms in the energy sector. Generation of electricity was unbundled and the management of KPC was officially separated from Kenya Power and renamed KenGen in January KenGen took charge of all the public generating assets while KPLC maintained the transmission and distribution functions. The government sold 30% of its stake in the Company and in 2006, KenGen was listed on the Nairobi Securities Exchange (NSE) through a successful Initial Public Offer (IPO). The company has always returned value to its shareholders and in 2016, gave the investors another opportunity to exercise their rights in a successful rights issue. KenGen is the leading power generator in the country with a market share of 69%. In the year under review, the company generated 80% of the electric energy in the country KenGen IPP s 80% 20% 6

9 Who We are The Company has tremendously invested in clean, renewable and sustainable energy generation. In the year under review, 84% of all generated energy by KenGen was from clean energy; hydro 50%, geothermal 32% and wind 2%, reducing the Kenya s carbon footprint. This enabled the country to realise a clean energy generation of 88% in the year under review; geothermal 48%, hydro 39% and wind 1% KenGen s Energy Generation Mix Kenya s Energy Generation Mix As at 30th June 2016 As at 30th June 2016 Thermal Wind 16% 2% Thermal Wind 12% 1% Geothermal 32% Hydro 50% Geothermal 48% Hydro 39% Why We Are Here The Company s initial mandate was to transmit power from Uganda to Kenya. In 1997, it was tasked with management of all public power generation facilities in the country. The company has continued to invest in capacity expansion and strives to deliver affordable, reliable, competitively priced and clean energy for the economy. Our motto Energy for the nation is a true reflection of our commitment to the nation. The company ensures that it remains true to its mission by continuously investing in clean, sustainable and affordable power projects, supported by a highly committed and competent workforce of 2,406 employees. What We Do Our business is to deliver affordable clean energy and create wealth for shareholders while making investments needed to ensure a sustainable future. This has resulted in investments in different generation modes of which 80% is from clean, renewable and sustainable sources. The company owns a fleet of thirty two (32) power plants with a combined capacity of 1,630.95MW. 7
10 Who We Are 1. Hydroelectric Energy These power plants form part of the early generation capacity as indicated: Plant Installed Capacity(MW) Effective Capacity (MW) Year of Commisioning Sagana Mesco* Wanjii Tana** /2010 Masinga Kamburu /1976 Gitaru /1999 Kindaruma*** /2013 Kiambere**** /1988 Turkwel Sondu Miriu Sang oro Gogo Sosiani *Mesco rehabilitated in year 2013 **Tana upgrade completion in 2010 *** Kindaruma upgrade completion in 2013 ****Kiambere upgraded Geothermal Energy Geothermal power plants are seen as the key energy generators in the country. Geothermal energy is now the leading energy source in the country and supports the base load energy requirements. KenGen s geothermal power plants are as below: Plant Installed Capacity(MW) Effective Capacity (MW) Year of Commisioning Olkaria I /1983/1985 Olkaria I AU Olkaria II /2010* Olkaria IV Eburru Wellhead *Olkaria II Unit III was installed in
11 Who We are 3. Thermal Energy KenGen has invested in medium speed diesel and gas turbine generators across the country. These power plants help to support peak loads and sustain voltages in the grid. Plant Installed Capacity(MW) Effective Capacity (MW) Year of Commisioning Kipevu I Kipevu III Embakasi GT /2013* Muhoroni GT /2016** Garissa *** Lamu *** *relocated from Kipevu to Embakasi in 2013 **relocated from Embakasi to Muhoroni in 2016 *** Lamu and Garissa were decommisioned in April amd May 2016 respectively 4. Wind Energy The Company runs three wind power plants in Ngong Hills as indicated Plant Installed Capacity(MW) Effective Capacity (MW) Year of Commisioning Ngong I Phase I Ngong I Phase II Ngong II How We Do It The backbone of our successful business model is a committed and competent workforce. KenGen is proud to have a skilled workforce that is able to deliver new power projects while operating and maintaining existing assets to ensure sustained generation. The Company is committed to professional working relations with other players in the sector, taking cognizance of the fact that the country has one off-taker: Kenya Power. KenGen engages stakeholders and the regulators: Energy Regulatory Commission (ERC) and National Environmental Management Authority (NEMA) to ensure that the overall mandate of the sector is achieved. 9

12 Who We Are 6. Where We Do It KenGen has invested in different locations in the country as indicated in the map. 10
13 Who We are 7. How We Plan For The Future KenGen developed a 10 year plan in 2007 known as Good-to-Great (G2G) Transformation Strategy of moving the Company from Good to Great through creation of sustainable value from one generation to the next generation of Kenyans. The thrust was to stabilize and create a sustainable power supply in the country. The strategy has since been revamped for the next 10 years with a medium-term focus to commission 721MW by Figure below illustrates our strategy horizons. KenGen Strategy Horizons Current focus Great company Horizon I Horizon II Original Revamped plan Horizon III 10 years+ Good company Stabilize power situation in Kenya Delivered 325+MW Increased RoE1 to 12.5% Improved ROIC2 to 8.9% Drilled 150+ geothermal wells Created regulatory unit Delivered 375+MW Create sustainable power growth in Kenya Deliver 2,500MW Create value for shareholders Lower tariffs Diversify business (KenGen C) Build capabilities for our future Explore expansion opportunities Drive expansion beyond Kenya Establish a strong African footprint Leader in technology and innovation Horizon II is being revamped and extended to 2025 to address changes in the operating environment and achieve success Time 11
14 Financial Highlights 1,231 CAGR 5.68% 1,264 1,239 1,617 1,630 5,405 CAGR 7.66% 6,022 6,084 7,027 7, Installed capacity(mw) CAGR 18.78% 29,957 38,610 CAGR 18.82% 18,615 22,339 16,331 17,051 18,334 10,266 10,700 12, Total revenue(kshs.m) Operating Expenses(Kshs.m) CAGR 13.05% 25,602 29,543 15,999 16,451 17, Electricity revenue(kshs.m) 12
15 Financial Highlights 8,690 4,158 4,045 4,027 CAGR 22.78% 11,264 CAGR 19.02% 5,224 11,517 6,743 2,823 2, Profit before tax(kshs.m) Profit after tax(kshs.m) CAGR 19.33% 26,495 CAGR 19.33% 16,271 17,821 11,342 10,948 10,930 11,057 6,065 6,352 6, EBITDA(Kshs.m) EBIT(Kshs.ml) 162,914 CAGR 17.65% 188, , , , Assets 13
16 Corporate Information Directors Joshua Choge - Chairman Albert Mugo - Managing Director & CEO Henry Rotich - Cabinet Secretary, The National Treasury Joseph Njoroge - Principal Secretary, State Department for Energy Dorcas Kombo Ziporah Ndegwa Millicent Omanga Musa Arusei Kairu Bachia Joseph Sitati (Elected on 16 December 2015) Maurice Nduranu (Elected on 16 December 2015) Humphrey Muhu - Alternate Director to Henry Rotich William Mbaka - Alternate Director to Joseph Njoroge (Appointed on 4 October 2016) Hedrick Omanwa (Retired on 16 December 2015) Henry M Narobi (Retired on 16 December 2015) Momata Gichana (Retired on 4 October 2016) Secretary Rebecca Miano Certified Public Secretary (Kenya) KenGen Pension Plaza 2 Kolobot Road, Parklands P. O. Box GPO Nairobi Principal Auditor The Auditor-General Anniversary Towers P. O. Box GPO Nairobi Registrars Image Registrars Limited Barclays Plaza, 5th Floor Loita Street P. O. Box GPO Nairobi Delegated Auditors PricewaterhouseCoopers Kenya Certified Public Accountants (Kenya) PwC Tower, Waiyaki Way, Westlands P. O. Box GPO Nairobi 14
17 Corporate Information Principal Bankers Commercial Bank of Africa Limited Wabera Street P. O. Box GPO Nairobi CfC Stanbic Bank Limited Kenyatta Avenue Branch P. O. Box GPO Nairobi Citibank NA Upper Hill P.O. Box GPO Nairobi Kenya Commercial Bank Limited Moi Avenue Branch P. O. Box GPO Nairobi NIC Bank Limited Masaba Road P. O. Box GPO Nairobi Standard Chartered Bank Kenya Limited Harambee Avenue P.O. Box GPO Nairobi Executive Management Managing Director & Chief Executive Officer - Albert Mugo Operations Director - Solomon Kariuki (appointed 1 August 2016) Operations Director (Retired) - Richard Nderitu (retired 31 July 2016) Company Secretary & Legal Affairs Director - Rebecca Miano, CPS (K) Human Resources & Administration Director - Abraham Serem (appointed 1 March 2016) Finance & ICT Director - John Mudany FCPA (K) Regulatory & Corporate Affairs Director - Simon Ngure Business Development Director - Moses Wekesa Geothermal Development Director - Abel Rotich Strategy & Business Performance Director - David Muthike Supply Chain Director - Philip Yego 15
18 REPORT OF THE DIRECTORS About this Report This report aligns with best practice in integrated reporting. It includes principles of international financial reporting standards and takes into account other guidelines. Statement of Directors The directors are pleased to present their Report together with the audited financial statements of the Kenya Electricity Generating Company Limited (the Company ) for the year ended 30 June 2016, which shows the state of affairs of the Company. The Board, assisted by the Audit and Risk Management Committee, is ultimately responsible for the integrity and completeness of the integrated report and supplementary information. The Board has applied its collective mind to the preparation and presentation of the Integrated Report and has concluded that it is presented in accordance with the International Financial Reporting Standards - IFRS. The content is further guided by legal and regulatory requirements, such as Kenya Companies Act and Capital Markets Authority Corporate Governance Guidelines as well as global best practice in integrated reporting. We are assessing the requirements of the International Integrated Reporting Framework (IIRF) published by the Integrated Reporting Council in December Integrated Reporting We are committed to integrated reporting and continue on the journey to improving both our integrated reporting, guided by best practice and integrated thinking. This integrated report focuses on value creation over the short, medium and long term. It indicates how the Company s value creation process is impacted by its internal and external environment, together with the connectivity between strategy, governance, performance and future outlook, as well as the impact of the organization s activities in the environment and trade-offs that influence value creation over time. This report seeks to provide a transparent and balanced appraisal of our value creation story, considering both qualitative and quantitative matters that are material to our operations and strategic objectives, and which may influence stakeholders decisions. Matters important to stakeholders are determined through extensive consultation with them and consideration of their concerns while taking account of Company s strategic objectives, assessment of risks and our value chain. Material matters are those that are of high concern to stakeholders and could have a significant impact on our ability to create value. This is our primary report to shareholders. Although it is targeted at the providers of financial capital, it provides information of interest to all stakeholders. Reporting Boundary This integrated report reviews our economic, technical, social and environmental performance for the year from 1 July 2015 to 30 June 2016, with two years comparative information as well as short and medium-term targets. Material events up to the date of approval have been included. This report examines our performance in relation to the sustainability dimensions, which underpin our strategy, taking into account our operating environment, long-term goals, risks that might prevent us from achieving those goals, and measures to mitigate them. Assurance & Audit Approach Our combined assurance model is at three key levels, namely review by management and supplemented by internal auditors, external auditors and the Auditor General in order to optimize governance oversight, risk management and control. The Board Audit and Risk Management Committee and the Board rely on combined assurance in forming their view of the adequacy of our risk management and internal controls. Forward Looking Statements Certain statements in this report regarding the business operations may constitute forward-looking statements. These include all statements other than those of historical fact, including those regarding the financial position, business strategy, management plans and objectives for future operations. Forward-looking statements can be identified by words such as believes, estimates, anticipates, expects, intends, may, will, plans, outlook and other words of similar meaning in connection with a discussion of future operating or financial performance. 16
19 REPORT OF THE DIRECTORS The Directors submit their report together with the audited financial statements for the year ended 30 June 2016, which disclose the state of affairs of Kenya Electricity Generating Company Limited (the Company ). The annual report and financial statements have been prepared in accordance with sections 147 to 163 of the repealed Companies Act - Cap 486, which remain in force under the transition rules contained in the Sixth Schedule, the Transitional and Saving Provisions of the Companies Act PRINCIPAL ACTIVITIES The principal activity of the Company is to generate and sell electricity to the authorised distributor, Kenya Power and Lighting Company Limited (Kenya Power). RESULTS FOR THE YEAR DIRECTORS The present members of the Board of Directors are shown on page 1. Mr. Hedrick Omanwa and Mr. Henry M Narobi retired on 16 December On the same day, Mr. Joseph Sitati and Mr. Maurice Nduranu were elected as Directors. AUDITORS The Auditor General is responsible for the statutory audit of the Company s financial statements in accordance with Section 35 of the Public Audit Act, Section 23(1) of the Act empowers the Auditor General to appoint other auditors to carry out the audit on his behalf. Accordingly, PricewaterhouseCoopers were appointed to carry out the audit for the year ended 30 June BY ORDER OF THE BOARD Shs 000 Shs 000 Profit before tax 11,264,044 8,690,012 Income tax (expense)/ credit (4,520,552) 2,827,315 Profit for the year transferred to retained earnings 6,743,492 11,517,327 DIVIDENDS The Directors do not recommend payment of dividends for the year ended 30 June 2016(2015: Shs billion). Rebecca Miano Company Secretary Nairobi 19 October
20 18

21 THE BOARD OF DIRECTORS 19


22 Who Governs Us Joshua Choge Mr. Joshua Choge, Chairman of the KenGen Board of Directors, born in 1958, holds a Bachelor of Science degree in Mathematics and Statistics. Mr Choge has a Master s degree in Management and Leadership from the Management University of Africa and is currently pursuing a PhD in Leadership and Management. He is a trained accountant from Strathmore College and has been trained by the Chartered Institute of Purchasing and Supply, UK, on Procurement Management. Mr Choge has over fifteen years experience in the public sector in various positions including the Purchasing Manager and the Deputy Chief Internal Auditor at the East African Portland Cement. He is fully conversant with corporate governance matters, having attended the critically acclaimed Corporate Governance Training for Directors organised by the Centre for Corporate Governance. He has served as a Director at the Agricultural Finance Corporation where he was the Deputy Chairman of the Board and the Chairman of the Finance and Business Committee of the Board. He is an experienced businessman and a board member of several schools. He is also the Chairman of the Board of the African Inland Church, Kapsabet Bible College in Nandi County. Currently, he is the CEO of Talent Foundation International (TFI), a non-governmental organisation that identifies and develops talent among needy children. Eng. Albert Mugo, MBS Eng. Albert Mugo, born in 1957, holds a Bachelor of Science degree in Electrical Engineering and Master of Business Administration degree in Strategic Management, both from the University of Nairobi. He is currently pursuing a Doctor of Philosophy (PhD) in Management and Leadership. In 2012, he completed the Advanced Management Programme from Strathmore University. He is a registered Professional Engineer with the Engineers Board of Kenya. Until his current appointment in January 2014, he was the Business Development and Strategy Director at KenGen. He has worked in the Energy Sector for over 30 years. He started his career as a graduate electrical engineer at the Kenya Pipeline Company before moving to the Kenya Power and Lighting Company (then the East African Power and Lighting Company) where he was a protection engineer in various stations, including the Seven Forks hydro complex. He then became a power system planner in the electricity sector in Kenya and Eastern Africa, a position involving power demand forecasting, carrying out studies for prospective power generating and transmission projects as well as development of power generation and transmission lines. He has experience in power sector electricity tariff formulation and has been involved in the development of private power projects. Eng. Mugo believes in value-based leadership and is committed to transformational leadership within KenGen and in other entities. He is a Board member of the KenGen Retirement Benefits Scheme, Stima Sacco, and is the chairman of the KenGen Foundation Board of Trustees. Henry Rotich, EGH Mr. Henry Rotich, the Cabinet Secretary, the National Treasury, born in 1969, holds a Master s Degree in Economics and a Bachelor s Degree in Economics (First Class Honours), both from the University of Nairobi. He also holds a Master s degree in Public Administration (MPA) from the Harvard Kennedy School, Harvard University. Prior to his appointment as Cabinet Secretary, he was the Head of Macroeconomics at the Treasury from March Under this capacity, he was involved in the formulation of macroeconomic policies that ensured an efficient and sustainable public spending aimed at achieving the Government s development priorities. In addition, he was involved in the preparation of key documents including budget statements, as well as providing a strategic coordination of structural reforms in fiscal and financial sectors. Prior to joining the Ministry of Finance, Mr. Rotich worked in the Research Department of the Central Bank of Kenya from Between 2001 and 2004, he was attached to the International Monetary Fund (IMF) local office in Nairobi as an economist. He was also a director in several boards of State Corporations, including: Insurance Regulatory Board; Industrial Development Bank; Communication Commission of Kenya and the Kenya National Bureau of Statistics. 20
.")


23 Who Governs Us Dr. Eng. Joseph Njoroge, CBS Dr. Eng. Joseph Njoroge, the Principal Secretary, State Department for Energy, was born in He holds a First Class Honours degree in Electrical Engineering, Master of Business Administration with a major in strategic management and a doctor of philosophy (PhD). He is a Chartered Electrical Engineer, a member of the Institution of Engineering and Technology UK, a registered consulting engineer, and is also a fellow of the Institution of Engineers of Kenya. Dr. Eng. Joseph Njoroge joined Kenya Power in 1980 and rose through the ranks to become the Managing Director from June 2007 until his current appointment to the position of Principal Secretary in the Ministry of Energy and Petroleum in May 2013 and became the Principal Secretary in the State Department for Energy following reogarnisation of the government structure. He is a distinguished electrical engineer with a career spanning three decades and has wide experience in power engineering and management. Dorcas Kombo Mrs. Kombo, born in 1954, is a Fellow of the Chartered Association of Certified Accountants, an Associate of the Institute of Certified Public Accountants of Kenya and a Member of the Institute of Certified Public Secretaries of Kenya. Dorcas has vast experience in auditing and human resources consulting. She previously worked at Deloitte and later at Coopers & Lybrand as Audit Manager before the merger to form PriceWaterhouseCoopers. She later trained in Human Resources and later became the Associate Director until 2004 when she retired from full-time employment. She has extensive experience in restructuring organisations for efficiency. She has also assisted african governments in developing appropriate labour policies for providing safety nets to staff retrenched from public service. Currently, she is a Management Consultant and has led teams to deliver human resources and organisation development services to governments, public and private sector organisations across Africa under the business name of Metis Consulting. Ziporah Ndegwa Mrs. Ziporah Ndegwa, born in 1962, holds a Bachelor s degree in Law and a Diploma in Legal Practice from the Kenya School of Law. She is a member of the Law Society of Kenya and Christian Lawyers Fellowship. She has been a practising lawyer since 1988 when she was admitted to the bar. She previously served as a State counsel in the Law Reform Commission before entering private practice. Mrs Ndegwa has been a principal partner in Maira & Ndegwa Advocates since 1996 during which she has engaged in civil, commercial and criminal litigation. 21

 from the University of Nairobi, Master of Science (Geothermal) from the University of Leeds, UK and a Doctor of Philosophy")

24 Who Governs Us Millicent Omanga Ms. Millicent Omanga, born in 1982, holds a Bachelor s degree in commerce. She is the founder and Managing Director of Milways Enterprises, a business which deals in construction, interior décor and importation of furniture and electrical appliances. Ms. Omanga is a youth leader at Rimpa SDA Church. Musa Arusei Dr. Musa Arusei, born in 1957, holds a Bachelor of Science degree (Geochemistry) from the University of Nairobi, Master of Science (Geothermal) from the University of Leeds, UK and a Doctor of Philosophy (Geochemistry) from Moi University. He is formerly a senior lecturer in the Department of Chemistry and Biochemistry at the University of Eldoret. Dr Arusei supervises and marks theses for doctorate and master s students. He has attended various local and international conferences on research and geochemistry. He has also published several research papers and reports on geochemistry and geothermal studies. Dr. Arusei has previously worked as a lecturer and assistant lecturer in the Department of Chemistry and Biochemistry at the University of Eldoret. He has also worked as a geochemist at KenGen and the Ministry of Energy. Kairu Bachia Mr. Kairu Bachia, born in 1959, holds a Bachelor of Arts degree in Building Economics from the University of Nairobi and a Global Executive MBA (GEMBA) from United States International University Africa. As part of continuous professional education and personal development, he has attended, amongst many other courses, the Owner Manager Program (OMP) and Master Negotiator Course at Strathmore Business School. He is a Registered Quantity Surveyor with the Board of Registration of Architects and Quantity Surveyors (BORAQS), a corporate member of the Architectural Association of Kenya (AAK), Institute of Quantity Surveyors of Kenya (IQSK) and a member of the Chartered Institute of Arbitrators (CIArb). He is an author of several articles presented at construction industry professional forums. Mr. Bachia who has previously worked as a quantity surveyor in both the public and private sectors, is currently the Team Leader and Quality Control Director of Masterbill Integrated Projects and MIP Project Management Ltd. He is also a director in a number of real estate development companies. He is an active Arbitrator and Dispute Resolution Consultant. He is a past chairman of the Architectural Association of Kenya and Muthaiga Golf Club (MGC) and a past secretary of the Kenya Professional Boxing Commission (KPBC). He has also served as a Council Member of the management of Professional Centre for the Association of Professional Societies of East Africa and in the Ethics and Practice Committee of BORAQS. 22


 from the California State Polytechnic")

25 Who Governs Us Joseph Sitati Mr. Joseph Sitati, born in 1973, holds a Bachelor of Science (Mechanical Engineering) from the University of Nairobi. He is a Fellow of the Association of Chartered Certified Accountants and is a platinum member of the Information System Audit and Control Association. He has attended various professional development training programs. He is presently the Chief Finance and Administration Officer at Deacons East Africa PLC. He has previously been the Commercial Finance Manager Central East & West Africa Business Unit at the Coca-Cola Company, Nairobi, Group Finance Director at Old Mutual Group, Nairobi, and Finance Manager at Shell BP Kenya Limited amongst other positions. Maurice Nduranu Mr. Maurice Nduranu, born in 1974, holds a Bachelor of Science degree (Business Administration - concentration in Finance, Real Estate and Law, magna cum laude) from the California State Polytechnic University at Pomona and a Master of Financial Engineering Degree from the Haas School of Business at the University of California, Berkeley. He is one of the principals at BlackGold Investments Ltd, a bespoke private equity transactions advisory and investments firm. He was previously a strategy and investments advisor at Msingi, a new $100m regional catalytic fund. Prior to that he was a portfolio manager at Acumen Fund and Property and Fixed Income, and portfolio manager at African Alliance. He started off his career working in public infrastructure financing in the U.S. West. Humphrey Muhu Mr. Humphrey Muhu, born in 1964, holds a BSc (Mathematics & Statistics) from Kenyatta University B.Phil (Economics) and an MA in Economics from the University of Nairobi. He also holds a Diploma in Financial Management from KCA University. He is the alternate director to the Cabinet Secretary, National Treasury. Mr. Muhu, is an Economist with over 20 years experience in various government ministries and departments. William Mbaka Mr. William Mbaka, born in 1962, holds a Bachelor of Education (Business Studies) from Kenyatta University and Master of Business Administration from Birmingham University, UK. He is an Associate of Chartered Certified Accountant (ACCA) and has attended several courses on leadership, public policy management and financial management at various institutions both locally and abroad. He is the alternate director to the Principal Secretary, Ministry of Energy and Petroleum, and is currently the Chief Finance Officer at the Ministry of Energy and Petroleum. Mr. Mbaka has over 20 years experience in financial management in the Government of Kenya. 23

26 Report of the Chairman KenGen embarked on a restructuring programme aimed at strengthening the balance sheet as well raising equity capital to fund mega projects. Kshs 26.4bn Rights Issue 1,630 Megawatts Electricity Capacity Dear Shareholders, We are elated to have concluded the largest Rights Issue in Kenya s history. This was an outstanding year, nothing short of exemplary performance by our business. The Company successfully raised Kshs 26.4 billion inspite of the bearish run at the Nairobi Securities Exchange which is a testament to the confidence that you, as investors have in KenGen s leadership and strategic direction. I appreciate the Government s full support and participation in the Rights Issue through the conversion of government debt into equity amounting to Kshs 20.2 billion. I take this opportunity to laud all our shareholders and stakeholders for the unwavering support as we endeavour to build shareholder value and ensure a sustainable future for our Company. I am therefore privileged to present to you the annual report and consolidated financial statements for the year ended 30th June 2016, marking a major milestone in our profitability and business footprint in Kenya and beyond. During the period, the Government completed the construction of the transmission line from Kindaruma to Garissa and from Mombasa to Lamu, thereby connecting the two counties to the national grid. The Company therefore decommissioned its two isolated off grid Garissa and Lamu thermal power plants which were expensive to run. At the same time, the Company relocated one gas turbine generating 30MW from Embakasi to Muhoroni to stabilize the power situation in the western region and eliminate emergency power generators which had been operating since
27 Report of the Chairman Macro-economic Environment The country s economy grew at a gross domestic product (GDP) rate of 5.6% in 2015 compared to 5.3% in This growth was attributed to a stable macroeconomic environment. In contrast, the World Real GDP growth declined to 3.1 per cent in 2015 from 3.4 per cent in 2014 as a result of low commodity prices, weaker capital flows, subdued global trade and increasing financial market volatility, particularly in emerging markets and developing economies. The country s annual inflation rate declined marginally from 6.9 per cent in 2014 to 6.6 per cent in 2015 largely due to reduced costs of petroleum products, electricity and the tightening of the monetary policy. The economy consumed 9,817GWh of electricity in the last twelve months to June 2016, representing a 6% growth from 9,280Gwh sold in the same period last year. Growth in power demand is expected to gain momentum as the implementation of Vision 2030 projects take shape Strategic Direction The Board places great emphasis on an energized and motivated workforce. In light of this, the company has consistently offered an exceptional platform every year known as the Good to Great (G2G) Technical Seminar to transform the organizational culture and focus innovation and continuous improvement. The Company is now on the second horizon of the G2G strategy. During the year, the Company reviewed the Horizon II strategy and set a new target of delivering an additional capacity of 721MW by This in tandem with the projected peak demand growth. Making available this capacity will ensure security of power supply in the country and maintain KenGen s market leadership in the sector. In recognition of the contribution that the Company has made to the economy and given the consistency in growth and profitability, the Company earned an upgraded status in parastatals category during the year. Financial Results The Company embarked on a restructuring programme aimed at strengthening the balance sheet as well raising equity capital to fund mega projects. The programme, which concluded in June 2016 resulted in Kshs 20.2 billion of government debt being converted into equity and Kshs 6.4 billion raised in cash. We began the next financial year with optimism in meeting our growth 5.6% 6.6% GDP Rate Inflation Rate 25
28 Report of the Chairman targets. The Company also marked this year with a record revenue of Kshs 38.6 billion and a pre-tax profit of Kshs11.26 billion This is attributed to revenue from completed flagship 280MW geothermal plants and operation of green, clean and renewable energy from geothermal and wind sources. Our commitment to grow shareholder value remains intact as evidenced by the strong full year performance. In view of the projects lined up for implementation, the Board of Directors does not recommend dividend payment. We take this opportunity to thank the shareholders, the Government of Kenya, county governments, business partners and other stakeholders for their unwavering support which has enabled KenGen to provide clean, affordable energy for the nation and realise impressive growth in the current year. Changes in the Board There was a change in the composition of the Board of Directors in the 2015 Annual General Meeting. The Board would therefore like to thank the outgoing directors Mr. Henry M Narobi and Mr. Hedrick Omanwa for their invaluable contribution during their tenure. At the same time, the Board welcomes the newly elected directors: Mr. Joseph Sitati and Mr. Maurice Nduranu, who have brought in a new mix of skills and experience which has rejuvenated the discussions of the Board as it seeks to strengthen the governance framework in the Company. Appreciation On behalf of the Board, I convey best wishes and sincere gratitude to the Government of Kenya for its leadership, visionary development programmes and relentless support. I extend my gratitude to my colleagues in the Board for their invaluable contribution and dedication to grow and strengthen the Company s performance. I express my highest regards to our valued customer, Kenya Power, and investors for their support to KenGen. I also wish to thank our confident, committed and dedicated employees for their industry and enthusiastic effort towards meeting our objectives. In addition, the Board takes this opportunity to acknowledge the continued confidence and encouragement of our shareholders; the trust and loyalty of our business partners. I assure you of our total commitment to growing from a Good-to-a-Great company that will last from generation to generation. Thank you and God bless you. Joshua Choge Chairman of the Board 26


29 Report of the Chairman The Chairman unveils plaque at Kaewa Secondary School s dining hall in Kivaa, Machakos County The Chairman tours Kaewa Secondary School with Head teacher, KenGen Foundation Managing Trustee & Operation Manager, Eastern Hydros in Kivaa, Machakos County The Chairman planting tree at Kaewa Secondary School in Kivaa, Machakos County 27

30 Ripoti ya Mwenyekiti KenGen ilirejelea juhudi za kuunda upya mpango ulionuiwa kuthibiti loho na vile vile kuongeza mtaji wa hisa zisizo na riba ya kudumu kwa lengo la kufadhili miradi yetu mikubwa. Sh. 26.4bn Kuongeza Mtaji 1,630 Megawati Jumla ya kiwango kilichowekwa Wenyehisa Wapendwa, Tuna furaha ya kuukamilisha mchakato huu wa kuongeza Mtaji wa Biashara yetu ambao ulikuwa ndio mkubwa zaidi kuwahi kushuhudiwa katika historia ya Kenya. Huu ulikuwa mwaka mzuri ambapo tulikuwa na matokeo ya kuridhisha ya kibiashara. Shirika hili lilizalisha bilioni Sh.26.4 licha ya changamoto kadhaa na kasi ya chini katika Soko la Hisa la Nairobi, huu ukiwa ni ushahidi tosha wa imani ya wawekezaji katika uongozi na uendeshaji wa kampuni ya KenGen. Natambua usaidizi unaotokana na ushiriki wa serikali kuu katika suala hili la kuongeza mtaji wa kibiashara huku mjadala wa muamana katika hisa zisizo za riba ya kudumu ukifikia bilioni Sh Nachukua fursa hii kushukuru wenye hisa na washika dawu kwa usaidizi wakati huu tukiwa katika harakati za kuunda thamani ya wenyehisa na kuhakikisha uendelevu wa Kampuni yetu katika siku zijazo. Kwa hivyo, nina furaha ya kuwatangazia ripoti ya kila mwaka na vile vile taarifa ya pamoja ya kifedha ya mwaka uliokamilikia Juni 30, 2016, ikiadhimisha mafanikio makubwa ya faida na muundo wa biashara nchini Kenya pamoja na mataifa ya mbali. Serikali ilikamilisha ujenzi wa mkondo wa usambazaji umeme kutoka Kindaruma hadi Garissa na kutoka Mombasa hadi Lamu na hivyo kuunganisha kaunti mbili kwenye mfumo wa nyaya za kupitisha umeme wa kitaifa. Kutokana na hayo, Kampuni hii imesitisha huduma katika vituo vyake viwili vya Garissa na Lamu ambavyo vilikuwa ghali. Wakati huo huo, kampuni hii ilihamisha rafadha moja ya gesi iliyokuwa na uwezo wa kuzalisha Megawati 30 kutoka kituo cha Embakasi hadi Muhoroni ili kuthibiti 28
31 Ripoti ya Mwenyekiti hali ya umeme katika eneo la magharibi mwa nchi na kuondoa majenereta ya dharura ya kuzalisha umeme ambayo yamekuwa yakiendeleza shughuli hiyo kutokea mwaka wa Mazingira Makubwa ya Kiuchumi Uchumi wa nchi ulikua katika kiwango cha Jumla ya Mapato ya Kitaifa ya 5.6% katika mwaka wa 2015 ikilinganishwa na 5.3% mnamo mwaka wa Ustawi huu ulitokana na uthabiti wa mazingira makubwa ya kiuchumi. Kinyume cha hayo, ukuaji wa Jumla ya Mapato ya Kimataifa (GDP) ulipungua hadi asilimia 3.1 katika mwaka wa 2015 kutoka asilimia 3.4 mwaka wa 2014 kutokana na bei ya chini ya bidhaa, mtiririko dhaifu wa mtaji, upungufu wa biashara ya kimataifa na ongezeko la mabadiliko ya soko la kifedha hasa katika masoko mapya na katika nchi zinazostawi. Kiwango cha mfumuko nchini kilipungua kutoka asilimia 6.9 mwaka wa 2014 hadi asilimia 6.6 mwaka wa 2015 ambapo kilitokana na upungufu wa gharama za bidhaa za petroli, umeme na sera za kifedha zilizobanwa. Katika kipindi cha miezi kumi na miwili iliyopita kufikia Juni 2016, uchumi wa Kenya ulitumia 9,817GWh ya umeme na hivyo kuwakilisha ongezeko la 6% kutoka 9,280Gwh iliyouzwa wakati kama huo mwaka uliopita. Mahitaji ya umeme yanatarajiwa kushika kasi huku mipango ya kufanikisha miradi ya Ruwaza ya maono ya 2030 ikiendelea. Mwongozo wa Kimikakati Bodi hii inasisitizia pakubwa umuhimu wa kuwa na wafanyakazi wenye nguvu na motisha. Kutokana na haya, kampuni hii imekuwa ikitoa warsha za kipekee kila mwaka kwa jina Good to Great (G2G) Technical Seminar ili kubadilisha utamaduni wa shirika hili na kuufanya kuwa ule wa uvumbuzi na uimarishaji miongoni mwa wafanyakazi. Mwaka huu, katika taratibu za utambuzi wa mchango wa Kampuni hii kwenye uchumi na vile vile uthabiti wake katika ustawi na faida, Kampuni hii ilipandishwa ngazi hadi kiwango cha kitengo cha mashirika ya serikali. Kwa sasa kampuni hii iko katika Upeo wa pili kwenye mkakati wa G2G. Mwaka huu, Kampuni hii ilipitia upya mkakati wa Upeo wa pili na kujiwekea lengo jipya la kuzalisha kiwango zaidi cha Megawati 721 kufikia mwaka wa Malengo haya ni kuambatana na ongezeko la mahitaji kama inavyotarajiwa na kuzindua kiwango hiki kutahakikisha usalama wa usambazaji umeme nchini na vile vile kudumisha nafasi ya kwanza ya KenGen katika soko kwenye sekta hii. Matokeo ya Kifedha Kampuni hii ilirejelea juhudi za kuunda upya mpango ulionuiwa kuthibiti loho na vile vile kuongeza mtaji wa hisa zisizo na riba ya kudumu kwa lengo la kufadhili miradi yetu mikubwa. Mpango huu uliokamilika Juni % 6.6% Mapato ya Kitaifa Kiwango cha Mfumuko 29
32 Ripoti ya Mwenyekiti ulisababisha deni la bilioni Sh.20.2 kubadilishwa na kuwa hisa zisizo na riba ya kudumu na hatimaye kusababisha kuchangishwa kwa shilingi bilioni Sh.6.4. Tulianza mwaka uliopita wa kifedha kwa matumaini ya kufikia malengo yetu. Kadhalika kampuni hii ilivunja rekodi kwa kuwa na mapato ya bilioni Sh.38.6 na faida ya bilioni Sh kabla ya ushuru. Hii inatokana na mapato ya juu kutokana na kukamilishwa kwa vile vituo vya Mega wati 280 vya nguvu ya mvuke. Hii ilitokana na kuzalisha kwa nishati. kuzinduliwa kwa miradi na shughuli salama za kuzalisha umeme za vyanzo vya mvuke kutoka ardhini pamoja na nyenzo nyinginezo za upepo. Kujitolea kwetu katika kukuza wenyehisa kunasalia imara kama ilivyodhihirika kwenye matokeo yetu ya mwaka. Kutokana na miradi inayoimarika, mwaka huu Bodi ya Wakurugenzi haipendekezi mgao wowote kwa wenyehisa. Tunachukua fursa hii kuwashukuru wenyehisa, Serikali ya Kenya, Serikali za Kaunti, washirika wa kibiashara na washikadau wengine kwa usaidizi wao thabiti ambao umesaidia KenGen kuzalisha nishati safi na nafuu katika Taifa letu na hivyo kutusaidia kushuhudia ukuaji mwaka huu. Mabadiliko Katika Bodi Shukrani Kwa niaba ya Bodi, nawasilisha heri njema na shukrani kwa Serikali ya Kenya kwa uongozi wake, mipango yake yenye maono na usaidizi wake. Natoa shukrani kwa wanachama wenzangu katika Bodi kwa mchango na kujitolea kwao ambavyo umezidi kukuza na kuthibiti matokeo bora ya Kampuni hii. Ningependa kutoa shukrani kwa mteja wetu Kampuni ya usambazaji umeme ya Kenya Power na wawekezaji wote kwa usaidizi wao kwa Kampuni ya KenGen. Kadhalika ningependa kushukuru wafanyakazi wetu kwa jitihada zao katika kuafikia malengo yetu. Bodi hii inachukua fursa ya kutambua imani na mahimizo yanayotolewa na wenyehisa wetu; huu ukiwa ndio uaminifu na imani ya washirika wetu wa kibiashara. Nawahakikishia kujitolea kwetu kuimarisha Kampuni hii na kuifanya idumu kutoka kwa kizazi kimoja hadi kingine. Asante na Mungu awabariki. Joshua Choge Mwenyekiti wa Bodi Katika Mkutano Mkuu wa mwaka wa 2015 kulikuwa na mabadiliko katika muundo wa Bodi ya Wakurugenzi. Bodi ingependa kuwashukuru Wakurugenzi wanaoondoka, Bw Henry M Narobi na Bw Hedrick Omanwa kwa mchango wao wakati wa kipindi chao cha kuhudumu. Kwa upande mwingine Bodi inawakaribisha wakurugenzi wapya waliochaguliwa, Bw Joseph Sitati na Bw Maurice Nduranu walioleta mchanganyiko wa ujuzi na tajriba, maarifa mabayo yamechangamsha mijadala ya Bodi inaponuia kuthibiti muundo wa uongozi katika shirika hii. 30


33 Ripoti ya Mwenyekiti From left; CS H. Rotich, Chairman J. Choge, CS C. Keter and KenGen MD & CEO A. Mugo during the Rights Issue The Chairman J. Choge, during the official handover of KenGen s Oloirowua Primary School in Narok County 31
 in Strategic Management.")

34 Who Leads Us Managing Director & Chief Executive Officer Eng. Albert Mugo, MBS Eng. Albert Mugo is a renowned engineer with over 30 years experience in the energy sector. He holds a Bachelor of Science Degree in Electrical Engineering and a Master of Business Administration (MBA) in Strategic Management. He is currently pursuing a Doctor of Philosophy (PhD) in Management and Leadership. Other qualifications include a certificate in Advanced Management Programme. Eng. Mugo is responsible for the operational running of the Company to ensure that the mission is achieved and efficacy of the business optimized. The CEO is accountable for the company s actions, security of resources as well as ensuring execution of the identified corporate strategy for long term competitiveness. In addition to representing the management position on the Board, the MD & CEO leads the Executive Committee (ExCo) comprising nine divisional directors. Departments (additional direct reports): Internal Audit and Security & Integrity Operations Director Eng. Solomon Kariuki Eng. Solomon Kariuki was appointed to the position of Operations Director on 1st of August 2016 following the retirement of long-serving Eng. Richard Nderitu. Prior to the appointment, Eng.Kariuki was the Technical Services Manager. He joined Kenya Power and Lighting Company as a Trainee Engineer 28 years ago and served the KenGen in various capacities, ultimately growing through the ranks to the current position of Operations Director. He holds a Bachelor of Science Degree in Electrical and Electronics Engineering and a Master s Degree in Business Administration (Operations) both from the University of Nairobi. He boasts an illustrious career in the energy power sector spanning over 28 years. Key responsibilities comprise overseeing Operations and maintenance of power plants and availability at optimized costs, rehabilitation and upgrade of plants to facilitate uptake of latest technology to improve operation and extend effective plant life, continuous improvement and automation of systems to align with best practice. Departments: Eastern Hydros, Thermal Kipevu, Central (Thermal & Wind), Technical Services and Western Hydros Company Secretary & Legal Affairs Director Rebecca Miano OGW, CPS (K) Mrs. Rebecca Miano is a respectable lawyer with an illustrious career in law and corporate governance. She holds a Bachelor of Laws (LLB) degree with Honours, a diploma in Law and a Post-graduate diploma in Comparative Law. She is a member of the Institute of Certified Public Secretaries of Kenya (ICPSK). She joined KenGen in 1998 and has worked in various capacities including: Senior Legal Officer, Assistant Company Secretary, Acting Company Secretary, Company Secretary and Legal Affairs Director. She was appointed Company Secretary and Legal Affairs Director in She is responsible for driving the corporate governance agenda in the Company, providing guidance and support to the Board and is the secretary to the Board and all its Committees. Mrs. Miano is the Company s Legal Counsel and ensures it is represented positively and credibly to the external environment. Departments: Insurance, Legal, Shares & Board Services and Property 32


35 Who Leads Us Human Resources & Administration Director Abraham Serem Mr. Abraham Serem is a seasoned human resource practitioner with vast experience both in Kenya and East Africa. He holds a Bachelor of Arts degree from the University of Nairobi. His other professional qualifications include: Higher National Diploma in Human Resource Management and a Diploma in Intermediate Executive Coaching from the Academy of Executive Coaching. He is a member of the Institute of Human Resource Management. Prior experience includes: Heineken East Africa Ltd where he held the position of HR Director, East Africa Breweries Ltd, Nampak East Africa and Reckitt Benckiser East Africa, where he held various senior managerial positions. Mr. Serem joined KenGen management team on March 1st 2016 as the Human Resource and Administration Director. He is responsible for human capital planning, recruitment, development, performance management, reward and wellness. He is also in charge of employee relations, as well as management of all the Company s transport and logistics. Departments: Administration, Human Resources and Performance & Change Finance & ICT Director John Mudany, FCPA(K) Mr. John Mudany is a zealous financial management expert with extensive experience who holds a Bachelor of Commerce degree in Accounting, Masters of Business Administration in Marketing and Master of International Business Administration (MIBA). He is a member of the Kenya Institute of Management (KIM) and the Institute of Certified Public Accountants of Kenya (ICPAK). Prior experience includes: Coca Cola (Finance and Performance Manager), Orbit Distributors (MD & CEO), Kenya Airways, World Vision International and PriceWaterhouseCoopers. Mr. Mudany joined KenGen in November 2008 as the Finance and ICT Director. His key responsibilities include: capital raising, management of finances and banking relations, financial reporting, budget process management and control, balance sheet restructuring and cost saving. He is also responsible for the development of cutting edge information technology infrastructure. Departments: Corporate Finance, Finance and Information Communication & Technology Regulatory & Corporate Affairs Director Eng. Simon Ngure Eng. Simon Ngure is a versatile engineer with vast experience in the energy sector management and stakeholder relations. He holds a Bachelor of Science degree in Mechanical Engineering, diploma in Geothermal Technology, a diploma in Project Management, diploma in Executive Coaching from the Academy of Executive Coaching. He is a Certified Energy Manager and is a Registered Engineer. He is a member of the Institute of Engineers of Kenya, the Association of Energy Engineers of Atlanta USA and the Vice President of the Association of Energy Professionals of Eastern Africa. He has 34 years experience in the power sector. He joined Kenya Power and served in September 1986 and served in KenGen upto his appointment as Regulatory and Corporate Affairs Director in He is responsible for drafting, negotiating and managing power purchase agreements (PPAs), quality and safety management, environmental and as well as corporate affairs across the Company. He is also in charge of environmental and social licensing and management processes, as well as maintenance of ISO Quality and Environmental System, Safety, Clean Development Management and carbon credit sales and maximising brand value through effective corporate affairs management. Departments: Regulatory Affairs, Quality & Safety, Environment & CDM and Corporate Affairs & Community Affairs 33

 from the University of Nairobi and a post-graduate certificate in project planning, appraisal and financing from University of Bradford, UK.")


36 Who Leads Us Business Development Director Moses Wekesa Mr. Moses Wekesa is an established project manager with varied exposure in project work spanning over 15 years in economic sectors in Europe, Asia, the Pacific and Africa. He holds a Bachelor of Science degree in Mechanical Engineering from Jomo Kenyatta University of Agriculture and Technology (JKUAT), Master of Science degree in Mechanical Engineering (Applied Mechanics) from the University of Nairobi and a post-graduate certificate in project planning, appraisal and financing from University of Bradford, UK. He is a registered Project Manager with the Project Manager s Chapter of the Architectural Association of Kenya. Previous experience includes: project financing, management and supervision in agriculture, agro-processing, transport, telecommunication, infrastructure, hospitality, construction, real estate, energy, oil and gas, financial institutions, investments, general manufacturing and processing. He joined KenGen in 2014 as the Business Development Director and is responsible for driving the Company s core business of capacity expansion through planning and execution of projects. Departments: Project Execution, Capital Planning & PPP and New Business Development Geothermal Development Director Eng. Abel Rotich Eng. Abel Rotich is a seasoned power sector engineer with a wealth of experience in energy generation. He holds a Bachelor of Science degree in Mechanical Engineering, and is a Registered Engineer and a member of the Institution of Engineers of Kenya (IEK). He was appointed KenGen s Geothermal Director in September 2014 and is responsible for geothermal resource assessment, drilling, steam establishment for power generation and operation of electricity power plants constructed within the geothermal area. Before his appointment to the current position, He was involved in the management of hydro, thermal and wind power plants. Departments: Geothermal Resources Development, Steamfield & Reservoir, Geothermal Operations and Drilling & Logistics Strategy & Business Performance Director David Muthike Mr. David Muthike is a distinguished business strategist with tested experience in power sector strategy formulation and implementation. He holds a Bachelor of Science Degree in Electrical and Electronic Engineering, Masters of Business Administration in strategy, post-graduate diploma in project appraisal and management and a certificate in advanced management and leadership programme. He is a member of Kenya Institute of Management (KIM). He previously worked in various divisions and departments within the Company, including the Managing Director s Office, Corporate Planning, Technical Audit and Institutional Strengthening. He joined KenGen in He was appointed as the Company s Strategy and Business Performance Director in September His responsibilities include: development and management of the Company s strategy by identifying and driving execution of strategic initiatives and growth opportunities; driving the innovation process that develops new ways of meeting the Company s goals; leading and managing the Company s result-based performance and accountability system and driving knowledge harvesting and transfer across the business. Departments: Strategy and Innovation & Knowledge Transfer Supply Chain Director Philip Yego Mr. Philip Yego is a supply chain management expert with a wealth of experience in procurement and supply chain management. He holds a Bachelor of Arts degree in Economics, a Master of Business Administration in finance, diploma in Purchasing and supplies from the Chartered Institute of Purchasing and Supply (UK) and a diploma in Purchasing and supplies Management from Kenya Institute of Management. He is a member of the Kenya Institute of Supplies Management (KISM), Kenya Institute of Management (KIM) and the Chartered Institute of Purchasing and Supplies (MCIPS). He joined KenGen in October 2014 and is responsible for the efficient and effective operations of the supply chain function of the Company. He is responsible for tenders, contracts, compliance, fuel & general purchases, spares and commodities, planning and inventory. Prior to joining KenGen, he worked in senior management positions at the Kenya Agricultural Research Institute, University of Nairobi Enterprises and Services (UNES) and PostBank. Departments: Tenders & Contracts and Logistics & Inventory 34


37 Chairman, Board Members, MD & CEO and ExCo members take a photo with the organising commitee of the 2016 G2G Technical Seminar at the close of the event. MD & CEO with guests on a tour of Olkaria 35

38 Managing Director & CEO s Statement The new geothermal capacity of 280MW commissioned in the course of the last financial year has improved the national installed capacity and enhanced overall system reliability 83% Additional Capacity from clean energy soures This has been a year of purposeful portfolio moves that reaffirmed our energy development agenda addressing the World Energy Council s energy trilemma. We have lived up to our ambition of diversifying our revenue streams to the next generation of industrial progress. Environmental Sustainability (Renewable Energy & Energy Efficiency) The Energy Trilemma Energy Security (Reliability & Adequency) Energy Equity (Accesssibility & Affordability) 36
39 Managing Director & CEO s Statement We have run the company in a simpler, faster and more accountable way to give us the competitive edge and cement our position as a market leader in the region. This has been through the development of geothermal and wind energy sources. Today, we offer you a consistent financial growth and business performance, with strong secure returns in a volatile world. KenGen remains steadfast in combining industrial strength with a significant financial service capability. We invested in the enterprise capability to allow KenGen to successfully execute its first commercial drilling contract. Our business is performing well, with a foundation of broad and deep competitive advantage generated from our effective human capital. We have reshaped our organizational structure to include more focused functions that drive new levels of productivity and deliver an important financial pivot. The outcome is a robust business positioned to generate increased earnings through shared capabilities while harnessing the value of collaboration. Our best days are ahead of us and we are determined to deliver for you. Optimisation of Our Resources KenGen is committed to sustaining its core business and remaining ahead of its competitors. We have adopted excellent maintenance of generation assets, optimizing operations, attracting, retaining and developing motivated workforce and adopting best practice from the best-inclass to ensure enhanced financial success. Our business drivers of plant availability, reliability, speed of response to forced outages, safety and customer satisfaction are in use to measure and monitor performance. We also continuously monitor our operations and maintenance costs of each power plant to ensure the company stays on track and is spot-on to achieve sustainable cost of doing business. The new geothermal capacity of 280MW commissioned in the course of the last financial year has improved the national installed capacity and enhanced overall system reliability. During the year, generation from the 280MW geothermal plants had a positive impact on our segment performance. The extension of the national grid to the counties of Lamu and Garissa by the Government enabled the company to decommission isolated off-grid Garissa and Lamu thermal power plants. This effectively eliminated the expensive fuel and high operation and maintenance costs from the two thermal stations. In creating more valued business, our supply chain process has been refined to a more superior function to provide a firm foundation for our operations. We leverage on robust ICT systems to create a digital space that facilitate more horizontal business solutions for customer productivity and internal speed. A volatile world puts more premium on being versatile and efficient in business through ICT infrastructure in the business value chain. As a matter of fact, 90% of our vendors downloads tenders directly from our website as opposed to the initial practice of purchasing printed tender documents. Leveraging On State-of-the-Art Technology KenGen endeavours to have an effective and efficient workforce to deliver our products cost effectively. Automation, rehabilitation and upgrade of plants are key pillars in delivering the strategy. During the year, automation and rehabilitation of control and protection systems for Tana and Turkwel power stations were finalized. The purpose was to centralize operations, enhance reliability and optimize plant availability. The original control systems for Tana power station which was prone to frequent mal-operations and failure were rehabilitated and upgraded to a more robust, user-friendly system. During the rehabilitation, staff were 37
40 Managing Director & CEO s Statement trained to enhance internal capacity and enable smooth running of the plant. Strategy KenGen is committed to energizing the country and steering the country to greater economic growth. Energy plays a key role in economic development and economic growth is an important factor in electricity demand growth. Electricity demand continues to grow and the quality of supply has improved in the last decade due to investments and expansion of the energy sector. The G2G strategy identified a number of power plants and capacity expansions projects. From 2007, KenGen has commissioned over 700MW into the grid and 83% of the additional capacity was from clean energy sources which emphasizes our commitment to renewable and sustainable forms of energy. Our future plans look promising to the country and the company with a target of 721MW by The capital investment required for the expansion project is close to USD 8.1 billion and the company is exploring other financing opportunities and models. The company has leveraged on balance sheet restructuring to raise our equity component. This will enable KenGen deliver planned projects. The Company has identified geothermal projects to be undertaken as Public Private Partnership (PPP) projects as part of project implementation. KenGen is also exploring other businesses under the new business initiative that seeks to improve our revenue stream from non-generation based revenue and has identified an industrial park in Olkaria area. The development of the KenGen Industrial Park will not only target the optimization of KenGen business operations, but also support the Government of Kenya s (GOK s) industrialization strategy as a pillar for economic growth and job creation. It is expected that this development will serve as one of the drivers for regional development and will create significant employment opportunities. Capital expansion in generation capacity is a fundamental requirement for KenGen as we seek to continue being a key player in the sector. The Company has lined up a number of projects with a total of 721MW for implementation by These projects comprise of Olkaria V 140MW, Olkaria VI 140MW, Olkaria VII 140MW, Olkaria I Unit 6 70MW, Wellheads 25MW, Olkaria I Rehabilitation 5.7MW, Olkaria I AU & IV topping plant 60MW, Meru Wind Phase I 80MW, Geothermal Wellheads 50MW and Ngong III project 10MW are at an advanced stage. We have secured the required funding from development partners. The Company has the necessary organizational capability and available talent to implement the new projects, maintain our assets to the highest possible standards. We are building capacity to provide alternative revenue streams which include: Steam revenue from operation and maintenance of steam field in Olkaria Commercial drilling services. Operation and maintenance services to private firms Geothermal spa. The development of the KenGen Industrial Park. Financial Results KenGen achieved a great milestone in revenue growth in 2016 as it marked a complete year of operation of the Olkaria 280MW power plants. Total revenue increased by 29% from Kshs.29,957 million to Kshs.38,610 million which was boosted by earnings from new geothermal capacity, steam and commercial drilling services. The Company registered growth of 49% in EBITDA from Kshs.17,821 million to Kshs.26,495 million due to improved revenues and optimization of expenses resulting in significant growth in operating profit. EBIT grew by 43% from Kshs.11,342 million in 2015 to Kshs.16,271 million in
41 Managing Director & CEO s Statement Profit before tax recorded a growth of 30% from Kshs.8,690 million in 2015 to Kshs.11,264 million in 2016 as a result of revenue growth. However, profit after tax for the year declined by 41% from Kshs.11,517 million to Kshs.6,743 million due to tax charge for the year compared to tax credit the previous year. Sustainability and Stakeholder Management KenGen recognizes the importance of sustainable management of environmental issues and the fundamental role it plays in business sustainability. Environmental performance is a shared responsibility and it is only by working together with our neighbouring communities and other stakeholders that we will make necessary progress on our journey to become truly sustainable. Through the established stakeholder coordination committees, whose membership includes the representatives duly nominated by the local communities; KenGen has built strong partnerships and improved community relations as we pursue mutually beneficial coexistence in line with our G2G transformation philosophy of being relevant from generation to generation. KenGen is planning to establish a fully fledged Carbon Development Mechanism (CDM) and finance center within the company to deliver the corporate agenda on climate change and sustainability. We continue to check our management systems against International ISO Standards through internal and external audits. This has enabled continual certification to ISO 14001:2004 Environmental Management System (EMS) and ISO 9001:2008 Quality Management System (QMS). We are in the process of establishing systems to facilitate the upgrade to ISO 9001:2015 QMS and ISO 14001:2015. Future Outlook We are continuing with the execution of our G2G Strategy. To sustain our current growth direction, we are stepping up investments to drive geothermal and wind generation capacity growth. With our internal well equipped and motivated workforce coupled with requisite funding from our bilateral partners for the projects in the pipeline, KenGen is well positioned to deliver on promise and continue to be the market leader in the provision of competitively price electric energy in the country. We are on course to deliver a total of 721MW additional capacity in the next 5 years. We have secured the required funding from development partners and internal resources for the planned major geothermal and wind projects. We are confident that this project pipeline will assure stronger revenue growth and improved profitability in the coming years. Thank you. Eng. Albert Mugo Managing Director & CEO 39

42 Taarifa ya Mkurugenzi Mkuu na Afisa Mkuu Mtendaji Mtambo mpya wa kuzalisha umeme kwa mvuke kutoka ardhini wa kiwango cha Megawati 280 ulizinduliwa katika kipindi kilichopita cha kifedha ili kimeimarisha kiwango cha kitaifa na hivyo kuimarisha mategemeo ya mfumo wa jumla. Mwaka huu umekuwa wa uhamisho maalum uliothibitisha ajenda ya maendeleo yetu kwenye sekta ya kawi huku ukishughulikia chaguo gumu la Baraza la Kawi la Kimataifa. Tumetimiza ndoto yetu ya kuwa na mbinu mbali mbali za mapato kufikia kizazi kipya cha ustawi wa viwanda. 83% Kiwango zaidi ilitokana na vyanzo salama Environmental Sustainability (Renewable Energy & Energy Efficiency) The Energy Trilemma Energy Security (Reliability & Adequency) Energy Equity (Accesssibility & Affordability) 40
43 Taarifa ya Mkurugenzi Mkuu na Afisa Mkuu Mtendaji Tumeendesha kampuni hii kwa njia sahili, ya kasi na kwa mfumo wa uwajibikaji na hivyo kutuweka kwenye upeo na kuthibiti nafasi yetu kama kiongozi kwenye eneo hili. Hii imefanikiwa kupitia kwa kustawishwa kwa vyanzo vya kuzalisha umeme kwa mvuke kutoka ardhini na pia kwa kutumia upepo. Leo, tunakupatia maendeleo sawia ya kifedha pamoja na ukuaji wa matokeo ya kibiashara katika ulimwengu huu unaobadilika. KenGen inasalia kuwa katika mstari wa mbele kwenye kuunganisha uthabiti wa viwanda na uwezo mkuu wa kutoa huduma ya kifedha. Tumewekeza katika biashara ili kuwezesha KenGen kutekeleza mkataba wake wa kwanza wa uchimbaji. Biashara yetu inafanya vizuri licha ya ushindani mkali tulio nao kutokana na rasilmali yetu ya wafanyakazi thabiti. Tumebadilisha muundo wa shirika letu kufikia shughuli zenye umakini ambazo zinaimarisha viwango vya uzalishaji na kufikia mhimili muhimu wa kifedha. Matokeo ya KenGen yamekua na kuifanya biashara yetu kuzalisha mapato mengi huku ikikuza thamani ya ushirikiano. Bado tunayatarajia mengi mazuri katika siku za usoni huku ikiwa tungali tumejitolea kuwaletea matokeo bora. Kuboresha Rasilmali Zetu KenGen imejitolea kuendeleza biashara yake kuu, kuzidi kuwaongoza washindani wake kwa kudumisha rasilamli zake, kuboresha shughuli zake, kuvutia, kudumisha na kuwaandaa wafanyakazi wenye hamasa na kujifunza mbinu bora ili kuhakikisha matokeo bora ya kifedha. Baadhi ya mambo ambayo yameimarisha biashara ni pamoja na kuwepo kwa mitambo, kasi ya mwitiko wakati wa dharura, ushahidi wa usalama, pamoja na kuridhika kwa wateja; hizi zikiwa ni hatua na vigezo vinavyotumika kupimia na kukagulia utendakazi katika utaratibu na muundo wa shirika hili. Kadhalika tumeendelea kukagua gharama za shughuli na uhifadhi wa vituo vyote vya uzalishaji umeme ili kuhakikisha kuwa kampuni hii inahimili gharama ya kufanya biashara. Mtambo mpya wa kuzalisha umeme kwa mvuke kutoka ardhini wa kiwango cha Megawati 280 ulizinduliwa katika kipindi kilichopita cha kifedha ili kimeimarisha kiwango cha kitaifa na hivyo kuimarisha mategemeo ya mfumo wa jumla. Katika kipindi hicho cha mwaka, vituo hivi vya kuzalisha kiwango cha umeme cha Megawati 280 vilikuwa na matokeo bora. Juhudi ya Serikali kuongeza mfumo wa nyaya za kupitisha umeme kufikia kaunti za Lamu na Garissa zimesaidia kampuni hii kusitisha huduma za vituo vya kuzalisha umeme kwa joto vya Garissa na Lamu. Hii imeondoa hasara inayotokana na matumizi ya mafuta ghali, shughuli nyingi na gharama za uhifadhi katika vituo hivyo viwili. Katika shughuli za kuendeleza biashara, utaratibu wetu wa usambazaji umeimarishwa ili kutoa msingi thabiti wa kuendeleza utendakazi. Ushawishi wetu umetokana na mifumo imara ya habari na Mawasiliano ili kuunda nafasi ya kidijitali inayotoa suluhu za kibiashara za kudumisha wateja na ukuaji wa kasi wa shirika hili. Katika Ulimwengu huu unaobadilika umeongeza thamani ya biashara katika kupitia muundomsingi wa habari na mwasiliano. Isitoshe 90% ya wachuuzi wetu wanapata stakabadhi za zabuni moja kwa moja kutoka kwa wavuti wetu kinyume na hali ilivyokuwa hapo awali ambapo walilazimika kununua nakala za stakabadhi. Ushawishi kupitia Teknolojia ya Kipekee KenGen inajitahidi kuwa na wafanyakazi bora na wenye uwezo wa utendakazi ili kushughulikia vilivyo masuala ya gharama za bidhaa zetu. Matumizi ya mitambo inayojiendesha kiotomatiki, urekebishaji na uimarishaji wa vituo ni nguzo muhimu sana katika kuhakikisha kuwa mkakati huu unaafikiwa. Katika kipindi hicho cha mwaka, shughuli za matumizi ya mitambo inayojiendesha kiotomatiki pamoja na urekebishaji wa mifumo ya udhibiti na ulinzi wa vituo vya umeme vya Tana na Turkwel ilikamilika. Malengo yalikuwa ni kuunganisha shughuli, kuimarisha tegemeo na kuboresha nafasi ya kituo hiki. Mifumo halisi ya 41
44 Taarifa ya Mkurugenzi Mkuu na Afisa Mkuu Mtendaji uthabiti ya kituo cha umeme cha Tana ambao kila mara ulikuwa katika hatari ya kukumbwa na hitilafu na kasoro, ulirekebishwa, kuimarishwa na kuwa imara. Wakati wa marekebisho, wafanyakazi walipewa mafunzo mapya ili kuimarisha uzalishaji na shughuli za kituo hicho. Mkakati KenGen imejitolea kuzalisha nishati nchini na hivyo kuifanya nchi kuimarika kiuchumi. Nishati inachangia pakubwa katika ustawi wa kiuchumi na ni muhimu kutimiza mahitaji ya umeme yanayozidi kuongezeka. Mahitaji ya umeme yalizidi kuongezeka na ubora wa usambazaji uliimarika katika kipindi cha mwongo mmoja uliopita kutokana na uwekezaji na uimarishaji wa sekta ya kawi. Mkakati wa G2G ulitambua miradi kadha ya vituo vya uzalishaji umeme na kuongezeka kwa uzalishaji. Kuanzia mwaka wa 2007, KenGen ilizindua zaidi ya Megawati 700 katika mfumo wa waya wa kupitisha umeme na 83% ya kiwango zaidi ilitokana na vyanzo salama vya kuzalisha nishati suala linaosisitiza kujitolea kwetu kuafikia mbinu salama za kuzalisha nishati. Mipango yetu ya siku zijazo kwa nchi na kampuni hii ni ya kutia matumaini huku tukilenga kuzindua Megawati 721 kufikia mwaka wa 2020 kama mojawapo ya mipango ya upanuzi. Mtaji wa uwekezaji unaohitajika kwa mradi wa upanuzi unakaribia Dola za Amerika 8.1 bilioni na kampuni hii inachunguza fursa nyinginezo za ufadhili na miundo. Kampuni hii imesawazisha katika muundo mpya wa mizania ili kuongeza sehemu ya hisa zisizo na riba ya kudumu. Hii itawezesha KenGen kufanikisha miradi iliyopangiliwa. Kampuni hii imetambua miradi ya kuzalisha umeme kwa mvuke kutoka ardhini inayotarajiwa kuendelezwa kupitia kwa ushirika wa umma na sekta ya kibinafsi (PPP) kama sehemu ya kutekeleza miradi hii. Kadhalika, KenGen inatafiti biashara zingine chini ya mpango huu wa kibiashara ambao unanuia kuimarisha mapato yasiyo na msingi ya kizazi na imetambua bustani ya viwanda ya Olkaria. Ustawishaji wa bustani ya viwanda ya KenGen hautalenga tu uboreshaji wa shughuli za kibiashara za KenGen bali pia utasaidia mkakati wa ukuzaji wa Serikali ya Kenya (GOK s) kama nguzo ya ustawi wa kiuchumi na uundaji wa nafasi za ajira. Kadhalika inatarajiwa kuwa hii itakuwa mojawapo ya shughuli za kuimarisha ustawi na kutoa nafasi nyingi za ajira. Upanuzi wa mtaji katika kiwango cha uzalishaji ni nguzo na hitaji muhimu kwa KenGen tunavyozidi kutaka kuwa mshiriki mkuu katika sekta hii. Kampuni hii imeorodhesha miradi kadha ya kutekelezwa itakayozalisha jumla ya Megawati 721 za umeme kufikia mwaka wa Miradi hii inajumuisha Olkaria V Megawati 140, Olkaria VI Megawati 140, Olkaria VII Megawati 140, Olkaria I Unit 6 Megawati 70, Wellheads Megawati 25, Urekebishaji Olkaria I Megawati 5.7, Mtambo wa kuongezea wa Olkaria I AU na IV Megawati 60, Meru Wind Awamu ya I Megawati 80, Geotherma Wellheads 50 Megawati na Ngong III Megawati 10 ambayo iko katika awamu za mwanzo. Tumepata ufadhili unaohitajika kutoka kwa washirika wa kimaendeleo. Kampuni hii ina uwezo pamoja na vipaji vinavyohitajika ili kushughulikia miradi mipya, kudumisha rasilmali zetu kwa viwango vya juu vinavyohitajika. Tunaunda ujazo ili kutoa mbinu mbadala za mapato ambazo ni pamoja na: Mapato kutokana na shughuli pamoja na urekebishaji wa mtambo wa mvuke wa Olkaria. Huduma za kibiashara za uchimbaji. Kutoa huduma za shughuli na urekebishaji kwa kampuni za kibinafsi. Utambuzi wa sehemu zilizo na mvuke wa kuzalisha umeme kutoka ardhini. Ustawishaji wa bustani ya viwanda vya KenGen. Matokeo ya Kifedha Katika mwaka wa 2016 KenGen imefikia makubwa katika ukuaji wa mapato kwani iliadhimisha mwaka mzima wa shughuli za kazi zake katika vituo vya uzalishaji umeme wa Megawati 280 vya Olkaria. Jumla ya mapato iliongezeka kwa 29% kutoka milioni Sh.29,957 hadi milioni Sh.38,610 ambazo ziliongezea mapato kutoka kwa kiwango cha 42
45 Taarifa ya Mkurugenzi Mkuu na Afisa Mkuu Mtendaji huduma za mvuke kutoka ardhini, mvuke pamoja na biashara ya uchimbaji. Kampuni hii iliandikisha ongezeko la 49% katika EBITDA kutoka milioni Sh.17,821 hadi milioni Sh.26,495 kutokana na mapato yaliyoimarishwa na gharama za uboreshaji na hivyo kupelekea ongezeko kubwa la faida. EBIT iliongezeka kwa 43% kutoka milioni Sh.11,342 mwaka wa 2015 hadi milion Sh.16,271 mwaka wa Kutokana na ongezeko la mapato, faida kabla ya ushuru iliongezeka kwa 30% kutoka milioni Sh.8,690 mwaka wa 2015 hadi milioni Sh.11,264 mwaka wa Hata hivyo, faida baada ya ushuru mwaka huu zilipungua kwa 41% kutoka milioni Sh.11,517 hadi milioni Sh.6,743 kutokana na ada ya ushuru ya mwaka ikilinganishwa na kodi ya muamana mwaka wa awali. Uendelevu na Usimamizi wa Washikadau KenGen inatambua umuhimu wa usimamizi wa masuala ya mazingira na mchango muhimu katika uendelevu wa kibiashara. Masuala ya kimazingira ni wajibu wa kila mmoja na ni kwa kushirikiana na jamii jirani pamoja na washikadau wengine ndipo tutapiga hatua katika safari yetu ya kiuendelevu. Kupitia kuanzishwa kwa kamati za kuratibu washikadau, zinazojumuisha washiriki walioteuliwa na jamii nyinginezo; KenGen imeunda ushirika na kuimarisha uhusiano na jamii huku tukiendelea kuinua maisha ya pamoja kuambatana na falsafa yetu ya G2G ya kusalia na umuhimu wa kutokea kizazi kimoja hadi kingine. KenGen inapanga kuanzisha Mtambo imara wa kuzalisha Kaboni (CDM) na kituo cha fedha katika kampuni hii ili kuafikia maono ya shirika hili kuhusiana na mabadiliko ya hali ya anga na uhimili. Tunazidi kuangalia mifumo yetu ya usimamizi kuambatana na Viwango vya Kimataifa vya ISO kupitia ukaguzi wa ndani na nje. Hii imesaidia kuzidi kuthibitishwa katika Mfumo wa Usimamizi Mazingira (EMS) wa ISO 14001:2004 na Mfumo wa Kusimamia Ubora (QMS) wa ISO 9001:2008. Tuko katika harakati za kuanzisha mifumo ya kuwezesha ustawi na makubaliano kuambatana na QMS mpya ya ISO 9001:2015. Mtazamo wa Siku Zijazo Tunaendelea kutekeleza mkakati wetu wa G2G. Ili kuhimili mkondo wa ukuaji wa sasa, tunaimarisha uwekezaji ili kuongeza uzalishaji wa umeme kwa mvuke kutoka ardhini na kupitia upepo. Pamoja na wafanyakazi wetu wenye ujuzi na motisha, pamoja na ufadhili kutoka kwa washirika wetu wa kibiashara katika miradi iliyo mbioni, KenGen iko katika nafasi bora kutimiza ahadi na kuzidi kuongoza katika uzalishaji wa nishati yenye bei nafuu nchini. Tuko mbioni kuafikia jumla ya Megawati 721 zaidi za umeme katika kipindi cha miaka mitano ijayo. Tumepata ufadhili unaohitajika kutoka kwa washirika wa kibiashara na vyanzo vya ndani ili kufadhili miradi mikuu ya kuzalisha umeme kwa mvuke kutoka ardhini. Tuna imani kuwa mradi huu utahakikisha ongezeko la mapato na kuimarisha faida katika miaka ijayo. Shukrani Mhandisi, Albert Mugo Mkurugenzi Mkuu na Afisa Mkuu Mtendaji 43

46 44

47 CORPORATE GOVERNANCE KenGen is committed to the highest standards of corporate governance underpinned by the four core values of responsibility, accountability, fairness and transparency which are the founding blocks that ensure that the strategic objectives of the Company are set, attained and performance monitored. Corporate Governance is the process through which the Board directs, controls and is held to account by the shareholders.it offers the framework for engagement and interaction between the Company s Board, management, stakeholders and regulators for the sustainable benefit of the shareholders. 45
48 Corporate Governance Statement Statement of Compliance KenGen ascribes to its continuing obligations as a listed company in compliance with the Capital Markets Authority (CMA) Code of Corporate Governance Practices for Issuers of Securities to the Public 2015 and the ethical standards prescribed in the Company s Code of Conduct. The Board has signed the Code of Governance for Government Owned Entities (Mwongozo Code) which offers guidance to all state corporations on governance. The Mwongozo Code is in sync with the CMA Code of Corporate Governance Practices for Issuers of Securities to the Public As a law-abiding corporate citizen, the Company lives the tenets of the Constitution of Kenya and complies with the provisions of relevant statutes, including but not limited to the Energy Act 2006, Public Procurement & Asset Disposal Act 2015, Public Finance Management Act 2015, Employment Act 2007 and Occupational Safety & Health Act The Company is pursuing compliance with the Companies Act 2015 within the next financial year. Adherence to the highest ethical standards and embracing global best practice in KenGen s decision-making structures has ensured compliance with applicable legal principles. The corporate vision, mission and core values underpin the Company s transformation philosophy of achieving sustainability in value creation from generation to generation. During the year, the Company was re-certified in ISO 9001:2008-Quality Management System and ISO 14001:2004-Environmental Management System. This is a recognition and demonstration of continual excellence in the organization s operations. KenGen in its enviable position as a listed company, actively participated in the review of various investorspecific legislation conducted by CMA to influence and lobby the outcome in the interest of the shareholders. KenGen is represented in the Working Group One Committee of the Capital Markets Master Plan (CMMP) which was officially launched in November The CMMP is a 10-year strategic blue print for the Kenyan capital markets in which the Working Groups provide the operational implementation path for the actualization of long term financial and economic goals set out in the national development plan. Board Charter The Board Charter guides the Board in the exercise of its responsibilities by providing a concise overview of: Conduct of board meetings and procedures, and the nomination, appointment, induction, training and evaluation of members of Board Policies and practices of the board on matters of corporate governance, directors declarations and conflict of interest The separation of the roles, functions, responsibilities and powers of the Board and individual directors Board Charter Powers delegated to the Board committees of the Company Matters reserved for final decision-making by the Board The Charter does not in any way purport to replace or supersede any laws and regulations that govern the 46

49 Corporate Governance Statement Board Composition The KenGen Board is made of eleven (11) members comprising a non-executive Chairman, one executive Managing Director & CEO, the Cabinet Secretary- National Treasury, Principal Secretary-Ministry of Energy & Petroleum, plus seven non-executive directors. Further, four (4) members are independent directors as per the new Code of Corporate Governance Practices for Issuers of Securities to the Public, The composition of the Board is as outlined in the Articles of Association of the Company. During the last Annual General Meeting and as per the Articles of Association of the Company on Rotation of Directors; three Board members retired and two new independent non-executive directors were elected by the shareholders to join the KenGen Board. Board Diversity The Board has the following diverse set of skills: Gender Diversity Procurement Specialist Geochemist Lawyer KenGen rule continues to comply with the 1/3 gender diversity as outlined below: Definition of an Independent Director The Code of Corporate Governance Practices for Issuers of Securities to the Public, 2015 was issued by the Capital Markets Authority for application by both listed and unlisted public companies. 3 Female 8Male The new code defines an independent director as a member of the board of directors who does not have a material or pecuniary relationship with the company or related persons, is compensated through sitting fees or allowances, does not own shares in the company. After nine years of service, a continuing independent director ceases to be one and assumes the position of a nonexecutive director. The biographies of the Directors are published on pages 20 to 23. Board Effectiveness Separation of Powers & Duties of the Chairman and Managing Director & CEO The separation of the functions of the Chairman and the Managing Director& CEO ensures the independence of the Board and Management. The requisite balance of power, increased accountability, clear definition of responsibilities and improved decision making is attained through this distinction between the non-executive and executive roles. 47


50 Corporate Governance Statement Role of the Board The Board offers strategic guidance, leadership and control of the Company by defining its strategic intent, objectives and values; reviews this strategic direction and adopts business plans proposed by management. With retention of full and effective control over the Company, the Board monitors Management s implementation of the plans and strategies, ensures ethical behaviour and compliance with relevant laws & regulations, audit and accounting principles, corporate policies and procedures and the code of ethics. The Board evaluates the perfomance of Management against targets and objectives and benchmarks performance of the Company against best international practices. The Board considers and approves the Company s overall budget and specific proposals for capital expenditure & acquisitions plus strategic opportunities. It reviews succession planning for the management team and approves senior executive appointments, organisational changes and remuneration. The Board constitutes and reviews composition of Board Committees and approves reports and performance of each Board Committee. It further approves the quarterly, interim and preliminary financial statements, annual report from the Managing Director & CEO and public announcements of a material nature. 48

51 Corporate Governance Statement Directors Responsibilities The Articles of Association of the Company and the Board Charter enumerate the responsibilities of the Directors. Execution of the mandate of the Board requires each director to observe a code of conduct aligned to his/her duties and responsibilities to the Company and shareholders, and act within limitations as defined in the Charter while in observance of principles of good corporate governance. Each Director subscribes to uphold and promote effective and responsible use of Company resources and undertakes to act in good faith, with care and prudence in the best interest of the Company while exercising his/ her power and executing his/her duties. The Directors are expected to familiarise themselves with the relevant regulations and statutes, the Memorandum and Articles of Association of the Company, the Board s operating norms and procedures, and any other issues necessary for the discharge of their duties Further, the Directors commit that, while taking into account the financial impact of their decisions, they shall consider the consequences for sustainable development, effect on relations with stakeholders and interest of the society in general. Directors are expected to be fully aware that they are individually and collectively responsible for deciding the Company s vision, mission and values, its strategic objectives, ensuring the establishment of the organisational structure, putting in place policies to achieve the objectives as well as ensuring effective control over the Company and accounting to shareholders. Board Effectiveness The Board has an elaborate program based on good governance practices to ensure the development of the Board members in various business and governance areas in order to strengthen the Board s oversight role and promote Board effectiveness. Induction Upon appointment to the Board, new Directors embark on a detailed programme to familiarize themselves with the Company s business and operating environment. Various corporate literature is provided and meetings arranged with senior management team. Visits to power stations are also organized. During the year, the new Directors undertook this programme. Continuous Professional Development During the year, the Directors undertook various training and development programs in Risk Management and relevant energy conferences to ensure they update their skills and knowledge, as well as keep abreast of the developments in corporate governance. Biennially, the members of the Board attend the specialised 5-day Corporate Governance Training for Director s offered by the Centre for Corporate Governance, Kenya. Board Evaluation The Board conducts an annual evaluation process on the Board as an entity, its Committees and each individual Director to gauge the Board s performance. This is done by an independent consultant. 49
52 Corporate Governance Statement The Company Secretary The Company Secretary, who is a member of the Institute of Certified Secretaries of Kenya (ICPSK), is the Secretary to the Committees of the Board with the exception of the Audit and Risk Management Committee. She offers the critical role of supporting the Board on procedural and regulatory matters while ensuring the Company adheres to the Board Policies and Procedures. Board Meetings The Board meets at least once every quarter or more often in accordance with the requirements of the business. The Board work plan and calendar is prepared in advance. Adequate notice is given for each Board meeting and the agenda and papers circulated in good time. The Board was reconstituted in January 2016 when two (2) new members were appointed at the AGM. The Board held 12 meetings which were attended as follows: Name Attendance 1. Joshua Choge Albert Mugo Humphrey Muhu (alternate 11 director to Henry Rotich) 4. Momata Gichana (alternate 11 director to Joseph Njoroge) 5. Dorcas Kombo Ziporah Ndegwa Millicent Omanga Musa Arusei Kairu Bachia Joseph Sitati 6 (Appointed in December 2015) 11. Maurice Nduranu 6 (Appointed in December 2015) (Hedrick Omanwa and Henry M Narobi attended meetings until 16th December 2015 when they retired from the Board) Individual Directors Shareholding No member of the Board holds shares in his or her personal capacity that exceeds 1% of the total shareholding of the company. The breakdown of the Directors personal shareholding in the Company as at 30th June 2016 is as follows: Name No. of Shares % holding Joshua Choge 14, Albert Mugo 2,203, Henry Rotich - - Joseph Njoroge - - Dorcas Kombo 150, Ziporah Ndegwa - - Millicent Omanga - - Musa Arusei - - Kairu Bachia 213, Joseph Sitati - - Maurice Nduranu 10, Humphrey Muhu 7, Momata Gichana - - Directors Remuneration The Board endeavours to establish and approve formal and transparent remuneration policies to attract and retain both executive and non-executive Board members. These policies clearly stipulate remuneration elements such as directors fees, attendance allowances and bonuses and shall be competitive and in line with remuneration for other directors in the same industry. In accordance with the guidelines provided in the State Corporations Act and the shareholder approval granted at the Annual General Meeting, the Directors are paid taxable sitting allowances for every meeting attended, as well as travel and accommodation allowance while 50
53 Corporate Governance Statement on Company duty. The Chairman is paid a monthly honorarium. KenGen does not grant personal loans or guarantees to its Directors. It is proposed that each Director receive fees of Kshs.600,000 per annum for the financial year ended 30th June No loans were granted to any non-executive director. Declaration of Interest and Conflict of Interest The Directors are obligated to fully disclose to the Board any real or potential conflict of interest, which comes to his/her attention, whether directly or indirectly. The statutory duty to avoid situations in which they have or may have interests that conflict with those of the Company has been observed by the Board. All business transactions with all parties, directors or their related parties are carried out at arms length. An acknowledgement that should it come to the attention of a Director that a matter concerning the Company may result in a conflict of interest, obligates him/her to declare the same and exclude himself/herself from any discussion or decision over the matter. which each Board member signs before commencement of any meeting of the Board. Business transactions with the directors or their related parties are disclosed on page 161. Company policies on risk management, information technology, procurement, corporate social responsibility & investment and conflict of interest are viewed as important for strategic focus. Disclosure on environmental, social and governance policies and implementation including a whistle blowing policy is deemed vital in the corporate culture. All the Board Committees including the Audit & Risk Management Committee are established with written terms of reference detailing their mandate, authority and duties. The appointment of new members to the Board at the last Annual General Meeting resulted in the reconstitution of the membership of the Committees in January At every Board meeting, an agenda item exists which requires members to make a declaration of any interest they may have in the business under discussion. The Company maintains a Conflict of Interest (CoI) Register 51

54 Corporate Governance Statement Report from the Chairperson of the Audit & Risk Management Committee Dorcas Kombo Mandate The Audit & Risk Management Committee s duties are based on six broad functions namely the Internal Control, Risk Management & Compliance, Financial Reporting, Internal Audit, External Audit, Compliance with laws and regulations; and Compliance with the Company s Code of Conduct and ethical guidelines. The Committee assesses effectiveness of the Company s internal control and risk management & compliance framework. It reviews the impact of significant accounting and reporting issues such as professional and regulatory pronouncements; meets the management and both external & internal auditors to review the financial statements and results of the audit process; and assesses if generally accepted accounting principles have been consistently applied within the preparation of preliminary announcements & interim financial statements. The Committee is responsible for the internal audit & risk management function by ensuring management acts on audit and risk management reports; reviews the performance and considers the independence of the external auditors; and confirms that all regulatory compliance is considered in the preparation of financial statements; and its meetings and invites a representative of the external auditors when reviewing the audited results. Membership It comprises of five non-executive directors with two being independent directors. Appointment to the committee is for a period of three years which may be extended for two further three-year periods provided the director remains independent. The Internal Audit Manager is the Secretary to the committee. This appointment is based on best practice and aims to increase the independence of the oversight and assurance function of the committee. The Committee routinely invites the Finance & Commercial Director and Internal Audit Manager who are both members of the Institute of Certified Public Accountants of Kenya (ICPAK) to its meetings. It also invites a representative of the external auditors when reviewing the audited results Attendance The Committee held 7 meetings which were attended as follows: Attendance Name July Dec Dorcas Kombo 7 2. Humphrey Muhu (Alternate director to Henry Rotich) 6 3. Kairu Bachia 7 Jan Jun Momata Gichana * 3 5. Joseph Sitati * 3 *Momata Gichana and Joseph Sitati joined the Committee in January (Hedrick Omanwa and Millicent Omanga were members of the Committee until December H. Omanwa (Chairman then) attended 4 meetings while M. Omanga attended 4 meetings.) 52

55 Corporate Governance Statement Report from the Chairperson of the Strategy Committee Kairu Bachia Mandate The Strategy Committee assists the Board in discharging its oversight duties with respect to the overall strategic direction of the Company, operational performance and organizational health. The Committee reviews the Company s strategy and investment policies and makes recommendations to the Board on issues of strategy adjustment. It also assesses the progress of the Company s Strategy execution plans through identification of priority areas. The Committee monitors, evaluates and oversees the Company s health including the review of financial and business plans and the overall performance management system. Membership Its membership consists of four non-executive directors and the Managing Director & CEO. Attendance The Committee held 6 meetings which were attended as follows: Name Attendance July Dec 2015 Jan Jun Kairu Bachia * 3 2. Humphrey Muhu (Alternate director to 5 Henry Rotich) 3. Dorcas Kombo * 3 4. Musa Arusei * 3 5. Albert Mugo 6 *Kairu Bachia, Dorcas Kombo and Musa Arusei joined the Committee in January (Henry M Narobi, Hedrick Omanwa and Ziporah Ndegwa were members of the Committee until December 2015 H. M Narobi (Chairman then) attended 3 meetings, H. Omanwa attended 3 meetings while Z. Ndegwa attended 3 meetings.) 53

56 Corporate Governance Statement Report from the Chairperson of the Human Resource Committee Musa Arusei Mandate The Committee monitors KenGen policies and practices in relation to the Human Resources, offers advice and recommendations on the Company s human resource strategies, initiatives and policies; and the nomination and remuneration of directors and senior management. The Committee s duties are based on three broad functions namely the human resources, nominating and remuneration. Human Resources function The Committee continually reviews the organizational structure, core functions and optimum establishment; policies and procedures on staff recruitment and selection, staff training and development for operational efficiency, performance and reward system and capacity enhancement & reviews the terms and conditions of service in line with the organisation s strategy. Further it reviews the Company s human resource policies and recommends amendments to the Board for approval. Nominating function The Committee supports and advices the Board on the appropriate size and composition to enable it discharge its responsibilities. It also recomend transparent procedures for selecting new directors for appointment and re-selection to the Board; and responsible for the evaluation of the performance of the Board, the various committees and individual directors. Remuneration function The Committee reviews the Company s remuneration, recruitment, retention, incentive and termination policies and procedures for executive directors and senior managers; their basic salary & the criteria for payment of bonuses to all staff and monitors its operation, considers recommendations of the Chairman or Managing Director & CEO of the Company regarding payment of bonuses or performance related remuneration. Membership Its membership consists of four non-executive directors and the Managing Director & CEO. The Committee is authorised by the Board to secure the attendance of external advisers at its meetings if it considers this necessary and to obtain reliable, up-todate information about any of its business. Attendance The Committee held 6 meetings which were attended as follows: Attendance Name July Dec Musa Arusei 6 2. Momata Gichana (Alternate director to 5 Joseph Njoroge) 3. Millicent Omanga * 2 4. Ziporah Ndegwa * 2 5. Albert Mugo 6 Jan Jun 2016 *Millicent Omanga and Ziporah Ndegwa joined the Committee in January (Henry M Narobi and Dorcas Kombo were members of the Committee until December H. M Narobi attended 4 meetings while D. Kombo (Chairperson then) attended 4 meetings.) 54

57 Corporate Governance Statement Report from the Chairperson of the Procurement Oversight Committee Ziporah Ndegwa Mandate The Committee is mandated to have oversight for strategic procurements of over Kshs.50 million. It also approves all the annual procurement plans and discusses quarterly procurement reports for submission to the Board. The Committee has the oversight role to ensure compliance with procurement laws and regulations. Membership Its membership consists of four non-executive directors and the Managing Director & CEO. Attendance The Committee meets once every month or when strategic procurements need to be reviewed. The Committee held 12 meetings which were attended as follows: Attendance Name July Dec Ziporah Ndegwa Millicent Omanga Musa Arusei * 7 4. Maurice Nduranu * 7 5. Albert Mugo 12 Jan Jun 2016 *Musa Arusei and Maurice Nduranu joined the Committee in January (Joshua Choge and Henry M Narobi were members of the Committee until December J. Choge attended 5 meetings while H. M Narobi attended 4 meetings.) 55

58 Corporate Governance Statement Report from the Chairperson of the Capital Raising Committee Millicent Omanga Mandate The Committee was established to oversee the activities of the Financial Arranger and Advisor in particular, adherence to the terms of reference of the contract signed with KenGen. The Committee in its mandates oversees capital raising and balance restructuring activities including the recently concluded Rights Issue. The Committee oversees the implementation of the overall investment plan for the PIBO funds as per the Information Memorandum, ministerial approvals and asset allocations for cash and cash equivalents with respect to fixed-income securities, and equities. It reviews management s short term investment recommendations, including permissible types of investments, with respect to uncommitted PIBO funds and advises as necessary. The Committee on a quarterly basis or at such times as required by business volume, reviews the investment performance of the PIBO funds to ensure adequate and competitive returns. It reviews at least semi-annually the repayment of the PIBO funds to ensure fulfilment of repayment obligation, adequacy of cash flow and any other factor that may be necessary to monitor. It also monitors on a quarterly basis the Company s key financial ratios and other issues relevant to the PIBO Fund. Membership Its membership consists of four non-executive directors and the Managing Director & CEO. Attendance The Committee held 4 meetings which were attended as follows: Name Attendance July Dec Millicent Omanga * 2 2. Humphrey Muhu (Alternate director to 4 Henry Rotich) 3. Joseph Sitati * 2 4. Maurice Nduranu * 2 5. Albert Mugo 4 Jan Jun 2016 * Millicent Omanga, Joseph Sitati and Maurice Nduranu joined the Committee in January (Momata Gichana, Kairu Bachia and Musa Arusei were members of the Committee until December M. Gichana attended 2 meetings, K. Bachia attended 2 meetings while M. Arusei (Chairman then) attended 2 meetings.) 56
59 Corporate Governance Statement Executive Management Committee (ExCo) ate The Managing Director & CEO and all the Divisional Directors makeup the ExCo. This Committee serves as a link between the Board and Management. ExCo s mandate and responsibility is to ensure compliance with the statutory and regulatory framework, and guidelines and adherence to Company policy and procedures. Its meetings are convened on a weekly basis to discuss strategy formulation and implementation, policy matters and financial performance. Internal Controls & Risk Management The Board affirms its responsibility for the Company s system of internal financial control, including taking reasonable steps to ensure that adequate systems are being maintained. Effective internal control systems to assess and mitigate any risks to which the Company may be exposed to, for effective internal financial management have been operationalised. A comprehensive policy on the risk management framework to identify, measure and manage all key risks has put in place by the Board and integrated in the overall management reporting structure. These risks are further demarcated onto the Strategic Corporate Risk Matrix which is closely monitored by the Board. The Audit & Risk Management Committee of the Board regularly reviews the effectiveness of the internal control system. The Head of the Internal Audit & Risk Management Department reports directly to the Audit & Risk Management Committee of the Board. culture throughout the organisation. The core values of integrity, professionalism, team spirit and safety culture steer our Company s organizational health and decision-making processes. Owing to the dynamic business environment, the Company periodically conducts reviews such as culture baseline surveys view of the dynamic business environment with a view to improving the existing culture in the organisation. The Company has a whistle blowing policy in place and is in the process of setting up an anonymous whistle-blower hotline to be managed by an independent, accredited and external institution. Through the hotline, anonymous reports on unethical/fraudulent behaviour will be made without fear of retaliation from the suspected individuals. The Company conducts its business in compliance with relevant legal principles and high ethical standards. The Board, Management and employees are required to observe the code and high standards of integrity. Further, these standards are applied in all dealings with customers, suppliers and other stakeholders. Ethics and Code of Conduct At KenGen, good corporate governance is engrained as a valuable contributor to the long-term success of the Company through the creation of the right 57
60 Corporate Governance Statement Going Concern The Board confirms that the Company has adequate resources to continue in business for the foreseeable future. For this reason, it continues to adopt the going concern basis when preparing the financial statements. Engagement with Shareholders In the endeavour to actively engage with shareholders, KenGen strives to provide regular and timely information. The interim and annual results are always published in the local daily newspapers. In accordance with Article 137 of the Articles of Association of the Company, the Annual Report & Accounts is posted on our website www. kengen.co.ke at least 21 days before the Annual General Meeting (AGM) to ensure that all the shareholders are well informed at the AGM. Further, the Company s website offers a platform for shareholders to quickly access corporate information. All Directors attended the last AGM held on 16th December 2015 and were available to answer questions from shareholders. Shareholding In line with the Continuing Obligations for listed companies as prescribed by the Capital Markets Authority and the Nairobi Securities Exchange, KenGen files investors returns on a monthly basis. LIST OF TWENTY LARGEST SHAREHOLDERS AS AT 30 JUNE 2016 Number of % Shares 1 CABINET SECRETARY - THE NATIONAL TREASURY 4,615,424, % 2 CFCSTANBIC NOMINEES LIMITED NR ,696, % 3 CFCSTANBIC NOMINEES LIMITED NR ,567, % 4 KENYA COMMERCIAL BANK NOMINEES LIMITED A/C 915A 76,637, % 5 STANDARD CHARTERED NOMINEES RESD A/C KE ,634, % 6 STANDARD CHARTERED NOMINEES RESD A/C KE ,702, % 7 STANDARD CHARTERED NOMINEES RESD A/C KE ,767, % 8 STANDARD CHARTERED NOMINEES NON-RESD. A/C 9287P 54,000, % 9 STANDARD CHARTERED NOMINEES LTD A/C KE ,000, % 10 STANDARD CHARTERED NOMINEES NON RESIDENT A/C ,000, % 11 STANDARD CHARTERED NOMINEE ACCOUNT KE ,300, % 12 GOODWILL (NAIROBI) LIMITED A/C ,500, % 13 STANDARD CHARTERED NOMINEES NON -RESD. A/C ,000, % 14 CFCSTANBIC NOMINEES LTD A/C R ,852, % 15 NIC CUSTODIAL SERVICES A/C ,331, % 16 KENYA COMMERCIAL BANK NOMINEES LIMITED A/C 1018C 13,260, % 17 RAMESHCHANDRA KHETSHI SHAH 12,619, % 18 CO-OP CUSTODY A/C ,140, % 19 RAMABEN SUMANTRAI PURSOTTAM PATEL 10,288, % 20 STANDARD CHARTERED NOMUNEES NON-RESD. A/C ,718, % 192,612 other Shareholders 889,431, % Total 6,243,873,779*
61 Corporate Governance Statement DISTRIBUTION OF SHAREHOLDERS No. of % Shareholding Range Shareholders Shares ,133 19,769, % 501-1,000 35,541 28,849, % 1,001-5,000 50, ,789, % 5,001-10,000 17, ,911, % 10,001-50,000 6, ,769, % 50, , ,334, % 100, , ,072, % 500,001-1,000, ,229, % Above 1,000, ,636,147, % Total 192,632 6,243,873,779* INVESTOR POOLS No. of Shareholders Shares % Shareholding Local Institutions 8,068 5,158,194, % Local Individuals 183, ,793, % Foreign Investors ,885, % Total 192,632 6,243,873,779* % *During the Rights Issue, 272 shareholders made payments amounting to Kshs 5,087, but their applications had not been attached. These shareholders would receive 775,310 shares fully paid for subject to regularization of the applications within a reasonable period but not later than the Annual General Meeting of the Company otherwise the Board would deal with those shares in a manner it deems fit. After considering the above the total alloted shares amount to 4,045,512,323 ordinary shares with a par value of Kshs.2.50 each in the Company. 59
62 60

63 REVIEW OF OUR PERFORMANCE 61
64 Review of Our Performance GOVERNMENT OF KENYA PERFORMANCE CONTRACT REPORT 2016 The GoK is committed to clearly defining the working relationship between itself and the State Corporations. The GoK recognises the need for adequate and reasonable managerial and operational autonomy to facilitate achievement by the Board and Management of KenGen of the agreed and freely negotiated performance targets set out in the Performance Contract. The purpose of the Performance Contract is to establish clarity and consensus about priorities for the Corporation s management in order to: 1. Ensure that systems are established to ensure equality of all users of public services is achieved; 2. Ensure impartiality and fairness in the process of delivery of public services; 3. Ensure promotion of National Cohesion and National Values; 4. Ensure continuity of public services under all circumstances; 5. Establish systems to enable innovativeness and adaptability of public services to the needs of users; 6. Ensure professionalism and ethics in public service is achieved and maintained; 7. Establish systems to ensure promotion and protection of rights of users of public services and public servants as enshrined in the Bill of Rights; 8. Institutionalize a culture of accountability, integrity, transparency and promotion of values and principles of public service; 9. Ensure a corruption free public service; and 10. Ensure effective, efficient and responsible use of public resources. During the year, the Company executed the agreed targets but the final performance evaluation by the government is still awaited to be carried undertaken. However, from a self-evaluation perspective and in accordance with last financial year s criteria, we achieved an Excellent status. A summary of the performance is as follows: FINANCE & STEWARDSHIP 1. Pre-Tax Profit Audited Pre-tax profit was Ksh billion against a target of Ksh billion, mainly due to increase in revenue from Olkaria I & IV and Wellheads; steam and drilling revenue and lower operating costs. 2. Return on Investment Return on investment (RoI) was above target due to lower operating expenses as well as the improved profitability and increase in assets as a result of revaluation. 3. Development Index (DI) Development Index was below target for the year mainly due to some delay of projects such as Olkaria I Unit 6, Olkaria V, Olkaria VI and Ngong III. A. SERVICE DELIVERY INDICATORS 4. Customer Satisfaction KenGen being a listed company at the Nairobi Securities Exchange (NSE), prides itself in customer service and satisfaction. The process of procuring an independent consultant to conduct customer and stakeholder satisfaction survey as a way of getting feedback from customers and stakeholders is underway. 5. Service Delivery Innovations We enhanced service delivery efficiency through development of the following two (2) innovations: i) Supplier Relationship Management System; and ii) Geothermal drilling using Polycrystalline Diamond Compact (PDC) bits: The Company tested the use of PDC. 62
65 Review of Our Performance 6. Resolution of Public Complaints The Company ensured prompt resolution of public complaints referred directly or channelled through the Commission on Administrative Justice (CAJ). In the period, the company obtained a certificate issued by Commission on Administrative Justice. 7. ISO 9001:2008 Certification KenGen complied with the standards stipulated for the purpose of maintaining certification status and achieved re-certification to QMS ISO9001:2008 and EMS ISO14001:2004 from Bureau Veritas in July 2015 valid for 3 years. 8. Automation In the current financial year, the Company kept in pace with developments in Information and Communication Technology (ICT). B. NON-FINANCIAL INDICATORS 9. Implementation of the Strategic Plan The Company continued in implementing activities outlined in the Strategic Plan Implementation Matrix 2015/16. This was by driving divisional strategic initiatives and service level agreements in line with corporate performance goals. 10. Asset Management The Board made best use of company equipment, machinery, tools and property in order to maximize taxpayers value. This included: i) Inventory Management; ii) Annual maintenance and repair programme of all its plants; and iii) Disposal of Idle Assets and in full conformity with the Environmental Management Act, Public Procurement and Asset Disposal Act and any other existing legal requirement. 11. Youth Internship / Industrial Attachment / Apprenticeship In the contract period, the Company progressively involved youth in internship / industrial attachments. About 1,200 youth were offered skills transfer through the internship program. 12. Youth, Women and Persons with Disabilities Empowerment The Company supported empowerment of youth, women and persons with disabilities by awarding tenders amounting to Ksh. 304 million to enterprises owned by the youth, women and persons with disabilities. 13. Compliance with the Constitution The Company ensures all the provisions in the Constitution related to KenGen s mandate are complied to and implemented. The Company ensured all relevant articles in the Constitution are followed and a compliance Audit done to identify gaps to be addressed. 14. Compliance with Statutory Obligations The Company conforms to laws and regulations related to and not limited to the following: Public Procurement and Disposal Act, Remittance of statutory deductions, Disability Mainstreaming, Gender Mainstreaming and Environmental Sustainability. 15. Safety and Security Measures The Company implemented all aspects related to safety and security of personnel, documents, information, equipment and assets. A safety and disaster preparedness mechanism was put in place to address current insecurity issues affecting the country. Measures taken included: - Emergency drills to evaluate staff response were conducted at all business areas; - Security awareness including terrorism was carried out; - Implementation of an Integrated Information Security Management System (ISMS) is ongoing ; 63
66 Review of Our Performance C. OPERATIONS 16. Ministries Departments & Agencies (MDA) Priority Indicators (Electricity Generation Growth) KenGen continued to implement six (6) projects with a total additional capacity of 476MW. These are: i) Wellhead Project (25MW) ii) Olkaria I Rehab (51MW) iii) Olkaria I Unit 6 (70MW) iv) Olkaria V (140MW) v) Olkaria VI (140MW) vi) Meru Wind - Phase I (80MW) 17. Capacity Utilization / Plant Availability KenGen s plant availabilities are based on threshold targets and in accordance with the different generation modes. These are in harmony with industry practice that provides for planned and unforeseen machine outage and are as per the signed Power Purchase Agreements with the off-taker Kenya Power. 18. Ease of Doing Business The Board played its part in fostering an environment favourable for business while making the country globally competitive. Investors and shareholders were protected through full disclosure of information and adherence to all set standards, laws and regulations. These included: i. 2014/15 annual reports were made public and posted on the KenGen website; ii. A shareholders tour was conducted in November 2015; iii. Payment of dividends was made in February 2016; iv. Adoption of e-procurement done with all tenders being uploaded on IFMIS. D. DYNAMIC / QUALITATIVE INDICATORS 19. Human Resource Management and Development The Company addressed the following indicators: i) Pension Management: - Identification of staff due to retire in 4 years and pre-retirement training of 60 staff was undertaken. ii) Competency development activities implemented for systematic enhancement of skills and proficiencies to address career progression of employees and improve institutional performance. These included: a. Skills / competence needs assessment and intervention programs: b. Knowledge management: organizational knowledge is captured, developed, shared and effectively used. Appropriate documentation and communication channels to store and transfer knowledge were set and include: i. An annual technical seminar conducted in July 2015; ii. Forums for sharing experiences, known as Communities of Practice and Innovation, are being established in all the company areas; and a. Prevention of Alcohol and Drug Abuse (ADA) the Workplace Policy on ADA is consistently implemented and sensitization on Alcohol and Drug Abuse conducted at all areas of operations; iii) Prevention of HIV/AIDS Infections activities implemented to mitigate against HIV/AIDS and achieve the Kenya AIDS Framework objectives included: a. Budget allocation per quarter for HIV programmes ; b. Interventions implemented in line with Combination Prevention Approach are: Condom promotion: Counselling and testing: VCT Counselling sessions were held in various area offices. Promoting Wellness amongst staff: Forums were held with themes on Effects of HIV Aids Stigma and ADA in the work place; 20. Corruption Eradication The Company prevents corruption, unethical practices and promote standards and best practices in governance in line with the Ethics and Anti-Corruption Commission Act no. 22 of 2011 and the Leadership and Integrity Act The Company implemented various key indicators 64

67 Review of Our Performance - approved Annual Procurement Plan; Gift Registers operationalized across the Company; Integrity Assurance Officers trained, Whistle blowing on corruption and unethical conduct is encouraged and both and drop box options were put in place. 21. Mwongozo Code of Conduct KenGen Board signed off Mwongozo - the Code of Governance for State Corporations on 1st April A Baseline Survey on governance was done during the year. 23. President s Annual Report on National Values and Principles of Governance The Company implemented commitments from the Presidential Annual Report on national values and principles of governance: Campaigns against corruption awareness creation are being sustained and KenGen submitted an annual report that will form part of the Presidential Report on National Values and Principles of Governance to the Directorate of National Values and National Cohesion. 22. Promote Realization of National Cohesion and Values KenGen promotes national values and principles of governance and create a peaceful and cohesive nation. Quarterly reports were submitted to the Directorate of National Cohesion and National Values. H.E Uhuru Kenyatta, the President of the Republic of Kenya and H.E. Paul Kagame, the President of Rwanda during the official commissioning of the Olkaria I AU 140MW Geothermal Power Plant 65

68 Review of Our Performance H.E Uhuru Kenyatta, the President of the Republic of Kenya and H.E. Paul Kagame, the President of Rwanda during the official commissioning of the Olkaria I AU 140MW Geothermal Power Plant 66
69 Review of Our Performance REVIEW OF OUR OPERATIONS AND FINANCIALS Operations Overview We added 15MW of wellhead power plants to our fleet bringing our total installed capacity to 1,630MW. However, the increase was partly offset by the decommissioning of 9MW in two isolated off-grid thermal plants in Garissa and Lamu when the two counties were connected to the national grid. Total electricity sales grew by 11% from 7,027GWh in 2015 to 7,819GWh in This increase is attributable to a growth in sales from geothermal and hydro segments arising from completion of projects and favourable hydrological conditions respectively as shown in Table I. Growth In Electricity Sales Table 1: Growth in Electricity Sales Units Sold (GWh) 30 June June 2015 Change Source GWh GWh % Hydro 3,784 3,308 14% Geothermal 3,543 3,104 14% Thermal % Wind % Total 7,819 7,027 11% Financial Overview During the year under review, the Company recorded growth in revenue, profitability and asset base which is in line with our expectations since the adoption of the G2G Strategy. 67
70 Review of Our Performance Table 2: 2016 Results Change Kshs 000 Kshs 000 % Revenue Electricity revenue 29,543,488 25,602,038 15% Steam revenue 6,856,018 3,689,361 86% Other income 2,210, , % 38,609,556 29,957,301 29% Expenses Operating expenses (8,947,868) (8,447,406) 6% Steam Costs (3,167,173) (3,689,361) -14% Depreciation & Amortisation (10,223,370) (6,478,945) 58% Operating Profit 16,271,145 11,341,589 43% Compensating tax (2,431,022) - 100% Interest income 556, ,082 55% Finance costs (3,132,187) (3,010,659) 4% Profit Before Tax 11,264,044 8,690,012 30% Tax (expense)/credit (4,520,552) 2,827, % Profit for the Year 6,743,492 11,517,327-41% Electricity revenue grew by 15% from Kshs.25,602 million to Kshs.29,544 million. This was mainly attributed to additional capacity from 280MW geothermal power plants which for the first time were operational for the full year. 68
71 Review of Our Performance Table 3: Electricity Revenue 30 June 30 June Change Kshs mil Kshs mil % Capacity revenue 21,262 19,102 11% Energy revenue 7,672 6,206 24% Forex recovery % Total 29,544 25,602 24% The operating expenses increased by 6% from Kshs.8,447 million in 2015 to Kshs.8,948 million in 2016 due to increased operational scope and capacity building. Depreciation and amortization expenses increased by 58% mainly due to revaluation of assets and full year depreciation of Olkaria 280MW. The Company s operating profit grew by 43% from Kshs.11,342 million to Kshs.16,271 million due to improved revenues and optimization of expenses. Compensating tax of Kshs.2,431 million is a provision that arose from the payment of dividends of Kshs.5,735 million to the government during the year in accordance with section 7A(5) of the Income Tax Act Cap 470. Profit before tax recorded a growth of 30% from Kshs.8,690 million in 2015 to Kshs.11,264 million in 2016 as a result of revenue growth. However, profit after tax for the year declined by 41% from Kshs.11,517 million to Kshs.6,743 million due to a tax charge for the year compared to tax credit the previous year. Last year, the company benefited from investment allowances following the completion of Olkaria 280MW plants. Financial Position Total assets increased by 7% from Kshs.342,520 million in June 2015 to Kshs.367,249 million in June 2016, due to investments in 15 wellhead units and drilling of additional wells to secure steam for the upcoming power plants. Looking at our Debt Debt Mix as at 30 June 2016 Shillings, million KenGen has access to Concessionary Loans through GoK Weighted Average Maturity years Direct loans 38,716 28% GOK Guaranteed Loans 47,719 35% Weighted Average Cost of Debt 3.87% GOK on-lent loans 50,470 37% JPY Kshs bn Euro Kshs bn USD Kshs bn Kshs Kshs 19.54bn 86% 14% KenGen is able to source attractive debt financing packages 69
72 70

73 OUR STRATEGIC DIRECTION 71
74 Our Strategic Direction - Our Plan As a company, we have made great achievements in power generation capacity expansion. At the commencement of our G2G strategy in the year 2007, Kenya was wholly reliant on hydropower which is susceptible to erratic weather patterns. So far, KenGen has achieved several milestones in its G2G journey. We have delivered 700+MW of new generation capacity of which close to 80% is from geothermal. We have also drilled more than 150 geothermal wells, exceeding our target of 100 and completed feasibility studies of 1,900 MW of future projects against a target of 1,500 MW by KenGen created a regulatory unit and we were able to raise the regulated returns by ~19% which significantly reduced our dispatch risk through shifting towards capacity-based Power Purchasing Agreements (PPAs). By focusing on operational excellence, we have significantly improved our return on invested capital by ~ 89% from 4.7% in 2007 to 8.9% in In line with our strategy, KenGen has stepped up its role in the Government of Kenya s capacity expansion programme. Our capacity addition programmes are aligned to the country s Vision 2030 development blueprint. The next phase of our strategy will ensure that Kenyans have access to reliable, sufficient and affordable electricity. As part of G2G s Horizon II, KenGen aims to add 2,500 MW new capacity in the next ten years, contribute to lowering consumer tariffs, and diversify the business to tap into new revenue sources like offering geothermal consulting or drilling services. We are also building capabilities and investing in our people to have a happy and productive workforce which is proud to be part of KenGen. The strategic priorities that will drive the new strategy are: 1. Improving returns of current plants i.e. Optimisation of Operating Expenses (OPEX) 2. Optimising future plants Capital Expenditure (CAPEX) planning and execution 3. Improving PPAs and tariff regulation 4. Pursuing new financing approaches (e.g., partnerships, asset monetization) 5. Establishing new structures to execute and finance projects 6. Delivering current projects and accessing new geothermal fields 7. Improving organizational health and building required skills and capabilities sation)capital 72
75 Our Company Below we summarize our strategic direction: Our Company Installed generation capacity 1,630 MW Market share in Kenya ~69% Planned increase in installed capacity over the next 10 years >1.5X #1 Number 1 Largest geothermal power producer in Africa making Kenya 7th in the World 30% Power generation plants owned 29% increase in revenues in Financial Year % Share of green/sustainable generation sources Our Focus Overall vision To be the market leader in the provision of reliable, safe, quality and competitively priced electric energy in the Eastern Africa region. 2,500 MW Planned new capacity by 2025 Lower tariffs Align with GoK goal to reduce customer tariffs Diversify business Increase organisation capabilities to meet new strategic direction Build capabilities Acquire new skill sets to address changes in the operating environment and achieve success Establish African Footprint Explore expansion opportunities and drive geothermal development in the region and across Africa 73
76 Our Strategic Direction Ngong Wind Farm 74
77 Our Strategic Direction - Growing Our Business GROWING OUR BUSINESS KenGen has positioned itself as a key player in supplying electricity to the country. Electricity is a key enabler in the country s Vision 2030 and is the stimulus that will fasttrack the nation s economic growth and the development of flagship projects. The flagship projects include the Lamu Port-Southern Sudan Ethiopia Transport corridor project (LAPSSET), the Standard Gauge Railway (SGR), oil pipelines, heavy industries (steel) and industrial parks which require heavy investment in sustainable and stable electricity supply. KenGen has committed to generate electricity from its existing power plants and deliver new ones to meet the increasing demand and secure the national reserve margin. This is in tandem with KenGen s strategy to ensure security of power supply, sustainability and affordability are continuously addressed in support of the national vision. 1. The Power Sector Master Plan The Ministry of Energy and Petroleum (MoEP) prepares and updates the National Electricity Master Plan known as Least Cost Power Development Plan (LCPDP) which is a 20 year national electricity generation, transmission and distribution plan to achieve the optimal power requirement to drive the Vision The LCPDP, which includes power sector development plans, prioritizes and synchronizes activities of all electricity players for system optimization. The plan identifies the demand growth, energy resources, power plants and all infrastructure needed namely; transmission lines and substations, including the timelines of all these projects. KenGen operates within the LCPDP framework as the leading power developer in the country. In the financial year ending June 2016, the MoEP engaged the services of Laymeher International of Germany to prepare a long term power sector Master Plan In addition to the demand-supply forecast and the energy balance, the Master Plan also focuses on the integration of renewable energy into the system as well as the analyses of energy efficiency. 2. Capacity Expansion Strategy In 2008, KenGen developed a 10 year strategic plan referred to as Good-to-Great (G2G) transformation strategy. The plan focuses on three key pillars: 1. Capital Planning and Execution: Deliver timely capacity additions to support economic growth 2. Regulatory Management: Shape the regulatory environment to drive generation growth 3. Operational Excellence: Earn the right to grow through best practice operations and reduce costs. These three key pillars are anchored in the Organisational Health foundation which encompasses the strengthening organisational effectiveness from improved structures, culture and process to ensure KenGen remains the market leader in the provision of reliable, safe, quality and competitively priced electric energy in the East Africa Region. The strategy was to be implemented in three horizons, each with distinct objectives and deliverables. a) Horizon 1 ( ) The main objective for Horizon 1 was to stabilize the power situation in Kenya. This was necessitated by the fact that the country was experiencing power instability characterized by frequent outages due to demand management and voltage instability in heavy load centers. In 2008, Kenya s effective installed capacity was 1,280 MW against a recorded peak demand of 1,072 MW. This meant that the reserve margin was approximately 16% and the country was exposed to a shortage of power in the event of failure of the generating or transmission equipment or poor rainfall which affected hydro power. 75

78 Growing Our Business KenGen identified four (4) key priorities that would ensure the main objective for Horizon 1 was met and targeted an additional 500 MW to be developed as follows: Improve efficiency to boost supply Deliver ongoing projects on time Manage peak demand using emergency power installations Prioritize and kick-start future projects As part of this Horizon s targets, the following projects were identified with a total capacity of 316 MW, representing 63.3% of the target 500 MW for the period: Power Plant Type Installed Capacity (MW) Sondu Miriu Hydro 60 Kiambere Optimisation Hydro 24 Ngong Wind 5 Tana Rehabilitation Hydro 12 Kipevu III Thermal 120 Olkaria II Unit 3 Geothermal 35 Wellhead Pilot Geothermal 5 Sang oro Hydro 21 Eburru Geothermal 2.5 Kindaruma (additional unit + Upgrade) Hydro 32 Total Hydro power projects contributed the largest share at 47% of the total installed followed by thermal projects at 38%, geothermal at 13% and wind at 2% as shown: Horizon I Projects by Generation Mode (316MW) 76
79 Growing Our Business These projects combined with other investments in the sector helped to stabilize the power situation in the country. By the year 2012, the effective installed capacity had increased to 1,652 MW, while the recorded peak demand rose to 1,354 MW resulting in a reserve capacity of 18%. b) Horizon II ( ) The main objective of this horizon was to create a sustainable power growth in the country. Three priority areas were identified: Deliver optimal future projects on time and budget Grow supply ahead of demand to establish reserve margin Optimize project portfolio The target capacity addition was set at 1,500MW and was to bring the country s total installed capacity to 3,000MW. The target meant KenGen would have to double the existing total installed capacity in five years. Mega projects were envisioned to meet the target with associated heavy capital investments. The Company has so far commissioned 375 MW in this Horizon as shown in the following table: Completed Horizon II Projects Plant Capacity (MW) Commissioning Year Status Wellhead Implemented Olkaria IV Implemented Olkaria I AU Implemented Ngong Wind I Phase II Implemented Ngong Wind II Implemented Total 375 Geothermal power accounts for the largest share (95%) of Horizon II additional capacity projects while wind energy accounts for 5%. During the financial year 2015/2016, KenGen revamped and extended Horizon II to target the delivery of 721 MW by With this revamped Horizon II, the Company has identified projects to meet the additional capacity from the current pipeline projects as shown in the following table: 77
80 Growing Our Business Project Installed Capacity (MW) Status Capex (MUSD) Commissioning Year Ngong I Phase 3 10 Project structuring Olkaria Wellheads 25 Project under implementation Olkaria I Unit 6 70 Project financing Olkaria I AU Uprating 30 Project development Olkaria IV Uprating 30 Project development Olkaria I Rehab 6 Project development MW Well-Leasing 50 Concept Olkaria V 140 Procurement of Contractors on-going Meru Wind Phase 1 80 Project financing Olkaria VI 140 Project development Olkaria VII 140 Feasibility Total 721 KenGen is responsible for the rapid growth of the renewable energy portfolio in Kenya. Currently 88% of the energy consumed in the country during the year in review was from green energy sources (geothermal, hydro and wind). Geothermal energy is the main focus for KenGen s capacity expansion and remains the preferred base load energy source. The planned investments targets the implementation of 721 MW by 2020 at a capital cost of US$ 2.4 billion. c) Horizon III The main objective of this horizon is to explore opportunities beyond Kenya. Key priorities shall be: Drive expansion beyond Kenya Establish a strong African footprint Lead in technology and innovation 3. The Capacity Growth Journey The projects completed from the year 2007 are as follows: Commissioning Year Project Capacity Addition Annual Capacity Added Total Installed Capacity 2008 (Base year) Installed Capacity Sondu Miriu Hydro Project Optimization of Kiambere Hydro Project 24 Tana Upgrade ,010 78
81 Growing Our Business Commissioning Year Project Capacity Addition Annual Capacity Added Total Installed Capacity 2010 Ngong Wind-Phase I 5.1 Olkaria II 3rd Unit Kipevu III , Eburru Wellhead Pilot 5.5 Sang oro 21 Kindaruma 3rd Unit , Kindaruma Unit 1 and 2 Upgrade 8 8 1, Olkaria IV 140 Olkaria IAU 70 Wellheads Ngong Wind , Olkaria IAU 70 Wellheads II , Wellheads III Total , During the financial year under review, KenGen commissioned 15MW of Wellhead generators bringing the company s total installed geothermal capacity to 524MW and propelled Kenya to position seven (7) in the global geothermal ladder with an installed capacity of 663MW (524MW KenGen and 139MW OrPower IPP). Geothermal energy has since bypassed Hydro energy as the largest source of electrical energy in the country as shown in the figure below. Energy Generation Mode Contribution (%) / / / / / / / / /16 Geothermal Hydros Thermal Kenya s energy generation mode trend Geothermal energy has also helped in reducing the cost of energy and improved the Hydro dams energy storage by using geothermal energy as base load. 79
 KenGen is exploring other financing models for power plants.")
82 Growing Our Business Geothermal has also helped to reduce the cost of energy and improved the hydro dams energy storage since it serves as the base load. 4. Public Private Partnerships (PPP) KenGen is exploring other financing models for power plants. The Public Private Partnership (PPP) framework is one option that the company is pursuing and a 140MW geothermal power plant has been earmarked for implementation as a PPP project. The National Treasury granted KenGen approval for the implementation of the Olkaria VI 140MW (effective capacity) geothermal power plant under the PPP Act The National Treasury through the PPP Unit has engaged a transaction advisor under the World Bank credit facility Infrastructure Finance and Public Private Partnerships (IFPPP) Project to assist in project preparation and advise KenGen on the best PPP model. 5. New Business KenGen is keen to diversify its revenue streams by leveraging on new non-electricity generation based business. There are several concepts that have been proposed to take advantage of the company s enormous resources and skills. Industrial Parks KenGen plans to develop an Industrial Park at Olkaria in Naivasha, Nakuru County. The development of the Industrial Park will not only target the optimization of KenGen business operations, but also support the Government of Kenya s industrialization strategy as a pillar for economic growth and job creation. It is expected that the park will serve as one of the drivers of regional development and create significant employment opportunities. The industrial park shall provide approximate demand load for absorption of Olkaria geothermal power and other utilities, providing KenGen with additional revenue streams for capacity expansion, hence value creation to the shareholders. KenGen has engaged the services of a consultant who shall conduct a feasibility study and develop a master plan for the Industrial Park expected to be completed in October The master plan shall detail the location of industries and utility services within the park. Other non-generation business ventures being pursued include: Olkaria housing projects Drilling services Consultancy services. Aerial view of Sondu Miriu Power Plant 80

83 Our Strategic Direction - Powering from the Earth POWERING FROM THE EARTH Geothermal resource is the heart and core of the geothermal development agenda at KenGen. This was drawn from the Government s guideline to shift base load power source from hydro which is prone to weather variations to geothermal which is reliable and affordable as per the Least Cost Power Development Plan. Through the Geothermal Development Strategy, KenGen is converting energy from the earth to a clean, green and renewable product. In addition to developing new geothermal resources, the Company operates the following power plants: i. Olkaria I 45MW ii. Olkaria II 105MW iii. Olkaria IV 140MW iv. Olkaria IAU 140MW v. Wellheads 71.1MW The Company has successfully implemented the first ever commercial drilling contract of 2 geothermal wells for Akiira One Ltd. It also drilled the largest well in Africa OW-921 with an output of 30MW. Further, KenGen commissioned the first geothermal direct use Spa in Africa. The Company has a plan to deliver 613MW through the following geothermal projects in the near future: i. Olkaria I AU6 70MW ii. Olkaria I AU & IV Upgrade 67MW iii. Olkaria Modular Plants 50MW iv. Olkaria V 140MW v. Olkaria VI 140MW vi. Olkaria VII 140MW vii. Olkaria I Rehabilitation 6MW KenGen is endowed with a wealth of geothermal knowledge. Recent advances have had these skill sets being utilised through the provision of geothermal consultancy services both internally and external entity to earn the company additional revenue. Olkaria II Power Plant 81
84 Our Strategic Direction - Securing Our Future SECURING OUR FUTURE Regulatory Focus KenGen has continually participated in sector reforms whose objective is to ensure quality, reliable, affordable, safe and clean power is supplied to the economy. Under the Electric Power Act of 1997, the sector functions (generation, transmission and distribution) were separated and a regulating function (Electricity Regulatory Board) created. The Electric Power Act 1997 was repealed and replaced with the Energy Act of 2006 which consolidated the electricity and petroleum regulation under one agency; the Energy Regulatory Commission (ERC). The unbundling created the need for power purchase agreements (PPAs), key contracts that govern generation, sale and purchase of power between generators and an offtaker (single buyer) over the project life as guided by regulations and standards. KenGen has signed13 long-term PPAs with Kenya Power & Lighting Company Ltd which guarantee investor returns, thereby securing our future. The minimum life of PPAs is 15 years. In the financial year ending 30 June 2016, the PPA for Olkaria I was extended for one year pending the modalities on redevelopment the concluded negotiations for extension. The Company also signed a new PPA for 30MW gas turbine unit relocated from Nairobi (Embakasi) to Muhoroni to stabilize the power voltages in the western region as well as displace expensive emergency power. Securing Earnings KenGen is in the process of benchmarking with various international energy producing companies on best practice in areas of PPA development and risk allocation. In order to enhance earning and cost savings, the regulatory function disseminates a weekly maintenance tracking log for capacity plants. Also, a PPA awareness drive has commenced for staff in all KenGen operation areas in order to improve plant availability and enhance cost savings. Horizon II Strategy The Company is currently developing bankable PPAs and ESIAs for new projects envisioned in the Horizon II strategy i.e. Ngong III 10MW; Olkaria 1 U6-70MW; Olkaria V 140MW; Olkaria 1 redevelopment 6MW; Meru Wind Phase 1 80 MW. The regulatory strategic focus will seek to lobby for faster stakeholder approval required fpr the formation of new structures and new financing approaches to deliver the strategy. 82

85 Our Strategic Direction - Sustaining the Business SUSTAINING THE BUSINESS Operational Excellence Efficient and effective operational management is the cornerstone of any company s success including KenGen. Operational excellence assumes greater significance given that today s investors look out for organizations operations before making investment commitments. The need for operational excellence is spurred by the prevailing regulatory and environmental compliance issues, threat to market share by independent power producers and increased customer demands for quality, reliable and competitively-priced power coupled with the need for optimization of operations and maintenance costs. The integration of operational excellence into the business strategy has brought the following: a) Coordination across people, process and technologies b) Continuous improvement approach and mentality c) Measurement and targets to drive action and results d) Increased levels of team collaboration e) Enthusiastic uptake of value-adding technological innovations 1. Streamlined Operations and Dispatch functionality To enhance efficiency and ensure optimum customer focus, KenGen has a dedicated centralized team charged with the responsibility of operating and dispatching the generation assets. The team provides the link between KenGen and the customer. The interaction comprises the declaration of available energy from major hydro plants, scheduling of outages, continuous dispatch and operation of the generation fleet in fulfilment of system requirements and with the reconciliation of the expected and actual energy generated in pursuit of the requirements of power purchase agreements. The Company is in the process of operations and dispatch of all plants centralising. This will entail linking of all the individual plant Supervisory Control and Data Acquisition systems (SCADA) and providing a one-stop remote control and monitoring capability complete with the associated benefits of centralized diagnostics and graphics capability. KenGen team at drilling site in Olkaria 83
86 Sustaining the Business 2. Optimize Maintenance Practices and Generating Fleet Performance Most of the Company s generation assets are operating on a capacity-based power purchase agreement in which revenues are majorly based on plant availability. The balances of the power plants operate on an energy-based Power Purchase Agreement (PPA) whereby revenues are entirely dependent on energy sales. The company places emphasis on high plant availability to assure revenues. High plant availability is realized through a mix of Time- Based (TM) and Condition Based Maintenance (CBM). Condition based maintenance is the modern practice in which the power plants are only shut-down for maintenance when necessary as guided by the condition. The success of this approach is dependent on provision of accurate and reliable plant instrumentation systems to monitor key plant parameters. Alarm and maintenance thresholds of key plant parameters are continuously monitored and maintenance scheduled once the set thresholds are not met. The commitment to CBM is evidenced by the installation of the SCADA system to collect data and relay to the PMS system for maintenance purposes. The power stations are equipped with dedicated SCADA systems to enhance plant visibility, centralize operations and optimize maintenance and operations. Apart from the ongoing implementation of CBM to ensure high availability by stretching intervals between maintenances to the absolute maximum, KenGen continues to practice the SMED (Single Minute Exchange of Die) principle to minimize outage duration. In addition, Lean Six Sigma strategy has been brought onboard to accelerate the operational excellence journey. This cost optimization methodology systematically minimizes waste through streamlining process flows to improve efficiency and productivity. 3. Automation, Rehabilitation and Upgrade of Plants During the year, automation of plant control systems for Tana Power Station was conducted to centralize operations, enhance reliability and optimize plant availability. The original control systems that were prone to frequent maloperations and failure were rehabilitated and made more robust, user-friendly system. During the rehabilitation, staff were duly trained. The contractor carried out the commissioning of the first unit with the KenGen staff carrying out the commissioning of the other two units under instruction. The commissioning of the final unit and the station auxiliaries was entirely conducted by KenGen staff. This is the approach the company intends to adopt and integrate in all projects to ensure maximum transfer of skills and knowledge in illustrious pursuit of capacity building with a view to ultimately gaining total technological independence. During the project, the plant SCADA system was interfaced with the existing SCADA system for hydro plants. This will enhance plant visibility. The Rehabilitation and upgrade of Turkwel Power Plant was finalized during the year. In addition, its auxiliary supply system was upgraded and modernized. The modernization is expected to result in enhanced plant availability and optimized operations and maintenance costs. 4. Optimization of Business Processes At KenGen, operational excellence is for cost efficiency and effectiveness which facilitates business sustainability. KenGen continues to enjoy the benefits of the Enterprise Resource Planning system (ERP) which facilitates the company s entire business with enhanced controls, enhance and mitigate flexible enough to be adapt to emerging requirements. The Company is certified in both ISO 9001:2008 for Quality Management and ISO 14001: 2004 for Environment Management. All our processes comply with the two ISO standards. The drive to ensure conformity with the ISO 9001:2015 and ISO 14001: 2015 is ongoing and the mind-set shift from management to leadership, from risk to both risk and opportunities has been enthusiastically embraced. 84
87 Sustaining the Business Standardization is underway to ensure similar teams utilize standard procedures when executing similar tasks for quality purposes. The implementation and maintenance of these standard procedures ensures predictable quality outcomes irrespective of the maintenance team involved. The company is currently rigorously exploring the benefits of forming a centralized maintenance team composed of the best talents to supplement the lean maintenance teams based at the power stations. The envisaged core mandate of this team shall be to conduct annual maintenances and undertake corrective maintenance in a timely manner to minimize downtime. The company is increasingly adopting the total cost of ownership (TCO) principle regarding the procurement of new plants and stocking of strategic spares. The TCO approach is preferred to the often used initial quoted price since it is reflective of both the direct and indirect costs of ownership over the lifecycle of the plant, including the social costs. 5. Skills and Knowledge Transfer through Involvement in Projects KenGen encourages a multi-functional approach to project implementation. The cross-functional project steering team ensures effective drafting of specifications, evaluation, award, design, inspection, supervision, installation and commissioning of plants. This approach is preferred since it promotes skills and knowledge transfer to Company Staff from contractors. The involvement and interaction of various teams improves project uptake and ensures our staff hit the ground running in plant maintenance and operations upon commissioning and handover. KenGen intends to ramp up the skills transfer by ensuring active participation of staff to ensure ultimate competence and independence. This is in line with our proud philosophy of developing a pool of talented staff to design, install and commission plants in the region and beyond soon. Though initially expensive, this approach is excellent for capacity building and drive towards independence born of competence. 6. Learning Partnerships KenGen, as a learning organization, is committed to adopting best practice in its pursuit of operational excellence. It is equally at ease and open to sharing its home-grown solutions with other like-minded organizations. Internal training and learning from one another is one of the best and least expensive ways of enriching and tapping into our in-house resources. This has been embraced companywide and senior staff are able to transfer knowledge and skills to the young minds at nominal fees compared to the exorbitant cost of using external resource teams for training. We intend to go beyond internal training and supplement it by partnering with both leading local and world class utilities to close knowledge gaps. The attachment of our staff to world-class utilities will result in the cultivation of best practice and adoption of a culture of operational excellence. 7. Optimization of Operations and Maintenance Cost KenGen is blessed with a pool of talented staff able to generate ideas aimed at optimizing the operations and maintenance costs to sustain the business. In this regard, a number of brilliant initiatives have been mooted and adopted by the company. These ideas are at different stages of implementation. Key among them is the elimination or minimization of energy back-feeds to the absolute minimum. This idea has already been implemented in some of our stations and the benefits are tangible and positively affect to the company s bottom-line. Energy audits initiatives have also brought to the fore the need for the installation of power factor correction capacitors in stations. This initiative has also yielded savings by reducing the penalties incurred in electricity bills by Kenya Power. The company often incurs huge expenses on calibration of monitoring equipment both locally and internationally. Currently, efforts are ongoing to establish a calibration laboratory to address the calibration gap and save costs. 85


88 Our Strategic Direction - Building Talent Staff and Delegates at the 2016 G2G Annual Technical Seminar The MD & CEO addressing staff at a teambuilding workshop 86
89 Our Strategic Direction - Building Talent BUILDING TALENT Organisational Health KenGen s organisational health is pivotal to strengthening effectiveness from improved structure, culture and processes. In the year under review, the Company focused on revamping human resource outlook in terms of practice and systems. The strong desire for this rejuvenation initiative saw a change in leadership at the top stratum. The Company ensured a smooth and seamless transition during the change process. This endeavour was intended to improve employee decision making, problem solving, service delivery and performance. The initiatives were embedded in providing opportunities on training and skills development, making resources available, empowering, and motivating as well as holding employee s responsible and accountable resulting in competent and satisfied workforce. The most important focus for the Company was customer care and service delivery. Performance Management: Continual implementation of an ICT-based performance management system has ensured identification of skills gaps which are closed through appropriate training and deployments. The tool has created a culture of dialogue around individual targets and monitoring which culminate in bi-annual performance appraisals. Individual accountabilities result in team synergies. Activities have been implemented for systematic enhancement of skills and proficiencies to address career progression and improve institutional performance. Learning and Development: To enhance employee contribution to the organization and develop capability to progress strategic goals, the company has continued to undertake training and development at all levels. Emphasis was laid on the delivery of appropriate training programs using cost effective methods without compromising the quality and appropriateness of content. Focus was also laid on the development of skills and capabilities through training in geothermal technology, transformer maintenance and on-load tap changers as well as effective programming, configuration, commissioning and maintenance of the protection systems for generation fleet. A total of 170 training programs covering 1,816 employees were undertaken during the year Similarly, in line with the requirements of occupational safety and health, a number of trainings were rolled out to promote a safety culture among employees. Training on fire fighting and first aid in the workplace as well as other emergency response and preparedness initiatives continued in promotion of safety consciousness, which is one of the company s core values. Six senior employees underwent the annual development programs to strengthen individual performance and team leadership, and also to enhance personal employee development, welfare and motivation. The Company also provided coaching and mentorship sessions for employees and young learners. Apprenticeship and Internship Program: during the year, the Company introduced a six-month apprenticeship program which endeavours to equip graduates in various disciplines with practical workplace skills to prepare them for the job market. This has had a huge success with 50 apprentices undergoing the program during the year. The internship program has also given exposure to 1200 students from institutions of higher learning. Employee Welfare and Wellness: The Company has put in place robust employee wellness initiatives which include the provision of club and sports facilities. The provision of company funded in house medical scheme has alleviated the financial burden from employees and made reasonable healthcare available. Further, under the enhanced employee assistance programs, the company has reduced the impact of HIV/AIDS, alcohol and drug abuse on employees and their dependants. The company has continued to sponsor and encourage employees to participate in various sports activities. These initiatives have led to compliance with legal requirements and subsequent periodic evaluation by monitoring agencies such as the National Authority for the Campaign Against Alcohol & Drug Abuse, the 87
90 Our Strategic Direction - Building Talent National Gender Equalization Commission, the National Council for Persons Living with Disabilities and the National AIDS Control Council. The Company developed and submitted a disability mainstreaming work place policy and an annual work plan to the Directorate of Performance Contracting & the Presidency in line the GOK Performance Contract signed between the KenGen Board and the Ministry of Energy & Petroleum. The reconstitution and operationalisation of a disability mainstreaming committee is underway. Training on sign language was undertaken in line with the desire to meet the need of opening up communication with those with hearing disability. This was also in tandem with the company s journey to increase the employment of persons with disabilities (PWD) to a minimum of 5% of the total establishment. The Company proactively pursues the recruitment of PWD s in its hiring process. Further, it continuously carries out accessibility and usability audits and implements the recommendations of audit reports in all premises and facilities. Under the Employee Assistance Programs, support was offered to employees affected by HIV/AIDS and substance use as per workplace policy on alcohol and drug abuse. These initiatives were aided by revamped communication in various company media including the KenGen Staff Weekly newsletter, awareness sessions, push SMS and weekly internal s. KenGen puts employee welfare at the core of its engagement through the provision of housing and social amenities in isolated locations. Work environment enhancement programs saw the occupation of KenGen Pension Plaza 2 office block which has enhanced the open office plan improving team cohesion. Work on Hydro Plaza in Eastern Hydros has progressed well and it is expected to be ready for occupation in the coming financial year. Several sports activities were undertaken during the year, with a number of inter-area games for team building. The Company funded staff house mortgage and car loan schemes offered at concessionary rates of 6.5% and 6% respectively have had a significant impact on staff. The benefits have motivated and helped retain staff, especially younger who were hitherto on the move. This was in addition to company loans to unionisable employees negotiated under the collective bargain agreement. Governance: in the year ended 30th June 2016, the company continued to ensure compliance with legal and regulatory requirements. It continued to enforce the 1/3 rule on staff salaries and ensured prompt remittance of statutory deductions such as pension contributions, NHIF, NSSF, HELB and PAYE. There was continuous monitoring of compliance with various professional bodies such as EBK, IEK, ICPAK, ICPSK, LSK, KISM, CIPS, IHRM, PRSK, ISK and ACCA, to ensure different trades in the company were in compliance and employees were enabled to interelate with fellow professionals for benchmarking. Cognizant of the need for industrial harmony, the collective bargaining agreement and human resource and administration policies have been implemented. These instruments were reviewed in the year to respond to staff needs and take care of emerging global labour trends, human resource mix and legal compliance. The implementation of the leave management progressed well in the year with a considerable number of staff taking their days thus reducing the financial burden on the company. Monthly monitoring is undertaken and communicated to divisional heads for administrative and corrective action. 88

91 Our Strategic Direction - Building Talent Staff Succession Planning KenGen considers succession planning as an integral part of talent management that aids sustainability of inhouse capacities. Employee Statistics Operational 1,638 1,638 employees Non Operational employees Total 2,406 2,407 Non-Unionisable 1,397 1,403 Union 1,009 1,004 Total 2,406 2,407 Male 1,919 1,948 Female Total 2,406 2,407 Leveraging on Technology KenGen has leveraged on information technology to streamline and automate its business processes, increase efficiency, enhance plant availability, reduce process variability, improve safety and automate regulatory compliance, thereby enhancing cost efficiency. At the same time, KenGen has harnessed the potential of ICT to drive innovation, sustainability and growth through careful introduction and integration of business and operations systems. It will continue to invest in the latest state-of-the-art technology and innovative initiatives to ensure that it achieves maximum capability while creating value for shareholders. KenGen s ICT Strategic Plan enhances our capacity to analyse the current state of ICT in the organization and outlines the major transformation initiatives that align the strategy with organizational goals. Major transformation initiatives include the automation of business processes, adoption of cloud technology services to enhance productivity and efficiency as well as the automation of ICT environment in shared infrastructure. A key outcome of the Strategy is the enhancement of security and risk management ICT Projects 1. Integration of SCADA with SAP. This project finally connected operations systems (Operation Technology) to business systems (IT) taking KenGen closer to the future with the Internet of Things (IoT) by convergence of technology. 2. Smart MediCare integration. KenGen run its own employee medical scheme. The medicare system is run internally on SAP through an integration with smart systems that are already available in all medical facilities in Kenya. Engineers at work on a turbine 89

92 Our Strategic Direction - Building Talent Exhibitor during G2G technical Seminar Future IT Projects 1. Through the ICT Strategic Plan , KenGen seeks to adopt cloud technology services to enhance productivity and efficiency, transformation of ICT infrastructure through implementation of cloud technology platforms and the automation of ICT environment in a shared infrastructure. 2. SAP additional modules. KenGen business infrastructure runs on SAP platform and the business needs to leverage more on IT technology in process automation, innovation and cost reduction. Therefore, KenGen seeks to implement additional modules to support business in the following areas:- a. Project Portfolio Management (PPM) platform that enables KenGen management to plan, implement, monitor and manage all capital projects. b. Supplier relationship management (SRM) is an eprocurement platform that digitizes the procurement process as well as ensure compliance with a Presidential directive for state organisations to implement an eprocurement system. 90
93 Our Strategic Direction - Getting Value for Our Money GETTING VALUE FOR OUR MONEY The Supply Chain Value Chain Supply Chain management in KenGen plays the central role of timely procurement of quality goods and services with the right specifications that meet user needs. This ensures delivery at the right time and location at the best price that achieves cost efficiency. Targets are attained through procurement as per the approved budget, tendering efficiency, management of logistics and inventory and supplier relationship management, leading to continuous improvement. The need to improve plant availability has led KenGen to adopt a system of requisition and storage of strategic spares to minimize lead times. The Company is also increasingly adopting the total cost of ownership (TCO) principle in regards to the procurement of new plants and stocking of strategic spares. The TCO approach is preferred to the often used initial quoted price since it is reflective of both direct and indirect costs of ownership over the life cycle of the plant, including the social costs. YESTERDAY Acquiring of goods and services Selecting Vendors Strategic vetting and selection of Vendors Negotiations of contract and actual buying Goods Receipts Payment TODAY Establish savings foundations Visibility awareness First wave saving Strategic sourcing Compliance tracking The spares must be available at all times to mitigate the risk of unforeseen downtime occasioned by plant breakdown thus reducing revenue leakages. The Company has also adopted framework contracting to ensure suppliers deliver on a need-be-basis. This has significantly acted as a key driver in the Company s endeavour to partner with various suppliers and build meaningful long-term relationships. KenGen leveraged on technology in inventory management having adopted SAP Enterprise Resource Planning (ERP) to upscale the supply value chain business model within the organization. This real-time dashboard view of all our stores and inventories has reduced haphazard procurement of goods and services. Supply Chain has improved requisition of goods and services through close liaison with user units in developing specifications. This has realized value of goods and services procured in the organization, enhancing quality of plants and reducing maintenance costs. Procurement Plan The Company prepares Procurement plans on an annual basis which guide all purchases as per approved budgets. These plans are approved by the Board and closely implemented and monitored by the supply chain function to aid the Company meet the set strategic goals. The plans are implemented in accordance with the Procurement legislation, ensuring inventory and prudent working capital management. Compliance The Public Procurement and Asset Disposal Act, 2015 came into force on 7th January This repealed the Public Procurement Disposal Act Under the new Act several changes have been introduced in the tendering process. Tender and Area Procurement Committees have been disbanded. The Head of the Procurement function shall now review the tender evaluation report and provide a signed professional opinion to the Accounting Officer on the procurement or asset disposal proceedings. In making the decision, the Accounting Officer shall take into account the views of the head of procurement in the signed professional opinion. The new Act aims at streamlining the procurement processes by making it fair, equitable, transparent, competitive and cost effective. It has also made provision for e-procurement to facilitate efficiency and effective service delivery. 91
.")
94 Getting Value for Our Money Supporting the Vulnerable in Society The Public Procurement and Asset Disposal Act of 2015 decrees all public procuring entities to reserve not less than thirty percent of their annual budgetary allocations for enterprises owned by youth, women and persons with disability (YWPD). In line with this requirement KenGen has allocated thirty percent of the total local procurement budget to these special groups. To support the special groups in achieving the thirty percent allocation, KenGen has put in place the following measures: Effective monitoring of the special groups Empowerment through training and capacity building Companywide sensitization and institutionalization of the procurement plan Identifying and benchmarking with the other government institutions Liaising with The National Treasury preference and reservations secretariat for advice on how to promote the special groups Regulatory & Corporate Affairs Director hands over a wheelchair to the central office safety team 92


95 Our Strategic Direction KenGen Foundation initiatives in Education and Mentorship areas 93

96 Gitaru Power Station 94

97 SUSTAINABILITY: FROM GENERATION TO GENERATION 95
98 2016 Sustainability Highlights Environmental Sustainability FY 2016 No. of ESIAs 2 Rehabilitated land in the 280MW projects 124 acres = 502,895m 2 Buffer zone in eastern Hydros 10 acres Seedlings planted within KenGen 22,655 CDM projects 6 Certified emission reduction (CERs) gross earnings to date Kshs 334 million Certified emission reduction (CERS) earnings in 2015 Kshs 62 million Redevelopment of Tana CDM project grant Kshs 5 million Issuance (to date) about 330,186 tco2e Olkaria I & IV 280MW calculated reductions 990,000 tco2e Construction of RAP roads to KERRA standards 22 Kilometers Construction of RAP roads to KERRA standards Kshs 157 million Furnished primary school 8 classrooms & staffroom Furnished Medical dispensary Kshs 2.5 million Investing in Communities Seedlings issued to institutions and individuals 373,111 Rehabilitation of Mirira Primary School Upper Tana power plant No. of students to benefit 209 Rehabilitation of classrooms 13 classrooms Establishment of a tree woodlot 1,000 seedlings, cassia siemea species Construction of Ngurunga Earth Dam Kiambere Power Plant No. of livestock to benefit 1,000 No. of households to benefit 250 Implemented social amenities Water tank at Moindabi Secondary School for rainwater harvesting 10,000 litres Repair of damaged Inkoirienito/Suswa road 16km Education Scholarships Awarded Benefit 339 students Kshs 40 million 96
99 Social Sustainability KenGen CORPORATE SOCIAL INVESTMENT: INVESTING IN COMMUNITIES Leading the Way as a Good Corporate Citizen In its quest to stay ahead of the pack, the company continues to invest in projects aimed at uplifting the living standards of communities around the areas where it has installations. Besides, the company is also involved in numerous CSR projects across the country, which have a direct impact on various segments of the population. During the last financial year, our priority areas included education, health, sports, labour relations, arts and culture. Other areas included medical care, county trade and investment forums and sponsorship of professional member organisations annual conferences. Sports Kenya has earned global recognition as a sporting nation. Against this background, the company has never shied away from promoting and supporting sporting activities aimed at nurturing talent or taking sportsmanship to the next level. In the last financial year, the company sponsored a charity golf tournament organized by the Alliance High School Old Boys Club. The company also participated as the bronze sponsor in the Rotary Club of Karen Charity Golf Fundraising Tournament. The Nakuru and Parklands Open Squash Tournaments also benefitted from the company s generosity. But above all, the company sponsored the RIO 2016 Olympic Games, in which Kenyans showed their prowess in the middle and long distance races. County Trade and Investment Forums Devolution is one of the best thing that ever happened to this country. More than ever before, the government is now closer to the governed; decision making is participatory and economic development in the whole country is being balanced. The devolved system of goverment has unlocked numerous potentials and presented a life time opportunity to the people. Various counties continue to organize trade and investment forums to attract local and foreign direct investment to promote economic growth and development. In recognition of the need to promote an investment climate in the counties, the company sponsored the Meru Investment Forum, the InvestNarok International Summit 2015 and the Turkana Trade & Investor Conference 2015 each to the tune of Kshs 1million. Professional Member Organisations The role of professional member organisations cannot be overstated. It is these organisations that regulate various professions to ensure high standards of discipline. KenGen itself employs a number of professionals, including engineers, finance, procurement, secretarial services and human resource professionals. It s for this reason that during the last financial year, the company sponsored activities of various professional member organisations. Among them was the Annual Engineering Students Association Final Year Dinner 2016, in which the MD was a guest speaker. The company also sponsored the Institution of Engineers Annual Conference The Architectural Association of Kenya (AAK) also benefitted from the company s sponsorship, when it held its Go-Green Awareness Seminar, Dinner and Networking Forum. Being a champion of proper energy management, the company sponsored the Energy Management Awards 2016, organized by the Kenya Association of Manufacturers (KAM). Other beneficiaries included the 17th Annual East African Power Industry Convention (EAPIC) 2015 and the 19th Institute of Certified Secretaries (ICPSK) Annual International Conference Education The company believes in raising the standards of education in the country and continues to support various initiatives aimed at achieving this goal. Among the 97
100 Social Sustainability projects undertaken during the last financial year include construction of classrooms, purchase of desks and chairs, as well as water connections at various schools neighbouring our installations. The company also sponsored the National Conference on Inclusive Education, organized by the Kenya Institute of Special Education. Healthcare We believe that a healthy nation is a productive nation and towards this end, we have continued to support initiatives that promote good and sustainable health. During the last financial year, our top priority was the sponsorship of the annual First Lady s Half Marathon, an initiative of Beyond Zero campaign, whose proceeds are geared towards achieving zero maternal and infant mortality rates, as well as zero new HIV infections. Labour Relations KenGen believes in working with other employers to share industry best practice to retain the best talent. In this regard, the company sponsored to the tune of Kshs 2million, the First African Employers Summit organized by the Federation of Kenya Employers (FKE), with support from the International Labour Organisation (ILO). Arts and Culture As part of its continued stakeholder relations efforts, particularly in the coastal part of Kenya, the company sponsored the Annual Lamu Maulid Festival THE KenGen FOUNDATION: IMPROVING LIVES IN OUR NEIGHBOURHOOD KenGen Foundation KenGen continued with its commitment to upscale its Corporate Social Responsibility countrywide. It is the Company s believe that as a responsible corporate citizen, it has a duty to add value to the livelihoods of communities by establishing long-term relationships and implementing sustainable projects. The Company s CSR efforts have continued to expand with the establishment of the Foundation in 2012 to serve as the vehicle for implementing the Company s CSR programmes. The Foundation has focused the Company s efforts on three key pillars of sustainability namely education, environment and water & sanitation which complement the country s Sustainable development goals, SDGs. Through the implementation of viable and sustainable programs, the Foundation has positioned the company as a leader in sustainable development through well focused community programmes. Education KenGen lays great emphasis on creating a pool of trained, competent and patriotic individuals that will contribute towards building a vibrant economy and transforming the country into a middle-income economy by the year KenGen Education Scholarship program offers learning opportunities for bright needy secondary school and university students selected from communities living near the Company s installations. From sponsoring an initial group of 14 students in 2005, the KenGen Education Scholarships today benefits over 180 students annually and has to date enabled over 600 to attain secondary and university education. 98
101 Social Sustainability Currently, the Company is supporting 90 university and 91 secondary students, with 8 beneficiaries being sponsored by contributions from the KenGen Employee Giver Initiative, and two from one of our project partners. From the last academic year, the Foundation offers stipends to all university students under company scholarship to improve their living conditions as they pursue their studies. Within the financial year, the Company absorbed seven beneficiaries who graduated with 1st class honours in 2015 from various universities. Apart from offering scholarships, the Company also contributed to the construction and refurbishment of several learning institutions across the country. These included construction of dormitories, classrooms and sanitary facilities. The company has already approved an expenditure of Sh 25.5 million scholarships and infrastructural development support in schools in the next financial year. Environment KenGen is committed to environmental conservation and safeguarding the environment it shares with other communities across its areas of operation. Through the Foundation, the Company has invested in long-term sustainable environmental conservation programmes involving schools and communities. The flagship environment project is the Schools Green Initiative Challenge, (GIC) project implemented in partnership with Better Globe Forestry and Bamburi Cement Ltd. The GIC project, now in its second phase is structured as a competition with the institution recording the highest number of tree survival awarded attractive prizes including educational trips, infrastructure development and scholarships. 120 schools from the semi-arid areas of Embu, Kitui and Machakos counties are currently in the competition. The highly successful programme aims to green over 1,000 schools in the arid and semi-arid areas through the establishment of woodlots within school compounds. The Eastern hydros ten-year project currently has 201 schools participating and will be taking in another 120 additional schools per year for the next seven years. The GIC is set to expand to Nakuru, Kisumu and Mombasa counties where KenGen has a significant presence. Water and Sanitation KenGen has been addressing water challenges faced by communities neighbouring its power stations through the provision of clean water as a major corporate social investment activity for more than twenty years. The Company has continued to assist communities to access clean water through better sanitation through the construction of sand dams and water pans, piped water and the provision of rain water harvesting facilities in schools. The Foundation is currently exploring unique partnerships in order to expand water and sanitation programmes for a greater impact. Partnerships The Foundation has worked with strategic partners to obtain resources for bigger and far-reaching programmes. These partnerships draw on the complementary strengths of different organisations in addressing pressing community and development issues through pooled resources. The Foundation has partnered with Bamburi Cement and Better Globe Forestry in the expansion of the Schools Green Initiative Challenge. The Foundation recently received a grant of US $ 50,000 from the World Bank s Community Development Carbon 99

102 Social Sustainability Fund for the renovation of Kiambaa Primary School and the construction of a footpath at Mirira, Upper Tana area. The project is being implemented in collaboration with the Environment and CDM department, as well as Eastern Hydros Environmentalists, Engineers and Community Liaison Officers. The KenGen Foundation, KenGen and the Lake Basin College have also signed a Memorandum of Understanding (MoU) for the afforestation of Katuk Odeyo area in Nyakach, Western Hydros near Sondu Miriu Power Station in Kisumu County. The MoU provides the framework for the cooperation between the parties in regards to the project. The Company will provide seedlings from its Sondu Miriu station nurseries while the Foundation will ensure efficient monitoring, evaluation, and future up-scaling of the project. Staff Giving: KenGen Employee Giver Initiative The Foundation established the KenGen Employee Giver Initiative in early 2015 as a platform for staff to participate in the company s corporate social investment activities. The Initiative currently has 756 members who have registered as Givers with an option of either contributing financially or in kind to the CSI projects undertaken by the Company. During the financial year 2015 /2016, the Foundation engaged and trained 25 KenGen staff from various power stations as mentors to sponsored secondary and university students under its scholarships program. The mentors offer counselling, motivation, and career advice to the students. Western Hydros staff Givers planted 5,000 trees at Sang oro power station as part of the Foundation s reforestation campaigns while Nairobi staff givers participated in the greening of Nairobi National Park by planting 1,250 trees. KenGen Foundation Scholarship programme 100
103 Environment Sustainability ENVIRONMENTAL MANAGEMENT Environmental Policy Statement Highlights - Commitment Environment Management Process KenGen is committed to long term sustainable development in line with International Standards (ISO), statutory and regulatory requirements in generation of reliable, safe, quality and competitively priced electric energy through: SMART environmental objectives and targets Maintain and continually improve environmental management systems and programs Compliance to all applicable environmental legal and regulatory requirements Conserve energy generation resources & promote cleaner production Employees & stakeholder awareness and training on standards and environmental policy KenGen is ISO 14001:2008 certified and its environmental management process is guided by the key components of the Environmental Management System (EMS) including Corporate Environment Policy. EMS is documented and the environmental legal and regulatory requirements which affect company operations are continuously evaluated. The Company has set up SMART objectives, targets and programs which are monitored and reviewed regularly. Corporate and area procedures have been documented to manage and measure performance on key environmental sustainability processes namely: Environmental and Social Impact Assessment (ESIA) Resettlement Action Plan (RAP) implementation, Catchment conservation Statutory environment audits Carbon Asset Development and community core benefits Project stakeholder management Corporate environment performance monitoring, measuring and reporting 101
104 Environment Sustainability Environmental and Social Impact Assessments (ESIA) At KenGen, the ESIAs cover the following activities: All major projects are subjected to ESIA (and RAP) studies Strategic Environmental Assessment for geothermal expansion programs at Olkaria and Eburru Key stakeholders consulted Meets local & international standards Environment Impact Assessments (EIA) Licenses obtained from the National Environment Management Authority (NEMA) and No Objections from development partners (or financiers) Environment and Social Management Plans (ESMPs) enforced Part of bid documents Resident Environmental and Social Safeguards Officers for each project Monthly environmental performance monitoring reports with key recommendations ISO 14001:2008 integrated into monitoring Environmental Audits & Environment Management Plan Implementation (no. of audits) To ensure compliance with the regulations & statutes, the company undertook activities during the financial year as below: Quarterly & Semi-annual EMS audits (Internal & external) Annual statutory environmental audits NEMA Audits by Energy Regulatory Commission (ERC) CAPs prepared and implemented in audited areas for continuous improvement Fire audits & Occupational Health & Safety audits Clean Development Mechanism (CDM) verification audits (Olkaria II U3) ESMP Implementation: Joint Financiers supervision missions Environmental Performance Monitoring Programs Part of ESMPs implementation Done during construction and operation phases of the projects Monthly, Quarterly, Bi-annual and Annual Performance reports prepared for each site with key recommendations on gaps Monitoring broadly cover the following aspects: Air quality monitoring and simulations/modelling for power plants Noise and excessive vibrations including spread modelling Weather parameters Surface and ground water resources Water (for consumptive and non-consumptive) and energy resource use Waste management (based on 3R principle-reduce, Recycle, Re-use) and pollution control Environmental flows Ecological monitoring and Social impacts monitoring based on World Bank and other social safeguards guidelines 102
105 Environment Sustainability ENVIRONMENT MANAGEMENT PROGRAMS Program Activities Geothermal Sites (Olkaria and Eburru) Brine Containment & Reinjection Minimising of well pad sizes Ecological management-as per MoU with KWS and Lake Naivasha Riparian Association Elements of environmental significance - brine, water, soil and vegetation Areas of Operation Western and Eastern Hydros Kipevu Thermals Partnerships in Upper Tana - Nairobi Water Fund Partnerships in SW Mau Conservation initiatives Establishment of buffer zones Environmental flows management Air and noise emissions management Waste oil and effluent quality management programs All site including Central Operations area - Central Workshops, Embakasi GT and Ngong Wind Sites restoration - Landscaping & Rehabilitation Social afforestation - tree nurseries Water (ground and surface) and energy resource use mangement Waste management and pollution control Ecological monitoring 103
.")


106 Environment Sustainability 2016 ACHIEVEMENTS Sustainability projects under the Clean Development Mechanism (CDM). Twin objectives of CDM: Reduce greenhouse gas emissions 2 m 502,895m 2 2 = 124 acres Ensure sustainable development KenGen is the first Company in Kenya to earn CDM revenues KenGen has the largest portfolio in Kenya and Eastern Africa Region of 6 registered projects USD 0.62 million Resettlement Action Plan Successful resettlement of communities e.g. Olkaria Investment of over $10mn Resettlement area of 1,700 acres Number of tree seedlings issued to individuals and institutions 373,111 Previous Houses (Manyattas) New Resettlement Houses 104
107 Operational Management OCCUPATIONAL HEALTH AND SAFETY SAFETY & HEALTH MANAGEMENT SYSTEM KenGen is committed to efficient generation of reliable, safe, quality and competitively priced electric energy to the satisfaction of our customers. Safety culture in engrained in KenGen s corporate values. Managed and monitored through policies & rules: Quality Policy Statement Occupational Safety & Health Policy Statement Fire Safety & Emergency Policy Statement General Safety Rules Alignment of the occupational health and safety management system with the International Standard for Occupational Health Safety Management System (OHSAS) ISO KenGen health and safety programs: Awareness & training Fire Safety and First Aid Safety promotions and campaigns Safety weeks Inspections and audits on equipment Business Continuity Plans (BCP) and Disaster Recovery Plan (DRP) Emergency preparedness and response 105
108 Social Management CORPORATE SOCIAL INVESTMENT Implementation of CSR interventions through the CSR Policy Initiatives are carried out through the Corporate Affairs (CSR) and the KenGen Foundation Corporate Affairs represented as a Trustee in the Foundation Corporate Affairs Short term initiatives Foundation represented as a member in the Central CSR Committee & Corporate Affairs represented in the Foundation Board of Trustee KenGen Foundatio n Long term initiatives Joint representation ensures efficient monitoring of CSR initiatives and avoids duplication between the two arms 106


109 Social Management Stakeholders Coordination Committees Area CSR Committees Central CSR Committees KenGen Foundation Link between KenGen & communities Prioritise CSR initiatives Divided into focus sub committes i. Education ii. Employment & Economic Benefits iii. Culture & Sports iv. Environment, Safety & Health Chaired by the area Operations Manager, who is a member of the Central CSR Cmmitee Comprises of all the chairs of the Area CSR Committees, Corporate Affairs and KenGen Foundation. Measures and monitors all CSR and Social Investment initiatives Community expectations were higher than KenGen Company resources, so the Foundation was set up Key objections of the Foundation: i. Raise funds to scale up CSR interventions ii. Monitor and evaluation the CSR initiatives Forms partnership with others for joint initiatives e.g with Bamburi Cement & Better Globe Flow of information and discussions to ensure alignment of Company goals and objectives with those of the communities in which KenGen operates Overall aim: To improve the living standards of the communities around KenGen - Harmonious neighbourliness SOCIAL INVESTMENT SUSTAINABILITY Environment Culture Health Scholarships Water Sports Institutions Infrastructure Economic Empowerment Humanitarian Aid The 3 focus areas are KenGen s core Corporate Social Investment pillars that are driven by actual community needs. They are transformational & correlated having been identified & prioritized by communities in KenGen s operational areas. 107

![4M Water & Sanitation - 16% [Rainwater harvesting, Latrines & Hand-washing, Hygiene promotion] KES 250M / USD 2.](/docs-images/73/68213266/images/110-1.jpg "5M Environment - 6% [Afforestation, Nurseries, GIC] KES 100M / USD 980,500 Education Environment Water & Sanitation Other / Secondary")
 School infrastructure development Includes construction, refurbishment of")
 Expansion of scholarship")
110 Social Sustainability Investment SOCIAL SUSTAINABILITY INVESTMENT Amounts Invested in Millions (KES & USD) Other - 37% KES 600M / USD 5.9M Education - 41% [Scholarships & Infrastructure] KES 650M / USD 6.4M Water & Sanitation - 16% [Rainwater harvesting, Latrines & Hand-washing, Hygiene promotion] KES 250M / USD 2.5M Environment - 6% [Afforestation, Nurseries, GIC] KES 100M / USD 980,500 Education Environment Water & Sanitation Other / Secondary Pillar Corporate Social Investment (i) Annual secondary & university scholarships Program was established in 2005; Current beneficiaries students; Total program output students (ii) School infrastructure development Includes construction, refurbishment of schools, provision of building materials & technical equipment. Total Investment: USD 6.4Million/ Kshs. 650Million Estimated Beneficiaries: 10,500 students, school staff & community members Current Focus: (i) Expansion of scholarship program (ii) Enhancing the mentorship program (iii) Partnerships in vocational training (iv) Development of two centres of excellence 108


111 Environmental Pillar ENVIRONMENTAL PILLAR i. Afforestation initiatives in operational areas & main water towers 29 power stations Targeting Kenya s 5 water towers ii. Distribution of seedlings from nurseries in Gitaru, Sondu & Olkaria Over a million seedlings distributed iii. Green Initiative Challenge (GIC) Project Started as a pilot with 81 schools Currently has 201 participating schools Targeting 1000 schools Total Investment: USD 980,500/ Kshs. 100Million Beneficiaries: Over 600,000 community members Current Focus: (i) Upscaling GIC (ii) Implementing family woodlots project (iii) Adoption of water tower forests (iv) Partnerships in solar energy technology 109
112 Water and Sanitation Pillar WATER AND SANITATION PILLAR a) Water projects in various parts of our operational areas ü Piped treated water ü Water Kiosks b) Rain water harvesting ü Sand dams & water pans mainly in the arid areas ü Installation of water tanks and roof gutters Total Investment: USD 2.5Million/ Kes 250Million Estimated Beneficiaries: Over 322,000 community members/ 30,000 households Current Focus: a) Investing in schools sanitation - improved latrines & hand-washing facilities, as well as promotion of hygiene awareness & practices. b) Investing in innovative Rain Water Harvesting systems in schools & households SOCIAL IMPACT PER PILLAR EDUCATION Total Investment: USD 6.4Million / Kshs. 650Million Estimated Beneficiaries: 10,500 students, school staff & community members WATER & SANITATION Total Investment: USD 2.5Million / Kshs. 250Million Estimated Beneficiaries: Over 600,000 community members ENVIRONMENT Total Investment: USD 980,500 / Kes 100Million Beneficiaries: Over 600,000 community members 110
113 Business Sustainability VALUE ADDED STATEMENT We create, distribute and invest value to our shareholders both in monetary terms more so in intangible benefits through sustainable development of customers, employees and shareholders. Wealth Created, Distributed & Reinvested Kshs 000 Kshs 000 Wealth Created Electricity Revenue 29,543,488 25,602,038 Steam Revenue 6,856,018 3,689,361 Other Income 2,210, ,902 Interest Income 556, ,082 Paid to Suppliers of goods and services (6,452,602) (6,774,368) Paid to youth, women and persons with disabilities (government empowerment program) (304,740) (464,000) Wealth Distribution 32,408,322 23,078,014 To employees salaries & wages 4,389,290 4,162,284 To Welfare of our employees 469, ,238 To Train our people 187,006 91,478 To providers of Lenders as interest 3,132,187 3,010,659 To Shareholders as dividends - 1,428,935 To Community and Environmental conservation 312, ,399 To Revenue Authority 2,431,022 - Wealth Reinvested 10,920,908 9,337,992 Retained profit in the company 6,743,492 10,088,392 Depreciation 10,223,370 6,478,945 Deferred taxation 4,520,552 (2,827,315) 21,487,414 13,740,022 32,408,322 23,078,
114 Risk Management 112 ENTERPRISE RISK MANAGEMENT Risk Management is an integral part of corporate governance and ensures long term viability and sustainability of the Company. The Company continues to implement its Enterprise Risk Management (ERM) policy with the objective of managing business and operational risks in a structured and systematic manner. The ERM policy is designed to: (i) identify threats that affect the achievement of the Company s vision, mission and values; (ii) take advantages of opportunities in order to create value for all stakeholders; and (iii) establish appropriate mitigation measures to counter the negative effects of the risks. The Board through its Audit & Risk Management Committee plays an oversight role on the ERM processes implemented by the Management. During the year under review, the Company continued to embed a risk-awareness culture aimed at supporting strategic and operational objectives. Key corporate and emerging risks related to specific business objectives were assessed, evaluated and closely monitored by the Board and Management. The risks fall under three categories: macro-economic; strategic and operational. These risks may affect the Company s operating environment, business growth strategies and operations. Risk identification process is a continuous process and focuses on identifying various risk facing the Company, assessing their probability of occurrence and estimating the potential impact and thereafter, evaluating the adequacy of controls to mitigate against them. The implementation of all planned and agreed upon risk mitigation measures is tracked and progress reported to the Board Audit & Risk Management Committee. The Committee is mandated with the review and assessment of the Company s risk management process. KenGen has developed an integrated risk management system which assists the Management in managing risks and building resilience in to provide greater assurance to employees, customers and other stakeholders that objectives will be achieved. Strategic Risk Management in the Company The objective of strategic risk management is to ensure that management identifies, assesses and continuously monitors events that drive deliberation and action regarding uncertainties and untapped opportunities that affect the organization s strategy and strategic execution. It enables an integrated approach to strategic planning, risk management and strategy execution in managing risks and seizing opportunities, not only for protection from losses, but for reducing uncertainties and seizing opportunities, thus enabling better performance in achieving KenGen s objectives and greater resilience in an uncertain environment. Strategic Risks are one or a combination of the following: a) Risks emanating from external factors and/or enterprise events that are strategic in nature which may affect KenGen s ability to achieve its objectives; and b) Risks associated with our ability to develop, execute, and achieve our strategic objectives, build and protect shareholder value; The key components of the corporate risk matrix and the associated mitigation measures are detailed as follows: Hydrological Conditions Unfavourable hydrological conditions could adversely affect the company s generating capacity and revenues. Mitigation: The Company continues to engage with relevant stakeholders for the establishment of hydro-risk mitigation fund to cushion the Company during periods of poor hydrological conditions. The Company is also diversifying from hydro-dependent generation to other modes such as geothermal, wind and coal. Changes in the Regulatory Environment KenGen operates in a regulated business environment. Changes in law and regulation could expose the company to risks that could result in increased operating costs, ultimately compromising profitability.
115 Risk Management Mitigation: The Company continues to mitigate the risks associated with the regulatory environment through negotiation for effective power purchase agreement that ensure full cost recovery and sustainability of its operations. We also proactively build constructive relationships with all regulators and seek opportunities to contribute to discussions on emerging legislation and regulations. Geothermal Steam Supply Changes in geological formation underneath the earth s surface could adversely affect steam supply from generation wells and impact the Company s revenues. Mitigation: The Company is putting in place an effective steam reservoir management system that ensures close monitoring and supervision of the steam pressures. Competition Competition is inevitable with growing energy demand and supply factors driven by national economic growth and a dynamic global business market. Mitigation: The Company is abundantly endowed with comparatively cheap geothermal resource. The strategy is to focus on harnessing of geothermal resource which provides both competitive and comparative edge over other players. KenGen intends to build on its expertise and experience in exploiting geothermal resources within Olkaria and other potential sites. In addition to the geothermal resource, the Company will leverage on the capacity expansion programmes for renewable energy resources such as wind and solar. The Company is also seeking public private partnerships in order to create new business models and growth opportunities. Political Landscape The National Policy Agenda, through legislative changes may adversely affect investments and Company operations which could result in increased cost of doing business. The forthcoming general elections could also see a slowdown in growth for two reasons, first is the risk that investors could defer investment decisions until after the elections; second, that election related expenditures could lead to a cut back in infrastructure spending. Mitigation: Through effective stakeholder management, the Company is able to manage the effects of legislation on its operations. KenGen is also an active participant in the Committee that is conducting the ongoing review of the National Energy Policy & Energy Bill which has taken into consideration sectoral changes in the Constitution. Single Buyer Model The Company currently sells all its generated electric energy to a sole customer namely; Kenya Power. This could have an adverse effect on KenGen s revenues should Kenya Power s financial health be affected adversely by the macro-economic factors. Mitigation: The Company continues to collaborate with other stakeholders to ensure the enactment of the Energy Bill into law to allow for the entry of more players in the wholesale and retail electricity market thus giving the Company an option to sell bulk energy to multiple customers. The Energy Bill, if enacted, will also provide for the establishment of an independent system operator to ensure economic merit order of power plant dispatch is strictly followed. Project Implementation Practices Energy generation projects bear significant construction risks arising from delayed completion and commissioning. Mitigation: The Company continues to manage factors in project implementation which could result in cost overruns and project delays. We continue to improve on procurement management to ensure only skilled and experienced Engineering, Procurement Construction (EPC) contractors and consultants are engaged for all projects. The Company also executes agreements that require the contractors to pay sufficient liquidated damages in the event of default. 113
116 Risk Management Power Evacuation from Generation Sites Timely completion of transmission line projects is critical for ensuring that we maintain the generation capacity so as to meet Kenya s electricity needs. However, Ketraco, the State Corporation with the mandate of constructing transmission lines, faces the challenge of unjustified land compensation demands from local stakeholders affected by its projects. This in essence leads to stoppage/delay in the completion of transmission lines thereby affecting KenGen s ability to evacuate electricity from generation sites in a timely manner. Mitigation: KenGen, in liaison with other stakeholders who are affected by wayleave challenges are collaborating on the review of the National Land Act to provide for an enabling subsidiary legislation for partial (wayleave) and permanent land acquisition to facilitate the construction of transmission lines. In addition, the Energy Bill, if enacted into law, will provide mechanisms and avenues for addressing agitation by the stakeholders. Plant Availability The Company has continued to enhance generation capacity through increased power production, enhanced plant availability and reduced machine down time. This has led to increased generation revenues and subsequent increase in shareholders value. Mitigation: The Company has planned to enter into a contracting framework for the supply of critical plant components to ensure timely delivery of spare parts. In addition, the Company will undertake proper planning to ensure adherence to plant and equipment maintenance programs. Mitigation: The Company continues to explore ways of securing additional sources of funding through Public Private Partnerships (PPP) arrangements to supplement its internally generated funds. The Company also undertook a successful rights issue during the year of which the proceeds will be used for project expansion. Security Risks With the changing local and international dynamics, security is a key concern to the country and more so to KenGen due to its power generation facilities which are strategic national assets. Mitigation: KenGen has taken proactive measures through investment in security to ensure that our staff and assets are protected. We also work closely with law enforcement agencies to ensure our customers interests are protected. Business Continuity Management & Disaster Mitigation Due to increased threats of disaster in the country, there is a need to ensure that the Company has in place an effective system of business continuity and disaster recovery management. Mitigation: The Internal Audit & Risk Management Department jointly with the Regulatory & corporate Affairs Division is facilitating the implementation of a business continuity and disaster management system in the Company. This will ensure that the Company has in place adequate measures to address risks that may adversely impact continued business operation and disaster recovery. Access to Capital Funds for Expansion Programme The Company needs substantial capital to finance its business plan and in particular capacity expansion projects. The medium-term planned capacity addition under the various expansion programs between the years is 721MW and is estimated to cost over US$ 1.3 billion. 114


117 Olkaria Wellhead Aerial view of Ngong Wind Farm Masinga Power Station Olkaria IV night shot Aerial view of Kipevu Power Plant 115
118 116

119 FINANCIAL STATEMENTS FOR THE YEAR ENDED 30TH JUNE

120 118
121 STATEMENT OF DIRECTORS RESPONSIBILITIES The Kenyan Companies Act requires the Directors to prepare financial statements for each financial year which give a true and fair view of the state of affairs of the Company as at the end of the financial year and of its profit or loss for that year. It also requires the directors to ensure that the company keeps proper accounting records that disclose, with reasonable accuracy, the financial position of the Company. The Directors are also responsible for safeguarding the assets of the Company. The Directors accept responsibility for the preparation and fair presentation of financial statements that are free from material misstatements whether due to fraud or error. They also accept responsibility for: i) Designing, implementing and maintaining internal control as they deem necessary to enable the preparation of financial statements that are free from material misstatements, whether due to fraud or error. ii) Selecting and applying appropriate accounting policies; iii) Making accounting estimates and judgements that are reasonable in the circumstances. The Directors are of the opinion that the financial statements give a true and fair view of the financial position of the company as at 30 June 2016 and of the Company s financial performance and cash flows for the year then ended in accordance with International Financial Reporting Standards and the requirements of the Kenyan Companies Act. Nothing has come to the attention of the Directors to indicate that the company will not remain a going concern for at least the next twelve months from the date of this statement. Approved by the board of directors on 19 October 2016 and signed on its behalf by: Joshua Choge Dorcas Kombo Albert Mugo Chairman Director Managing Director & CEO Nairobi, 19 October 2016 STATEMENT BY COMPANY SECRETARY In accordance with Section 125 of the Companies Act, I certify that the Company has lodged with the Registrar-General all such returns as are required of a public company in terms of the Act, and that all such returns are true, correct and up to date. Rebbeca Miano Company Secretary Nairobi, 19 October
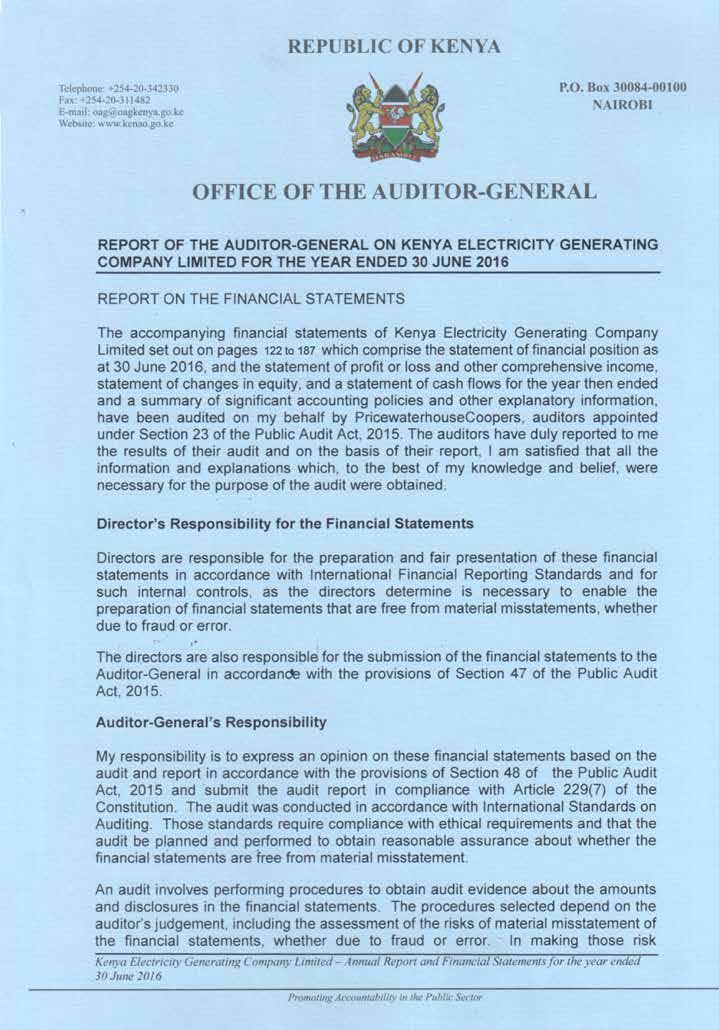
122 120
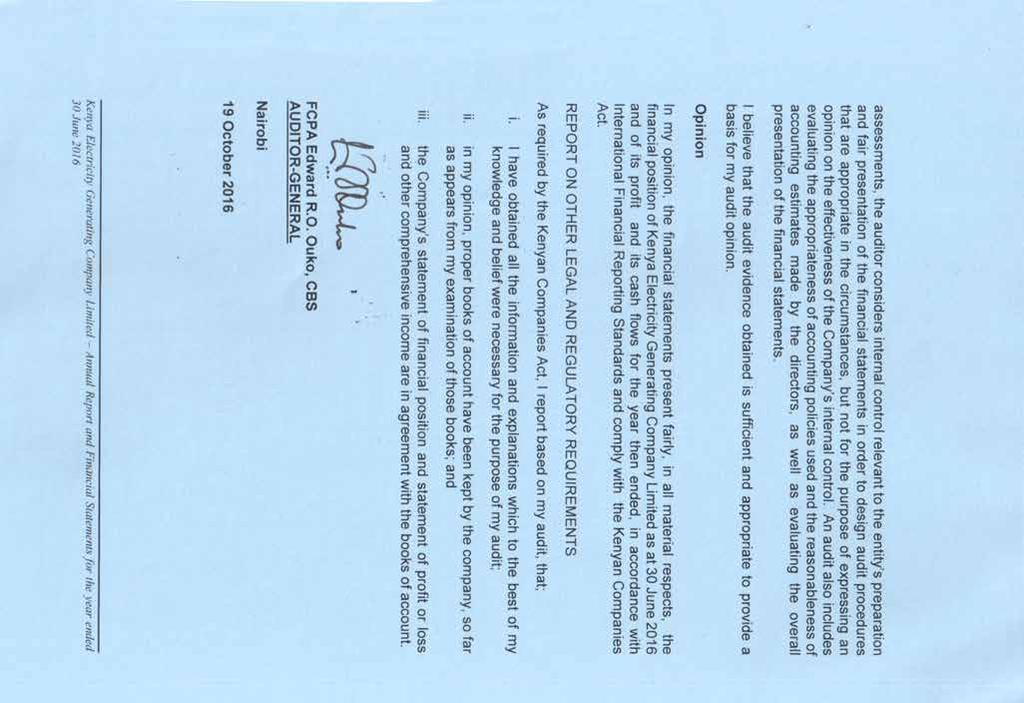
123 121
124 STATEMENT OF PROFIT OR LOSS AND OTHER COMPREHENSIVE INCOME for the year ended 30 June 2016 Note Shs 000 Shs 000 Electricity revenue 4 29,543,488 25,602,038 Steam revenue 5 6,856,018 3,689,361 36,399,506 29,291,399 Other income 6 2,210, ,902 38,609,556 29,957,301 Employee expenses 8 (a) (4,389,290) (4,162,284) Operating expenses 8 (b) (4,558,578) (4,285,122) Depreciation and amortisation 8 (c) (10,223,370) (6,478,945) Steam costs 5 (3,167,173) (3,689,361) Operating profit 16,271,145 11,341,589 Compensating tax 30 (2,431,022) - Finance income 7 556, ,082 Finance costs 9 (3,132,187) (3,010,659) Profit before income tax 10 11,264,044 8,690,012 Income tax (expense)/credit 11(a) (4,520,552) 2,827,315 Profit for the year 6,743,492 11,517,327 Other comprehensive income: Items that will not be reclassified subsequently to profit or loss Remeasurement of defined benefit 28 (a) (394,996) 214,462 Deferred tax on remeasurement of defined benefit ,499 (64,339) Revaluation surplus 13-77,203,898 Deferred tax on revaluation surplus 29 - (23,161,169) (276,497) 54,192,852 Items that may be reclassified subsequently to profit or loss: Net (losses)/gain on revaluation of available-for-sale treasury bonds 19(c) (19,772) 2,270 Cumulative loss reclassified from equity on disposal of available-for-sale treasury bonds 19(c) - 51,314 (19,772) 53,584 Other comprehensive income for the year, net of income tax (296,269) 54,246,436 Total comprehensive income for the year 6,447,223 65,763,763 Earnings per share Basic (Shs) Diluted(Shs)
125 STATEMENT OF FINANCIAL POSITION for the year ended 30 June 2016 Note Shs 000 Shs 000 ASSETS Non-current assets Property, plant and equipment ,932, ,378,764 Prepaid leases on land 14 4,150,673 3,223,658 Intangible assets 15 1,181,241 1,122,452 Non-current receivables 18 15,037,721 7,207,494 Treasury bonds 19 2,420,560 2,426,440 Retirement benefit asset 28 1,609,201 1,792, ,332, ,151,022 Current assets Inventories , ,076 Trade receivables 16 10,045,640 8,716,677 Other receivables and prepayments 21 3,925,727 8,119,110 Treasury bonds , ,803 Cash and bank balances 23 6,756,324 3,292,307 21,916,420 21,368,973 TOTAL ASSETS 367,248, ,519,
126 STATEMENT OF FINANCIAL POSITION for the year ended 30 June 2016 Note Shs 000 Shs 000 EQUITY AND LIABILITIES Equity attributable to owners Share capital 24 15,609,684 5,495,904 Share premium 24 21,056,341 5,039,818 Other reserves 25 77,540,603 79,912,755 Retained earnings 58,536,054 51,145, ,742, ,594,091 Non- current liabilities Borrowings 26(b) 126,149, ,191,309 Deferred income tax 29 40,226,857 35,924,900 Trade and other payables 30 9,940,189 5,329, ,316, ,445,931 Current liabilities Borrowings due within one year 26(a) 10,757,003 9,427,225 Trade and other payables 30 4,943,371 7,922,747 Compensating tax 30 (b) 2,431, ,984 Current income tax 11(c) 58, ,843 Dividends payable 31(a) - 4,735,174 Total liabilities 18,190,059 22,479,973 TOTAL EQUITY AND LIABILITIES 367,248, ,519,995 The financial statements on pages 122 to 187 were approved and authorised for issue by the Board of Directors on19 October, 2016 and were signed on its behalf by: Joshua Choge Dorcas Kombo Albert Mugo Chairman Director Managing Director & CEO 124
127 STATEMENT OF CHANGES IN EQUITY for the year ended 30 June 2016 Share capital Share premium Other reserves Retained earnings Total Shs 000 Shs 000 Shs 000 Shs 000 Shs 000 At 1 July ,495,904 5,039,818 26,289,211 39,884,740 76,709,673 Profit for the year ,517,327 11,517,327 Other comprehensive income; -revaluation of bonds available for sale ,584-53,584 -revaluation of property, plant and equipment ,042,729-54,042,729 -remeasurement of defined benefit , ,462 -deferred income tax on remeasurment - - (64,339) - (64,339) Total comprehensive income for the year ,246,436 11,517,327 65,763,763 Transfer of excess depreciation - - (854,000) 854,000 - Deferred tax on revaluation surplus current year ,108 (231,108) - Transaction with owners: Dividend declared (879,345) (879,345) At 30 June ,495,904 5,039,818 79,912,755 51,145, ,594,091 As at 1 July ,495,904 5,039,818 79,912,755 51,145, ,594,091 Profit for the year ,743,492 6,743,492 Other comprehensive income; - revaluation of bonds available for sale - - (19,772) - (19,772) -remeasurement of defined benefit - - (394,996) - (394,996) -deferred income tax on remeasurment , ,499 Total comprehensive income for the year - - (296,269) 6,743,492 6,447,223 Transfer of excess depreciation - - (3,045,117) 3,045,117 - Deferred tax on revaluation surplus current year ,234 (969,234) - Transaction with owners -Rights issue (Note 24) 10,113,780 16,016, ,130,303 Dividend declared 2015 (Note 32) (1,428,935) (1,428,935) At 30 June ,609,684 21,056,341 77,540,603 58,536, ,742,682 Intergrated Annual Report & Financial Statements for the Year Ended June
128 STATEMENT OF CASH FLOWS for the year ended 30 June 2016 Note Shs 000 Shs 000 Cash flows from operating activities Cash generated from operations 33(a) 32,365,267 14,698,792 Income tax paid 33(c) (182,276) (351,982) Interest received 33(b) 540, ,439 Interest paid 33(c) (3,467,409) (2,185,558) Net cash generated by operating activities 29,256,013 12,525,691 Cash flows from investing activities Purchase of property, plant and equipment 13 (26,946,907) (27,231,523) Purchase of prepaid leasehold land 14 - (772,716) Purchase of intangible assets 15 (10,444) (129,771) Proceeds from disposal of assets 171,462 15,632 Proceeds on sale/redemption of treasury bonds 19(c) - 259,073 Cash proceeds from rights issue 4,096,240 - Net cash used in investing activities (22,689,649) (27,859,305) Cash flows from financing activities Repayment of borrowings 26(d) (6,360,398) (12,719,460) Proceeds from borrowings 26(d) 9,422,158 26,981,206 Dividends paid to owners of the company 32 (6,164,107) (263,804) Net cash generated from financing activities (3,102,347) 13,997,942 Net increase/(decrease) in cash and cash equivalents 3,464,017 (1,335,672) Cash and cash equivalents at the beginning of the year 3,292,307 4,627,979 Cash and cash equivalents at the end of the year 23 6,756,324 3,292,
129 NOTES TO THE FINANCIAL STATEMENTS 1. GENERAL INFORMATION The company is incorporated and domiciled in Kenya under the Kenyan Companies Act. The company was incorporated in 1954 as Kenya Power Company Limited (KPC) and was under management of Kenya Power & Lighting Company (Kenya Power). In 1997, the management was separated from Kenya Power & Lighting Company Limited and the company was renamed to Kenya Electricity Generating Company Limited (KenGen) following the implementation of the reforms in the energy sector. Its core business is to develop, manage and operate power generation plants to supply electric power to the Kenyan market. The shares of the company are listed on the Nairobi Securities Exchange. 2. ACCOUNTING POLICIES Basis of preparation The financial statements have been prepared in accordance with International Financial Reporting Standards (IFRS). These financial statements are prepared in Kenya shillings thousands (Shs 000) which is the company s functional and presentation currency. The preparation of financial statements in conformity with IFRS requires the use of certain critical accounting estimates. It also requires the directors to exercise judgement in the process of applying the Company s accounting policies. The areas involving a higher degree of judgement or complexity, or where assumptions and estimates are significant to the financial statements, are disclosed in Note 3. For the Kenyan Companies Act reporting purposes, in these financial statements, the balance sheet is represented by/is equivalent to the statement of financial position and the profit and loss account is presented in the statement of profit or loss and other comprehensive income. Application of new and revised International Financial Reporting Standards (IFRSs) (i) New standards and amendments to published standards effective for the year ended 30 June 2016 The following new and revised IFRSs were effective in the current year and had no material impact on the amounts reported in these financial statements. 127
130 NOTES TO THE FINANCIAL STATEMENTS (Continued) 2. ACCOUNTING POLICIES (Continued) Application of new and revised International Financial Reporting Standards (IFRSs) (Continued) (i) New standards and amendments to published standards effective for the year ended 30 June 2016 (Continued) Amendments to IAS 32 Offsetting Financial Assets and Financial Liabilities The amendments to IAS 32 clarify the requirements relating to the offset of financial assets and financial liabilities. Specifically, the amendments clarify the meaning of currently has a legally enforceable right of set-off and simultaneous realisation and settlement. As the Company does not have any financial assets and financial liabilities that qualify for offset, the application of the amendments has had no impact on the disclosures or on the amounts recognised in the Company s financial statements. IFRIC 21 Levies IFRIC 21 addresses the issue as to when to recognise a liability to pay a levy imposed by a government. The Interpretation defines a levy, and specifies that the obligating event that gives rise to the liability is the activity that triggers the payment of the levy, as identified by legislation. The Interpretation provides guidance on how different levy arrangements should be accounted for, in particular, it clarifies that neither economic compulsion nor the going concern basis of financial statements preparation implies that an entity has a present obligation to pay a levy that will be triggered by operating in a future period. The application of this Interpretation has had no material impact on the disclosures or on the amounts recognised in the Company s financial statements. Amendments to IAS 36 Recoverable Amount Disclosures for Non-Financial Assets The amendments to IAS 36 remove the requirement to disclose the recoverable amount of a cashgenerating unit (CGU) to which goodwill or other intangible assets with indefinite useful lives had been allocated when there has been no impairment or reversal of impairment of the related CGU. Furthermore, the amendments introduce additional disclosure requirements applicable to when the recoverable amount of an asset or a CGU is measured at fair value less costs of disposal. These new disclosures include the fair value hierarchy, key assumptions and valuation techniques used which are in line with the disclosure required by IFRS 13 Fair Value Measurements. As the Company does not have any cash-generating units (CGU) to which goodwill or other intangible assets with indefinite useful lives had been allocated, the application of the amendments has had no impact on the disclosures or on the amounts recognised in the Company s financial statements. 128
131 NOTES TO THE FINANCIAL STATEMENTS (Continued) 2. ACCOUNTING POLICIES (Continued) Application of new and revised International Financial Reporting Standards (IFRSs) (Continued) (ii) New and amended standards and interpretations in issue but not yet effective in the year ended 30 June 2016 A number of new standards and amendments to standards and interpretations are effective for annual periods beginning after 1 January 2015, and have not been applied in preparing these financial statement. None of these is expected to have a significant effect on the financial statements of the Company, except the following set out below. IFRS 9, Financial instruments, addresses the classification, measurement and recognition of financial assets and financial liabilities. The complete version of IFRS 9 was issued in July It replaces the guidance in IAS 39 that relates to the classification and measurement of financial instruments. IFRS 9 retains but simplifies the mixed measurement model and establishes three primary measurement categories for financial assets: amortised cost, fair value through OCI and fair value through P&L. The basis of classification depends on the entity s business model and the contractual cash flow characteristics of the financial asset. Investments in equity instruments are required to be measured at fair value through profit or loss with the irrevocable option at inception to present changes in fair value in OCI not recycling. There is now a new expected credit losses model that replaces the incurred loss impairment model used in IAS 39. For financial liabilities there were no changes to classification and measurement except for the recognition of changes in own credit risk in other comprehensive income, for liabilities designated at fair value through profit or loss. IFRS 9 relaxes the requirements for hedge effectiveness by replacing the bright line hedge effectiveness tests. It requires an economic relationship between the hedged item and hedging instrument and for the hedged ratio to be the same as the one management actually use for risk management purposes. Contemporaneous documentation is still required but is different to that currently prepared under IAS 39. The standard is effective for accounting periods beginning on or after 1 January Early adoption is permitted. The company is yet to assess IFRS 9 s full impact. IFRS 15 Revenue from Contracts with Customers IFRS 15, Revenue from contracts with customers deals with revenue recognition and establishes principles for reporting useful information to users of financial statements about the nature, amount, timing and uncertainty of revenue and cash flows arising from an entity s contracts with customers. Revenue is recognised when a customer obtains control of a good or service and thus has the ability to direct the use and obtain the benefits from the good or service. The standard replaces IAS 18 Revenue and IAS 11 Construction contracts and related interpretations. The standard is effective for annual periods beginning on or after 1 January 2018 and earlier application is permitted. The company is assessing the impact of IFRS 15. IFRS 16, Leases, Effective date - 1 January 2019 After ten years of joint drafting by the IASB and FASB they decided that lessees should be required to recognise assets and liabilities arising from all leases (with limited exceptions) on the balance sheet. Lessor accounting has not substantially changed in the new standard. The model reflects that, at the start of a lease, the 129
132 NOTES TO THE FINANCIAL STATEMENTS (Continued) 2. ACCOUNTING POLICIES (Continued) Application of new and revised International Financial Reporting Standards (IFRSs) (Continued) (ii) New and amended standards and interpretations in issue but not yet effective in the year ended 30 June 2016 (Continued) lessee obtains the right to use an asset for a period of time and has an obligation to pay for that right. In response to concerns expressed about the cost and complexity to apply the requirements to large volumes of small assets, the IASB decided not to require a lessee to recognise assets and liabilities for short-term leases (less than 12 months), and leases for which the underlying asset is of low value (such as laptops and office furniture). A lessee measures lease liabilities at the present value of future lease payments. A lessee measures lease assets, initially at the same amount as lease liabilities, and also includes costs directly related to entering into the lease. Lease assets are amortised in a similar way to other assets such as property, plant and equipment. (iii) Relevant new and revised IFRSs in issue but not yet effective for the year ended 30 June 2016 This approach will result in a more faithful representation of a lessee s assets and liabilities and, together with enhanced disclosures, will provide greater transparency of a lessee s financial leverage and capital employed. One of the implications of the new standard is that there will be a change to key financial ratios derived from a lessee s assets and liabilities (for example, leverage and performance ratios). IFRS 16 supersedes IAS 17, Leases, IFRIC 4, Determining whether an Arrangement contains a Lease, SIC 15, Operating Leases Incentives and SIC 27, Evaluating the Substance of Transactions Involving the Legal Form of a Lease. Amendments to IAS 16 and IAS 38 Clarification of Acceptable Methods of Depreciation and Amortisation The amendments to IAS 16 prohibit entities from using a revenue-based depreciation method for items of property, plant and equipment. The amendments to IAS 38 introduce a rebuttable presumption that revenue is not an appropriate basis for amortisation of an intangible asset. This presumption can only be rebutted in the following two limited circumstances: a) when the intangible asset is expressed as a measure of revenue; or b) when it can be demonstrated that revenue and consumption of the economic benefits of the intangible asset are highly correlated. The amendments apply prospectively for annual periods beginning on or after 1 January Currently, the Company uses the straight-line method for depreciation and amortisation for its property and equipment, and intangible assets respectively. The directors of the Company do not anticipate that the application of the standard will have a significant impact on the Company s financial statements. 130
133 NOTES TO THE FINANCIAL STATEMENTS (Continued) 2. ACCOUNTING POLICIES (Continued) Application of new and revised International Financial Reporting Standards (IFRSs) (Continued) (iii) Relevant new and revised IFRSs in issue but not yet effective for the year ended 30 June 2016 Annual Improvements Cycle The Annual Improvements to IFRSs Cycle include a number of amendments to various IFRSs, which are summarised below: The amendments to IFRS 3 clarify that the standard does not apply to the accounting for the formation of all types of joint arrangement in the financial statements of the joint arrangement itself. The amendments to IFRS 13 clarify that the scope of the portfolio exception for measuring the fair value of a group of financial assets and financial liabilities on a net basis includes all contracts that are within the scope of, and accounted for in accordance with, IAS 39 or IFRS 9, even if those contracts do not meet the definitions of financial assets or financial liabilities within IAS 32 The amendments to IAS 40 clarify that IAS 40 and IFRS 3 are not mutually exclusive and application of both standards may be required. Consequently, an entity acquiring investment property must determine whether: (a) the property meets the definition of investment property in terms of IAS 40; and (b) the transaction meets the definition of a business combination under IFRS 3 The directors of the Company do not anticipate that the application of these amendments will have a significant impact on the Company s financial statements. (iv) Early adoption of standards The company did not early-adopt any new or amended standards in 2016 Revenue recognition Revenue is recognised to the extent that it is probable that the economic benefits will flow to the company and the revenue can be reliably measured. Revenue is measured at the fair value of the consideration received or receivable excluding discounts, rebates and sales taxes or duty. The following specific recognition criteria must be met before revenue is recognised: (i) Electricity sales Electricity sales are recognised on the basis of available capacity and energy sold to the authorised distributor s transmission systems. The Power Purchase Agreements (PPAs) between the Kenya Power and the company stipulate that electricity sales will be agreed upfront on capacity and energy the company is going to produce and transmit during the year. Capacity charge 131
134 NOTES TO THE FINANCIAL STATEMENTS (Continued) 2. ACCOUNTING POLICIES (Continued) Revenue recognition (Continued) (i) Electricity sales (Continuation) is meant to accelerate the company s return on investments so it can focus on future expansion programs in building capacity to meet demand. Energy charge compensates for the electricity produced and sold to the distributor. Revenue also includes realised foreign exchange adjustments as stipulated in the PPAs. (ii) Interest Interest income is accrued on a time basis, by reference to the principal outstanding and at the effective interest rate applicable, which is the rate that exactly discounts estimated future cash receipts through the expected life of the financial asset to that asset s net carrying amount on initial recognition. (iii) Rental income Rental income is accounted for on a straight-line basis over the lease term. Foreign currency translation (a) Functional and presentation currency Items included in the financial statements are measured using the currency of the primary economic environment in which the entity operates ( the functional currency ). The financial statements are presented in Kenya Shillings in thousands (Shs) which is the Company s functional currency. (b) Transactions and balances In preparing the financial statements of the company, transactions in currencies other than the company s functional currency (foreign currencies) are recognised at the rates of exchange prevailing at the dates of the transactions. At the reporting date, monetary items denominated in foreign currencies are retranslated at the rates prevailing at that date. Non-monetary items carried at fair value that are denominated in foreign currencies are retranslated at the rates prevailing at the date when the fair value was determined. Non-monetary items that are measured in terms of historical cost in a foreign currency are not retranslated. Exchange differences on monetary items are recognised in profit or loss in the period in which they arise except for: exchange differences on foreign currency borrowings relating to assets under construction for future productive use, which are included in the cost of those assets when they are regarded as an adjustment to interest costs on those foreign currency borrowings; exchange differences on transactions entered into in order to hedge certain foreign currency risks; and exchange differences on monetary items receivable from or payable to a foreign operation for which settlement is neither planned nor likely to occur (therefore forming part of the net investment in the foreign operation), which are recognised initially in other comprehensive income and reclassified from equity to profit or loss on repayment of the monetary items. 132
135 NOTES TO THE FINANCIAL STATEMENTS (Continued) 2. ACCOUNTING POLICIES (Continued) Taxation Income tax expense represents the sum of the tax currently payable and deferred tax. (i) Current tax The tax currently payable is based on taxable profit for the year. Taxable profit differs from profit as reported in the profit or loss because of items of income or expense that are taxable or deductible in other years and items that are never taxable or deductible. The company s liability for current tax is calculated using tax rates that have been enacted or substantively enacted at the reporting date (ii) Deferred tax Deferred tax is recognised on temporary differences between the carrying amounts of assets and liabilities in the financial statements and the corresponding tax bases used in the computation of taxable profit. Deferred tax liabilities are generally recognised for all taxable temporary differences. Deferred tax assets are generally recognised for all deductible temporary differences to the extent that it is probable that taxable profits will be available against which those deductible temporary differences can be utilised. Such deferred tax assets and liabilities are not recognised if the temporary difference arises from goodwill or from the initial recognition (other than in a business combination) of other assets and liabilities in a transaction that affects neither the taxable profit nor the accounting profit. The carrying amount of deferred tax assets is reviewed at the reporting date and reduced to the extent that it is no longer probable that sufficient taxable profits will be available to allow all or part of the asset to be recovered. Deferred tax assets and liabilities are measured at the tax rates that are expected to apply in the period in which the liability is settled or the asset realised, based on tax rates (and tax laws) that have been enacted or substantively enacted at the reporting date. The measurement of deferred tax liabilities and assets reflects the tax consequences that would follow from the manner in which the company expects, at the reporting date, to recover or settle the carrying amount of its assets and liabilities. Deferred tax is recognised in profit or loss, except when they relate to items that are recognised in other comprehensive income or directly in equity, in which case, the deferred tax is also recognised in other comprehensive income or directly in equity respectively. Where current tax or deferred tax arises from the initial accounting for a business combination, the tax effect is included in the accounting for business combination. 133
136 NOTES TO THE FINANCIAL STATEMENTS (Continued) 2. ACCOUNTING POLICIES (Continued) Employees benefits i) Retirement benefits obligations The company operates a defined benefits scheme and a defined contributions scheme. Payments to defined contribution retirement benefit plans are recognised as an expense when employees have rendered service entitling them to the contributions. For defined retirement benefit plans, the cost of providing benefits is determined using the projected unit credit method, with actuarial valuations being carried out at the end of each annual reporting period. Remeasurement, comprising actuarial gains and losses, the effect of the changes to the asset ceiling (if applicable) and the return on plan assets (excluding interest), is reflected immediately in the statement of financial position with a charge or credit recognised in other comprehensive income in the period in which they occur. Remeasurement recognised in other comprehensive income is reflected immediately in retained earnings and will not be reclassified to profit or loss. Past service cost is recognised in profit or loss in the period of a plan amendment. Net interest is calculated by applying the discount rate at the beginning of the period to the net defined benefit liability or asset. Defined benefit costs are categorised as service costs (including current service cost, past service cost, as well as gains and losses on curtailments and settlements), net interest expense or income and remeasurment. i) Retirement benefits obligations (continued) The company presents the first two components of defined benefit costs in profit or loss in the line item of pension costdefined benefit scheme (included in staff costs). Curtailment gains and losses are accounted for as past service costs. The retirement benefit obligation recognised in the statement of financial position represents the actual deficit or surplus in the company s defined benefit plans. Any surplus resulting from this calculation is limited to the present value of any economic benefits available in the form of refunds from the plans or reductions in future contributions to the plans. A liability for a termination benefit is recognised at the earlier of when the entity can no longer withdraw the offer of the termination benefit and when the entity recognises any related restructuring costs. ii) Other entitlements The monetary benefits for employees accrued annual leave entitlement at the reporting date are recognised as a provision. 134
137 NOTES TO THE FINANCIAL STATEMENTS (Continued) 2. ACCOUNTING POLICIES (Continued) Property, plant and equipment All categories of property, plant and equipment are initially recorded at cost. Land and buildings, transmission lines and plant and equipment are subsequently shown at fair value on periodic basis, but at least every five year, valuations by external independent valuers less subsequent depreciation for buildings. All other property, plant and equipment is stated at historical cost less depreciation. Historical cost includes expenditure that is attributable to the acquisition of the items. The initial cost of an asset comprises its purchase price or construction cost, any costs directly attributable to bringing the asset into operation, the initial estimate of the decommissioning obligation and for qualifying assets, borrowing costs. The purchase price or construction cost is the aggregate amount paid and the fair value of any other consideration given to acquire the asset. Property, plant and equipment in the course of construction for production, supply or administrative purposes are carried at cost, less any recognised impairment loss. Cost includes professional fees and, for qualifying assets, borrowing costs capitalised on qualifying assets. Such items of property, plant and equipment are classified to the appropriate categories of property, plant and equipment when completed and ready for intended use. Depreciation of these assets, on the same basis as other property assets, commences when the assets are ready for their intended use. Revaluations are performed with sufficient regularity such that the carrying amounts do not differ materially from those that would be determined using fair values at the reporting date. Any increases arising on the revaluation of such plant and machinery is recognised in other comprehensive income and accumulated in equity, except to the extent that it reverses a revaluation decrease for the same asset previously recognised in profit or loss, in which case the increase is credited to profit or loss to the extent of the decrease previously expensed A decrease in the carrying amount arising on the revaluation of such an asset is recognised in profit or loss to the extent that it exceeds the balance, if any, held in the properties revaluation reserve relating to a previous revaluation of that asset. All productive wells are capitalized in property, plant and equipment when connected and are depreciated over their useful lives. The useful life is currently estimated to be twenty five years from the date of commencement of commercial operation. The cost of unproductive wells is transferred to the profit or loss in the year in which they are certified complete but unproductive. Where a well ceases to be productive before the end of its expected useful life, the net book value of the well is charged to the profit or loss in the year it ceases to be productive. 135
138 NOTES TO THE FINANCIAL STATEMENTS (Continued) 2. ACCOUNTING POLICIES (Continued) Depreciation Depreciation is calculated on the straight-line basis and is recognised so as to write off the cost or valuation of assets (other than freehold land and Work-in progress under construction) less their residual values over their useful lives, using the straightline method. The annual depreciation rates in use are: Buildings 2.85% Transmission lines 2.5% Plant and machinery: - Hydro plants 2% - Geothermal wells 6.67% - Geothermal wellheads 6.67% - Geothermal plants 4% - Thermal plants and wind plants 5% - Rigs 6.67% Intake and tunnels 1% Motor vehicles 25% Furniture, equipment and fittings 12.5% Computers 20% Freehold land is not depreciated and leasehold land is amortised over the lease period. Residual value, useful life and depreciation methods are reviewed at least annually at the reporting date. Changes in the residual value and expected useful life are accounted for by changing the depreciation charge for the year, and treated as changes in accounting estimates. Depreciation on revalued assets is recognised in profit or loss and a transfer of excess depreciation is made from the asset revaluation reserve to retained earnings. On the subsequent sale or retirement of a revalued property, the attributable revaluation surplus remaining in the properties revaluation reserve is transferred directly to retained earnings. An item of property, plant and equipment is derecognised upon disposal or when no future economic benefits are expected to arise from the continued use of the asset. Any gain or loss arising on the disposal or retirement of an item of property, plant and equipment is determined as the difference between the sales proceeds and the carrying amount of the asset and is recognised in profit or loss. On disposal of revalued assets, amounts in the revaluation surplus relating to that asset are transferred to retained earnings. 136
139 NOTES TO THE FINANCIAL STATEMENTS (Continued) 2. ACCOUNTING POLICIES (Continued) Depreciation attributable to the drilling equipment is capitalized and forms part of the cost of direct wells. Intangible assets Intangible assets acquired separately are measured on initial recognition at cost. Following initial recognition, intangible assets are carried at cost less any accumulated amortisation and any accumulated impairment losses. The useful life of the assets depends on the duration of the licences. Intangible assets with finite lives are amortised over the useful economic life and assessed for impairment whenever there is an indication that the intangible asset may be impaired. The amortisation period and the amortisation method for an intangible asset with a finite useful life is reviewed at least at the reporting date. Changes in the expected useful life or the expected pattern of consumption of future economic benefits embodied in the asset is accounted for by changing the amortisation period or method, as appropriate, and are treated as changes in accounting estimates. The amortisation expense on intangible assets with finite lives is recognised in the profit or loss in the expense category consistent with the function of the intangible asset. An intangible asset is derecognised on disposal, or when no future economic benefits are expected from use or disposal. Gains or losses arising from derecognition of an intangible asset are measured as the difference between the net disposal proceeds and the carrying amount of the asset and are recognised in profit or loss when the asset is derecognised. Impairment of tangible and intangible assets excluding goodwill At each reporting date the company reviews the carrying amounts of its tangible and intangible assets to determine whether there is any indication that those assets have suffered an impairment loss. If any such indication exists, the recoverable amount of the asset is estimated in order to determine the extent of the impairment loss (if any). Where it is not possible to estimate the recoverable amount of an individual asset, the company estimates the recoverable amount of the cash-generating unit to which the asset belongs. Where a reasonable and consistent basis of allocation can be identified, corporate assets are also allocated to individual cash-generating units, or otherwise they are allocated to the smallest company of cash-generating units for which a reasonable and consistent allocation basis can be identified. Recoverable amount is the higher of fair value less costs to sell and value in use. In assessing value in use, the estimated future cash flows are discounted to their present value using a pre-tax discount rate that reflects current market assessments of the time value of money and the risks specific to the asset for which the estimates of future cash flows have not been adjusted. If the recoverable amount of an asset (or cash-generating unit) is estimated to be less than its carrying amount, the carrying amount of the asset (or cash-generating unit) is reduced to its recoverable amount. An impairment loss is recognised immediately in profit or loss, unless the relevant asset is carried at a revalued amount, in which case the impairment loss is treated as a revaluation decrease. 137
140 NOTES TO THE FINANCIAL STATEMENTS (Continued) 2. ACCOUNTING POLICIES (Continued) Impairment of tangible and intangible assets excluding goodwill (Continued) Where an impairment loss subsequently reverses, the carrying amount of the asset (or a cash-generating unit) is increased to the revised estimate of its recoverable amount, but so that the increased carrying amount does not exceed the carrying amount that would have been determined had no impairment loss been recognised for the asset (or cash-generating unit) in prior years. A reversal of an impairment loss is recognised immediately in profit or loss, unless the relevant asset is carried at a revalued amount, in which case the reversal of the impairment loss is treated as a revaluation increase. Borrowing costs Borrowing costs directly attributable to the acquisition, construction or production of qualifying assets, which are assets that necessarily take a substantial period of time to get ready for their intended use or sale, are added to the cost of those assets, until such time as the assets are substantially ready for their intended use or sale. Investment income earned on the temporary investment of specific borrowings pending their expenditure on qualifying assets is deducted from the borrowing costs eligible for capitalisation. Capitalised costs include interest charges and foreign currency exchange differences on borrowings for projects under construction to the extent that they are regarded as adjustments to interest rates. All other borrowing costs are recognised in profit or loss in the period in which they are incurred. Inventories Inventories are valued at the lower of cost or net realisable value. Cost is determined on a weighted average basis and comprises expenditure incurred in the normal course of business, including direct material costs. Net realisable value is the price at which the inventory can be realised in the normal course of business after allowing for the costs of realisation. Obsolete and defective inventories are fully written off. Financial instruments Financial assets and financial liabilities are recognised when the company becomes a party to the contractual provisions of the instrument. Financial assets and financial liabilities are initially measured at fair value. Transaction costs that are directly attributable to the acquisition or issue of financial assets and financial liabilities (other than financial assets and financial liabilities at fair value through profit or loss) are added to or deducted from the fair value of the financial assets or financial liabilities, as appropriate, on initial recognition. Transaction costs directly attributable to the acquisition of financial assets or financial liabilities at fair value 138
141 NOTES TO THE FINANCIAL STATEMENTS (Continued) 2. ACCOUNTING POLICIES (Continued) Financial instruments (Continued) through profit or loss are recognised immediately in profit or loss. Financial assets Financial assets are classified into the following specified categories: financial assets at fair value through profit or loss (FVTPL), held-to-maturity investments, available-for-sale (AFS) financial assets and loans and receivables. The classification depends on the nature and purpose of the financial assets and is determined at the time of initial recognition. Held-to-maturity investments Held-to-maturity investments are non-derivative financial assets with fixed or determinable payments and fixed maturity dates that the company has the positive intent and ability to hold to maturity. Subsequent to initial recognition, held-to-maturity investments are measured at amortised cost using the effective interest method less any impairment. Effective interest method The effective interest method is a method of calculating the amortised cost of a debt instrument and of allocating interest income over the relevant period. The effective interest rate is the rate that exactly discounts estimated future cash receipts (including all fees and points paid or received that form an integral part of the effective interest rate, transaction costs and other premiums or discounts) through the expected life of the debt instrument, or, where appropriate, a shorter period, to the net carrying amount on initial recognition. Available-for-sale financial assets Available-for-sale financial assets are non-derivative financial assets that are either designated as Available-for-sale financial assets or are not classified as (a) loans and receivables, (b) held-to-maturity investments or (c) financial assets at fair value through profit or loss. The company has investments in debt securities that are traded in an active market and are stated at fair value at the reporting date. The fair value of available-for-sale debt securities is determined by reference to published price quotations in an active market. Interest income calculated using the effective interest method is recognised in profit or loss except for interest income earned on the temporary investment of specific borrowings pending their expenditure on qualifying assets which is deducted from the borrowing costs eligible for capitalisation. Fair value changes in the carrying amount of available-for-sale financial assets are recognised in other comprehensive income and accumulated under the heading of investments revaluation reserve. Where the investment is disposed of or is determined to be impaired, the cumulative gain or loss previously accumulated in the investments revaluation reserve is reclassified to profit or loss. Loans and receivables Loans and receivables are non-derivative financial assets with fixed or determinable payments that are not quoted in an active market. Loans and receivables (including trade and other receivables, bank balances and cash) are measured at amortised cost 139
142 NOTES TO THE FINANCIAL STATEMENTS (Continued) 2. ACCOUNTING POLICIES (Continued) Financial instruments (Continued) Loans and receivables (Continued) using the effective interest method, less any impairment. Interest income is recognised by applying the effective interest rate, except for short-term receivables when the recognition of interest would be immaterial. Impairment of financial assets At each reporting date, all financial assets are subject to review for impairment. If it is probable that the company will not be able to collect all amounts due (principal and interest) according to the contractual terms of loans, receivables, or held-tomaturity investments carried at amortised cost, an impairment or bad debt loss has occurred. The carrying amount of the asset is reduced to its estimated recoverable amount either directly or through use of an allowance account. The amount of the loss incurred is dealt with through profit or loss for the period. For Available-for-sale debt securities, a significant or prolonged decline in the fair value of the security below its cost is considered to be objective evidence of impairment. For all other financial assets, objective evidence of impairment could include: significant financial difficulty of the issuer or counterparty; or breach of contract, such as a default or delinquency in interest or principal payments; or it becoming probable that the borrower will enter bankruptcy or financial re-organisation; or the disappearance of an active market for that financial asset because of financial difficulties. For certain categories of financial assets, such as trade receivables, assets that are assessed not to be impaired individually are, in addition, assessed for impairment on a collective basis. Objective evidence of impairment for a portfolio of receivables could include the company s past experience of collecting payments, an increase in the number of delayed payments in the portfolio past the average credit period of 40 days, as well as observable changes in national or local economic conditions that correlate with default on receivables. For financial assets carried at amortised cost, the amount of the impairment loss recognised is the difference between the asset s carrying amount and the present value of estimated future cash flows, discounted at the financial asset s original effective interest rate. For financial assets carried at cost, the amount of the impairment loss is measured as the difference between the asset s carrying amount and the present value of the estimated future cash flows discounted at the current market rate of return for a similar financial asset. Such impairment loss will not be reversed in subsequent periods. The carrying amount of the financial asset is reduced by the impairment loss directly for all financial assets with the exception of trade receivables, where the carrying amount is reduced through the use of an allowance account. When a trade receivable 140
143 NOTES TO THE FINANCIAL STATEMENTS (Continued) 2. ACCOUNTING POLICIES (Continued) Financial instruments (Continued) Impairment of financial assets (Continued) is considered uncollectible, it is written off against the allowance account. Subsequent recoveries of amounts previously written off are credited against the allowance account. Changes in the carrying amount of the allowance account are recognised in profit or loss. When an Available-for-sale financial asset is considered to be impaired, cumulative gains or losses previously recognised in other comprehensive income are reclassified to profit or loss in the period. For financial assets measured at amortised cost, if, in a subsequent period, the amount of the impairment loss decreases and the decrease can be related objectively to an event occurring after the impairment was recognised, the previously recognised impairment loss is reversed through profit or loss to the extent that the carrying amount of the investment at the date the impairment is reversed does not exceed what the amortised cost would have been had the impairment not been recognised. In respect of Available-for-sale debt securities, impairment losses are subsequently reversed through profit or loss if an increase in the fair value of the investment can be objectively related to an event occurring after the recognition of the impairment loss. Derecognition of financial assets The company derecognises a financial asset only when the contractual rights to the cash flows from the asset expire, or when it transfers the financial asset and substantially all the risks and rewards of ownership of the asset to another entity. If the company neither transfers nor retains substantially all the risks and rewards of ownership and continues to control the transferred asset, the company recognises its retained interest in the asset and an associated liability for amounts it may have to pay. If the company retains substantially all the risks and rewards of ownership of a transferred financial asset, the company continues to recognise the financial asset and also recognises a collateralised borrowing for the proceeds received. On derecognition of a financial asset in its entirety, the difference between the asset s carrying amount and the sum of the consideration received and receivable and the cumulative gain or loss that had been recognised in other comprehensive income and accumulated in equity is recognised in profit or loss. On derecognition of a financial asset other than in its entirety (e.g. when the company retains an option to repurchase part of a transferred asset or retains a residual interest that does not result in the retention of substantially all the risks and rewards of ownership and the company retains control), the company allocates the previous carrying amount of the financial asset between the part it continues to recognise under continuing involvement, and the part it no longer recognises on the basis of the relative fair values of those parts on the date of the transfer. The difference between the carrying amount allocated to the part that is no longer recognised and the sum of the consideration received for the part no longer recognised and any cumulative gain or loss allocated to it that had been recognised in other comprehensive income is recognised in profit or loss. A cumulative gain or loss that had been recognised in other comprehensive income is allocated between the part that 141
144 NOTES TO THE FINANCIAL STATEMENTS (Continued) 2. ACCOUNTING POLICIES (Continued) continues to be recognised and the part that is no longer recognised on the basis of the relative fair values of those parts. Financial liabilities and equity instruments Classification as debt or equity Debt and equity instruments issued by the company are classified as either financial liabilities or as equity in accordance with the substance of the contractual arrangements and the definitions of a financial liability and an equity instrument. Equity instruments An equity instrument is any contract that evidences a residual interest in the assets of an entity after deducting all of its liabilities. Equity instruments issued by the company are recognised at the proceeds received, net of direct issue costs. Financial liabilities Financial liabilities are classified as either financial liabilities at fair value through profit or loss or other financial liabilities. Other financial liabilities Other financial liabilities (including borrowings) are subsequently measured at amortised cost using the effective interest method. The effective interest method is a method of calculating the amortised cost of a financial liability and of allocating interest expense over the relevant period. The effective interest rate is the rate that exactly discounts estimated future cash payments (including all fees and points paid or received that form an integral part of the effective interest rate, transaction costs and other premiums or discounts) through the expected life of the financial liability, or (where appropriate) a shorter period, to the net carrying amount on initial recognition. Derecognition of financial liabilities The company derecognises financial liabilities when, and only when, the company s obligations are discharged, cancelled or they expire. The difference between the carrying amount of the financial liability derecognised and the consideration paid and payable is recognised in profit or loss. Accounting for leases Leases are classified as finance leases whenever the terms of the lease transfer substantially all the risks and rewards of ownership to the lessee. All other leases are classified as operating leases. The company as lessor Rental income from operating leases is recognised on a straight-line basis over the term of the relevant lease. Initial direct costs incurred in negotiating and arranging an operating lease are added to the carrying amount of the leased asset and recognised 142
145 NOTES TO THE FINANCIAL STATEMENTS (Continued) 2. ACCOUNTING POLICIES (Continued) Financial liabilities and equity instruments on a straight-line basis over the lease term. The company as lessee Operating lease payments are recognised as an expense on a straight-line basis over the lease term, except where another systematic basis is more representative of the time pattern in which economic benefits from the leased asset are consumed. Contingent rentals arising under operating leases are recognised as an expense in the period in which they are incurred. In the event that lease incentives are received to enter into operating leases, such incentives are recognised as a liability. The aggregate benefit of incentives is recognised as a reduction of rental expense on a straight-line basis, except where another systematic basis is more representative of the time pattern in which economic benefits from the leased asset are consumed. Dividends on ordinary shares Dividends on ordinary shares are recognised as a liability and deducted from retained earnings when approved by the company s shareholders. Interim dividends are deducted from retained earnings when they are declared and no longer at the discretion of the company. Grants Government grants are not recognised until there is reasonable assurance that the company will comply with the conditions attaching to them and that the grants will be received. Government grants are recognised in profit or loss on a systematic basis over the periods in which the company recognises as expenses the related costs for which the grants are intended to compensate. Specifically, government grants whose primary condition is that the company should purchase, construct or otherwise acquire non-current assets are recognised as deferred revenue in the statement of financial position and transferred to profit or loss on a systematic and rational basis over the useful lives of the related assets. Government grants that are receivable as compensation for expenses or losses already incurred or for the purpose of giving immediate financial support to the company with no future related costs are recognised in profit or loss in the period in which they become receivable. Provisions Provisions are recognised when the company has a present obligation (legal or constructive) as a result of a past event, it is probable that an outflow of resources embodying economic benefits will be required to settle the obligation and a reliable estimate can be made of the amount of the obligation. 143
146 NOTES TO THE FINANCIAL STATEMENTS (Continued) 2. ACCOUNTING POLICIES (Continued) Capitalisation of employee costs The employee costs directly and indirectly attributable to projects associated with development of power generating resources are capitalised. Capitalisation rates are based on estimated time and effort spent on the related project activities Cash and cash equivalents In the statement of cash flows, cash and cash an equivalent includes cash in hand, deposits held at call with banks and other short term highly liquid investments with original maturities of three months or less, net of bank overdrafts. 3. CRITICAL ACCOUNTING ESTIMATES AND JUDGEMENTS In the application of the company s accounting policies, which are described in note 2, the directors are required to make judgements, estimates and assumptions about the carrying amounts of assets and liabilities that are not readily apparent from other sources. The estimates and associated assumptions are based on historical experience and other factors that are considered to be relevant. Actual results may differ from these estimates. The estimates and underlying assumptions are reviewed on an ongoing basis. Revisions to accounting estimates are recognised in the period in which the estimate is revised if the revision affects only that period, or in the period of the revision and future periods if the revision affects both current and future periods. a) Critical judgements in applying the company s accounting policies The following are the critical judgements, apart from those involving estimations (see 3 (b) below), that the directors have made in the process of applying the company s accounting policies and that have the most significant effect on the amounts recognised in the financial statements. Held-to-maturity financial assets The directors have reviewed the company s held-to-maturity financial assets in the light of its capital maintenance and liquidity requirements and have confirmed the company s positive intention and ability to hold those assets to maturity. The carrying amount of the held-to-maturity financial assets is Sh 2,420 million (30 June 2015: Sh 2,426 million). Details of these assets are set out in Note 19. Deferred tax assets Deferred tax assets are recognised for all unused tax losses to the extent that it is probable that taxable profit will be available against which the losses can be utilised. Significant management judgment is required to determine the amount of deferred tax assets that can be recognised, based upon the likely timing and level of future taxable profits together with future tax planning strategies. Disclosure on recoverability is set out in Note
147 NOTES TO THE FINANCIAL STATEMENTS (Continued) 3. CRITICAL ACCOUNTING ESTIMATES AND JUDGEMENTS (CONTINUED) a) Critical judgements in applying the company s accounting policies (Continued) Capitalization of staff and other costs Project related costs including employee costs are capitalised. The rates applied in capitalising the employee costs are based on estimated time spent on the capital projects. Significant judgement is required in determining capitalisation rates to be applied on indirect staff costs. Disclosure of capitalised costs is set out on note 8. Revaluation of power plants Power plants are stated at fair value. Revaluations are performed by professional valuers at sufficient regularity such that the carrying amounts do not differ materially from those that would be determined using fair values at the reporting date. At the reporting date, the directors assess the carrying amount of revalued property, plant and equipment and apply judgement to determine that these do not differ materially from that which would be determined using fair values at 30 June Classification of leases of land as finance or operating leases At the inception of each lease of land or building, the Company considers the substance rather than the form of the lease contract. Examples of situations that individually or in combination would normally lead to a lease being classified as a finance lease are: The lease transfers ownership of the asset to the lessee by the end of the lease term; The lessee has the option to purchase the asset at a price that is expected to be sufficiently lower than the fair value at the date the option becomes exercisable for it to be reasonably certain, at the inception of the lease, that the option will be exercised; The lease term is for the major part of the economic life of the asset even if title is not transferred; At the inception of the lease the present value of the minimum lease payments amounts to at least substantially all of the fair value of the leased asset; and The leased assets are of such a specialised nature that only the lessee can use them without major modifications. The Company also considers indicators of situations that individually or in combination could also lead to a lease being classified as a finance lease. Examples of such indicators include: If the lessee can cancel the lease, the lessor s losses associated with the cancellation are borne by the lessee; gains or losses from the fluctuation in the fair value of the residual accrue to the lessee (for example, in the form of a rent rebate equalling most of the sales proceeds at the end of the lease); and the lessee has the ability to continue the lease for a secondary period at a rent that is substantially lower than market rent. 145
148 NOTES TO THE FINANCIAL STATEMENTS (Continued) 3. CRITICAL ACCOUNTING ESTIMATES AND JUDGEMENTS (CONTINUED) b) Key sources of estimation uncertainty Useful lives of property, plant and equipment The company reviews the estimated useful lives of property, plant and equipment at the reporting date. The useful lives of the plants are then used in establishing the contracts that the company enters into under the Power Purchase Agreements. Impairment losses At the reporting date, the company reviews the carrying amounts of its property, plant & machinery, tangible and intangible assets to determine whether there is any indication that those assets have suffered an impairment loss. If any such indication exists, the recoverable amount of the asset is estimated in order to determine the extent of the impairment loss. Where it is not possible to estimate the recoverable amount of an individual asset, the company estimates the recoverable amount of the cash generating unit to which the asset belongs. Any impairment losses are recognised as an expense immediately. Where an impairment loss subsequently reverses, the carrying amount of the asset is increased to the revised estimate of its recoverable amount. A reversal of an impairment loss, other than that arising from goodwill, is recognised as income immediately. Impairment of available-for-sale financial assets The company classifies certain assets as available-for-sale and recognises movements in their fair value through other comprehensive income. The company treats available-for-sale investments as impaired when there has been a significant or prolonged decline in the fair value below its cost or where other objective evidence of impairment exists. The determination of what is significant or prolonged requires judgement. When the fair value declines, management makes assumptions about the decline in value to determine whether it is an impairment that should be recognised in the profit and loss account. Actuarial valuation of defined benefits plan The asset or liability due under the defined benefit pension plan is determined using actuarial valuation. The actuarial valuation involves making assumptions about discount rates, expected rates of return on assets, future salary increases, mortality rates and future pension increases. Due to the long term nature of these plans, such estimates are subject to significant uncertainty. 146
149 NOTES TO THE FINANCIAL STATEMENTS (Continued) Shs 000 Shs REVENUE Revenue by Tariff Electricity sales:- - Capacity charges revenue(note 4(a)) 21,262,250 19,101,902 - Energy revenue(note (4b)) 7,671,318 6,205,882 - Foreign currency adjustment 609, ,254 a) Capacity Revenue 29,543,488 25,602,038 Hydro 7,674,181 7,676,460 Geothermal 10,303,438 8,260,272 Thermal 3,284,631 3,165,170 b) Energy Revenue 21,262,250 19,101,902 Hydro 1,513,752 1,367,981 Geothermal 5,182,762 3,929,799 Thermal 514, ,908 Wind 460, ,194 7,671,318 6,205,
150 NOTES TO THE FINANCIAL STATEMENTS (Continued) 5. STEAM REVENUE The Company entered into a long term steam resources and maintenance contract with Geothermal Development Company Limited (GDC) thereby enabling the recovery of steam field maintenance and operating costs based on agreed method of determination. The Company also generates steam revenue from own wells Steam revenue pass through* Shs 000 Shs 000 Third party steam revenue current year (a) pass through 4,614,059 3,689,361 Third party steam cost recovery arrears ( )** 1,332,986 - KenGen Steam (b) 908,973-6,856,018 3,689,361 (a) Current year third party steam net income - pass through Steam revenue - pass through 4,614,059 3,689,361 Steam costs pass through (3,167,173) (3,689,361) Net steam field maintenance revenue 1,446,886 - (b) KenGen Steam Steam revenue for current year 628,621 - Steam revenue arrears ( )** 280, ,973 - * Steam field maintenance revenue represents tariff charged by the Company to cover investment, operation and maintenance of geothermal wells connected to the power plants. The tariff is charged as part of electrical energy sold to Kenya Power pursuant to provisions of signed Power Purchase Agreements (PPAs) relating to Olkaria Power Plants and Wellheads. On 3 September 2015, the Company entered into a contract with Geothermal Development Company (GDC) for operation and maintenance of geothermal wells owned by GDC. The Company recovers geothermal steam field maintenance costs. The steam charge accrued to GDC was Shs 3,167 million (2015: Shs 3,689) which has been recognised under expenses in profit or loss ** The agreement between KenGen and GDC was signed on 3 September 2015 but it is effective June 2012 and therefore the deferred income to June 2015 has been recognised in the profit or loss in the current year. Steam field costs attributed to the steam revenue are included as part of the depreciation and employee expenses for the year. 148
151 NOTES TO THE FINANCIAL STATEMENTS (Continued) Shs 000 Shs OTHER INCOME Contracts/Consultancy Services 1 1,501,991 - Gain on disposal of property, plant and equipment 7,217 13,645 Insurance Compensation 2 331, ,439 Miscellaneous income 76,929 84,911 Net fuel pass-through (Note 6 (a)) (78,837) 109,167 Management fees from Emergency Power Project 3 (Note 33) 27,587 24,859 Other gains and losses (6c ) 343,363 41,317 Carbon Credits - 91,564 2,210, ,902 1 During the year, the Company entered into a contract to drill two commercial wells for Akiira Company Limited in Olkaria and earned income of Shs 1,501 million. 2 The Company received insurance compensation for Garissa Power Station and Wellhead cooling towers after a fire incident that occurred in The management fees represent the income earned of United States cents 0.75 per Kwh for managing Emergency Power Project in Muhoroni and Garissa on behalf of the Government which are operated by Aggreko International. This year no income was earned under the Carbon emmissions agreement Shs 000 Shs 000 (a) Net fuel pass-through 4 Fuel pass-through revenue 3,182,623 7,238,204 Fuel pass-through costs (3,261,460) (7,129,037) (78,837) 109,167 (b) Net water charges pass-through 5 Water charges pass-through revenue 329, ,341 Water charges pass-through costs (329,079) (375,341)
152 NOTES TO THE FINANCIAL STATEMENTS (Continued) Shs 000 Shs OTHER INCOME (CONTINUED) (c) Other gains and losses Foreign exchange gains on other monetary 349,243 46,676 Cumulative loss reclassified from equity on disposal of available-for-sale investments (Note 19 (c)) - (51,314) Gain on disposal of available-for-sale investments (Note 19 (c)) - 3,837 Capitalised losses on disposal of available-for-sale investments - 47,477 Amortisation of held to maturity investments (Note 19(b)) (5,880) (5,359) Unrealized foreign exchange gains on revaluation of borrowings (Note 18(a)) (8,337,737) (668,722) Recoverable foreign exchange differences (Note 18 (a)) 8,337, , ,363 41,317 4 In line with the provisions of the Power Purchase Agreements, the company is reimbursed by Kenya Power for fuel costs incurred in the production of thermal electricity based on pre-agreed plant fuel usage. The net fuel pass-through income therefore represents the fuel usage efficiency which varies with working condition of the thermal power generating plants, because the machines are presently new. As the plants get old, the net fuel pass through is expected to be a charge to the income statement. During the year the load factor declined by 10% leading to lower efficiencies. In addition, there were some fuel pricing alterations which occurred in the prior year that were confirmed in the current year. 5 The Water Resource Management Rules 2007 (Water Regulations) was Gazetted by the Government through legal notice No. 171 of September The regulation provided for water use charge at the rate of 0.05 Shs/kWh for power plants with capacity of over 1MW. With approval from the Energy Regulatory Commission, the company is reimbursed by Kenya Power for the cost of water charges as a pass-through Shs 000 Shs INTEREST INCOME Treasury bonds 282, ,290 Other receivables 7,599 5,462 Banks and other financial institutions 189,451 39,865 Kenya Power 76,263 30, , ,
153 NOTES TO THE FINANCIAL STATEMENTS (Continued) 8. EXPENSES Shs 000 Shs 000 (a) Employee Expenses The following items are included in the employee benefit expense Salaries, wages and other staff costs 6,153,744 5,570,265 Retirement benefit cost: - Post employment benefit (Note 28(a)) (170,216) (130,680) - Defined contribution scheme 440, ,567 - National social security fund 5,835 5,804 6,429,398 5,832,956 Less: Capitalised costs* (2,040,108) (1,670,672) 4,389,290 4,162,284 * The employee expenses incurred and attributable to implementation of capital projects are capitalised in line with the Company accounting policy disclosed under Note Numbers Numbers The number of persons employed by the Company at the year end was: - Operational staff 1,638 1,638 - Geothermal Resource Assessment and Other projects staff ,406 2, Shs 000 Shs 000 (b) Operating Expenses Plant operation and maintenance 1,624,005 1,386,081 Welfare and benefits 469, ,238 Training expenses 187,006 91,478 Insurance 669, ,107 Catchment preservation and dam maintenance 107, ,000 Transport and travelling costs 425, ,560 Consultants fees 44,048 47,466 Office expenses 321, ,110 Provision for bad debts 245,707 57,921 Impairment provision for capital projects - 482,281 Legal and statutory expenses 117,078 59,601 Corporate Social Responsibility 205, ,399 Director s Expenses 58,727 49,540 Advertising 42,080 75,602 Other costs 42,835 73,738 4,558,578 4,285,
154 NOTES TO THE FINANCIAL STATEMENTS (Continued) 8. EXPENSES (CONTINUED) Shs 000 Shs 000 (c) Depreciation and amortization Depreciation (Note 13) 10,706,396 6,846,125 Less: amount capitalised* (598,368) (454,948) 10,108,028 6,391,177 Amortization - Prepaid leases on leasehold land* (Note 14) 41,639 14,463 Less: amount capitalized* (3,537) (63) 38,102 14,400 - Intangible assets- software (Note 15) 77,240 73,368 Total depreciation and amortisation charge for the year 10,223,370 6,478,945 * The depreciation relating to drilling rigs and other equipment are capitalised as part of the cost of the wells in accordance with the Company accounting policy disclosed under (Note 2) 9. FINANCE COSTS Shs 000 Shs 000 Interest on borrowings 5,159,212 4,856,825 Less: capitalised interest (2,027,025) (1,846,166) 3,132,187 3,010, PROFIT BEFORE TAX Profit before tax is arrived at after charging: Depreciation on property, plant and equipment (Note 8(c)) 10,108,028 6,391,177 Compensating tax 2,431,022 - Amortisation of intangible assets (Note 8(c)) 77,240 73,368 Amortisation of prepaid lease (Note 8(c)) 38,102 14,400 Directors emoluments: fees - executive fees non-executive (Note 17(e)) 6,000 6,000 - other emoluments executive 22,969 21,242 - other emoluments non-executive (Note17(e)) 14,516 14,804 Auditor s remuneration 7,200 5,937 Operating lease rentals 248, ,182 Interest on borrowings (Note 9) 3,132,187 3,010,659 And after crediting: Interest income (Note 7) (556,108) (359,082) 152
155 NOTES TO THE FINANCIAL STATEMENTS (Continued) 11. CURRENT INCOME TAX EXPENSE Shs 000 Shs 000 (a) Taxation charge/(credit) Interest taxed as a separate source of income 100,096 77,950 Deferred tax charge/(credit) (Note 29) 4,420,456 (2,905,265) (b) Reconciliation of expected tax based on profit before taxation to taxation charge/(credit) 4,520,552 (2,827,315) Profit before taxation 11,264,044 8,690,012 Tax applicable rate of 30% 3,379,212 2,607,004 Tax effect of income not subject to tax (2,082) (4,293) Tax effect of capital allowances exceeding 100% of cost - (6,995,910) Tax effect of expenses not deductible for tax purposes 1,143,422 1,565,884 Total taxation charge /(credit) 4,520,552 (2,827,315) (c) Corporate tax movement Balance brought forward 140, ,875 Interest taxed as a separate source of income (Note 11(a)) 100,096 77,950 Paid during the year (182,276) (351,982) At end of year 58, ,
156 NOTES TO THE FINANCIAL STATEMENTS (Continued) 12. EARNINGS PER SHARE Basic earnings per share is calculated by dividing the net profit attributable to ordinary shareholders by the weighted average number of ordinary shares outstanding during the year prior to the rights issue. Diluted earnings per share for the year is calculated by dividing the net profit attributable to ordinary shareholders by the number of ordinary shares outstanding at end of the year subsequent to the rights issue. The 30 June 2015 diluted earnings per share is based on conversion of all the dilutive potential ordinary shares into ordinary shares which was to issue two additional shares for every one held. The following reflects the earnings and the share data used in the basic and diluted earnings per share computations: Shs 000 Shs 000 Profit attributable to ordinary shareholders for basic earnings (in Shs 000) 6,743,492 11,517,327 Number of ordinary shares in issue during the year used in the calculation of the basic earnings per share 2,198,361,456 2,198,361,456 Number of ordinary shares in issue at end of year used in the calculation of diluted earnings per share 6,243,873,779 6,595,084,368 Basic earnings per share (Shs) Diluted earnings per share (Shs) Intergrated Annual Report & Financial Statements for the Year Ended June 2016
157 NOTES TO THE FINANCIAL STATEMENTS (Continued) 13. PROPERTY, PLANT AND EQUIPMENT COST OR VALUATION Furniture, Freehold land Transmission Plant and Motor equipment Work- inand buildings lines machinery vehicles and fittings progress Total Shs 000 Shs 000 Shs 000 Shs 000 Shs 000 Shs 000 Shs 000 At 1 July ,021, , ,575,086 1,411,642 3,722, ,369, ,839,098 Additions ,385,357 25,385,357 Capitalised interest ,846,166 1,846,166 Depreciation capitalised (Note 8) , ,948 Transfers from WIP 13,553,746 1,724,124 45,786, , ,924 (61,734,809) - Disposals (87,890) (16,919) - (104,809) Impairment for capital projects (482,281) (482,281) Revaluation adjustment (4,407,001) - 29,684, ,277,356 At 30 June ,167,814 2,463, ,046,017 1,475,193 4,224,226 67,839, ,215,835 Comprising At cost 38,574,815 2,463, ,215,158 1,475,193 3,849,904 67,839, ,417,655 At valuation 2015 (4,407,001) - 29,684, ,277,356 At valuation ,146, ,322-34,520,824 34,167,814 2,463, ,046,017 1,475,193 4,224,226 67,839, ,215,835 At 1 July ,167,814 2,463, ,046,017 1,475,193 4,224,226 67,839, ,215,835 Additions ,919,882 24,919,882 Capitalised interest ,027,025 2,027,025 Depreciation capitalised , ,368 Transfers from WIP 130,179-1,333, ,134 28,318 (1,739,600) - Reclassification of revaluation surplus 8,790,893 1,233,020 (10,814,093) - (374,322) - (1,164,502) Disposals (164,985) - - (31,403) - - (196,388) At 30 June ,923,901 3,696, ,565,893 1,690,924 3,878,222 93,645, ,400,220 Comprising At cost 38,540,009 2,463, ,487,499 1,690,924 3,878,222 93,645, ,704,913 At valuation ,383,892 1,233,021 53,078, ,695,307 42,923,901 3,696, ,565,893 1,690,924 3,878,222 93,645, ,400,220 Intergrated Annual Report & Financial Statements for the Year Ended June
158 NOTES TO THE FINANCIAL STATEMENTS (Continued) 13. PROPERTY, PLANT AND EQUIPMENT (Continued) Furniture, Freehold land Transmission Plant and Motor equipment Work- inand buildings lines machinery vehicles and fittings progress Total Shs 000 Shs 000 Shs 000 Shs 000 Shs 000 Shs 000 Shs 000 Depreciation At 1 July ,713,861 61,625 37,603, ,014 2,409,609-47,603,277 Charge for year 937, ,107 5,255, , ,652-6,846,125 Eliminated on disposal (86,030) (16,792) - (102,822) Write back on revaluation (7,650,946) - (42,858,563) (50,509,509) At 30 June , ,870 2,744,469-3,837,071 At 1 July , ,870 2,744,469-3,837,071 Charge for year 1,313, ,021 8,664, , ,035-10,706,396 Reclassification 931,636 (84,520) (733,944) 384 (157,912) - (44,356) Disposals (2,941) - - (28,930) - - (31,871) At 30 June ,242, ,233 7,930,715 1,137,313 2,908,592-14,467,240 Net book value At 30 June ,681,514 3,448, ,635, , ,630 93,645, ,932,980 At 30 June ,167,814 2,293, ,046, ,323 1,479,757 67,839, ,378,764 Net book value (Cost basis) At 30 June ,578,310 2,130,483 84,919, , ,926 93,876, ,605,974 At 30 June ,760,863 2,293, ,631, ,323 1,480,093 67,839, ,557, Intergrated Annual Report & Financial Statements for the Year Ended June 2016
159 NOTES TO THE FINANCIAL STATEMENTS (Continued) 13. PROPERTY, PLANT AND EQUIPMENT (CONTINUED) Plant and machinery was revalued by independent valuers, Aon Global Risk valuers, as at 30 June 2015, on a depreciated replacement cost basis and represents the plant and machinery s highest and best use. The land and buildings was valued by Gimco Limited as at 31 December The valuation reports were adopted by the company in the financial statements for the year ended 30 June The company land is located in the following locations: Olkaria Turkwel Mesco Gitaru Sosiani Garissa Kiambere Gogo Lamu Kamburu Wanjii Kipevu I and III Kindaruma Tana Sondu Miriu Masinga Sagana Sangoro Ndula If the freehold land, buildings and plant and machinery were stated on the historical cost basis, the amounts would be as follows: Shs 000 Shs 000 Cost 177,490, ,253,209 Accumulated depreciation (39,686,158) (38,567,198) Net book amount 137,804, ,686, LONG TERM LEASES ON LEASEHOLD LAND Cost At start of year 3,223,658 1,060,759 Additions - 772,716 Reclassification of revaluation Surplus 977,289 1,390,183 At end year 4,200,947 3,223,658 Amortisation At start of year - 12,387 Prepaid lease amortization for the year 41,639 14,463 Write back on revaluation 8,635 (26,850) At end of year 50,274 - Net book value At end of year 4,150,673 3,223,658 Intergrated Annual Report & Financial Statements for the Year Ended June
160 NOTES TO THE FINANCIAL STATEMENTS (Continued) 14. LONG TERM LEASES ON LEASEHOLD LAND (CONTINUED) This relates to leases on land that is under use by the Company countrywide mainly hosting power plants. The leases carry different lease periods and lease amounts, depending on when the land was leased. The land is leased from the Government of Kenya and other Government Agencies under renewable leases. The lease periods range from between 50 years to 99 years. Leases are renewed as they expire. Where leases have expired in the past, all have been renewed without any complications and no renewal complications are expected in the foreseeable future. The Company s leasehold land was revalued on 30 June 2015 by Gimco Limited, a firm of independent valuers, on the existing market value basis. If the long term leasehold land was stated on the historical cost basis, the amounts would be as follows: Shs 000 Shs 000 Cost Cost 1,833,475 1,833,475 Accumulated depreciation (41,313) (26,850) Net book amount 1,792,162 1,806, INTANGIBLE ASSETS Cost At start of year 1,376,189 1,246,418 Additions 10, ,771 - Reclassification of revaluation 125, Depreciation write back on revaluation (124,109) - At end of year 1,388,108 1,376,189 Amortization At start of year 253, ,369 Charge for the year 77,240 73,368 Depreciation write back on revaluation (124,110) - 206, ,737 At end of year 1,181,241 1,122,452 Intangible assets relate to costs incurred towards the installation of software and related operating systems mainly SCADA. Amortisation has been charged on these assets from the time they became available for use. The SCADA was valued on the basis of depreciated replacement costs taking into account its expected useful life. 158
161 NOTES TO THE FINANCIAL STATEMENTS (Continued) 15. INTANGIBLE ASSETS If the intangible assets were stated on the historical cost basis, the amounts would be as follows: Shs 000 Shs 000 Cost 1,386,633 1,376,189 Accumulated depreciation (330,977) (253,737) Net book amount 1,055,656 1,122, TRADE RECEIVABLES Due from Kenya Power 9,304,113 8,047,705 Due from Kenya Power deferred debt 43,298 35,100 Recoverable foreign exchange adjustment (Note 18 (a)) 698, ,872 10,045,640 8,716, RELATED PARTIES The company is 73% controlled by the Government of Kenya. The remaining 27% of the shares are widely held by the public. Parties are considered to be related if one party has the ability to control the other or exercise significant influence over the other party in making financial or operational decisions. The Company s main related parties are the Government of Kenya - Kenya Power and Lighting Company Limited (Kenya Power), Geothermal Development Company Limited (GDC), Ministry of Energy & Petroleum and National Treasury. (a) Kenya Power Kenya Power is the authorised electricity distributor in Kenya with its majority shareholder being the Government of Kenya. (i) The amounts due from Kenya Power relate to outstanding balances at year end for sale of electricity Shs 000 Shs 000 Amount due from Kenya Power 9,304,113 8,047,705 (ii) Deferred debt due from Kenya Power Deferred debt relates to the amounts recoverable from Kenya Power in respect of the debt incurred in the construction of the Sondu Miriu project implemented by the Company on behalf of Kenya Power under a management agreement. Japan Bank for International Corporation funded the foreign component of the Sondu Miriu project under the loan agreement between the Japan Bank for International Corporation and the Company. The debt is payable over a period of 30 years commencing 15 August The effective interest rate in Japanese Yen on the deferred debt during the year was 0.75% (2015: 0.75%). 159
162 NOTES TO THE FINANCIAL STATEMENTS (Continued) 17. RELATED PARTIES (CONTINUED) The deferred debt and corresponding loan from Japan Bank for International Corporation are both denominated in Japanese Yen (JPY). The amount outstanding as at year end was JPY 1,254,061,339 (2015: JPY 1,210,012,162). The deferred debt due from Kenya Power at end of year is as follows: Shs 000 Shs 000 Current portion 43,297 35,100 Non-current portion 1,147, ,266 1,190,665 1,000,366 (iii) During the year the following transactions were carried out with Kenya Power; Electricity sales to Kenya Power 28,933,568 25,307,784 Foreign exchange recovery 609, ,254 Interest income on amounts due from Kenya Power 75,521 30,465 Fuel pass-through 3,182,622 7,238,204 Water charges pass-through 329, ,341 Steam charges pass-through 5,242,679 3,689,361 38,373,389 36,935,409 Electricity purchases from Kenya Power 337, ,155 The sales to Kenya Power are made in accordance with the signed Power Purchase Agreements whereas the purchases from Kenya Power are made at normal market prices. Outstanding balances at end of year are unsecured and have credit period of 40 days. (b) Geothermal Development Company Limited (GDC) Geothermal Development Company Limited is wholly owned by the Government of Kenya and its principal activities are the development of geothermal resources in Kenya through surface exploration and drilling for steam and to avail steam power to developers for electricity generation Shs 000 Shs 000 (i) Amount due from GDC 279,637 - (ii) Amount due to GDC 487,098 1,445,055 (iii) Steam field maintenance pass through revenue (Note 5) 3,167,173 3,689,
163 NOTES TO THE FINANCIAL STATEMENTS (Continued) 17. RELATED PARTIES (CONTINUED) Shs 000 Shs 000 (c) National Treasury Amount due from National Treasury (Note 22) 21,807 5,821,272 (d) Staff advances Amounts due from staff 54, ,580 The company, through the welfare and benefits scheme, provides staff with financial support. (e) Director and key management compensation Fees for services as a Director Non-Executive Directors 6,000 6,000 Other emoluments: Salaries and other short-term employment benefits: Executive Directors and key management 105, ,858 Other allowances: Non-Executive Directors 14,516 14,804 Total other emoluments 119, ,662 Total fees and other emoluments 125, , NONCURRENT RECEIVABLES Recoverable foreign exchange adjustment relates to unrealised exchange differences on foreign denominated borrowings recoverable from Kenya Power when realised. The Power Purchase Agreement ( PPA ) with Kenya Power, allows the company to bill and recover all realised foreign currency fluctuations relative to the base rates allowed by the PPA. The amount in the statement of financial position relates to unrealised exchange differences arising on retranslation of borrowings at the reporting date which are recoverable from Kenya Power. The movement in recoverable foreign exchange adjustment is as follows: Shs 000 Shs 000 Recoverable foreign exchange adjustment 13,890,353 6,242,228 Due from Kenya Power deferred debt (Note 17) 1,147, ,266 15,037,721 7,207,
164 NOTES TO THE FINANCIAL STATEMENTS (Continued) 18. NONCURRENT RECEIVABLES (CONTINUED) Shs 000 Shs 000 Due from Kenya Power At start of the year 6,876,100 6,657,924 Unrealised exchange gains in the year (Note 25(d)) 8,337, ,722 Realised exchange gains on loan repayment (Note (25(d)) (625,256) (450,546) At end of the year 14,588,581 6,876,100 Less current portion (698,229) (633,872) Non-current portion 13,890,352 6,242, TREASURY BONDS (i) Analysis of treasury bonds Available-for-sale treasury bonds carried at fair value 322, ,803 Held-to-maturity treasury bonds carried at amortised cost 2,420,560 2,426,440 2,742,591 2,768,243 Maturity analysis of treasury bonds - Within one year 322, ,803 - After five years 2,420,560 2,426,440 2,742,591 2,768,243 Less: current portion (322,031) (341,803) Non-current 2,420,560 2,426,440 Weighted average interest rate 11.25% 11.14% (c) Movement in treasury bonds Available-for-sale Held-to-maturity Total Shs 000 Shs 000 Shs June 2016 At start of year 341,803 2,426,440 2,768,243 Fair value gain (19,772) - (19,772) Amortisation - (5,880) (5,880) At end of year 322,031 2,420,560 2,742,
165 NOTES TO THE FINANCIAL STATEMENTS (Continued) 19. TREASURY BONDS (CONTINUED) Available-for-sale Held-to-maturity Total Shs 000 Shs 000 Shs June 2015 At start of year 594,769 2,431,799 3,026,568 Disposals (255,236) - (255,236) Fair value gain 2,270-2,270 Amortisation - (5,359) (5,359) At end of year 341,803 2,426,440 2,768,243 Cost Proceeds Losses on disposal Shs 000 Shs 000 Shs 000 At end of year Available-for-sale treasury bonds 306, ,073 47,477 Comprising: Cumulative loss reclassified from equity on disposal 51,314 Gain during the year (3,837) 47, INVENTORIES Shs 000 Shs 000 Inventory 1,389,827 1,413,957 provision (523,129) (514,881) 866, ,076 Inventory items consist of the following; Fuel and lubricants 224, ,095 General stores 150, ,453 Machinery spares 490, , , ,
166 NOTES TO THE FINANCIAL STATEMENTS (Continued) 21. OTHER RECEIVABLES AND PREPAYMENTS Shs 000 Shs 000 Prepayments 645, ,961 Due from related parties* 1,321,940 1,343,351 Receivable from rights issue** 1,882,522 - Other receivables 54,423 93,526 Due from The National Treasury (Note 22) 21,807 5,821,272 3,925,727 8,119,110 *Included in amounts due from other related parties is an amount of Shs 302 million relating to the funds for Olkaria I and IV projects received by National Treasury from the World Bank on behalf of the Company and GDC receivable balance Shs 279 million. **Relates to the Rights allotted but not paid for as at 30 June This was subsequently received on 5 July 2016 as per the Rights Issue timetable. 22. DUE FROM THE NATIONAL TREASURY Shs 000 Shs 000 Geothermal resource assessment funds 5,821,272 5,315,816 Cost incurred on geothermal exploration in fields taken offer by GDC - 505,456 Spent on preparation for secondary share offer 21,807 - At start of year 5,843,079 5,821,272 Received in the year (5,401,936) - Transferred to Geothermal Development Company Limited (419,336) - At end of year 21,807 5,821,272 The Geothermal resource assessment funds relate to the costs incurred by the Company on behalf of GDC through the Ministry of Energy & Petroleum in undertaking exploration activities and development of Geothermal resources subsequently transferred to GDC. The Shs 21 million balance relates amount spent by the Company on behalf of The National Treasury in preparation of offloading of 19% of shares which did not materialise. These are expected to be settled in the current financial year. 23. CASH AND BANK BALANCES Shs 000 Shs 000 Cash and bank balances 6,756,324 3,292,
167 NOTES TO THE FINANCIAL STATEMENTS (Continued) 24. ORDINARY SHARE CAPITAL AND SHARE PREMIUM Ordinary share capital and share premium Number of shares Ordinary shares Share premium (Thousands) Shs 000 Shs 000 Authorised At 1 July 2014, 30 June 2015 and 30 June ,000,000 25,000,000 - Share capital At 1 July ,198,361 5,495,904 5,039,818 Rights issue at 30 June 2016 Proceeds from public participation 968,941 2,422,353 3,924,212 Conversion of Government debt to equity 3,076,571 7,691,428 12,460,113 At 30 June ,045,512 10,113,780 16,384,325 Less: Rights issue expenses incurred - - (367,802) Total 6,243,873 15,609,684 21,056,342 The total authorised number of ordinary shares is 10,000,000,000 with a par value of Shs 2.50 per share. All issued shares are fully paid. On 27 June 2016 a rights issue of one share for every 2 held was made, by public participation and conversion of Government debt to equity. A total of 4,045,512,323 shares were issued at Shs 6.55 per ordinary share. 165
168 NOTES TO THE FINANCIAL STATEMENTS (Continued) 25. OTHER RESERVES Investments Property Capital revaluation revaluation Acturial reserve reserve reserve gains/(losses) Total Shs 000 Shs 000 Shs 000 Shs 000 Shs 000 At 1 July ,579,722 (135,072) 16,658,062 1,186,499 26,289,211 Other comprehensive income for the year; -remeasurement of defined benefit , ,462 -deferred tax on remeasurement (64,339) (64,339) -revaluation of bonds held for sale - 53, ,584 -revaluation of property plant and equipment ,042,729-54,042,729 Total comprehensive income for the year - 53,584 54,042, ,123 54,246,436 Transfer of excess depreciation - - (854,000) (854,000) Deferred tax on revaluation surplus current year , ,108 At 30 June ,579,722 (81,488) 70,077,899 1,336,622 79,912,755 As at 1 July ,579,722 (81,488) 70,077,899 1,336,622 79,912,755 Other comprehensive income for the year -revaluation of bonds held for sale - (19,772) - - (19,772) -remeasurement of defined benefit (394,996) (394,996) -deferred tax on remeasurement , ,499 Total comprehensive income for the year - ( 19,772) - (276,497) (296,269) Transfer of excess depreciation - - (3,045,117) - (3,045,117) Deferred tax on revaluation surplus current year , ,234 At 30 June ,579,722 (101,260) 68,002,016 1,060,125 77,540,603 (a) The capital reserve relates to development surcharge received from Kenya Power for financing the development of certain power projects for the period on or before The reserve is not distributable to shareholders. (b) The investments revaluation reserve represents the cumulative gains and losses arising on the revaluation of available-forsale financial assets that have been recognised in other comprehensive income, net of amounts reclassified to profit or loss when those assets have been disposed of. The reserve is not distributable to shareholders. (c) The property, plant and equipment revaluation reserve arises on the revaluation of plant and machinery. When revalued property, plant and equipment are disposed, the portion of the plant and machinery revaluation reserve that relates to that asset is transferred directly to retained earnings. The reserve is not distributable to shareholders. (d) Actuarial reserves represents the accumulated gains or losses arising from the retirement benefit scheme recognised through other comprehensive income as disclosed under Note 28. The reserve is not distributable to shareholders. 166
169 NOTES TO THE FINANCIAL STATEMENTS (Continued) 26. BORROWINGS (a) Analysis of interest bearing borrowings Maturity Year Shs 000 Shs 000 Government of Kenya Guaranteed 2.6% Japan Bank for International Cooperation KE P20 - Kipevu 1 (JPY 3,827,844,000) ,766,641 3,392, % Japan Bank for International Cooperation KE P21 Sondu Miriu (JPY 3,720,134,000) ,660,653 3,237, % Japan Bank for International Cooperation KE P23- Sondu Miriu (JPY 9,688,840,001) ,533,925 8,005, % Japan Bank for International Cooperation KE P24 - Sangoro ( JPY 4,316,742,580) ,247,617 3,440, % Japan International Cooperation Agency KE P26 - Olkaria I & IV (approved JPY 29,516,000,000), (Disbursed JPY18,666,020,349) ,367,278 14,540, % Kreditanstalt Fur Wiederaufbau (KfW) - Kindaruma (Euro 29,598,916.03) ,323,976 3,699, % Kreditanstalt Fur Wiederaufbau (KfW) - Olkaria I & IV (Euro 42,911,198.03) ,818,953 4,864,636 On lent 7.7% International Development Association IDA 2966KE-Olkaria II ,159, % Kreditanstalt Fur Wiederaufbau - Olkaria II , % International Development Association Credit IDA 3958KE- OlkariaII Unit ,856, % KBC Bank loan (Belgium)-Ngong Wind Power , % International Development Association IDA 4743 KE- Olkaria I & IV (USD 36,787,172.69) ,719,264 11,454, % Agence Francaise de Developpement (AFD) - Olkaria I & IV(EURO 86,973,335.15) ,767,158 8,925, % European Investment Bank-Olkaria I & IV (Euro 5,810, ) ,534 7,877, % Export-Import Bank of China (EXIM) - 80wells(USD329,365,029.79) ,299,529 27,367, % Spanish loan-ngong Phase II MW (Euro 19,993,617) ,245,295 2,207, % KBC Ngong I Phase MW (Euro 926,118.84) , , % National Bank of Belgium (NBB) Ngong 1 Phase MW (Euro 6,078,000) , ,
170 NOTES TO THE FINANCIAL STATEMENTS (Continued) 26. BORROWINGS (CONTINUED) (a) Analysis of interest bearing borrowings (Continued) Maturity Year Shs 000 Shs 000 Direct borrowings 2.68% Agence Francaise de Developement (AFD)- Olkaria II Unit 3 (Euro 13,333,333.28) ,497,341 1,655, % HSBC Bank loan-rigs (USD 27,032,692.96) ,733,065 2,999, % Public Infrastructure Bond Various projects(shs) ,783,089 13,908, % Standard Chartered Bank loan-eib - Olkaria II Unit 3 (USD 32,432,409.05) ,278,988 3,838, % CBA Term loan - Wellheads 75MW (USD 100,000,000) ,110,220 9,863,940 Cooperative Bank Term Loan (Shs) ,000,000 7,000,000 Citibank NA short-term loan(kes) ,559, ,151, ,528,986 Accrued interest (note 32(c)) 1,754,325 2,089, ,906, ,618,534 Total borrowings 136,906, ,618,534 Less: Amounts due within 12 months (10,757,003) (9,427,225) Non-current borrowings 126,149, ,191, Shs 000 Shs 000 (b) Borrowings maturity analysis: Due within 1 year 10,757,003 9,427,225 Due between 1 and 2 years 20,686,163 15,251,670 Due between 2 and 5 years 31,774,812 20,373,605 Due after 5 years 73,688,033 81,414, ,906, ,466,993 (c) Analysis of loans by currency: Borrowings in US$ 55,353,193 51,710,082 Borrowings in JPY 39,576,113 32,616,334 Borrowings in EUR 22,439,291 19,142,939 Borrowings in Shs 19,537,414 22,997,638 Total 136,906, ,466,
171 NOTES TO THE FINANCIAL STATEMENTS (Continued) 26. BORROWINGS (CONTINUED) Shs 000 Shs 000 (d) The movement in borrowings is as follows: At start of year 124,377, ,049,064 Received in the year 9,422,158 26,981,206 Repaid in the year (6,360,398) (12,719,460) Realised exchange losses on repayment (note 18) (625,256) (450,546) Unrealised exchange gain/(loss) in the year (note 18) 8,337, ,722 Reclassified to borrowings awaiting to conversion to equity* - (20,151,541) 135,151, ,377,445 Add: accrued interest (note 32(c)) 1,754,325 2,089,548 At end of year 136,906, ,466,993 (e) On lent borrowings converted to equity during rights issue* 2016 Shs 000 IDA 2966 KE 1,598,569 IDA 3958 KE 1,467,652 IDA 4743 KE 7,102,013 KFW LOAN 38,031 EIB-FI No ,531,141 KBC BANK, NV Ngong Phase 1 839,588 KBC BANK, NV-Ngong Phase 2 574,545 20,151,541 Securities: The Government of Kenya guaranteed and the on-lent borrowings have no securities held as the Government of Kenya is the guarantor. The Public Infrastructure Bond is unsecured. The securities held for the Agence Francaise de Development borrowings are a fixed charge over all rights, title and interest of the company in and to (a) all the land, (b) all the real property including power plant buildings and structure at the Olkaria II geothermal power plant, a fixed charge over the plant, machinery and other infrastructure at the Olkaria II geothermal power plant and an assignment of the benefits of proceeds of insurance in connection with the project. *The borrowings converted to equity effective 30 June 2016 relate to borrowings on lent from the government. The approval to convert into equity was obtained in
172 NOTES TO THE FINANCIAL STATEMENTS (Continued) 26. BORROWINGS (CONTINUED) (f) World Bank financing credit line a) Designated Account B The Company received financial support from the World Bank Credit No dated 1st October 2010 to support implementation of the Kenya Electricity Expansion Project (KEEP) under Part A, namely Geothermal Generation. A portion of this is disbursed directly into a US Dollar denominated Designated Account B operated by the company and summary information on transactions during the year is as follows: Shs 000 Shs 000 Balance at the beginning of the year 567, ,614 Amounts received during the year 302,215 1,562,619 Net interest expense - - Transfers to project account (567,737) (1,900,496) Balance at the end of the year 302, ,737 The closing balance shown above is included in loan balances and represents the balances outstanding on the World Bank funded designated Account No held at the Equity Bank Limited. As at 30 June 2016 KShs. 12,132,264,000 - US$ 120,000,000 had been disbursed. Following the conversion of part of the On-lent loan into Equity (US$ 83,212,827) the outstanding loan balance under this credit line is KShs 3,719,264, US$ 36,787,173 as disclosed in note 26(a). The disbursement to the special account has been expended in accordance with the intended purpose as specified in the loan agreement Shs 000 Shs 000 Project Account Balance at the beginning of the year 584,282 60,562 Amounts received during the year 567,737 1,900,496 Net interest income/(expense) 54,274 20,404 Payments to Contractors (698,478) (1,397,180) Balance at the end of the year 507, ,282 The closing balances shown above are included in Cash and Cash Equivalents and represent balances outstanding on the World Bank funded project Account No held at the Commercial Bank of Africa. 170
173 NOTES TO THE FINANCIAL STATEMENTS (Continued) 26. BORROWINGS (CONTINUED) (g) Compliance with debt covenants During the year, whilst the Company had not defaulted on any payments, it had not met certain loan covenants with various Development Financial Institutions. At end of the year, the Company was in compliance with all the financial covenants other than the current ratio. The borrowings portfolio that had not met the current ratio covenants at end of year is as follows: Financier Loans Loan classification Shs 000 Kreditanstalt Fur Wiederaufbau (KFW) KFW-Kindaruma Government Guaranteed 2,884,881 Kreditanstalt Fur Wiederaufbau (KFW) KFW OLK I&IV Government Guaranteed 4,233,193 European Investment Bank (EIB) EIB Olk IV U 1&2 & Trans On-lent loan 636,221 Agence Francaise de Developpement (AFD) AFD Olk IV U 1&2 On-lent loan 9,441,586 Agence Francaise de Developpement (AFD) AFD Direct loan 1,310,174 18,506,055 The effect of noncompliance is to reclassify the related liabilities to current. However, according to Directors, the compliance with covenants have improved significantly in the current year and Financial Institutions and the National Treasury continue to support the Company. During the year, the relevant Financial Institutions were aware of the noncompliance and the business circumstances leading to this as well as specific actions being taken by management to reverse the situation including the share rights issue that was concluded on 30 June All loans that were in noncompliance with the covenant were either guaranteed by Government or on lent other than AFD which is a direct loan and had granted a formal waiver to 31 December The Directors have commenced the process of seeking formal waivers from the Financiers and National Treasury and are confident of a favourable outcome. Thus, the Company continues to classify these liabilities as noncurrent. 27. LEASES (a) As lessee The future rental payments under operating leases are as shown below: Shs 000 Shs 000 Within 1 year 114,967 59,241 After 1 year but not later than 5 years 420, , , ,328 The company has entered into commercial leases on premises. These leases have an average life of between three and five years. There are no restrictions placed upon the lessee by entering into the leases. (b) As lessor The company leased out geothermal wells OW 101 and OW 306 to Oserian Development Company Limited for a period of 15 years at a cost of Shs 15 million per well receivable in advance. At end of year the outstanding balance is nill This amount is amortised annually to the income statement on a straight-line basis. 171
174 NOTES TO THE FINANCIAL STATEMENTS (Continued) 28. RETIREMENT BENEFITS The company operated a joint defined benefit scheme with Kenya Power, which was funded by contributions from both the company and employees up to 31 December The company registered its own defined benefits scheme in 2000 and commenced making contributions to the scheme, alongside employees contributions, with effect from 1 January The scheme is administered by Alexander Forbes Financial Services (E.A) Limited while British-American Asset Managers and Co-op trust Investment Services ltd act as Investment Managers for the DB Scheme. Under the plan, the employees are entitled to retirement benefits of 3% of Final Pensionable Emoluments for Pensionable Service upto 1 January 2000 and 2% of Final Pensionable Emoluments for Pensionable Service after 1 January 2000 on attainment of a retirement age of 60 years. No other post-retirement benefits are provided to these employees. The KenGen Staff Retirement Benefits Scheme (DB Scheme) is established under trust and was closed to new entrants and to future accrual of benefits with effect from 31 December 2011 in respect of members aged below 45 years. A new Defined Contribution Scheme, the KenGen Defined Contribution (DC Scheme) 2012 was established effective 1 January 2012, for all new eligible employees. All active in service members aged 45 years and over as at 31 December 2011 had an option to either remain in the DB scheme for future benefit accrual or join the new DC scheme. Some members have opted to join the new DC scheme for future benefit accrual while others opted to remain in the DB scheme. The DC scheme is administered by Alexander Forbes Financial Services (EA) while Stanlib Ltd and Old Mutual act as Investment Managers for the Scheme. The company therefore only makes contributions to the DB scheme in respect of those members who opted to remain in the DB scheme. DB scheme member contributions are a fixed percentage of pay with the company responsible for the balance. A valuation of plan assets and the present value of the defined benefit obligation were carried out at 31 December 2014 by M/S Alexander Forbes Financial Services EA Limited for statutory purposes. An actuarial valuation to fulfill the financial reporting and disclosure requirements of IAS19 was also carried out as at 30 June On this basis, the present value of the defined benefit obligation, and the related current service cost and past service cost, were measured using the Projected Unit Credit Method. The principal assumptions used for the purposes of the actuarial valuations were as follows: Discount rate(s) 14.25% 13.25% Future salary increases 2 8% 8% Future pension increases 1 0% 0% Mortality (pre-retirement) A A Mortality (pre-retirement) n/a n/a Retirement age 60 years 60 years 1 Increases of 3% per annum apply on pensions secured on pre 31 December 1999 (Kenya Power) service. 2 Future salary increased are estimated based on the approved Trust Deed. 172
175 NOTES TO THE FINANCIAL STATEMENTS (Continued) 28. RETIREMENT BENEFITS (CONTINUED) Recognition The amount recognized in the statement of comprehensive income and statement of financial position in respect of these defined benefit plan are as shown below: (a) Amount recognised in the Statement of profit or loss and other comprehensive Income The amount recognized in the statement of profit or loss and other comprehensive income in respect of these defined benefit plan are as follows: Shs 000 Shs 000 (i) Statement of profit or loss Service Cost: Current service cost (employer) 65,669 51,513 Total service cost 65,669 51,513 Interest cost: Interest cost on defined benefit obligation 685, ,354 Interest income on plan assets (921,179) (833,547) Net Interest cost on balance sheet liability (235,885) (182,193) Total included in profit and loss in respect of Scheme (170,216) (130,680) (ii) Other Comprehensive Income (OCI) Actuarial gain obligation (287,859) (254,631) Return on plan assets (excluding amount in interest cost) 682,855 40,169 Amount recognized in OCI statement for the fiscal year 394,996 (214,462) (b) Amount recognized in the Statement of Financial Position The amount included in the statement of financial position arising from the entity s obligation in respect of its defined benefit plans is as follows: Shs 000 Shs 000 Present value of funded defined benefit obligation 5,438,642 5,302,855 Fair value of plan assets (7,047,843) (7,095,069) Present value of unfunded defined benefit (asset)/obligation (1,609,201) (1,792,214) 173
176 NOTES TO THE FINANCIAL STATEMENTS (Continued) 28. RETIREMENT BENEFITS (CONTINUED) The reconciliation of the amount included in the statement of financial position is as follows: Shs 000 Shs 000 Surplus at start of year (1,792,214) (1,407,411) Credit in the profit or loss (170,216) (130,680) Employer contributions (41,767) (39,661) Charged to other comprehensive income 394,996 (214,462) Surplus at end of year (1,609,201) (1,792,214) Movements in the present value of the defined benefit obligation in the current year were as follows: Opening benefit obligation 5,302,855 5,114,694 Current service cost (employer) 65,669 51,513 Interest cost 685, ,354 Employee contributions (incl AVC and transfers in) 20,869 19,831 Actuarial (gain) / loss due to change in assumptions (287,859) (254,631) Benefits paid (includes admin expenses) (348,186) (279,906) Closing defined benefit obligation 5,438,642 5,302,855 Movements in the present value of the plan assets in the current year were as follows. Opening market value of assets (7,095,069) (6,522,105) Interest income on plan assets (921,179) (833,547) Employer contributions (41,767) (39,661) Employee contributions (20,869) (19,831) Return on plan assets, excluding amount in interest income 682,855 40,169 Benefits paid (includes admin expenses) 348, ,906 Closing fair value of plan assets (7,047,843) (7,095,069) The fair values of the plan assets at the end of the reporting period for each category are as follows: Property Investments 4,853,029 4,478,380 Quoted equity instruments 369,241 2,089,335 Offshore investments 33,816 44,802 Government Securities 1,420,823 - Commercial Paper and Corporate Bonds 286, ,111 Fixed deposits - 33,685 Cash & Short term deposits 84, ,756 Total scheme assets 7,047,843 7,095,
177 NOTES TO THE FINANCIAL STATEMENTS (Continued) 29. DEFERRED INCOME TAX Recognition Deferred income taxes are calculated on all temporary differences under the liability method using the applicable rate, currently at 30%. The makeup of the deferred tax liabilities in the year and the movement on the deferred tax account during the year are presented below: Shs 000 Shs 000 Deferred tax assets: Tax losses (21,152,645) (27,192,428) Provisions and other temporary differences (156,471) (242,060) (21,309,116) (27,434,488) Deferred tax liabilities: Unrealised exchange gain 76,555 14,339 Defined benefit 482, ,664 Revaluation surplus 29,143,721 30,069,955 Accelerated capital allowances 31,832,938 32,737,430 61,535,974 63,359,388 Net deferred tax liability 40,226,857 35,924,900 Movement on the deferred tax account is as follows: At the beginning of the year 35,924,900 15,604,657 Deferred tax charge/(credit) (Note 11(a)) 4,420,456 (2,905,165) Deferred tax through other comprehensive income (118,499) 64,339 Deferred tax passing through revaluation surplus - 23,161,069 At the end of the year 40,226,857 35,924,900 The Directors are of the opinion that the deferred tax assets arising from investment deduction are recoverable under the tax law and therefore no provisions have been made. 175
178 NOTES TO THE FINANCIAL STATEMENTS (Continued) 30. TRADE AND OTHER PAYABLES Shs 000 Shs 000 Trade payables 2,352,241 3,369,456 Due to Kenya power 2,286 4,879 Contract and Retention money 10,350,237 5,274,217 Payables and other accrued expenses 2,178,796 4,603,917 Total trade and other payables 14,883,560 13,252,469 Non-current trade and other payables* (9,940,189) (5,329,722) Current trade and other payables 4,943,371 7,922,747 * Contract and retention money relate to payments due to contractors for the ongoing construction of long-term assets. They are financed by the Development Finance Institutions (DFIs) and represents invoices that were under verification at the reporting dates. After the verification is complete, the amounts are settled by the DFI s directly to the contractors and the company assumes the liability as long term borrowing. 31. COMPENSATING TAX Shs 000 Shs 000 Compensating tax 2,431, ,984 The compensating tax for the year is in respect of dividend arrears of Shs 5,735,428,884 paid out to National Treasury on 30 June The Company has significant tax assets from accumulated tax losses arising from significant investment deductions and therefore insufficient current tax credits to cover for the dividend tax account. 32. DIVIDENDS Shs 000 Shs 000 a) Dividend payable At start of the year 4,735,174 4,119,633 Declared 1,428, ,345 Paid during the year 6,164,109) (263,804) At end of the year - 4,735,174 b) Dividend proposed Proposed for approval at annual general meeting (not recognised as a liability) - 1,428,935 Proposed dividend per share in Shs
179 NOTES TO THE FINANCIAL STATEMENTS (Continued) 33. NOTES TO THE STATEMENT OF CASH FLOWS Shs 000 Shs 000 (a) Reconciliation of operating profit to cash generated from operations Profit before taxation 11,264,044 8,690,012 Adjustments for: Depreciation (Note 8c) 10,108,028 6,391,177 Impairment provision for capital projects (Note 13) - 482,281 Armotisation of prepaid lease (Note 8c) 38,102 14,463 Amortisation of intangible assets (Note 15) 77,240 73,368 Interest income (Note 7) (556,108) (359,082) Interest expense (Note 9) 3,132,187 3,010,659 Gain on disposal of assets (Note 6) (7,217) (13,645) Unrealised foreign exchange gain on Kenya Power deferred debt (190,301) 86,925 Net loss on derecognition of treasury bonds (19,772) 47,477 Amortisation of held-to-maturity treasury bonds 5,880 5,359 Reduction in actuarial deficit arising from valuation of retirement benefit liability (170,216) (130,680) Reduction in actuarial deficit arising from payments of retirement benefit liability (41,767) (39,661) Operating profit before working capital changes 23,640,101 18,258,653 Changes in working capital: Decrease/ (Increase) in inventories 32,378 (110,743) Increase in trade receivables (1,256,408) (136,201) Increase in other receivables 6,141, ,426 Increase/(Decrease) in trade and other payables 1,631,905 (3,735,343) Increase in compensating tax payable 2,177,038 - Cash generated from operations 32,365,267 14,698,792 (b) Movement in interest receivable At start of year 25,098 30,455 Interest income 556, ,082 Interest received (540,431) (364,439) At end of year 40,775 25,098 (c) Movement in interest payable At start of year 2,089,548 1,264,447 Interest expense 3,132,187 3,010,659 Interest paid (3,467,409) (2,185,558) At end of year 1,754,325 2,089,
180 NOTES TO THE FINANCIAL STATEMENTS (Continued) 34. EMERGENCY POWER PROJECT (EPP) During the year the Company managed an Emergency Power Supply project known as Aggreko International Projects as an implementing commissioning agent on behalf of the Ministry of Energy & Petroleum. These funds are held in an escrow bank account at the Commercial Bank of Africa and are represented below as disbursements from the Ministry of Energy & Petroleum. Electricity generated from this Project is sold to the Kenya Power and Lighting Company and relating revenue is represented below as Receipts from sale of electricity. Expenditure incurred relating to the project is represented below as expenditure during the year. None of these transactions and balances are presented in these financial statements. The movement of EPP escrow account is as follows; Shs 000 Shs 000 At start of year 546,277 60,079 Receipts from sale of electricity 1,399,391 2,690,767 Interest income 5,781 9,143 Expenditure during the year (1,443,363) (2,213,712) At end of year 508, ,277 The company earned Shs million in the year ( Shs million) in relation to managing these projects. This revenue is disclosed under Note 6 of these financial statements. 35. CONTINGENT LIABILITIES I. Letters of credit Letters of credit signify commitment by the company to make payments to third parties for contracts entered into, generally relating to foreign payments. Outstanding letters of credit as at 30 June 2016 amounted to Shs million (30 June 2015 Shs: billion). II. Disputed witholding tax In 2014, Kenya Revenue Authority (KRA) performed a tax audit for the financial years Subsequently, KRA issued an assessment of KShs 975,848,686. The company objected to the assessment and KRA issued a stand over notice pending resolution of matter in dispute. The company applied for the abandonment of collection of the withholding tax from The National Treasury. The company is likely to get the waiver from The National Treasury as the process of granting the waiver is in final stages. In the opinion of the directors, no provision is required in the financial statements as the liability is not expected to crystallize. 178
181 NOTES TO THE FINANCIAL STATEMENTS (Continued) 36. CAPITAL COMMITMENTS The capital commitments relates to the ongoing capital projects and new projects which have been approved for implementation but are at various stages of procurement. They are financed by Development Financial Institutions (DFI s) and internal resources. The projects include 140MW Olkaria V,70MW Olkaria I Unit 6, Rehabilitation of Olkaria I, Meru Wind 80MW and 140MW Olkaria VI to be implemented under Public Private Partnership arrangement. Capital commitments at the year-end for which no provision has been made in these financial statements are: Shs 000 Shs 000 Authorised but not contracted for 137,644, ,550,759 Authorised and contracted for 15,937,051 15,428, ,581, ,979, OPERATING SEGMENT INFORMATION In accordance with IFRS 8, Operating segments, information reported to the company s chief operating decision maker for the purposes of resource allocation and assessment of segment performance is focussed on the principal activities and the products offered by the company. The company has one reportable segment; which is the generation of electricity. a) Reported revenue All the company revenues were generated from an external customer. b) Geographical areas All the company operations, revenues and assets are based in Kenya. c) Major customers The company operates in a regulated industry; all its revenue is derived from one single external customer Kenya Power 38. FINANCIAL RISK MANAGEMENT Introduction and overview The company s activities expose it to a variety of financial risks and those activities involve the analysis, evaluation, acceptance and management of some degree of risk or combination of risks. Taking risk is core to the company s business and the operational risks are an inevitable consequence of being in business. The company s aim is therefore to achieve an appropriate balance between risk and return and minimise potential adverse effects on its financial performance. The key types of risks include: Market risk includes currency, interest rate and other price risk Credit risk Liquidity risk 179
182 NOTES TO THE FINANCIAL STATEMENTS (Continued) 38. FINANCIAL RISK MANAGEMENT (CONTINUED) The company s overall risk management programme focuses on the unpredictability of changes in the business environment and seeks to minimise potential adverse effects of such risks on its financial performance within the options available by setting acceptable levels of risks. Risk Management Framework The Board of Directors has overall responsibility for the establishment and oversight of the company s risk management framework. The company s Finance Division identifies, evaluates and hedges financial risks in close cooperation with operating units. The board provides written principals for overall risk management, as well as written policies covering specific areas such as credit risk, liquidity risk, foreign exchange risk, interest rate risk and price risk. The company does not enter into or trade in financial instruments, including derivative financial instruments, for speculative purposes. (a) Market risks The board has put in place an internal audit function to assist it in assessing the risk faced by the company on an ongoing basis, evaluate and test the design and effectiveness of its internal accounting and operational controls. Market risk is the risk arising from changes in market prices, such as interest rate, equity prices and foreign exchange rates which will affect the company s income or the value of its holding of financial instruments. The objective of market risk management is to manage and control market risk exposures within acceptable parameters, while optimising the return. Overall responsibility for managing market risk rests with the Audit and Risk Management Committee. The company s Finance Department is responsible for the development of detailed risk management policies (subject to review and approval by Audit and Risk Management Committee) and for the day to day implementation of those policies. There has been no change to the company s exposure to market risks or the manner in which it manages and measures the risk. i) Foreign currency risk The company has transactional currency exposures. Such exposure arises when borrowings are revalued at the reporting date and also through purchases of goods and services that are done in currencies other than the local currency. The company has loans from multilateral donors, which are denominated in currencies other than the functional local currency. Loan payments are made by using the prevailing exchange rate as there is no forward currency contracts to eliminate the currency exposures. Invoices denominated in foreign currencies are paid after 30 days from the date of the invoice and conversion at the time of payment is done using the prevailing exchange rate. 180
183 NOTES TO THE FINANCIAL STATEMENTS (Continued) 38. FINANCIAL RISK MANAGEMENT (CONTINUED) (a) Market risks (Continued) i) Foreign currency risk The carrying amount of the company s foreign currency denominated monetary assets and monetary liabilities at the end of the reporting date is: Ksh Others Total Shs 000 Shs 000 Shs 000 At 30 June 2016 Financial assets Amount due from Kenya Power Deferred debt - 1,190,665 1,190,665 Recoverable foreign exchange adjustment - 14,588,581 14,588,581 Cash and cash equivalents* 5,825, ,949 6,756,324 5,825,375 16,710,195 22,535,570 Liabilities Trade and other payables (4,943,371) (10,350,237) (15,293,608) Compensating tax (2,431,022) - (2,431,022) Borrowings (21,097,007) (115,809,004) (136,906,011) (28,471,400) (126,159,241) (154,630,641) Net currency liability (22,646,025) (109,449,046) (132,095,071) At 30 June 2015 Financial assets Amount due from Kenya Power Deferred debt - 1,000,366 1,000,366 Recoverable foreign exchange adjustment - 6,876,100 6,876,100 Cash and cash equivalents* 1,140,940 2,151,367 3,292,307 1,140,940 10,027,833 11,168,773 Liabilities Trade and other payables (7,425,096) (5,274,259) (12,699,355) Compensating tax (253,984) - (253,984) Borrowings (22,997,637) (103,469,356) (126,466,993) (30,676,717) (108,743,615) (139,420,332) Net foreign currency liability (29,535,777) (98,715,782) (128,251,559) Exposure to borrowings foreign currency risk is mitigated by the terms of the Power Purchase Agreement that allows the company to recover a foreign exchange movement from Kenya Power. 181
184 NOTES TO THE FINANCIAL STATEMENTS (Continued) 38. FINANCIAL RISK MANAGEMENT (CONTINUED) (a) Market risks (Continued) i) Foreign currency risk (Continued) The following are the gazetted base rate and the exchange rates that existed at the various dates for the following significant currencies: Gazetted base rate Shs Shs Shs US$ Yen Euro Foreign currency sensitivity analysis The following table demonstrates the effect on the company s profit or loss on applying the sensitivity for a reasonable possible change in the exchange rate of the three main transaction currencies, with all other variables held constant. The reverse would also occur if the Kenya Shilling appreciated with all other variables held constant. Change in Effect on Profit currency rate before tax 2016 US$ 2% 315,019 Yen 23% 2,724,587 Euro 2% 132,555 Total 3,172, US$ 13% 2,186,326 Yen (8%) (757,841) Euro (8%) (712,962) Total 715,523 ii) Interest rate risk The company exposure to interest rate risk is with regards to fluctuation in banks interest rates in the market which affects the borrowings by the company. The company s variable rate of borrowings is exposed to a risk of change in cash flows due to changes in foreign exchange rates. The company s non current borrowings are at fixed rates thus minimising the exposure to the interest rate risk. The effect of fluctuation of overdraft floating interest rate would not be significant. The interest earning financial assets that the company holds include investments in government securities and short term deposits whose rates of return are predetermined. 182
185 NOTES TO THE FINANCIAL STATEMENTS (Continued) 38. FINANCIAL RISK MANAGEMENT (CONTINUED) (a) Market risks (Continued) ii) Interest rate risk (Continued) Other price risk This is the risk that the rate of the tariff will decline in the future. It is the risk of losing energy revenues due to a fall in the tariff. The company s exposure to this kind of risk is highly regulated by the Power Purchase Agreement, which is a product of discussion by Kenya Power and the company, with Energy Regulatory Commission as a moderator. The company s main input for thermal energy generation is fuel which is a significant cost component. The company is in an arrangement to pass this cost to the customer, Kenya Power. (b) Credit risk The company has exposure to credit risk, which is the risk that a counterparty will be unable to pay amounts in full when due. Credit risk arises from cash and cash equivalents, and deposits with banks, as well as trade and other receivables and availablefor-sale financial investments. The carrying amount of financial assets recorded in the financial statements representing the company s maximum exposure to credit risk without taking account of the value of any collateral obtained is made up as follows: Past due but Neither past not impaired Impaired Due over over over nor impaired 60 days 365 days 365 days Total Shs 000 Shs 000 Shs 000 Shs 000 Shs 000 At 30 June 2016 Amount due from Kenya Power 8,554, , ,304,113 Treasury bonds available-for-sale 322, ,031 Foreign exchange adjustment receivables 14,588, ,588,581 Other receivables (excluding prepayments) 1,523, ,523,989 Amount due from Ministry of Energy ,807-21,807 Cash and cash equivalents* 6,756, ,756,324 31,745, ,524 21,807-32,516,845 At 30 June 2015 Amount due from Kenya Power 7,510, , ,673 (617,673) 8,047,705 Treasury bonds available-for-sale 341, ,803 Foreign exchange adjustment receivables 6,876, ,876,100 Other receivables (excluding prepayments) 637, ,134 Amount due from Ministry of Energy 5,821, ,821,272 Cash and cash equivalents* 3,292, ,292,307 24,478, , ,673 (617,673) 25,016,
186 NOTES TO THE FINANCIAL STATEMENTS (Continued) 38. FINANCIAL RISK MANAGEMENT (CONTINUED) (b) Credit risk (Continued) *Cash and cash equivalents exclude cash in hand. The company only sells generated electricity to Kenya Power and this minimizes the credit risk exposure on amount due from Kenya Power. Both companies have a contract that stipulates a 40 day credit period. Receivable balances from company staff are recovered on payment of salaries. Credit risk from balances with banks and financial institutions is managed by company s treasury department in accordance with the company s policies. Investments of surplus funds are made only with approved counterparties and within credit limits assigned to each counterparty. Counterparty credit limits are reviewed by the company s directors on an annual basis, and may be updated throughout the year subject to approval of the company s audit and risk management committee. The limits are set to minimise the concentration of risks and therefore mitigate financial loss through potential counterparty failure. c) Liquidity risk Liquidity risk is the risk that the company will not be able to meet its financial obligations as they fall due. The company s approach to managing liquidity is to ensure, as far as possible, that it will always have sufficient liquidity to meet its liabilities when due, under both normal and stressed conditions, without incurring unacceptable losses or risking damage to the company s reputation. Typically the company ensures that it has sufficient cash on demand to meet expected operational expenses for a period of 30 days, including the servicing of financial obligations. This excludes the potential impact of extreme circumstances that cannot reasonably be predicted, such as natural disasters and political violence. The company monitors its risk to shortage of funds using a recurring liquidity planning tool. 184
187 NOTES TO THE FINANCIAL STATEMENTS (Continued) 38. FINANCIAL RISK MANAGEMENT (CONTINUED) c) Liquidity risk (Continued) The table below analyses maturity profiles of the financial liabilities of the company based on the remaining period using 30 June 2016 as a base period to the contractual maturity date: Less than 3 3 to 12 1 to 5 months months years > 5 years Total Shs 000 Shs 000 Shs 000 Shs 000 Shs 000 At 30 June 2016 Trade and other payables 4,943,371-9,940,189-14,883,560 Compensating tax - 2,431, ,431,022 Less: non-financial liabilities (2,043,083) (2,043,083) 2,900,288 2,431,022 9,940,189-15,271,499 Amount due to Kenya Power 2, ,286 Borrowings 3,895,184 6,870,525 52,459,722 73,680, ,906,011 6,797,758 9,301,547 62,399,911 73,680, ,179,796 At 30 June 2015 Trade and other payables 7,369,633-5,329,722-12,699,355 Compensating tax - 253, ,984 Less non-financial liabilities (4,309,666) (4,309,666) 3,059, ,984 5,329,722-8,643,673 Amount due to Kenya Power 4, ,879 Borrowings 2,975,283 6,451,963 35,625,255 81,414, ,466,993 6,040,129 6,705,947 40,954,977 81,414, ,115,
188 NOTES TO THE FINANCIAL STATEMENTS (Continued) 38. FINANCIAL RISK MANAGEMENT (CONTINUED) d) Fair value hierarchy The Company uses the following hierarchy for determining and disclosing the fair value of financial instruments by valuation technique. As at 30 June 2016, the company held the following financial instruments measured at fair value. Financial assets/ liabilities Fair value as at 30 June 2016 Sh 30 June 2015 Sh Fair value hierarchy Valuation technique (s) and key inputs Significant unobservable inputs Relationship of unobservable inputs to fair value Treasury bondsavailable-for-sale 322,031 2,550,345 Level 1 Quoted bid prices in an active market N/A N/A 39. CAPITAL RISK MANAGEMENT There were no transfers between levels 1, 2 and 3 in the period (2015: none).the primary objective of the company s capital management is to ensure that it maintains a strong and healthy capital ratios in order to support its business and maximize shareholder value. The Capital Management policy as approved by the Board of Directors (the Board) is to maintain a strong capital base so as to maintain investor, creditor and market confidence and to sustain future development of the business. The Board monitors the return on capital, which the company defines as net operating income divided by total shareholders equity. The Board also monitors the level of dividends to ordinary shareholders. The company manages its capital structure and makes adjustments to it, in light of changes in economic conditions. To maintain or adjust the capital structure, the company may adjust the dividend payment to shareholders, return capital to shareholders or issue new shares as circumstances would dictate. There were no changes in the company s approach to capital management as regards the objectives, policies or processes during the year. The company monitors capital using a gearing ratio, which is net debt divided by total capital plus net debt. The company s target is to keep the self- financing ratios greater than 25%. The company includes within net debt, interest bearing loans and borrowings, trade and other payables, less cash equivalents. Capital includes 27% ordinary shares attributable to the public and 73% ordinary shares attributable to the Government of Kenya and distributable reserves. 186
189 NOTES TO THE FINANCIAL STATEMENTS (Continued) 39. CAPITAL RISK MANAGEMENT (CONTINUED) Shs 000 Shs 000 Equity 172,742, ,594,091 Borrowings (Note 26) 136,906, ,466,993 Less cash and bank balances (Note 23) (6,756,324) (3,292,307) Net debt 130,149, ,174,686 Gearing ratio 43% 47% 187

190 188

191 STATISTICS 189
192 Historical Performance COMPANY 10 YEAR FINANCIAL REVIEW Plant Performance Units Sold(GWh) 7,819 7,027 6,084 6,022 5,404 4,933 3,596 4,339 4,818 4,599 Average weighted tariff (Shs/KWh) Statement of Comprehensive Income (Shs 000) Electricity revenue 29,543,488 25,602,038 17,423,771 16,451,195 15,999,078 14,389,027 10,998,429 12,491,627 11,452,566 11,045,088 Steam revenue 6,856,018 3,689, ,693 58, ,399,506 29,291,399 17,616,464 16,509,560 15,999,078 14,389,027 10,998,429 12,491,627 11,452,566 11,045,088 Other income 2,210, , , , , , , , , ,875 Operating income 38,609,556 29,957,301 18,334,479 17,051,341 16,330,899 15,112,790 11,386,561 13,126,530 11,612,667 11,298,963 Employee expenses (4,389,290) (4,162,284) (3,491,942) (3,248,141) (2,169,802) (2,890,984) (2,677,510) (2,366,390) (2,222,280) (2,084,429) Operating expenses (4,558,578) (4,285,122) (3,592,594) (2,814,490) (3,212,983) (2,541,184) (2,051,740) (2,033,485) (2,384,985) (2,133,247) Depreciation (10,223,370) (6,478,945) (4,727,937) (4,578,728) (4,883,237) (4,581,339) (3,829,198) (3,847,124) (3,404,337) (3,446,354) Steam costs (3,167,173) (3,689,361) (192,693) (58,365) Operating Profit 16,271,145 11,341,589 6,329,313 6,351,617 6,064,877 5,099,283 2,828,113 4,879,531 3,601,065 3,634,933 Compensating tax (2,431,022) Impairment of assets (375,013) Interest income 556, , , , , , , , , ,091 Finance costs (3,132,187) (3,010,659) (2,587,519) (3,000,802) (2,972,308) (1,996,951) (741,491) (756,319) (798,073) 866,268 Profit Before Tax 11,264,044 8,690,012 4,157,948 4,026,924 4,045,190 3,651,307 2,484,953 4,556,281 3,078,765 4,719,279 Taxation (charge)/credit (4,520,552) 2,827,315 (1,331,625) 1,197,780 (1,222,590) (1,571,186) 801,534 (2,485,368) 2,818,114 (2,273,613) Profit After Tax 6,743,492 11,517,327 2,826,323 5,224,704 2,822,600 2,080,121 3,286,487 2,070,913 5,896,879 2,445,666 Other Comprehensive Income/(Loss) (296,269) 54,246,436 1,243,851 (16,722) (1,736,685) (633,498) 1,363,450 (127,106) - - Total Comprehensive Income 6,447,223 65,763,763 4,070,174 5,207,982 1,085,915 1,446,623 4,649,937 1,943,807 5,896,879 2,445,666 Number of Shares Issued 6,243,098,469 2,198,361,456 2,198,361,456 2,198,361,456 2,198,361,456 2,198,361,456 2,198,361,456 2,198,361,456 2,198,361,456 2,198,361,456 Earnings per share - Basic (Shs) Diluted (Shs) * Dividends per share(shs) Number of Employees 2,406 2,407 2,209 2,063 1,829 1,663 1,658 1,581 1,532 1, Intergrated Annual Report & Financial Statements for the Year Ended June 2016
193 Historical Performance Statement of Financial Position (Shs 000) ASSETS Non-current assets Property, plant and equipment 320,932, ,378, ,235, ,201, ,664, ,786, ,230,784 92,699,405 91,822,390 87,357,082 Prepaid leases on land 4,150,673 3,223,658 1,048, ,957 35,426 1,373 1,417 1,446 1,475 1,504 Intangible assets 1,181,241 1,122,452 1,066,049 1,079, , , , , , ,664 Non-current receivables 15,037,721 7,207,494 7,385,429 6,387,675 11,209,428 14,392,240 7,925,647 5,285, ,704 - Treasury bonds 2,420,560 2,426,440 2,431,799 2,436,683 8,050,919 9,610,661 6,864,340 1,545,680 3,509,123 3,941,294 Retirement benefit asset 1,609,201 1,792,214 1,407, ,332, ,151, ,574, ,545, ,856, ,454, ,717, ,075,479 96,338,413 91,515,544 Current assets Inventories 866, , , ,259 1,955,564 1,168,240 1,443, , ,013 1,036,841 Trade receivables 10,045,640 8,716,677 8,271,290 6,525,035 7,627,254 8,309,950 3,840,903 5,717,545 5,413,807 6,375,026 Other receivables and prepayments 3,925,727 8,119,110 8,546,893 11,219,743 11,395,172 6,168,262 5,714, , ,667 89,794 Treasury bonds 322, , ,769 2,550, , , ,201 1,631, ,297 1,200,322 Cash and cash balances 6,756,324 3,292,307 9,429,358 3,996, ,719 3,115,598 21,331,446 4,221,990 3,699,354 1,749,334 21,916,420 21,368,973 27,630,643 25,127,810 22,056,912 19,153,177 32,849,414 12,869,681 10,655,138 10,451,317 TOTAL ASSETS 367,248, ,519, ,205, ,673, ,913, ,607, ,566, ,945, ,993, ,966,861 Intergrated Annual Report & Financial Statements for the Year Ended June
194 Historical Performance Statement of Financial Position (Shs 000) (continued) EQUITY AND LIABILITIES Capital and reserves Share capital 15,609,684 5,495,904 5,495,904 5,495,904 5,495,904 5,495,904 5,495,904 5,495,904 5,495,904 5,495,904 Share premium 21,056,341 5,039,818 5,039,818 5,039,819 5,039,818 5,039,818 5,039,818 5,039,818 5,039,818 5,039,818 Other reserves 77,540,603 79,912,755 26,289,211 25,694,067 26,324,186 28,369,692 31,565,692 31,383,772 35,778,130 33,708,468 Retained earnings 58,536,054 51,145,614 39,884,740 37,728,726 33,209,643 30,513,173 28,429,454 25,060,618 22,088,729 19,393, ,742, ,594,091 76,709,673 73,958,516 70,069,551 69,418,587 70,530,868 66,980,112 68,402,581 63,638,189 Non-current liabilities Borrowings 126,149, ,191, ,324,111 73,934,313 61,850,220 64,166,527 59,636,829 25,793,197 19,466,078 16,040,695 Non-current liabilities - - 1, , ,647 1,119,400 1,428,100 1,501, ,428 15,000 Deferred income tax 40,226,857 35,924,900 15,604,657 14,222,916 15,968,498 15,032,183 12,001,274 12,802,808 11,186,948 15,038,788 Long term Contract payables 9,940,189 5,329,722 10,369,854 8,591, ,316, ,445, ,299,622 97,042,137 78,074,365 80,318,110 73,066,203 40,097,305 31,005,454 31,094,483 Current liabilities Borrowings due within one year 10,757,003 9,427,225 13,790,779 7,000,387 7,265,504 4,480,481 1,876,081 1,399,880 1,531,116 1,023,189 Trade and other payables 4,943,371 8,176,731 6,616,958 7,197,467 4,539,132 3,852,291 2,939,340 3,082,895 5,438,858 5,012,463 Compensating Tax 2,431, Tax Payable 58, , , , ,198,537 Dividends payable - 4,735,174 4,119,633 3,196,321 3,196,321 2,923,821 2,154,394 1,384, ,542-18,190,059 22,479,973 25,196,229 17,672,629 15,000,957 11,256,593 6,969,815 5,867,743 7,585,516 7,234,189 TOTAL EQUITY AND LIABILITIES 367,248, ,519, ,205, ,673, ,144, ,993, ,566, ,945, ,993, ,966,861 Capex 27,545,275 27,686,471 61,084,354 37,396,364 9,020,497 19,169,926 13,360,515 4,731,000 7,897,000 5,357, Intergrated Annual Report & Financial Statements for the Year Ended June 2016

195 Historical Performance Financial Ratios Profit Margin 38.13% 33.94% 23.86% 24.48% 25.28% Return on total assets 4.41% 3.45% 3.39% 3.21% 3.35% Current Ratio Debt Service Coverage Ratio Self Financing Ratio 61% 41% 17% 27% 35% Debt/(Debt+Equity) 43% 47% 61% 51% 50% Return on Equity 4% 8% 4% 7% 4%S Kiambere Dam Intergrated Annual Report & Financial Statements for the Year Ended June
196 Historical Performance EBITDA and EBIT Review for the last Ten Years (Shs 000) Revenue 38,609,556 29,957,301 18,334,479 17,051,341 16,330,899 15,112,790 11,386,561 13,126,530 11,612,667 11,298,963 Expenses (12,115,041) (12,136,767) (7,277,229) (6,120,996) (5,382,785) (5,432,168) (4,729,250) (4,399,875) (4,607,265) (4,217,676) EBITDA 26,494,515 17,820,534 11,057,250 10,930,345 10,948,114 9,680,622 6,657,311 8,726,655 7,005,402 7,081,287 Depreciation & Amortisation (10,223,370) (6,478,945) (4,727,937) (4,578,728) (4,883,237) (4,581,339) (3,829,198) (3,847,124) (3,404,337) (3,446,354) EBIT 16,271,145 11,341,589 6,329,313 6,351,617 6,064,877 5,099,283 2,828,113 4,879,531 3,601,065 3,634,933 Compensating tax (2,431,022) Impairment of assets (375,013) Interest income 556, , , , , , , , , ,091 Finance costs (3,132,187) (3,010,659) (2,587,519) (3,000,802) (2,972,308) (1,996,951) (741,491) (756,319) (798,073) 866,268 Profit Before Tax 11,264,044 8,690,012 4,157,948 4,026,924 4,045,190 3,651,307 2,484,953 4,556,281 3,078,765 4,719,279 Taxation (charge)/credit (4,520,552) 2,827,315 (1,331,625) 1,197,780 (1,222,590) (1,571,186) 801,534 (2,485,368) 2,818,114 (2,273,613) Profit After Tax 6,743,492 11,517,327 2,826,323 5,224,704 2,822,600 2,080,121 3,286,487 2,070,913 5,896,879 2,445, Intergrated Annual Report & Financial Statements for the Year Ended June 2016
197 Installed Capacity Installed and Effective Capacity in MW as at June Plant Installed Effective Installed Effective Installed Effective Installed Effective Installed Effective Hydro Tana Masinga Kamburu Gitaru Kindaruma Kiambere Turkwel Sondu Miriu Sang'oro Small Hydros Hydro Total Thermal Kipevu 1 Diesel Kipevu III Diesel Embakasi/Muhoroni Gas Turbine* Garissa & Lamu Thermal Total Geothermal Olkaria I Olkaria I AU Olkaria II Olkaria IV Eburru Wellhead Wellhead Wellhead Wellhead Geothermal Total Wind Ngong I Phase I&II Ngong II Wind Total KenGen TOTAL * Active/Reactive power Installed capacity corrected to reflect the actual Machine rating Intergrated Annual Report & Financial Statements for the Year Ended June
198 Units Sent Out Units Generated and Sold as at 30th June Plant Generated Sales Generated Sales Generated Sales Generated Sales Generated Sales Hydro Sagana Mesco Wanjii Tana Masinga Kamburu Gitaru , , Kindaruma Kiambere , , Turkwel Sondu Miriu Sangoro Gogo Sosiani Total Hydros 3, , , , , , , , , , DIESEL Kipevu I Diesel Kipevu III Diesel Total Diesel GEOTHERMAL Olkaria I Olkaria I AU 1, Olkaria II Olkaria IV 1, Eburru Wellhead Wellhead Wellhead 914 & Total Geothermal 3, , , , , , , , , , Intergrated Annual Report & Financial Statements for the Year Ended June 2016
199 Units Sent Out Units Generated and Sold as at 30th June (Continued) Plant Generated Sales Generated Sales Generated Sales Generated Sales Generated Sales Gas Turbine Embakasi Gas Turbine (Active)* Embakasi Gas Turbine (Re - Active) Total Gas Turbine Isolated Diesels Garissa Lamu Total Isolated Wind Turbine Ngong' I Phase I & Ngong' II Total Wind TOTAL KenGen 7, , , , , , , , , , Notes: 1) The difference between the units generated and sold out is due to system losses and auxilliary consumption 2) System losses comprise of technical and non-technical losses 3) *Kipevu Gas Turbines Relocated to Embakasi - Nairobi Intergrated Annual Report & Financial Statements for the Year Ended June
200 Weighted Factors % 2015/ / / / / /2012 Plant Effective Availability Load factor Availability Load factor Availability Load Factor Availability Load Factor Availability Load Factor Capacity Hydro Sagana Mesco Wanjii Tana Masinga Kamburu Gitaru Kindaruma Kiambere Turkwel Sondu Miriu Sangor'o Gogo Sosiani Total Effective Capacity Weighted Factors Hydros DIESEL Kipevu I Diesel Kipevu III Diesel Total Effective Capacity Weighted Factors Diesel GEOTHERMAL Olkaria I Olkaria I AU Olkaria II Olkaria IV Eburru Wellhead Wellhead Wellhead Total Effective Capacity Weighted Factors Geothermal Gas Turbines 198 Intergrated Annual Report & Financial Statements for the Year Ended June 2016
201 Weighted Factors % Plant 2015/ / / / / /2012 Effective Capacity Availability Load factor Availability Load factor Availability Load Factor Availability Load Factor Availability Load Factor Gas Turbine Total Effective Capacity Weighted Factors GT's Isolated Diesels Garissa (KenGen) Garissa (Aggreko) Lamu Total Effective Capacity Weighted Factors Isolated Wind Turbine Ngong I Phase I Ngong I Phase II Ngong II Total Effective Capacity Weighted Factors - Ngong' Notes. Availability and Load Factor is a Percentage (%) Intergrated Annual Report & Financial Statements for the Year Ended June

202 Ngong Wind Farm 200

203 SHAREHOLDERS CALENDAR 201
204 Notice of the Annual General Meeting NOTICE IS HEREBY GIVEN THAT THE SIXTY-FOURTH ANNUAL GENERAL MEETING of the Company will be held at the Safaricom Indoor Arena, Kasarani, Thika Road, Nairobi on Wednesday, 30th November 2016 at a.m. to conduct the following business: Ordinary Business 1. To table the proxies and note the presence of a quorum. 2. To read the Notice convening the meeting. 3. To consider and if approved, adopt the Company s audited financial statements for the year ended 30th June 2016, together with the Chairman s, Directors and Auditors Reports thereon. 4. To approve payment of Directors fees for the year ended 30th June Auditors: To note that the audit of the Company s books of accounts will continue to be undertaken by the Auditor- General or an audit firm appointed by him in accordance with Section 23 of the Public Audit Act To authorise the Directors to fix the remuneration of the Auditors. 7. In accordance with the provisions of Section 769 of the Companies Act 2015, the following directors, being members of the Audit & Risk Management Committee of the Board, be elected to continue to serve as members of the said Committee: (i) Mrs. Dorcas Kombo (ii) Mr. Kairu Bachia (iii) Mr. Joseph Sitati (iv) Mr. Humphrey Muhu, Alternate Director to Henry Rotich 8. To elect Directors: (i) Mr. Joshua Choge, who retires on rotation in accordance with Article 104 of the Articles of Association of the Company and being eligible offers himself for re-election as a Director of the Company. (ii) Dr. Eng. Joseph Njoroge, Principal Secretary State Department for Energy, who retires on rotation in accordance with Article 104 of the Articles of Association of the Company and being eligible offers himself for re-election as a Director of the Company. (iii) Mrs. Ziporah Ndegwa, who retires on rotation in accordance with Article 104 of the Articles of Association of the Company and being eligible offers herself for re-election as a Director of the Company. (iv) Ms. Millicent Omanga, who retires on rotation in accordance with Article 104 of the Articles of Association of the Company does not offer herself for re-election as a Director of the Company. 9. To consider any other business for which due notice has been given. By Order of the Board Rebecca Miano Company Secretary 19 October
205 Notice of the Annual General Meeting NOTES: 1. A member entitled to attend and vote at the meeting and who is unable to attend is entitled to appoint a proxy to attend and vote on his or her behalf. A proxy need not be a member of the Company. A Proxy Form may be obtained from the Company s website at registered office of the Company, KenGen Pension Plaza 2, Kolobot Road, Parklands, Nairobi or offices of the Company s shares registrar firm, Image Registrars Limited, Barclays Plaza 5th Floor, Loita Street, Nairobi. 2. To be valid, the Proxy Form, must be duly completed by a member and must either be lodged at the registered offices of the Company s shares registrar firm, Image Registrars Limited, Barclays Plaza 5th Floor, Loita Street, P.O. Box 9287, GPO, Nairobi or be posted, or scanned and ed to info@image.co.ke in PDF format; so as to reach Image Registrars not later than Monday, 28th November 2016 at a.m. 3. In the case of a member being a limited Company, the Proxy Form must be completed under its Common Seal or under the hand of an officer or attorney duly authorised in writing. 4. In accordance with Article 137 of the Articles of Association of the Company, a copy of the entire Annual Report & Accounts may be viewed on the Company s website at or a printed copy may be obtained from the Registered Office of the Company, KenGen Pension Plaza 2, Kolobot Road, Parklands, Nairobi, P.O. Box GPO, Nairobi. 203
206 Ilani ya Mkutano Mkuu wa Kila Mwaka ILANI INATOLEWA HAPA KUWA MKUTANO WA SITINI NA NNE WA MWAKA wa kampuni hii utafanyika kwenye Ukumbi wa Safaricom Indoor Arena, Kasarani, Barabara Kuu ya Thika, Nairobi, Jumatano Novemba 30, 2016 saa tano asubuhi ili kuendeleza shughuli zifuatazo: Shughuli za Kawaida 1. Kuorodhesha wawakilishi na kutambua iwapo kuna akidi. 2. Kusoma Ilani na kuanzisha mkutano. 3. Kujadili na ikiwa itaidhinishwa kufuata taarifa za Fedha za Kampuni zilizofanyiwa ukaguzi wa mahesabu mwaka uliokamilikia Juni 30, 2016, pamoja na Taarifa za Mwenyekiti, Mkurugenzi na Mkaguzi wa mahesabu ya kifedha. 4. Kuidhinisha malipo ya ada ya Mkurugenzi kwa mwaka uliokamilikia Juni 30, Wakaguzi wa mahesabu: Kutambua kuwa ukaguzi wa mahesabu wa vitabu vya Kampuni utaendelea kushughulikiwa na Mkaguzi Mkuu wa Mahesabu au kampuni ya ukaguzi wa mahesabu iliyoteuliwa naye kuambatana na Kifungu 23 cha Sheria ya Ukaguzi wa Mahesabu ya Umma ya Kuamuru Wakurugenzi kuafikia malipo ya Wakaguzi wa Mahesabu ya kifedha. 7. Kuambatana na Kifungu 769 cha Sheria ya makampuni ya 2015, wakurugenzi wafuatao ambao ni wanachama wa Bodi ya Kamati ya Ukaguzi wa Mahesabu ya kifedha na kudhibiti hatari, wateuliwa tena ili waendelee kuhudumu kama wanachama wa Kamati hii: (i) Bi. Dorcas Kombo (iii) Bw. Kairu Bachia (iii) Bw. Joseph Sitati (iv) Bw. Humphrey Muhu, Mkurugenzi Mbadala wa Henry Rotich 8. Kuteua Wakurugenzi : (i) Bw. Joshua Choge, ambaye anastaafu kwa mzunguko kuambatana na kifungu cha sheria ya 104 cha sheria za ushirika wa kampuni hii na kwa kuwa anastahili, anajitangaza ili kuchaguliwa tena kama Mkurugenzi wa Kampuni hii. (ii) Dkt Mhandisi Joseph Njoroge, Katibu Idara ya Kawi, ambaye anastaafu kwa mzunguko kuambatana na kifungu cha sheria ya 104 cha sheria za ushirika wa kampuni hii na kwa kuwa anastahili, anajitangaza ili kuchaguliwa tena kama Mkurugenzi wa Kampuni hii. (iii) Bi Ziporah Ndegwa, ambaye anastaafu kwa mzunguko kuambatana na kifungu cha sheria ya 104 cha sheria za ushirika wa kampuni hii na kwa kuwa anastahili, anajitangaza ili kuchaguliwa tena kama Mkurugenzi wa Kampuni hii. (iv) Bi Millicent Omanga, ambaye anastaafu kwa mzunguko kuambatana na kifungu cha sheria ya 104 cha sheria za ushirika wa kampuni hii na hajitokezi ili kuchaguliwa tena kama Mkurugenzi wa Kampuni hii. 9. Kushughulikia mambo mengine ambapo tarehe kamili Imeshatolewa. Kwa Amri ya Bodi Kuu Rebecca Miano Katibu wa Kampuni Oktoba 19,
207 Ilani ya Mkutano Mkuu wa Kila Mwaka FAHAMU KUWA: 1. Mwanachama aliye na haki ya kuhudhuria na kupiga kura katika mkutano huu na ambaye hataweza kuhudhuria ana haki ya kuteua mwakilishi atakayehudhuria na kupiga kura kwa niaba yake. Sio lazima mwakilishi huyu awe mwanachama wa Kampuni hii. Fomu ya uwakilishi inaweza kupatikana kwenye wavuti wa kampuni hii katika afisi rasmi ya Kampuni, KenGen Pension Plaza 2, Barabara ya Kolobot, Parklands, Nairobi au Afisi za shirika la hisa la kampuni hii, Image Registrars Limited, Barclays Plaza, Orofa ya 5, Loita Street, Nairobi. 3. Ikiwa mwanachama ni kampuni, Fomu ya uwakilishi ni sharti ijazwe na kupigwa muhuri au kujazwa na afisa au wakili aliyeidhinishwa kupitia kwa maandishi. 4. Kumabatana na Kifungu cha sheria cha 137 cha sheria za ushirika wa Kampuni hii, nakala ya Taarifa kamili ya mwaka ya fedha inaweza kukaguliwa katika wavuti wa Kampuni hii kupitia au nakala iliyochapishwa inaweza kupatikana katika Afisi ya Msajili wa Kampuni hii, KenGen Pension Plaza 2, Barabara ya Kolobot, Parklands, Nairobi, S.L.P GPO, Nairobi. 2. Ili kuwa halali, Fomu hii ya mwakilishi, ni sharti zijazwe na mwanachama na lazima ziwasilishwe katika afisi zilizosajiliwa za shirika la kampuni hii, Image Registrars Limited, Barclays Plaza, Orofa ya Tano, Loita Street, S.L.P 9287, GPO, Nairobi au kutumwa kwa posta, au kunakilishwa na kutumwa kwa barua pepe kwa image.co.ke kwa mfumo wa PDF; ili zimfikie Msajili wetu, Image Registrars kufikia tarehe au kabla ya Jumatatu Novemba 28, 2016 saa tano asubuhi. 205
208 Proxy Form PROXY FORM P.O. Box GPO NAIROBI I/WE...of.. being a member of the above Company, hereby appoint: of.. or failing him/her... of. failing whom, the Chairman of the Meeting, as my/our proxy, to vote for me/us and on my/our behalf at the Annual General Meeting of the Company to be held on Wednesday, 30th November 2016 and at any adjournment thereof. As witness my/our hand this. day of Signed Notes: 1. A member entitled to attend and vote is entitled to appoint one or more proxies to attend and vote in his stead and a proxy need not be a member of the Company. 2. In the case of a member being a limited Company this form must be completed under its Common Seal or under the hand of an officer or attorney duly authorised in writing. 3. The Proxy Form must be delivered to Image Registrars not later than Monday, 28th November 2016 at a.m. Proxy Forms should be sent by post to Image Registrars of P O Box 9287, Nairobi. Alternatively, duly signed proxies can be scanned and ed to info@image.co.ke in PDF format. 206
209 Fomu ya Uwakilishi FOMU YA UWAKILISHI S.L.P GPO NAIROBI MIMI/ SISI wa kama mwanachama wa Kampuni iliyotajwa hapa juu, namteua: wa. au akikosa wa. na iwapo hataweza kuhudhuria, mwenyekiti wa Mkutano, kama mwakilishi wangu/wetu, kupiga kula kwa niaba yangu/ yetu katika Mkutano Mkuu wa Kila Mwaka wa Kampuni utakaoandaliwa mnamo 30 Novemba 2016 au wakati wowote ule endapo utaahirishwa. Kama mashahidi sahihi yangu/yetu. siku ya 2016 Sahihi Maelezo: 1. Mwanachama aliye na haki ya kuhudhuria na kupiga kura ana haki ya kuteua mwakilishi mmoja au zaidi kuhudhuria na kupiga kura kwa niaba yake na sio lazima mwakilishi awe mwanachama wa Kampuni. 2. Iwapo ni mwanachama wa kampuni ya dhima yenye kikomo, hii fomu ni lazima ijazwe chini ya nembo yake au mbele ya afisa au wakili ambaye ataidhinishwa kwa maandishi. 3. Fomu ya Uwakilishi ni lazima iwasilishwe kwa Image Registrars kabla ya Jumatatu, 28 Novemba 2016 saa 5 asubuhi. Fomu za Uwakilishi zinapasa kutumwa kwa posta kwa Image Registrars wa SLP 9287, Nairobi. Badala yake, fomu za uwakilishi zilizojazwa na kutiwa sahihi zinaweza kutolewa nakala na kutumwa kwa baruapepe info@image.co.ke kwa umbo la PDF. 207
210 Shareholder Notifications SHAREHOLDER NOTIFICATIONS Update of Particulars For all CDS accountholders, please update your postal address, address and bank account details at the CDSC through your Stockbroker or Custodian Bank. For all Share Certificate holders, please update your postal address, address and bank account details at the offices of Image Registrars, Transnational Plaza 8th Floor, Mama Ngina Street, P.O. BOX GPO Nairobi. TAARIFA YA MWENYEHISA Kuteng eneza Upya/Kurekebisha Maelezo Kwa wote walio na akaunti za CDS, tafadhali toa maelezo mapya kuhusu anwani yako, barua pepe na akaunti ya benki katika CDSC kupitia wakala wako wa hisa au Benki Angalizi. Kwa wote walio na vyeti vya kumili hisa, tafadhali toa malezo upya kuhusu anwani yako ya posta, barua pepe na maelezo kuhusu akaunti yako ya benki katika afisi za Image Registrars, Transnational Plaza ghorofa ya nane, Mama Ngina Street, SLP GPO Nairobi. 208
211 Dematerialisation of Shares The Central Depository and Settlement Corporation (CDSC) commenced operations in 2004 with the intention of facilitating the holding of shares in electronic accounts instead of paper/physical share certificates to enable electronic trading & settlement of shares. This migration would shorten the settlement period, and enhance the safety & security of dealing with shares listed on the securities. The first step towards achieving electronic trading of shares was immobilization of share certificates which commenced in The number of Central Depository System (CDS) accounts has grown significantly and CDSC is now targeting to have all the shares owned by Kenyans to be transferred into electronic accounts by 1st November 2013 through a process called Dematerialization. We trust that the following FAQ s will explain the dematerialization process: 1) What is Dematerialization? Dematerialization is the next step after immobilization. On the dematerialization date, the underlying physical certificates will cease to be evidence of ownership under the Company listed at the Nairobi Securities Exchange (NSE). Evidence of ownership will be in the electronic holdings maintained in the Central Depository System (CDS) operated by CDSC. 2) What is a Dematerialized Security? It is a book entry security which has been prescribed by CDSC under section 24 of the Central Depositories Act, whereby the underlying physical certificate is no longer recognized as evidence of ownership under the Companies Act Cap 486 on or after the dematerialization date. 3) What is the impact of dematerialization? Currently, shares can be withdrawn from a CDS account and held in a certificated form. With effect from the dematerialization date, shares will not be withdrawn from the CDS account because the law does not permit the issuing of share certificates with respect to a dematerialized security. Share Certificates will no longer be recognized as prima facie evidence of ownership and will be replaced with and electronic record at CDSC. 4) What do I need to do as a shareholder if I have already deposited all my shares in the CDS account? You shall not be required to take any further action as a result of dematerialization. 5) What happens if I do not immobilize my share certificates by the dematerialization date? After the Dematerialization date, all shares that have not been immobilized will be reflected as a record in the CDS in the shareholder s name. 6) What if I want to access my shares which are held in CDS? If you wish to access your shares for purposes of trading, you will be required to open a CDS account and follow a verification process through KenGen s shares registrar firm, Image Registrars Limited, after which your shares will be transferred to your personal CDS account. 7) When is the dematerialization date? CDSC dematerialized securities of listed companies in three groups/tranches on 1st September 2013, 1st October 2013 and 1st November 2013 respectively. KenGen s dematerialization date was 1st November Additionally, KenGen placed a notice in the newspapers informing the public about the dematerialization date for KenGen shares. In the meantime, we urge shareholders who still hold physical certificates to immediately contact any Stockbroker for assistance to immobilize their shares. 8) How do I keep track of my shares? CDSC shall send you monthly statements if your account is active otherwise; you will receive your statement only once a year. However, if you would like to view/ download/print your statements, you can visit the CDSC website at You can also subscribe to the CDSC mobile services where you will receive an alert every time there is an activity in your accounts such as sale or purchase of shares for a minimum fee of Kshs per alert. To subscribe, send the word register to and follow the instructions. 209
212 Kubadilishwa kwa Mfumo wa Kuhifadhi Hisa KUBADILISHWA KWA MFUMO WA KUHIFADHI HISA KUTOKA KARATASI YA CHETI HADI REKODI YA KIELEKTRONIKI Shirika la Central Depository and Settlement Corporation (CDSC) lilianza kutoa huduma zake 2004 kwa lengo la kufanikisha utoaji wa akaunti za elektroniki badala ya hati kamili za umiliki wa hisa kuwezesha uuzaji wa hisa kwa njia ya kieletroniki. Mpango huu utapunguza muda wa kununua na kuuza hisa zilizoorodheshwa kwenye soko la hisa la Nairobi. Hatua ya kwanza kufanikisha uuzaji wa hisa kwa njia ya kielektroniki ilikuwa kusalimisha hati zenyewe za hisa, hatua ambayo ilianza Idadi ya akaunti za. Central Depository System (CDS) imepanda maradufu na CDSC sasa inalenga kuhakikisha hisa zote zinazomilikuwa na Wakenya zinahamishwa kwa akaunti za kielektroniki kufikia Novemba 1, 2013 kupitia utaratibu unaohusisha kusalimisha vyeti vyenyewe vya hisa. Tunaamini kuwa maswali na majibu yafuatayo yatafafanua ipasavyo utaratibu huo. 1) Kuhamisha hisa kutoka karatasi hadi mfumo wa kielektroniki ni nini? Hii ndio hatua inayofuata baada ya kusitisha kutumia hati za umiliki wa hisa. Katika siku ya kuanza kutumia mfumo wa elektroniki, hati halisi zitakoma kuwa ithibati ya umiliki wa kampuni iliyoorodheshwa chini ya Soko la Hisa la Nairobi. Ithibati ya umiliki itakuwa kupitia kwa akaunti ya kielektroniki (CDS) ambayo inasimamiwa na CDSC. 2) Thibitisho la usalimishaji wa hati za umiliki wa hisa ni lipi? Ni kujazwa kwa maelezo yaliyo kwenye hati ya umiliki ambayo yamependekezwa na CDSC chini ya sehemu 24 ya Sheria ya Central Depositories, ambapo cheti chenyewe cha karatasi hakitatambuliwa tena kama ushahidi wa umiliki chini ya Sheria ya Kampuni Sura 486 katika siku yenyewe ya mwisho au baada ya kuhamia mfumo wa kielektroniki. 3) Athari ya kuhamisha hisa kutoka karatasi hadi mfumo wa kielektroniki ni ipi? Kwa sasa, hisa zinaweza kuondolewa kutoka kwa akaunti ya CDS na kuhifadhiwa kwa njia ya cheti. Lakini kwanzia tarehe ya kuhamishwa kwa hisa kutoka karatasi hadi mfumo wa kielekroniki, hisa haziwezi kuondolewa kwenye akaunti ya CDS kwa kuwa sheria hairuhusu kutolewa kwa vyeti vya hisa kama ushahidi. Vyeti vya hisa havitatambuliwa tena kama ushahidi wa umiliki na badala yake kutakuwa na rekodi katika akaunti ya kielektroniki katika CDSC. 4) Ninahitajika kufanya nini kama mwenyehisa ikiwa tayari nimeweka hisa zangu zote kwenye akaunti ya CDS? Hautahitajika kufanya chochote zaidi kutokana na utaratibu huu mpya wa kusitisha matumizi ya vyeti kama ushahidi wa umiliki. 5) Nini itafanyika iwapo sitasalimisha hati zangu za umiliki kufikia tarehe ya kuhamishwa kwa hisa kutoka karatasi hadi mfumo wa kielekroniki? Baada ya tarehe hiyo, hisa zote ambazo hati zake za umiliki hazitakuwa zimesalimishwa zitaonekana kama rekodi katika akaunti ya CDS katika jina la mwenyehisa. 6) Na iwapo ningependa kuchukua hisa zangu zilizoko katika akaunti ya CDS? Ikiwa utahitaji kufikia hisa zako kwa lengo la kuziuza, utahitajika kufungua akaunti ya CDS na kufuata utaratibu wa uthibitishaji kupitia kwa kampuni ya hisa za KenGen, Image Registrars Limited, na baada ya hapo hisa zako zitahamishwa hadi akaunti yako ya CDS. 7) Ni lini hisa zitahamishwa kutoka karatasi hadi mfumo wa kielekroniki? CDSC ilihamisha hisa za kampuni zilizoorodheshwa kwenye soko la hisa katika makundi/awamu tatu mnamo Septemba 1, 2013, Oktoba 1, 2013 na Novemba 1, 2013 zikifuatana. Tarehe ya kuhamishwa kwa hisa za KenGen ni Novemba 1, Isitoshe, KenGen iliweka tangazo kwenye magazeti kufahamisha umma kuhusu tarehe ya kuhamishwa kwa hisa za KenGen. Lakini kwa sasa, tunahimiza wenyehisa ambao bado wana vyeti vya umiliki kuwasiliana mara moja na mawakala wa hisa kwa usaidizi kuhamisha hisa zao. 8) Nitafuatiliaje hisa zangu? CDSC itakuwa inakutumia taarifa za kila mwezi ikiwa akaunti yako ina shughuli nyingi; la sivyo utakuwa unapokea taarifa yako mara moja kwa mwaka. Hata hivyo, ikiwa ungependa kuchapisha taarifa zako, unaweza kutembelea tovuti ya CDSC katika Pia unaweza kujiandikisha kupokea huduma za CDSC mobile ambapo utakuwa unapokea ujumbe kila kunapokuwa na shughuli kwenye akaunti zako kama vile uuzaji na ununuzi wa hisa kwa ada ndogo ya Sh10.00 kwa kila ujumbe. Ili kujiandikisha, tuma neon Register kwa na kufuata maagizo. 210
213 Shareholders Calendar BANK DETAILS UNCLAIMED DIVIDENDS We encourage all shareholders who hold certificates and whose dividends are paid via cheques to provide their bank details to our Company s shares registrar firm, Image Registrars Limited, Transnational Plaza 8th Floor, Mama Ngina Street, Nairobi P.O. Box 9287, GPO, Nairobi Tel: / , , , , info@image.co.ke to enable us post the future dividends directly to their bank accounts. Also, we encourage all shareholders who hold CDSC accounts and whose dividends are paid via cheques to provide their bank details through their stockbrokers to enable us post the future dividends directly to their bank accounts. Further to the Unclaimed Financial Assets Act 2011, we are appealing to Shareholders who currently have unclaimed dividends to contact us with immediate effect to avoid their recent dividends being surrendered to the Unclaimed Assets Authority. Dividend enquiries can be made at the Shares & Securities Office, KenGen Pension Plaza 2, Kolobot Road, Parklands, Nairobi P.O. Box Nairobi, Tel: /4, /4, shares@kengen. co.ke or offices of the Company s shares registrar firm, Image Registrars Limited, Transnational Plaza 8th Floor, Mama Ngina Street, Nairobi P.O. Box 9287, GPO, Nairobi Tel: / , , , , info@image.co.ke 211
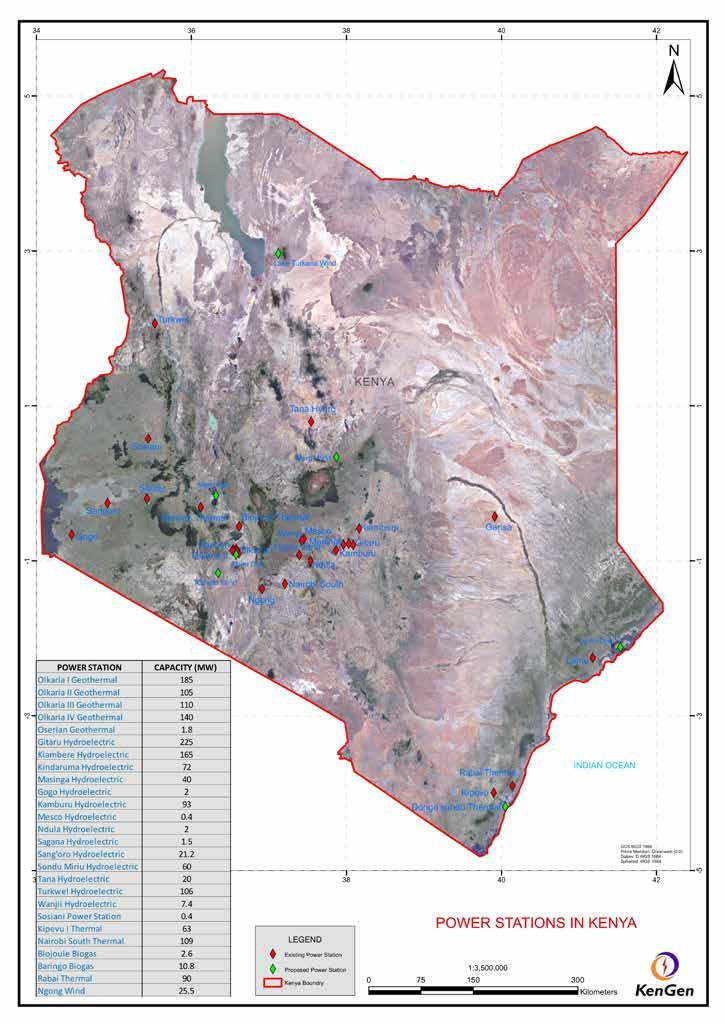
214

215 Turkwel Power Station HEAD OFFICE KenGen Pension Plaza 2 Kolobot Road, Parklands P. O. Box 47936, GPO Nairobi, Kenya Tel: Mobile: Fax: pr@kengen.co.ke ADDRESSES OF STATIONS Olkaria Geothermal Western Hydro Power Power Stations Stations P.O. Box , P.O. Box , Kisumu Naivasha Tel: Tel: / Fax: Mobile: Fax: Mobile: Eastern Hydro Power Stations P.O. Box , Embu Tel: Fax: Mobile: Thermal Power Stations P.O. Box , Mombasa Tel: / Fax: Mobile:

216 @KenGenKenya KenGenKenya KenGen s natural Geothermal Spa at Olkaria
Financial Year Ended 30 June Kenya Electricity Generating Company Limited 2013 Annual Report & Financial Statements
 61 st Annual Report & Financial Statements Financial Year Ended 30 June 2013 i 2013 Annual Report & Financial Statements Ngong Wind Farm ii 2013 Annual Report & Financial Statements Significant Facts Profile
Endless Possibilities
 Endless Possibilities 2015 Annual Report & Financial Statements Milestones Pan Africa Insurance Holdings Limited was incorporated on 26th October 1946, then known as Indo Africa Insurance Company Limited
What s inside this report
 CONTENTS 1 What s inside this report 2-7 50th Anniversary Highlights HIGHLIGHTS 8-9 Notice of Annual General Meeting Tangazo la Mkutano Mkuu wa Mwaka 10 Corporate Governance 11 Performance Highlights 12-18
ISO 9001: 2015 Certified
 ISO 9001: 2015 Certified TABLE OF CONTENTS Corporate Information 1 Members of The Board of Trustees 3 Senior Management Team 5 Chairman's Statement 6 Taarifa ya Mwenyekiti 7 Report of the Managing Trustee
Vodacom Tanzania Public Limited Company. Annual report for the year ended 31 March 2017
 Vodacom Tanzania Public Limited Company Annual report for the year ended 31 March 2017 Monetise data and digital opportunities Vodacom Tanzania Public Limited Company ( Vodacom Tanzania or the Company
Standard Chartered Bank Kenya Limited Annual Report Driving investment, trade and the creation of wealth in Kenya
 Standard Chartered Bank Kenya Limited Annual Report 2013 Driving investment, trade and the creation of wealth in Kenya Standard Chartered Bank Kenya Limited Annual Report 2013 1 Contents Business Review
Our Vision Enabling people to advance with confidence and success.
 Pg 1 DIAMOND TRUST BANK KENYA LIMITED ANNUAL REPORT & FINANCIAL STATEMENTS 2011 CORPORATE PHILOSOPHIES Our Vision Enabling people to advance with confidence and success. Our Mission To make our customers
KENYA POWER ANNUAL REPORT AND FINANCIAL STATEMENTS FINANCIAL YEAR ENDED 30 JUNE
 KENYA POWER ANNUAL REPORT AND FINANCIAL STATEMENTS FINANCIAL YEAR ENDED 30 JUNE 2012 ANNUAL REPORT AND FINANCIAL STATEMENTS 2011/12 THE KENYA POWER & LIGHTING COMPANY LIMITED 1 2 THE KENYA POWER & LIGHTING
CARBACID INVESTMENTS LIMITED REPORT AND FINANCIAL STATEMENTS 2012
 CARBACID INVESTMENTS LIMITED REPORT AND FINANCIAL STATEMENTS 2012 contents PAGES Corporate information 2 Board of directors 3 Notice of meeting 4 Chairman s statement 5-6 Taarifa ya mwenyekiti 7-8 Report
Annual Report and Financial Statements
 2013 Annual Report and Financial Statements 2 2013 Annual Report and Financial Statements Our Vision To be a dynamic company committed to exceeding customer expectation and increasing our market share
2012/2013 Annual Report and Financial Statements
 2012/2013 Annual Report and Financial Statements Cable protection cover tiles laid, awaiting completion of backfilling for the 220kV underground cable to Embakasi Substation, part of lot 3- Mombasa- Nairobi
SAFARI LODGES AND CAMPS HOTELS RESORTS
 SAFARI LODGES AND CAMPS HOTELS RESORTS ANNUAL REPORT & FINANCIAL STATEMENTS Content Page Directors and Administration 2-3 Operating Subsidiaries and Properties 4 Other Corporate Information 5 Notice of
SAFARI LODGES AND CAMPS HOTELS RESORTS ANNUAL REPORT & FINANCIAL STATEMENTS
 SAFARI LODGES AND CAMPS HOTELS RESORTS ANNUAL REPORT & FINANCIAL STATEMENTS Content Page Directors and Administration 2-3 Operating Subsidiaries and Properties 4 Other Corporate Information 5 Notice of
SAFARICOM LTD ANNUAL REPORT 2014
 SAFARICOM LTD ANNUAL REPORT 2014 A ONE // HIGHLIGHTS 04 PERFORMANCE AT A GLANCE 06 CHAIRMAN S STATEMENT 10 CEO S STATEMENT TWO // BUSINESS REVIEW 16 WHAT WE DO 18 THE VALUE WE CREATE 20 HOW WE ARE MANAGED
 8-13 Chairman s Report 14-19 Managing Director s Report 20-21 Senior Management 33-34 Statement of Directors Responsibilities 41-42 Consolidated Statement of Changes in Equity 35-36 Report of the Independent
KENYA RE FINANCIAL YEAR ENDED 31 DECEMBER 2016
 1 2 KENYA RE FINANCIAL YEAR ENDED 31 DECEMBER 2016 Page Group Information 4-15 Notice of the 2017 AGM 6-7 Chairman s Overview 12-15 Report of the Directors 16-17 Managing Director s Statement 18-25 Statement
Annual Report 2002/2003. Corporate Information 2 Maelezo juu ya Kampuni. Board of Directors 3 Halmashauri ya Wakurugenzi
 1 CONTENTS YALIYOMO Page Ukurasa Corporate Information 2 Maelezo juu ya Kampuni Board of Directors 3 Halmashauri ya Wakurugenzi Management Team 4 Timu ya Wasimamizi Notice of Meeting 5 Ilani ya Mkutano
Annual Report Bringing together world class capabilities
 Annual Report 2016 Bringing together world class capabilities 1 Table of contents 1. 10 Year Review...18 2. Cash value added statement...19 3. Chairman s statement...22 4. Taarifa ya Mwenyekiti...26 5.
VISION AND MISSION STATEMENT
 VISION AND MISSION STATEMENT OUR VISION To be the preferred Bank in the provision of comprehensive financial solutions in the region. OUR MISSION At National Bank, we are dedicated to excellence in providing
THE KENYA POWER & LIGHTING COMPANY LIMITED STAFF RETIREMENT BENEFITS SCHEME 2013 ANNUAL REPORT
 2013 ANNUAL REPORT CONTENTS PAGE Trustees and Professional Advisors 4 About the Fund 6 Fund Highlights 8 Five Year Summary 8 Chairman s Report 11 Trust Secretary s Report 17 Board of Trustees 25 Management
Bank on better. National Bank. Integrated Report & Financial Statements
 Bank on better National Bank Integrated Report & Financial Statements 2016 Bank on better Jijenge Na National Bank Borrow from as little as Kshs. 5,000/- to Kshs. 5 Million to grow your business. Free
Annual Report for the year ended December 31, 2017
 Annual Report for the year ended December 31, 2017 Contents 01. Financial highlights 4 02. TCC at a glance 8 Our vision and mission 9 Our values 10 Our history 11 03. To our stakeholders 16 Message from
CARBACID INVESTMENTS LIMITED REPORT AND FINANCIAL STATEMENTS 2014 CO2
 CARBACID INVESTMENTS LIMITED REPORT AND FINANCIAL STATEMENTS 2014 CO2 contents PAGES Corporate information 2 Board of directors 3 Notice of meeting 4 Chairman s statement 5-6 Taarifa ya mwenyekiti 7-8
CONTENTS. Directors, Officers and Administration 2. Board of Directors 4. Notice of Annual General Meeting 6. Chairman s Statement 10
 REPORT AND FINANCIAL STATEMENTS AT 31 DECEMBER 2015 CONTENTS Directors, Officers and Administration 2 Board of Directors 4 Notice of Annual General Meeting 6 Chairman s Statement 10 Group Managing Director
CARBACID INVESTMENTS LIMITED REPORT AND FINANCIAL STATEMENTS 2013 CO2
 CARBACID INVESTMENTS LIMITED REPORT AND FINANCIAL STATEMENTS 2013 CO2 contents PAGES Corporate information 2 Board of directors 3 Notice of meeting 4-6 Chairman s statement 7-8 Taarifa ya mwenyekiti 9-10
TABLE OF CONTENTS BUSINESS REVIEW CORPORATE GOVERNANCE FINANCIAL STATEMENTS OTHER INFORMATION
 TABLE OF CONTENTS BUSINESS REVIEW 2 Who we are 7 Five year Financial Review 8 Delivering on our Strategic Objectives 12 Chairman s Statement 18 Taarifa ya Mwenyekiti CORPORATE GOVERNANCE 24 The Board of
CPA SUSAN KHAKASA OYATSI
 RE-ELECTION FOR ICPAK COUNCIL MEMBER 2017-2020 CPA SUSAN KHAKASA OYATSI Master of Business Administration (MBA) University of Nairobi Bachelor of Education Kenyatta University cpa (k) ICPAK Registration
TANGA CEMENT PLC ANNUAL REPORT TAARIFA YA MWAKA.
 TANGA CEMENT PLC 2016 ANNUAL REPORT TAARIFA YA MWAKA www.simbacement.co.tz ANNUAL REPORT 2016 Contents Financial Summary 1 Directors Profiles 3 Chairperson s Statement 7 Managing Director s Report 11 Corporate
CARBACID INVESTMENTS LIMITED REPORT AND FINANCIAL STATEMENTS 2015 CO2
 CARBACID INVESTMENTS LIMITED REPORT AND FINANCIAL STATEMENTS 2015 CO2 contents PAGES Corporate information 2 Board of directors 3 Notice of meeting 4 Chairman s statement 5-6 Taarifa ya mwenyekiti 7-8
2012 Annual Report & Financial Statements
 2012 Annual Report & Financial Statements OUR CORPORATE VISION To be the reinsurer of choice in our chosen markets OUR CORPORATE MISSION To provide quality reinsurance services to our clients in Africa,
2015 Annual Report and Financial Statements. Bank on better
 2015 Annual Report and Financial Statements Bank on better Introduction Our History National Bank was incorporated on 19th June 1968. At the time it was fully owned by the Government. The objective for
ANNUAL REPORT TAARIFA YA MWAKA. Demonstrate environmental stewardship and promote sustainability in communities.
 ANNUAL REPORT TAARIFA YA MWAKA 2013 Demonstrate environmental stewardship and promote sustainability in communities. TAARIFA YA MWAKA 2013 ANNUAL REPORT 2013 Demonstrate environmental stewardship and promote
Annual Report. and. Financial Statements
 ANNUAL REPORT AND FINANCIAL STATEMENTS 2014 Annual Report and Financial Statements for the Year Ended 30th June, 2014 KENYA LITERATURE BUREAU PUBLISHERS AND PRINTERS Popo Road, Belle-Vue Area, Off Mombasa
REGULATIONS. Made under section 28 THE NATIONAL INDUSTRIES (LICENSING AND REGISTRA- TION) ACT, 1967
 ACT, 1967") THE NATIONAL INDUSTRIES (LICENSING AND REGISTRA- TION) ACT, 1967 (No. 10 OF 1967) REGULATIONS Made under section 28 THE NATIONAL INDUSTRIES REGULATIONS, 2000 Short title Interpretation Act No. 10 of 1967
THE NATIONAL INDUSTRIES (LICENSING AND REGISTRA- TION) ACT, 1967 (No. 10 OF 1967) REGULATIONS Made under section 28 THE NATIONAL INDUSTRIES REGULATIONS, 2000 Short title Interpretation Act No. 10 of 1967
ANNUAL REPORT AND FINANCIAL STATEMENTS
 ANNUAL REPORT AND FINANCIAL STATEMENTS OUR VISION To be the Media of Africa for Africa OUR To create value for our stakeholders and to positively influence society by providing media that informs, educates
The Kenya Power & Lighting Co. Ltd.
 The Kenya Power & Lighting Co. Ltd. Our Vision To achieve world class status as a quality service business enterprise so as to be the first choice supplier of electrical energy in a competitive environment.
Page 1. Kenya Commercial Bank Limited
 Page 1 Peter W. Muthoka, MBS, BA (Hons), MA, FKIB, FKIM GROUP CHAIRMAN Kenya Commercial Bank Limited Head Office Kencom House, Moi Avenue P.O. Box 53290-00200 Nairobi, Kenya Telephone: +254 20 3270210/2851210
ANNUAL CENTUM INVESTMENT COMPANY PLC ABRIDGED ANNUAL REPORT AND FINANCIAL STATEMENTS YEAR ENDED 31 MARCH 2018 REPORT
 ANNUAL CENTUM INVESTMENT COMPANY PLC ABRIDGED ANNUAL REPORT AND FINANCIAL STATEMENTS YEAR ENDED 31 MARCH 2018 REPORT 2018 TANGIBLE PROGRESS 04 NOTICE OF THE 51ST ANNUAL GENERAL MEETING 06 NOTISI JUU YA
British American Tobacco Kenya plc. Annual Report Cautionary statement
 We are a strong Company with over 10 brands sold in the Kenyan market. We employ directly and indirectly over 1,800 people and we make cigarettes chosen by a majority of Kenya s adult smokers. BAT Kenya
Tanzania Cigarette Company Ltd. Annual report for the year ended December 31, 2014
 Tanzania Cigarette Company Ltd Annual report for the year ended December 31, 2014 2 Contents 01. Financial highlights 4 02. TCC at a glance 8 Our vision and mission 9 Our values 10 Our History 11 03. To
REPORT AND FINANCIAL STATEMENTS for the year
 REPORT AND for the year Chai Tausi, Bidhaa bora kutoka TATEPA na Wakulima wa Chai Rungwe 2014 2015 Table of Contents Contents...2 Pictures...3 Chairman s Statement (swahili & english)... 4 Financial
Annual Report and Accounts. with. Tanzania
 2011 Annual Report and Accounts with Tanzania Its been 81 years since the opening of our first brewery Tanzania Breweries began as Tanganyika Breweries in 1930. The company was renamed to Tanzania Breweries
2013 ANNUAL REPORT AND FINANCIAL STATEMENTS
 ANNUAL REPORT AND FINANCIAL STATEMENTS DEVELOPMENT GROWTH INNOVATION Annual Report and Financial Statements for the year ended 31 December Vision To be the ultimate provider of innovative and reliable
CENTRAL BANK OF KENYA 50 TH ANNIVERSARY CELEBRATIONS AT THE NAIROBI NATIONAL MUSEUM
 CENTRAL BANK OF KENYA 50 TH ANNIVERSARY CELEBRATIONS AT THE NAIROBI NATIONAL MUSEUM Remarks by Mr. Henry Rotich, Cabinet Secretary, The National Treasury September 14, 2016 Your Excellency Hon. Uhuru Kenyatta,
annual report & accounts
 2 0 annual report & accounts 1 1 contents Contents Our Vision To be a dynamic company committed to exceeding customer expectation and increasing our market share through the provision of high quality products
Integrated Annual Report and Financial Statements for the year ended 31 December 2014
 1 2 3 4 Corporate Information Registered Office & Principal Place of Business LR No. 12081/9 Mombasa Road PO Box 30429 00100 Nairobi GPO. Company Secretary Edgar Jumba Imbamba P.O. Box 30429, 00100 Nairobi
2016 Annual Report & Financial Statements. Annual Report and Financial Statements
 2016 Annual Report and Financial Statements 1 Contents Notice of the Annual General Meeting... 5 Board of Directors... 7 Management Team...10 Directors, Offices and Statutory Information...12 Report of
Contents BUSINESS & PERFORMANCE HIGHLIGHTS
 BUSINESS & PERFORMANCE HIGHLIGHTS 6,000 PROFIT BEFORE TAX* 5,633 Profit (KShs Million) 4,000 2,000 2,498 2,648 2,738 4,782 2006 2007 2008 2009 2010 0 Contents SALES BY REGIONS, EXPORTS AND REP Business
PRESENTATION BY THE KCB GROUP CEO, MR. JOSHUA OIGARA, ON FINANCING A GREEN ECONOMY HELD AT UNEP HEADQUARTERS GIGIRI ON 25 TH JUNE 2014 AT 12NOON
 PRESENTATION BY THE KCB GROUP CEO, MR. JOSHUA OIGARA, ON FINANCING A GREEN ECONOMY HELD AT UNEP HEADQUARTERS GIGIRI ON 25 TH JUNE 2014 AT 12NOON United Nations Under-Secretary General; UNEP Executive Director-
Achieving more together
 2017 Annual Report Achieving more together A proud part of the family Performance in a snapshot For the year ended 31 March 2017 10 Years review 2017 2016 2015 2014 2013 2012 2011 2010 2009 2008 Sales
Table of Contents Year Review. 4 Group Cash Value Added Statement. 5 Chairman s Statement. 9 Vision, Mission & Company Values
 In celebration of the successful partnership between the Tanzanian government and SABMiller over the last 20 years, we introduce to you the legends that walked this journey and their stories. With SABMiller
front cover.pdf 1 4/3/14 5:38 PM
 front cover.pdf 1 4/3/14 5:38 PM 1 Our Vision Enabling people to advance with confidence and success. Our Mission To make our customers prosper, our staff excel and create value for our stakeholders. Our
2012 ANNUAL REPORT AND FINANCIAL STATEMENTS
 ANNUAL REPORT AND FINANCIAL STATEMENTS GROWTH INNOVATION RESEARCH Vision To be the ultimate provider of innovative and reliable tyre solutions. Mission To provide safe mobility with unparalleled experience.
COMPANY PROFILE INTRODUCTION. We exist to provide businesses the power to grow. To be the financial services provider of choice.
 COMPANY PROFILE INTRODUCTION Century Microfinance Bank Limited ( Century ) is a Microfinance institution that specializes in providing financial services to Micro, Small and Medium Businesses at large.
MONETARY POLICY MANAGEMENT
 TABLE OF CONTENTS LETTER OF TRANSMITTAL... ii PREFACE... iii UTANGULIZI... v BOARD OF DIRECTORS... viii SENIOR MANAGEMENT... ix MEMBERS OF THE MONETARY POLICY COMMITTEE... xi BANK REORGANISATION... xii
TANGA CEMENT PLC ANNUAL REPORT
 TANGA CEMENT PLC ANNUAL REPORT TAARIFA YA MWAKA 2015 ANNUAL REPORT 2015 Contents Financial Summary 1 Directors Profiles 3 Chairperson s Statement 7 Managing Director s Report 11 Corporate Social Investments
CENTRAL BANK OF KENYA
 CENTRAL BANK OF KENYA Speech by PROF. NJUGUNA NDUNG U GOVERNOR CENTRAL BANK OF KENYA at the LAUNCH OF THE KENYA@50 GOLD COMMEMORATIVE COIN Kenyatta International Conference Centre, Nairobi Monday, December
PACKAGING LINE UPGRADE
 PACKAGING LINE UPGRADE The brand new state-of-the-art bottling line at TBL was officially opened on 22 May 2009 and is rated at 48,000 bottles per hour. The bottle washer reduces water usage by 50%. Contents
TWENTY TWELVE annual report& financial statements we re transforming. National Bank of Kenya Ltd 2012 annual report.
 TWENTY TWELVE 2 0 1 2 annual report& financial statements we re transforming www.nationalbank.co.ke Vision and Mission Statement OUR VISION To be the Bank of Choice in the provision of Financial Solutions
CURRICULUM VITAE. Lenard Menya Ong onge (Mr) Attainance of high degree of responsibility Are valued.
 Attainance of high degree of responsibility Are valued.") CURRICULUM VITAE NAME: ADDRESS: E-MAIL: Lenard Menya Ong onge (Mr) P.O.Box 10055, 00100 GPO-Nairobi ongonge@yahoo.com TELEPHONE: 020 250990 0733-955725 and 0722-808804 DATE OF BIRTH: 20 th February, 1959
CURRICULUM VITAE NAME: ADDRESS: E-MAIL: Lenard Menya Ong onge (Mr) P.O.Box 10055, 00100 GPO-Nairobi ongonge@yahoo.com TELEPHONE: 020 250990 0733-955725 and 0722-808804 DATE OF BIRTH: 20 th February, 1959
KenGen RIGHTS ISSUE 2016
 www.kengen.co.ke @kengenkenya KenGen Kenya Energy for the nation. KenGen RIGHTS ISSUE 2016 INFORMATION MEMORANDUM 1 This announcement has been issued with the approval of Capital Markets Authority in Kenya.
DIRECTORS AND STATUTORY INFORMATION FOR THE YEAR ENDED 31 DECEMBER 2017
 DIRECTORS AND STATUTORY INFORMATION FOR THE YEAR ENDED 31 DECEMBER 2017 DIRECTORS Mr. Ngeny Biwott - Chairman Mr. Joshua. N. Oigara - Chief Executive Officer & Managing Director Mr. Henry K Rotich - Alternate
Highlights TZS Billion. TZS Billion. Total income. Net profit. TZS Billion. Total Assets 1,384 1, ,039 1,862 1,780
 Annual Report / Taarifa ya Mwaka 2008 Highlights 2008 160 154 50 49 140 120 100 135 101 40 30 39 35 80 60 20 TZS Billion 40 20 0 2008 2007 2006 TZS Billion 10 0 2008 2007 2006 Total income Net profit 160
IBFD 7th International Tax Lecture
 The impact of the BEPS Project on China Programme 13 October 2016 Shanghai, China IBFD is delighted to announce the 7th lecture of its International Tax Lecture Series: The impact of the BEPS Project on
9/22/2010. Growing outside South Africa Clive Tasker, Chief Executive: Standard Bank Africa. Strategy
 Standard d Bank Group Growing outside South Africa Clive Tasker, Chief Executive: Standard Bank Africa Strategy 1 What is our strategy? To build a leading emerging markets financial services organisation
Tanzania Cigarette Company Limited (TCC) Annual Report for the year ended December 31,2016
 Annual Report for the year ended December 31,2016") Tanzania Cigarette Company Limited (TCC) Annual Report for the year ended December 31,2016 2 Tanzania Cigarette Company Limited (TCC) Contents 01. Financial highlights 4 02. TCC at a glance 10 Our vision
Tanzania Cigarette Company Limited (TCC) Annual Report for the year ended December 31,2016 2 Tanzania Cigarette Company Limited (TCC) Contents 01. Financial highlights 4 02. TCC at a glance 10 Our vision
SEPTEMBER 29, 2015 COUNTY ASSEMBLY DEBATES 1 REPUBLIC OF KENYA COUNTY ASSEMBLY OF KILIFI THE HANSARD
 SEPTEMBER 29, 2015 COUNTY ASSEMBLY DEBATES 1 REPUBLIC OF KENYA COUNTY ASSEMBLY OF KILIFI THE HANSARD Tuesday, 29 th September, 2015 The House met at the Temporary Chambers at the defunct Malindi Municipal
Energy ACCOUNTABILITY STATEMENT MINISTRY OVERVIEW
 Energy ACCOUNTABILITY STATEMENT This business plan was prepared under my direction, taking into consideration the government s policy decisions as of March 3, 2017. original signed by Margaret McCuaig-Boyd,
Kawaida Mpya Kukuhudumia popote ulipo. New Normal Serving you wherever you are
 Kawaida Mpya Kukuhudumia popote ulipo New Normal Serving you wherever you are 01 01 01 Yaliyomo 04 Azma Dira Misingi Yetu 06 Angalizo Kuhusu Taarifa Zitakazotazama Mbele 26 08 Wasifu wa Kampuni 20 10 Vielelezo
CRDB BANK PLC. Taarifa ya Mwaka. Annual Report
 CRDB BANK PLC Yaliyomo Content 01 Angalizo Kuhusu Taarifa Zitakazotazama Mbele 02 Taarifa za Kampuni 03 Wasifu wa Kampuni 04 Vielelezo vya Kifedha 07 Taarifa ya Ziada 08 Taarifa ya Mwenyekiti 18 Taarifa
credit risk: loss resulting from customer or counterparty default and arises on credit exposure in all forms, including settlement risk.
 (This information is available in English only) Citicorp International Limited In accordance to CG-1 of the Supervisory Policy Manual issued by the Hong Kong Monetary Authority, we append the disclosure
THE NIGERIAN STOCK EXCHANGE - COMMUNICATION TO STAKEHOLDERS Last updated on: [September, 2016 ]
![THE NIGERIAN STOCK EXCHANGE - COMMUNICATION TO STAKEHOLDERS Last updated on: [September, 2016 ]](/thumbs/86/94935378.jpg "THE NIGERIAN STOCK EXCHANGE - COMMUNICATION TO STAKEHOLDERS Last updated on: [September, 2016 ]") THE NIGERIAN STOCK EXCHANGE - COMMUNICATION TO STAKEHOLDERS Last updated on: [September, 2016 ] BUSINESS STRATEGY 1. How does your exchange define and view the rationale for corporate sustainability and
THE NIGERIAN STOCK EXCHANGE - COMMUNICATION TO STAKEHOLDERS Last updated on: [September, 2016 ] BUSINESS STRATEGY 1. How does your exchange define and view the rationale for corporate sustainability and
ANNUAL REPORT & FINANCIAL STATEMENTS
 2015 ANNUAL REPORT & FINANCIAL STATEMENTS Achieve More i VISION Enabling people to advance with confidence and success. MISSION To make our customers prosper, our staff excel and create value for our
credit risk: loss resulting from customer or counterparty default and arises on credit exposure in all forms, including settlement risk.
 (This information is available in English only) Citibank (Hong Kong) Limited In accordance to CG-1 of the Supervisory Policy Manual issued by the Hong Kong Monetary Authority, we append the disclosure
ASSURANCE & ADVISORY RENEWABLE ENERGY ACCOUNTING & TAX COMPANY PROFILE
 ASSURANCE & ADVISORY RENEWABLE ENERGY ACCOUNTING & TAX COMPANY PROFILE WhoInvestment Holdings (Pty) Ltd NIH is a 100% black owned Consulting and Investment Company. The company consists of three business
UMOJA BRIDGE (UNITY BRIDGE) - MTWARA The Umoja Bridge is a 720 meter long structure that connects Tanzania and Mozambique across the Ruvuma river.
 - MTWARA The Umoja Bridge is a 720 meter long structure that connects Tanzania and Mozambique across the Ruvuma river.") UMOJA BRIDGE (UNITY BRIDGE) - MTWARA The Umoja Bridge is a 720 meter long structure that connects Tanzania and Mozambique across the Ruvuma river. It was inaugurated on 15 May 2010 by the presidents of
UMOJA BRIDGE (UNITY BRIDGE) - MTWARA The Umoja Bridge is a 720 meter long structure that connects Tanzania and Mozambique across the Ruvuma river. It was inaugurated on 15 May 2010 by the presidents of
INSTITUTE OF CERTIFIED PUBLIC ACCOUNTANTS OF KENYA CONTINUOUS PROFESSIONAL DEVELOPMENT CALENDAR- 2017
 INSTITUTE OF CERTIFIED PUBLIC ACCOUNTANTS OF KENYA CONTINUOUS PROFESSIONAL DEVELOPMENT CALENDAR- 17 PART A: INTERNATIONAL EVENTS 1. 25 th -27 th, Mumbai, India The 4 th Annual C- Suite 2. 22 nd -24 th,
of contents table Tanzania Portland Cement Company Ltd, Annual Report 2010 Figures in TZS Letter of Transmittal 2
 ANNUAL FinancialHighlights table of contents Letter of Transmittal 2 Barua ya kuwasilisha 3 Chairman s Statement 6 Figures in TZS 000 2005 2006 2007 2008 Number of employees (yearly average) 292 304 312
ANNUAL REPORT OLD MUTUAL UNIT TRUST FUNDS. Abridged Report to Unit Holders for the Year ended 31 December 2017 PLANNING FOR POSITIVE FUTURES
 2017 ANNUAL REPORT OLD MUTUAL UNIT TRUST FUNDS Abridged Report to Unit Holders for the Year ended 31 December 2017 PLANNING FOR POSITIVE FUTURES 2 OLD MUTUAL UNIT TRUST FUNDS ANNUAL REPORT TABLE OF CONTENTS
KENYA S PPP EXPERIENCE AND PIPELINE PROJECTS
 KENYA S PPP EXPERIENCE AND PIPELINE PROJECTS AFRICAN CONFERENCE ON PUBLIC PRIVATE PARTNERSHIP 6-7 DEC 2012 SPEKE RESORT, KAMPALA, UGANDA Presentation By ENG STANLEY K, KAMAU HEAD OF PUBLIC PRIVATE PARTNESRSHIPS,
KEYNOTE ADDRESS BY THE CABINET SECRETARY FOR THE NATIONAL TREASURY AND PLANNING, MR
 KEYNOTE ADDRESS BY THE CABINET SECRETARY FOR THE NATIONAL TREASURY AND PLANNING, MR. HENRY ROTICH, EGH, DURING THE OFFICIAL LAUNCH OF THE 2018/2023 STRATEGIC PLAN AT THE KENYATTA INTERNATIONAL CONVENTION
INSTITUTE OF CERTIFIED PUBLIC ACCOUNTANTS OF KENYA CONTINUOUS PROFESSIONAL DEVELOPMENT CALENDAR- 2017
 INSTITUTE OF CERTIFIED PUBLIC ACCOUNTANTS OF KENYA CONTINUOUS PROFESSIONAL DEVELOPMENT CALENDAR- 17 PART A: INTERNATIONAL EVENTS 1. 25 th -27 th The 4 th Annual C-, Suite Mumbai, India Chief Executives,
Unlocking Our Full Potential
 Unlocking Our Full Potential Merrill Lynch Conference Cynthia Carroll May 2007 This presentation is being made only to and is directed only at (a) persons who have professional experience in matters relating
Table Of Content Athi River
 Table Of Content Trustees, advisers and other information 1-3 Chairperson s Report 5 Trust Secretary s Report 9 Board Of Trustees 12 Management 16 Report of the independent auditor 19 Statement of changes
ENEL Green Bond Framework
 ENEL Green Bond Framework December 2017 1. Introduction Enel and its subsidiaries (the Group or the Enel Group ) are deeply committed to the renewable energies sector and to researching and developing
MWITO CO-OPERATIVE SAVINGS CREDIT SOCIETY LIMITED CS / 3047
 MWITO CO-OPERATIVE SAVINGS & CREDIT SOCIETY LIMITED CS / 3047 ANNUAL REPORT & FINANCIAL STATEMENTS 2012 The Board and Supervisory committee members Board Members:- Mr. James O. Nyakundi - Nat. Chairman
Annual Report 2009 Taarifa ya Mwaka
 Annual Report 2009 Taarifa ya Mwaka Taarifa ya Mwaka 2009 1 Contents Yaliyomo Financial Summary 2 Board of Directors and Profiles 4 Chairperson s Statement 8 Managing Director s Report 10 Corporate Social
BUILDING INTO THE FUTURE Tanzania Portland Cement Company Limited Annual Report 2011
 BUILDING INTO THE FUTURE Tanzania Portland Cement Company Limited Annual Report 2011 FINANCIAL HIGHLIGHTS 2007-2011 2007 TZS 000 2008 TZS 000 2009 TZS 000 2010 TZS 000 2011 TZS 000 Number of employees
THE NIGERIAN STOCK EXCHANGE - COMMUNICATION TO STAKEHOLDERS
 THE NIGERIAN STOCK EXCHANGE - COMMUNICATION TO STAKEHOLDERS Last updated on: [April, 2015 ] BUSINESS STRATEGY 1. How does your exchange define and view the rationale for corporate sustainability and the
CENTRAL BANK OF KENYA. Remarks by PROF. NJUGUNA NDUNG U GOVERNOR
 CENTRAL BANK OF KENYA Remarks by PROF. NJUGUNA NDUNG U GOVERNOR CENTRAL BANK OF KENYA at the CONVENING ON LONG-TERM SUSTAINABLE FINANCE IN KENYA Norfolk Hotel, Nairobi Tuesday, 10 th February 2015 Dr.
Introduction. The Assessment consists of: Evaluation questions that assess best practices. A rating system to rank your board s current practices.
 ESG / Sustainability Governance Assessment: A Roadmap to Build a Sustainable Board By Coro Strandberg President, Strandberg Consulting www.corostrandberg.com November 2017 Introduction This is a tool for
Corporate Governance Statement 1. Organisation and governing bodies of the group 2. General Meeting of Shareholders 2
 Table of contents Corporate Governance Statement 1 Organisation and governing bodies of the group 2 General Meeting of Shareholders 2 Shareholders' Nomination Board 3 The Board of Directors 4 The Board
GARISSA SOCIAL SECTOR BUDGET BRIEF
 GARISSA SOCIAL SECTOR BUDGET BRIEF (2013-14 to 2015-16) Highlights In 2015-2016, county spent Ksh 6.5 billion, out of which 41 per cent was spent on social sector. Efficient administrative practices has
Annual Meetings Remarks May 3, Paul Mahon. President and CEO Great-West Lifeco Inc.
 Annual Meetings Remarks May 3, 2018 Paul Mahon President and CEO Great-West Lifeco Inc. Paul Mahon President and CEO Great-West Lifeco Inc. Contents Overview 1 Financial performance highlights 1 Creating
FISCAL STRATEGY PAPER
 REPUBLIC OF KENYA MACHAKOS COUNTY GOVERNMENT THE COUNTY TREASURY MEDIUM TERM FISCAL STRATEGY PAPER ACHIEVING EQUITABLE SOCIAL AND ECONOMIC DEVELOPMENT IN MACHAKOS COUNTY FEBRUARY2014 Foreword This Fiscal
SPECIAL BILL SUPPLEMENT THE FINANCE ACT, 2015 ARRANGEMENT OF PARTS PART II AMENDMENT OF THE BANK OF TANZANIA, (CAP. 197)
") ISSN 0856-035X THE UNITED REPUBLIC OF TANZANIA SPECIAL BILL SUPPLEMENT No. 1 11 th June, 2015 to the Gazette of the United Republic of Tanzania No. 24 Vol. 96 dated 12 th June, 2015 Printed by the Government
ISSN 0856-035X THE UNITED REPUBLIC OF TANZANIA SPECIAL BILL SUPPLEMENT No. 1 11 th June, 2015 to the Gazette of the United Republic of Tanzania No. 24 Vol. 96 dated 12 th June, 2015 Printed by the Government
OFFICE OF THE CONTROLLER OF BUDGET. BUDGET PERFORMANCE BY THE NATIONAL AND COUNTY GOVERNMENTS: Realities and way forward
 OFFICE OF THE CONTROLLER OF BUDGET BUDGET PERFORMANCE BY THE NATIONAL AND COUNTY GOVERNMENTS: Realities and way forward PRESENTATION TO THE ICPAK PUBLIC SECTOR TAX SEMINAR By: Stephen Masha Deputy Controller
PRESS KIT. Fact Sheet Benefits of Offshore Wind OREC Fact Sheet Spokespeople Media Contacts
 PRESS KIT Fact Sheet Benefits of Offshore Wind OREC Fact Sheet Spokespeople Media Contacts 22 W PENNSYLVANIA AVE No 600 TOWSON MD 21204 offshorewindus.org offshorewindus.org BUSINESS NETWORK FOR OFFSHORE
OCEAN PARK CONSERVATION FOUNDATION, HONG KONG
 OCEAN PARK CONSERVATION FOUNDATION, HONG KONG CODE OF GOVERNANCE Prepared: Mar 2012 Revised: Jun 2013 Page 1 of 22 OCEAN PARK CONSERVATION FOUNDATION, HONG KONG The Ocean Park Conservation Foundation ("OPCF")
Shareholder. the Snam. Snam Regulation and strategy. Snam 10 years on the Stock Exchange. Snam The shareholders return
 December 2011 the Snam Shareholder The Guide to run through the 10 years of SNAM Snam Regulation and strategy Snam 10 years on the Stock Exchange Snam The shareholders return The Snam of tomorrow The implementation