Final Report to the Secretary
|
|
|
- Julius Richards
- 5 years ago
- Views:
Transcription
 282-6367 www.health.state.")
1 Final Report to the Secretary Health Resources and Services Administration State Planning Grant Program State of Minnesota Department of Health October 30, 2001 Health Economics Program Health Policy and Systems Compliance 121 East Seventh Place, Suite 400 St. Paul, Minnesota (651)
2 Final Report to the Secretary Health Resources and Services Administration State Planning Grant Program State of Minnesota Department of Health October 30, 2001 For more information, contact: Health Economics Program, Health Policy and Systems Compliance Minnesota Department of Health 121 E 7 th Place Po Box St. Paul, Minnesota Phone: (651) Fax: (651) As requested by Minnes ota Statute 3.197: This report cost approximately $[cost of report] to prepare, including staff time, printing and mailing expenses. Upon request, this material will be made available in an alternative format such as large print, Braille or cassette tape. Printed on recycled paper. 2
3 3
4 Table of Contents Executive Summary 2 Recommendations for the Federal Government 6 Section 1. Summary of Findings: Uninsured Individuals and Families 7 Section 2. Summary of Findings: Employer-Based Coverage 22 Section 3. Summary of Findings: HealthCare MarketPlace 29 Section 4. Options for Expanding Coverage 32 Section 5. Consensus Building Strategy 51 Section 6. Lessons Learned and Recommendations to States 54 Section 7. Recommendations to the Federal Government 59 Endnotes 61 Appendix I: Baseline Information 62 Appendix II: Links to research Findings and Methodologies 65 1
5 Executive Summary Introduction Minnesota has long been a leader in state-based health care innovations focused on making affordable health coverage available to its citizens. Our MinnesotaCare subsidized health insurance program is nearly a decade old, and has provided a model for other states as they developed their own coverage expansions under S-CHIP. As a result of this and above average levels of employer-sponsored health insurance coverage, Minnesota has long had among the nation s lowest overall rates of uninsurance. However, the low overall rate of uninsured in Minnesota obscures the existence of higher rates of uninsurance among populations of color, American Indians, lower-income Minnesotans, and Minnesotans living in rural areas of the state. Under the HRSA State Planning Grant, Minnesota conducted a series of research activities that has added significantly to the state s knowledge of its uninsured population. We focused our grant data collection activities around gaining a better understanding of the health insurance coverage status for groups at risk of having higher rates of uninsurance and for whom little previous information was known. In doing so, Minnesota used a variety of approaches to fill its knowledge gaps around coverage, including household and employer surveys, focus groups, key informant interviews, and surveys of former public program enrollees. Research under the State Planning Grant Research under Minnesota s State Planning Grant was structured to fill in knowledge gaps about Minnesota s uninsured population, with a focus on collecting better information about Minnesota s populations of color, American Indian population, and rural populations. We conducted both quantitative research, intended to statistically document coverage differences, and qualitative research, designed to gain a better understanding for some of the complex reasons why individuals in Minnesota lack health coverage. The following research projects were or are currently being conducted under the grant: Large-scale household telephone survey of approximately 27,000 Minnesotans; In-person household survey of 2,085 Minnesotans; Employer survey of 2,400 establishments in Minnesota; Focus groups (18) with Hmong, Somali, Hispanic/Latino, and American Indian Minnesotans; Focus groups with farm families; Key informant interviews with those familiar with or who work directly with the uninsured; Mail survey of those who have disenrolled from the MinnesotaCare subsidized health insurance program. Summarized below are the primary findings from the various study components. Overall, however, integrating the quantitative and qualitative research yields several key themes from the SPG research: Minnesota s overall low rate of uninsurance masks wide disparities in coverage that exist between racial and ethnic groups, various geographic regions of the state, and among different age cohorts. The disparities that exist are the result of a series of complex and interrelated factors. These include: o A lack of awareness of public and private health offerings and eligibility requirements; o Complex administrative structures and applications for public health coverage; o Differential access to employer-based and private health coverage; o Differences in the cultural approach to the value of health insurance coverage; 2
6 o Lack of cultural sensitivity to the different ways in which different cultures approach health care and health coverage; o Differences in viewpoints on the value of health coverage, relative to other expenditure choices. Access to public health insurance programs is hampered by administrative, cultural, enrollment, and eligibility barriers. Affordability emerged as a key theme. The research conducted under the grant and findings from the research were as follows: Household Telephone Survey: The household telephone survey was a random-digit-dial survey of approximately 27,000 Minnesotans. The survey used a stratified random digit dial sample design; this strategy was chosen to allow for over sampling of certain geographic regions, populations of color, and American Indians. The primary findings from the Household telephone survey were: 5.4% of Minnesotans, or approximately 266,000 people, were uninsured at the time of the survey. Large disparities existed between the uninsurance rates of Minnesota s white population and racial and ethnic minority groups. o 4.6% of Minnesota s white population lacked coverage at the time of the survey, compared to 15.6% of Minnesota s black population, 15.9% of American Indians, and 17.6% of Hispanics. o 6.8% of white Minnesotans lack coverage at some point during the year, compared to 22.4% of black Minnesotans, 19% of American Indians, and 21.9% of Hispanic Minnesotans. Insurance disparities also exist between different regions of the State. o The southeastern portion of Minnesota has the lowest uninsurance rate of 3.4%, while the mid-central, west-central, and northwest areas of Minnesota have rates of 8.8%, 7.6%, and 9.4% respectively Minnesotans not born in the U.S. are much more likely to lack health insurance coverage at some point during the year than those born in the U.S. o 7.2% of Minnesotans born in the U.S. lack coverage at some point during the year, compared to 46.5% for those born in a Hispanic nation and 34.6% of those born in an African nation. Young adults are the age group most likely to lack health insurance coverage. o 13.9% of persons age 18 to 24 lacked health insurance coverage at the time of the survey, compared to 5.4% overall. Approximately half of the uninsured in Minnesota are potentially eligible for a public health insurance program. Additional uninsured are eligible to enroll in employer-sponsored coverage. 3
7 Focus Groups with American Indians and Populations of Color: Under the grant, Minnesota conducted focus groups averaging six to eight people per group with American Indian, Hispanic/Latino, Hmong, and Somali individuals. The purpose of the focus groups was to gain insight and information into attitudes about health coverage and why certain groups may have higher rates of uninsurance. Certain overall themes from the focus groups emerged: There is a general lack of knowledge about public health insurance programs; The stigma associated with government programs keeps people from using them; Opportunities to get jobs that have health insurance benefits are limited; Expenses associated with premiums, co-pays, and deductibles are prohibitive; The paperwork and recertification processes of public programs are cumbersome; New immigrants have difficulty understanding the health care system and the concept of insurance; New immigrants are fearful of encounters with government institutions, and also have concerns about deportation; There is limited cultural competency among professionals in public programs and the health care system in general; Many people believe they are treated disrespectfully by state, county, and health agency staff. Key Informant Interviews: MDH staff conducted a series of approximately 20 key informant interviews regarding uninsurance and access to insurance coverage. The key informant interviews consisted of qualitative, in-depth interviews of people possessing special knowledge of and access to the perceptions of people who are uninsured. The key findings from the key informant interviews were: For low-income people, insurance competes with many other considerations and is not always a priority. People who are potentially eligible for public insurance programs lack awareness of the programs, and many who know about the programs do not know they may be eligible. Administrative complexities keep people from enrolling in public programs, and contribute to people losing coverage after having been enrolled in a public program. The key informants also believed that enrollment workers need more training on program rules and eligibility. The system of public insurance and the provider system lack cultural competence. People of color and American Indians believe they are not treated respectfully, and stories about bad experiences cause some people to avoid the system as much as possible. In addition, information from the employer survey, in-person household survey, and further analysis of the various focus groups and telephone household survey data will be available for the March report to HRSA. Policy Options Based on the findings from the research projects under the SPG, Minnesota has identified a number of areas for potential policy development. We have divided these into three primary areas: Private health insurance market, public programs, and options related to outreach, education, and cultural competency. 4
8 Private market options: o Subsidies for low-income people to purchase private coverage; o Individual insurance market reform to make this market more accessible and affordable; o Extend ability for young adults age 18 to 24 to be covered as dependents under parents health insurance policies. Public program options: o Expand MinnesotaCare eligibility to people whose employers subsidize less than 70% of premiums (current standard is 50%) or establish sliding employer-subsidy eligibility level; o Consider changing eligibility criteria for public insurance programs for seasonal workers and farmers; o Drop premium payment for American Indian children; o Improve retention of enrollees in public programs who continue to be eligible and lack other coverage options; o Increase administrative flexibility in application processes and in collecting premium payments; o Reduce frequency with which public program enrollees must recertify their eligibility. Options related to outreach, education, and cultural sensitivity: o Outreach and communication about the value of and need for health insurance; Non-English outreach and education campaign o Improve cultural competency at all levels of the system; o Reduce stigma associated with public insurance programs. 5
9 RECOMMENDATIONS FOR THE FEDERAL GOVERNMENT TO EXPAND HEALTH COVERAGE In addition to the options being considered at the state level, Minnesota has a number of recommendations for the Federal government surrounding action that could be taken at the Federal level to expand health coverage and support ongoing data collection activities of states. The State of Minnesota proposes three coverage expansion options that involve changes in federal law or policy: Offer federal tax credits for purchasing health insurance coverage. We recommend that the federal government adopt a tax credit of sufficient size to encourage and enable individuals to purchase high quality health insurance coverage. Increase the flexibility of the Centers for Medicaid and Medicare Services (CMS) in approving state Medicaid and SCHIP waivers. Minnesota was encouraged by the recent announcement of the Health Insurance Flexibility and Accountability (HIFA) demonstration project initiative, and urges CMS to expand on initiatives such as HIFA that give states flexibility in establishing and administering health insurance programs. Provide adequate funding for the Indian Health Service (IHS). The state recommends adequate funding for IHS to ensure the provision of high quality health care services for American Indians living both on reservations and off reservations. Minnesota also recommends that the Federal government support the work of state policy development and data collection on an ongoing basis. Specifically, we recommend the following: Support for ongoing state-specific monitoring of the uninsured. While the SPG has allowed Minnesota to collect a wealth of otherwise unavailable information, ongoing monitoring and tracking of progress at reducing the uninsured is equally important, and we recommend that the Federal government support such activities. Encourage more timely and accessible release of state-specific estimates from federally-collected data sources. While clear progress has been made recently at the federal level in improving estimates of the uninsured and conducting other research with state-specific estimates (e.g., employer surveys), information collected by the federal government needs to be available to state analysts in a manner that is both timely and allows for states to work with unaggregated data. 6
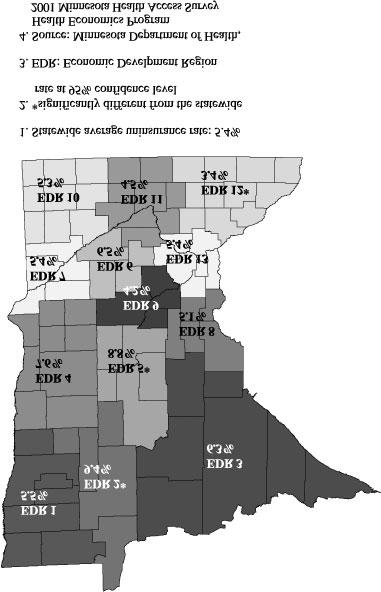
10 SECTION 1. SUMMARY OF FINDINGS: UNINSURED INDIVIDUALS AND FAMILIES The purpose of this section is to describe (1) who the uninsured are in your State; (2) what strategy was used to obtain this information; and (3) how these findings are reflected in the coverage options that your State has selected or is currently considering. In discussing your survey findings, please be sure to link the results directly to your State s coverage expansion strategy. More detailed survey findings (reports, spreadsheets, etc.), as well as survey instruments and other descriptions of the research methodology, should be referenced in Appendix II. Questions 1.1 through 1.3 focus on the quantitative research work conducted by the State. If possible, please use the Current Population Survey definitions and data breaks, even if alternate data sources are used. This will allow comparisons across all states in the summary report. 1. Who are the uninsured in your state? 1.1 What is the overall level of uninsurance in your State? The 2001 Minnesota Health Access Survey, funded by the State Planning Grant (SPG), is the largest and most comprehensive health insurance survey conducted in Minnesota to date. The survey results show that 5.4% of Minnesotans, or approximately 266,000 people, were uninsured at the time of the survey. Approximately 3.1% of Minnesotans (or 152,500 people) had been uninsured for all of the previous year. In addition, about 4.7% of the population (or 231,500 people) reported having been uninsured for part of the previous 12 months, but not necessarily at the time of the survey. Thus, approximately 7.8% of Minnesotans (or 384,000 people) experienced some time during the past year when they did not have health insurance. (This percentage is the sum of the whole year and part year uninsured.) Table 1.1 shows uninsurance rates for population groups of particular interest to the State of Minnesota using these four alternative definitions (point-in-time, uninsured all year, uninsured part of year, uninsured at some point during the year). In general, low-income populations, young adults, populations of color, American Indians, and foreign-born Minnesotans are more likely to be uninsured than their white, native-born counterparts. Uninsurance rates also vary widely by region of the state. Figure 1.1 shows uninsurance rates for 13 different geographic regions of Minnesota. 7
11 Table Minnesota Uninsurance Rates Point-in-time Whole Year Part Year Some Point in Year State 5.4% 3.1% 4.7% 7.8% Poverty Level 0 to 100% 13.6% 8.4% 10.1% 18.5% 101 to 200% 16.0% 10.3% 11.8% 22.1% 201 to 300% 7.4% 4.3% 6.2% 10.5% 301 to 400% 3.7% 2.0% 3.9% 5.9% 401%+ 1.5% 0.8% 2.0% 2.8% Age 0 to % 2.3% 4.1% 6.4% 18 to % 7.5% 12.9% 20.4% 25 to % 5.3% 8.5% 13.8% 35 to % 3.0% 4.0% 7.0% 55 to % 1.9% 1.7% 3.6% % 0.3% 0.4% 0.7% Race/Ethnicity White 4.6% 2.6% 4.2% 6.8% Black 15.6% 9.9% 12.5% 22.4% Asian 7.2% 3.2% 6.0% 9.2% American Indian 15.9% 9.6% 9.4% 19.0% Other Race 10.0% 6.0% 9.0% 15.0% Hispanic 17.6% 12.4% 9.5% 21.9% Country of Origin US Born 4.9% 2.7% 4.5% 7.2% Hispanic nation 36.6% 29.4% 17.1% 46.5% African nation 24.3% 17.8% 16.8% 34.6% Asian nation 7.4% 3.1% 5.8% 8.9% Other nation 6.4% 3.9% 8.7% 12.6% Region 1 5.5% 2.4% 5.4% 7.8% 2 9.4% 6.0% 5.8% 11.8% 3 6.3% 3.4% 6.1% 9.5% 4 7.6% 5.5% 3.8% 9.3% 5 8.8% 4.5% 7.4% 11.9% 6 6.5% 3.4% 5.3% 8.7% 7 5.4% 3.2% 4.1% 7.3% 8 5.1% 3.0% 6.8% 9.8% 9 4.2% 2.5% 4.3% 6.8% % 3.6% 4.1% 7.7% % 2.1% 3.9% 6.0% % 2.2% 3.3% 5.5% % 3.0% 4.7% 7.7% 8
12 9
13 Table Characteristics of the Uninsured in Minnesota Point-in-time Whole Year Part Year Some Point in Year Survey Population* Poverty Level 0 to 100% 13.1% 13.4% 11.0% 12.5% 5.2% 101 to 200% 35.6% 37.9% 30.0% 33.0% 12.1% 201 to 300% 27.1% 26.6% 26.0% 25.9% 19.7% 301 to 400% 11.1% 10.3% 13.6% 12.3% 16.4% 401%+ 13.1% 11.8% 19.3% 16.4% 46.6% Age 0 to 5 4.8% 2.0% 7.0% 5.0% 7.1% 6 to % 15.5% 13.3% 13.7% 16.4% 18 to % 20.4% 22.9% 22.1% 8.6% 25 to % 22.9% 24.2% 23.2% 13.5% 35 to % 32.3% 28.4% 30.2% 33.4% 55 to % 6.0% 3.3% 4.7% 9.5% % 1.0% 1.1% 1.1% 11.6% Gender Male 52.5% 54.8% 47.1% 50.4% 48.2% Female 47.5% 45.2% 52.9% 49.6% 51.8% Family Composition** Single 39.5% 39.4% 33.7% 36.5% 16.9% Married 40.2% 39.1% 46.3% 43.1% 69.0% Living with Partner 10.4% 10.2% 10.6% 10.2% 3.7% Divorced/Separated/Widowed 9.9% 11.2% 9.4% 10.2% 10.4% Health Status Excellent 29.6% 30.8% 27.5% 28.6% 40.4% Very Good 31.9% 28.3% 33.5% 31.7% 31.9% Good 26.8% 26.6% 27.1% 27.1% 19.4% Fair 9.3% 10.8% 10.0% 10.2% 6.2% Poor 2.4% 3.6% 2.0% 2.5% 2.1% Employment** Self Employed 19.1% 24.0% 9.5% 15.1% 10.8% Employed by Someone Else 54.3% 51.4% 64.7% 59.5% 64.9% Unemployed 21.0% 18.9% 19.8% 19.4% 8.0% Retired 1.3% 1.3% 1.9% 1.7% 13.0% Full-time Student 4.4% 4.4% 4.1% 4.3% 3.5% Number of Jobs Work One Job 82.6% 81.4% 85.3% 83.7% 88.2% Work Multiple Jobs 17.4% 18.6% 14.7% 16.3% 11.8% Hours worked per week 0 to 10 hours 1.8% 1.3% 1.5% 1.4% 1.5% 11 to 20 hours 7.5% 7.9% 7.0% 7.4% 5.0% 21 to 30 hours 14.1% 14.3% 10.1% 12.0% 6.8% 31 to 40 hours 48.6% 45.3% 50.5% 48.8% 48.3% 10
14 40+ hours 28.0% 31.2% 30.9% 30.4% 38.5% Type of Job Permanent Job 80.9% 80.5% 88.4% 84.8% 95.4% Temporary Job 10.8% 10.6% 6.6% 8.3% 2.5% Seasonal Job 8.4% 8.9% 5.1% 7.0% 2.1% Size of Employer % 18.0% 8.2% 12.1% 7.2% 2 to % 30.9% 15.4% 21.5% 12.6% 11 to % 15.4% 18.9% 17.6% 14.3% 51 to % 6.1% 11.2% 9.5% 7.9% 101 to % 13.5% 15.1% 14.0% 16.6% % 16.2% 31.2% 25.4% 41.4% Race/Ethnicity*** White 78.0% 76.5% 82.7% 79.8% 92.1% Black 9.5% 10.4% 8.7% 9.3% 3.3% Asian 2.8% 2.2% 2.7% 2.5% 2.1% American Indian 4.4% 4.6% 3.0% 3.7% 1.5% Other Race 1.6% 1.7% 1.7% 1.7% 0.9% Hispanic 10.4% 12.5% 6.3% 8.7% 3.2% Country of Origin US Born 87.2% 84.6% 90.1% 88.1% 95.5% Hispanic nation 6.5% 8.7% 3.3% 5.4% 1.0% African nation 2.7% 3.4% 2.1% 2.5% 0.6% Asian nation 1.9% 1.4% 1.7% 1.7% 1.4% Other nation 1.8% 1.9% 2.8% 2.3% 1.5% Region 1 1.8% 1.4% 2.0% 1.9% 1.8% 2 2.7% 3.0% 1.9% 2.5% 1.5% 3 7.6% 7.1% 8.5% 8.0% 6.5% 4 6.0% 7.5% 3.4% 4.9% 4.3% 5 5.0% 4.5% 4.8% 4.7% 3.1% 6 2.8% 2.6% 2.6% 2.7% 2.4% 7 1.0% 1.1% 0.9% 0.9% 1.0% 8 2.6% 2.7% 4.0% 3.4% 2.8% 9 5.0% 5.3% 5.9% 5.5% 6.5% % 2.9% 2.2% 2.5% 2.5% % 3.0% 3.7% 3.7% 4.5% % 6.8% 6.5% 6.5% 9.4% % 52.2% 53.6% 52.8% 53.7% Access/Eligibility**** Employer Access 22.7% 20.6% 30.9% na na Public Program Eligible 49.6% 50.2% 48.1% na na No Access or Eligibility 33.1% 33.9% 28.5% na na * Characteristics/Demographics of the survey population to be used in comparisons to characteristics of the uninsured. ** Characteristics are based on adult responses and the responses of one parent of child respondents. *** Distribution will add to greater than 100% as people were allowed to be categorized as more than one race/ethnicity. **** Distribution will add to greater than 100% as some people may be eligible for public programs and have access to employer Uninsured part year distribution is only of those part year uninsured at the time of the survey. 11
15 1.2 What are the characteristics of the uninsured? Table 1.2 shows the characteristics of the point-in-time uninsured, the whole year uninsured, the part year uninsured, and the uninsured at some point in the year from the household telephone survey. In general, the uninsured in Minnesota are more likely to: have incomes between 101% and 300% of the federal poverty level (62.7% of the point-in-time uninsured) be adults between the ages of 18 and 54 (74.8% of the point-in-time uninsured) be male (52.5% of the point-in-time uninsured) be in good to excellent health (88.7% of the point-in-time uninsured) be employed (73.4% of the point-in-time uninsured) work only one job (82.6% of the point-in-time uninsured) work 31 hours or more per week (76.6% of the point-in-time uninsured) have a permanent job (80.9% of the point-in-time uninsured) be either self-employed or work for an employer with 50 or fewer employees (59.6% of the point-intime uninsured) be white (78.0% of the point-in-time uninsured) be born in the United States (87.2% of the point-in-time uninsured) live in the Twin Cities metropolitan area (53.5% of the point-in-time uninsured) be eligible for a public health insurance program (49.6% of the point-in-time uninsured) 1.3 Summarizing the information provided above, what population groupings were particularly important for your State in developing targeted coverage expansion options? Our survey data showed that a large proportion of the uninsured already have access to coverage, either through an employer or a public program. Therefore, a major focus of our development of options was finding ways to improve take up of employer-based coverage and to increase enrollment in public programs by people who are already eligible. We also targeted some of our options specifically to people who do not have access to employer coverage and are also not eligible for public programs (an estimated 33.1% of the point-in-time uninsured in Minnesota). In developing coverage expansion options, Minnesota also paid particular attention to disparities in uninsurance rates across different populations. Given the disproportionately high uninsurance rates experienced by populations of color, American Indians, and foreign-born Minnesotans, several of the coverage expansion options being considered are specifically aimed at increasing health insurance coverage for these populations. Coverage options being considered in Minnesota have also been targeted for young adults and rural populations, who experience disproportionately high uninsurance rates. Questions 1.4 through 1.13 focus primarily on the qualitative research work conducted by the State: 1.4 What is affordable coverage? How much are the uninsured willing to pay? Our qualitative research work did not elicit any specific dollar amount as to what constitutes "affordable coverage." Focus group participants and key informants indicated that monthly premiums were a significant barrier to obtaining coverage. Many key informants also stated that they believed that people who seek health care from safety-net providers should be able to receive it at no cost. 12
16 Some of our quantitative research work was designed to provide information on affordable coverage. Results from the survey of disenrollees from the MinnesotaCare program show that this population was generally satisfied with the amount that they had paid in premiums. However, this reflects only the opinions of people who have been in the MinnesotaCare program and not the uninsured population in general. Our in-person household survey will be completed by the end of the year and the results of this survey will include opinions about what dollar amounts constitute affordable coverage. The results from the in-person household survey will be included in the March update report to HRSA. We are also conducting an analysis of consumer sensitivity to price in the decision to purchase health insurance. This analysis uses data from the telephone household survey to construct a model of consumer sensitivity to price in the decision to purchase individual health insurance coverage, to enroll in MinnesotaCare, or to remain uninsured. The results of this analysis will provide some insight into what consumers at various income levels consider affordable coverage by looking at their decision about whether to purchase coverage given the options available to them. The results of this analysis will be available for the March update report to HRSA. We believe that it is important to further examine the question of affordability together with the issue of adequacy of coverage. We have applied for and received supplemental funding from HRSA to conduct additional research in these areas, and the results of that research will be included in the March update report to HRSA. 1.5 Why do uninsured individuals and families not participate in public programs for which they are eligible? The focus groups and key informant interviews brought out many reasons why individuals and families sometimes do not participate in public programs for which they are eligible. These included: lack of awareness of public programs in general, and lack of awareness of one s own potential eligibility; finding the application process and other administrative procedures too difficult to negotiate; the belief that they do not need health insurance because they are healthy and not at risk for illness or injury; people feeling a lack of respect from the process or the people they interact with during the application process; shame and stigma associated with being on a public program; specific to American Indians, the belief that they are already entitled to health care services due to treaties between American Indian tribes and the U.S. government. Results from the household telephone survey show that a large proportion of the uninsured who are eligible for public health insurance programs have not heard of or been given information about public programs in Minnesota. Approximately 42% of the uninsured who are potentially eligible for a public health insurance program have no knowledge of public health insurance programs in Minnesota. When asked if they would enroll in a public health insurance program if they knew they were eligible, 75.5% of the uninsured who are potentially eligible for a public health insurance program stated that they would enroll in a public program. Of those who stated that they would not enroll if they knew they were eligible for a public program, the following reasons were cited as reasons why they would not enroll: do not want to be on welfare (36.0%), do not want or need insurance/not sick (22.4%), will be getting private coverage 13
17 soon (18.6%), too much paperwork/invasion of privacy (11.8%), it is too expensive (1.4%), and various other reasons (9.8%). 1.6 Why do uninsured individuals and families disenroll from public programs? Under the State Planning Grant, we conducted a survey of MinnesotaCare disenrollees who left the program 12 and 18 months prior to the survey. Survey results show that among those who voluntarily terminated their MinnesotaCare coverage, 64.5% obtained other health insurance coverage and 14.9% disenrolled because they could not pay the monthly premium. For disenrollees who were involuntarily terminated from the program, 31.7% indicated that they believed they were terminated because they had other health insurance coverage, 20.8% because they were no longer eligible, and 19.4% because they did not pay the premium. Results from the MinnesotaCare disenrollee survey also show that about three-fourths (76.7%) of individuals who left the program had insurance at the time of the survey. Of those with insurance, over half (56.2%) had coverage through their own or someone else s employer. An additional 19.2% reported that they had re-enrolled in MinnesotaCare, and 13.9% indicated that they enrolled in other public programs. Of the 23.3% of disenrollees who were uninsured at the time of the survey, 38.4% had been uninsured for more than 12 months. Detailed results from the MinnesotaCare disenrollee survey are provided in Table Why do uninsured individuals and families not participate in employer-sponsored coverage for which they are eligible? The results from the key informant interviews and focus groups found that some people are not participating in employer-sponsored insurance because they don't know they are eligible for coverage through their employer, or they find the cost-sharing required under employer policies too high. Some employees get coverage for themselves, but cannot afford to cover the cost of the premium to cover their family members. Results from the household telephone survey show that a majority of the uninsured who are eligible for employer coverage do not enroll because they cannot afford the cost sharing. Approximately 54% of the uninsured who are eligible for employer-based health insurance coverage stated that they have not taken up employer coverage because they cannot afford it. Other than cost, the most common reasons cited by the uninsured for not taking up employer-based coverage are that they do not need or want health insurance (4.4%), that getting helath insurance is too much of a hassle or requires too much paperwork (3.4%), they expect to be covered by a health insurance policy soon (3.2%), and that they do not like the benefits (1.9%). Over 30% reported other, non-specified reasons for not taking up employer-based health insurance coverage. Results from Minnesota s employer survey, which is not yet complete, will provide detailed information on cost-sharing for employer-based health insurance. This information will allow for an analysis of costsharing requirements that may help to explain why some employees do not enroll in coverage for which they are eligible. Data from previous surveys have shown that lower-income employees have to pay a higher portion of their income for employer-based coverage than do higher-income employees, and this likely affects the take-up rate among lower-income employees. Results from the employer survey will be made available in the March update to the HRSA report. 14
18 Table 1.3 MinnesotaCare Disenrollee Survey Current Health Insurance Coverage? % Yes 76.7 No 23.3 If Covered, Source of Health Insurance? Through someone else's job 31.8 Through my job 24.4 MinnesotaCare 19.2 MA, Medicaid, PMAP, GAMC 7.5 Bought by me or someone else 5.9 Medicare 5.4 Other 2.8 Moved 1.9 MCHA 1.0 Indian Health Service 0.0 Length of Time without Health Insurance? Fewer than 3 months to 6 months to 9 months to 12 months 18.2 More than 12 months 38.4 Termination of Coverage? I ended my MNCare coverage 53.3 MNCare ended my coverage 39.1 Both 7.6 Reason Voluntarily Cancelled? Got other insurance 64.5 Could not pay monthly premium 14.9 Other 6.6 Could get free health care 4.7 Moved 3.9 Not eligible 3.7 Did not use or need health care services 0.8 Did not like MNCare 0.6 Unhappy with health care services 0.3 Language barrier 0.1 Reason MNCare Cancelled? Have other insurance 31.7 Not eligible 20.8 Did not pay premium 19.4 Did not renew 13.1 Other 11.1 Do not know 3.4 Moved 0.6 Did not pay child support
19 1.8 Do workers want their employers to play a role in providing insurance or would some other method be preferable? Minnesota did not address this question in its data collection efforts under the State Planning Grant. 1.9 How likely are individuals to be influenced by: Availability of subsidies?: Minnesota did not specifically address this question in its data collection efforts under the State Planning Grant. However, our in-person survey will report opinions about what dollar amount constitutes affordable coverage. This information could potentially be used to help set subsidy levels. Our analysis of consumer sensitivity to price in the decision to purchase health insurance will also provide information that will be useful in setting subsidy levels. Results from both the in-person household survey and the consumer sensitivity to price analysis will be reported in the March update report to HRSA. Tax credits or other incentives?: Minnesota has not attempted to quantify the impact of tax credits on the purchase of health insurance; however, we believe that tax credits have the potential to be an effective tool in making affordable coverage options available to the uninsured. Results from the in-person household survey on affordable coverage and the analysis of consumer sensitivity to price in the decision to purchase health insurance will both provide information that could potentially be used to help set tax credits that would encourage the purchase of health insurance. However, given the large differences between state and federal tax rates, this option is most likely to be effective if enacted at the federal rather than the state level What other barriers besides affordability prevent the purchase of health insurance? Besides the issue of affordability, we learned from key informant interviews and focus groups that the following issues prevent people from purchasing health insurance: lack of awareness of public and private options and eligibility requirements; complex administrative structure and application process for public programs; difficulty in accessing information about programs and application process; lack of cultural sensitivity to minority group members and their needs; some people do not believe they need coverage, or decide that money is better spent elsewhere; lack of information about the costs of private coverage. Results from the household telephone survey show that a majority of the uninsured say that they do not purchase health insurance because of cost. Approximately 62% of the uninsured state that they have not purchased health insurance because they cannot afford it. Besides affordability, the most common reasons cited by the uninsured for not purchasing health insurance are that they expect to be covered by a health insurance policy soon (6.1%), they are not eligible or were rejected (5.6%), they do not need or want health insurance (3.7%), and that getting health insurance is too much of a hassle or requires too much paperwork (3.5%). Nearly 18% reported other, non-specified reasons for not purchasing health insurance. 16
20 1.11 How are the uninsured getting their medical needs met? The key informant interviews and the focus groups found that the uninsured in Minnesota are getting their medical needs met, to varying degrees, in the following ways: safety-net clinics and hospitals; paying out of pocket, which often entails going into substantial debt; forgoing medical and dental health services, particularly preventive services; in specific cultural groups, using alternative providers, such as a medicine man, shaman, or curanderos (healers in the Hispanic culture). Results from the household telephone survey show that the uninsured are three and a half times more likely to lack a regular source of health care than the privately insured. Nearly 40% of the uninsured do not have a regular place that they go to receive health care services. However, although the uninsured are more likely to lack a regular source of care, the survey revealed no difference in reported emergency room utilization between the privately insured and the uninsured. This result is not consistent with anecdotal evidence from safety net providers; further research is needed to identify more clearly whether the uninsured are more likely to seek care in hospital emergency rooms What is a minimum benefit? Minnesota did not address this question in its data collection efforts under the State Planning Grant. However, we have applied for and received supplemental funds from HRSA to study the issue of adequacy of insurance benefits for those who have coverage, and will report the findings of this work in the March update report How should underinsured be defined? How many of those defined as insured are underinsured? The State of Minnesota has not established a definition of the underinsured. MDH has requested and received additional funding from HRSA to study the issue of underinsurance in more depth. Under this supplemental funding, we anticipate developing a definition or definitions of underinsurance, and attempting to identify the scope of underinsurance in Minnesota. As part of this effort, we will collect information from health insurance carriers in the state on their various benefit sets and enrollment in each to evaluate adequacy of coverage. 2. What strategy was used to obtain this information? Listed below are descriptions of the quantitative and qualitative research methods used to gain the information reported in part one of this report. Household Telephone Survey: The household telephone survey was a random-digit-dial survey of approximately 27,000 Minnesotans. The survey instrument used was based on the Minnesota Health Access Survey developed by the University of Minnesota, School of Public Health, Division of Health Services Research and Policy. Previous versions of this survey were conducted in 1990, 1995 and
21 For the State Planning Grant, the survey was modified to add questions related to household insurance status, dental insurance, public program stigma, reasons for lack of insurance coverage, health service utilization, country of origin, and employment. The sampling design was structured to allow for adequate sample sizes from various regions of the state, populations of color, and American Indians. The survey used a stratified random digit dial sample design; this strategy was chosen to allow for over sampling of certain geographic regions, populations of color, and American Indians. Within each stratum, households and individuals within households were randomly selected to participate in the survey. The University of Minnesota, School of Public Health, Division of Health Services Research and Policy fielded the survey from November 2000 through May In-Person Household Survey: The in-person household survey was designed to supplement the household telephone survey. Stakeholders that we consulted during the study design process stated that telephone survey approaches have limitations, particularly with populations of color and American Indians. These limitations occur in part because of a lack of trust in researchers, the government, and outside groups in general. In addition, telephone coverage differs within communities around the state, and there is a potential for bias to be introduced if telephone coverage is not consistent across racial and ethnic groups. To address this concern, the in-person household survey was designed to survey African American, Hispanic, Asian, American Indian and White populations in Minnesota. In order to increase the level of trust and reliability of information gathered from populations of color and American Indians through the in-person interview, survey participants were interviewed by someone of the same race/ethnicity. The household telephone survey was modified for use as an in-person survey. We added additional questions that we believed would provide useful information in the in-person format but that would be difficult to ask in a telephone survey. These questions related to affordability, public program stigma, cultural values and health care issues, and reasons for lack of insurance coverage. The survey used a sampling approach where households and individuals within households were randomly selected from geographically clustered areas of the state. The Wilder Research Center is currently conducting the inperson household survey. The survey is expected to be completed by the end of the year, with information collected under the survey being reported in the March follow-up report. MinnesotaCare Disenrollee Survey: The MinnesotaCare disenrollee survey was mailed to a random sample of individuals who left the MinnesotaCare subsidized health insurance program 12 and 18 months prior to the survey. The total sample for the survey was 2,500 individuals, and the sample was stratified by program eligibility type (families with children vs. single adults) and by date of disenrollment (either 12 months prior to the survey date or 18 months prior). The overall response rate was 31.8%. Statistical weights were developed to adjust for different probabilities of being selected for the survey by family type and disenrollment date. The weights also included adjustments for response bias by age, sex, geography, and income level as determined through administrative data. The survey was fielded from May 2001 to July 2001, and was conducted by staff at the Minnesota Department of Health. Focus Groups with American Indians and Populations of Color: Focus groups averaging six to eight people per group were conducted with American Indian, Hispanic/Latino, Hmong, and Somali individuals. The Hispanic/Latino focus groups were conducted under a contract with the University of Minnesota and the community organization HACER (Hispanic 18
22 Advocacy and Community Empowerment through Research). The American Indian, Hmong, and Somali groups were conducted in locations across the state under a contract with the Center for Cross-Cultural Health in Saint Paul, Minnesota. The Minnesota Department of Health arranged for focus group training for the moderators that these organizations hired to facilitate the focus groups. Each focus group was facilitated by a moderator and an assistant moderator who came from the same ethnicity/culture as the people in the group. These moderators and assistants were identified by the contracted organizations connections with local community advocacy groups that work with people from the cultures we were studying. Groups for non-english speakers were conducted in the appropriate languages. Moderators and assistants went through intensive 6-hour training sessions with Dr. Richard Krueger and Mary Anne Casey, expert trainers in the field of focus group research. The questions used in the focus group research were developed by MDH researchers working in close collaboration with the contracted agencies, the focus group training professionals, and community organizations that work with the cultures included in the study. Focus groups were conducted starting in May 2001, and concluded in August Focus Groups with Farmers: Because of some of the unique issues faced by rural farm families, the Minnesota Department of Health undertook a series of focus groups with farm families in Minnesota. The focus groups that were held with Minnesota farmers were organized and moderated by staff at the University of Minnesota in Crookston, a campus which works closely with farmers and on farm issues. The UM-Crookston staff attended a twoday training with focus group training professionals Richard Krueger and Mary Anne Casey. Crookston staff gave MDH staff feedback on the focus group questions, found farmers to participate in the focus groups, organized the logistics for carrying out the groups, and carried out the focus groups. Three groups were held in rural areas of northwest Minnesota, and three in rural areas of southwest Minnesota. These focus groups were held in July and August of Key Informant Interviews: MDH staff conducted a series of key informant interviews regarding uninsurance and access to insurance coverage. The key informant interviews consisted of qualitative, in-depth interviews of people possessing special knowledge of and access to the perceptions of people who are uninsured. The interviews were loosely structured, based on a list of topics and broad questions. Twenty interviews were conducted with individuals who frequently work with uninsured Minnesotans and those at high risk of becoming uninsured. These people were from professions that fall into four categories: health care providers, administrators, caseworkers/social workers, and community leaders/advocates. 3. How are these findings reflected in the coverage options that your State has selected or is currently considering? The findings reported in this section guided the development of many of the coverage expansion options. As noted earlier, Minnesota s coverage expansion options are focused on 2 main areas: populations with disproportionately high uninsurance rates and populations that comprise a large proportion of the uninsured. Large disparities in uninsurance rates exist for populations of color, American Indians, and foreign-born Minnesotans compared to white, native-born Minnesotans. Research findings suggest that large disparities in uninsurance rates may exist among these populations for a variety of reasons, including 19
23 differences in access to employer-based health coverage, differences in socioeconomic status, a lack of knowledge and understanding of public and private sources of health insurance coverage, issues of respect and cultural competency with public health insurance programs and throughout the health care system, and differences in beliefs around the value or need for health insurance coverage. Various coverage expansion options were designed to address these barriers to health insurance coverage. These include: outreach and education campaigns for public health insurance programs targeted for populations of color, American Indians, and non-english speaking Minnesotans; reducing the administrative complexity of public health insurance programs; improving cultural competency with public health insurance programs; and general outreach campaigns on the value of health insurance. Results from the household telephone survey also show that young adults between the ages of 18 and 24 experience much higher uninsurance rates than other age groups. Young adults tend to have higher uninsurance rates than other age groups for a variety of reasons, such as the fact that they are transitioning from parental coverage to their own coverage, they are healthy and often do not see the value of purchasing health insurance compared to other spending priorities, and the entry-level jobs they work in may not include health insurance as a benefit. For those who attend college full-time, current Minnesota law requires that parental insurance coverage can be extended to the age of 24. For those who do not attend college full-time, parental coverage ends at age 18 or when the child graduates from high school. Results from the household telephone survey show that approximately 60% of uninsured adults between the ages of 18 and 24 said that they were uninsured because they were dropped from their parents insurance coverage. As a way to increase health insurance coverage among young adults, Minnesota is considering two coverage expansion options. First, we are considering the option of outreach campaigns on the value of health insurance, focused on young adults. Second, we are examining the option of requiring the extension of parental health insurance coverage to age 24 for all young adults regardless of college enrollment. Some regions of the state also experience higher uninsurance rates than others, and coverage options included in this report have been designed to increase insurance coverage in these areas of the state. In general, rural areas of Minnesota have higher uninsurance rates than urban areas of the state. Rural areas tend to have more self-employed and seasonally employed people who find it more difficult to get affordable health insurance coverage. Our research reports that farmers and migrant workers in rural Minnesota have a hard time finding affordable health insurance coverage and either do not qualify for public programs or do not want to enroll in public programs because they are skeptical of receiving governmental assistance. One coverage expansion option that the state is considering as a way to increase health insurance coverage is to examine and potentially adjust eligibility and asset requirements under the MinnesotaCare program that may limit the enrollment of farm families, migrant workers, and other seasonally employed workers in rural Minnesota. In addition, the state is examining ways in which to provide subsidies for those wishing to purchase coverage in the private market. Another coverage expansion effort under consideration is to provide subsidies for low-income people to purchase private health insurance coverage. This option is targeted at increasing health insurance coverage among 3 main groups of low-income workers: workers who are self-employed; workers who do not have access to employer-based health insurance and who do not want to enroll in a public health insurance program; and low-income workers who have access to employer-based coverage, are ineligible for public health insurance programs, but do not enroll in private coverage because they cannot afford to pay the employee s share of the premium. Under this option, the state would consider subsidies for lowincome people to purchase private coverage; the subsidy could be used to purchase coverage in the individual market, or it could be used to pay for the employee s share of an employer policy. Reforms in the individual market may also be considered to make this coverage more affordable or available to people who do not have the option to enroll in employer-based coverage. This option is intended to help 20
Fact Sheet. Health Insurance Coverage in Minnesota, Early Results from the 2009 Minnesota Health Access Survey. February, 2010
 Fact Sheet February, 2010 Health Insurance Coverage in Minnesota, Early Results from the 2009 Minnesota Health Access Survey The Minnesota Department of Health and the University of Minnesota School of
Fact Sheet March, 2012
 Fact Sheet March, 2012 Health Insurance Coverage in Minnesota, The Minnesota Department of Health and the University of Minnesota School of Public Health conduct statewide population surveys to study trends
Report to the Secretary. Health Resources and Services Administration State Planning Grants Program. State of Minnesota Department of Health
 Report to the Secretary Health Resources and Services Administration State Planning Grants Program State of Minnesota Department of Health November 24, 2004 Table of Contents Executive Summary ii A. Update
Montana State Planning Grant A Big Sky Opportunity to Expand Health Insurance Coverage. Interim Report
 Montana State Planning Grant A Big Sky Opportunity to Expand Health Insurance Coverage Interim Report Submitted to Health Resources and Services Administration (HRSA) U.S. Department of Health and Human
Findings from Focus Groups: Select Populations in Dane County
 W ISCONSIN STATE PLANNING GRANT Briefing Paper 3, September 2001 Findings from Focus Groups: Select Populations in Dane County Wisconsin is one of 20 states that received a grant in 2000-01 from the Health
Minnesota's Uninsured in 2017: Rates and Characteristics
 HEALTH ECONOMICS PROGRAM Minnesota's Uninsured in 2017: Rates and Characteristics FEBRUARY 2018 As noted in the companion issue brief to this analysis, Minnesota s uninsurance rate climbed significantly
Fact Sheet. Health Insurance Coverage in Minnesota, 2001 vs February Changes in Health Insurance Coverage and Uninsurance
 Fact Sheet February 2006 Health Insurance Coverage in Minnesota, 2001 vs. 2004 This fact sheet provides a summary of final estimates of health insurance coverage gathered from the 2001 and 2004 Minnesota
Understanding Health Insurance Transitions and Public Health Insurance Coverage in Minnesota
 Understanding Health Insurance Transitions and Public Health Insurance Coverage in Minnesota JUNE 2017 There are a number of primary pathways to getting health insurance coverage in the United States:
Appendix Table 1: Rate of Uninsurance by Select Demographics (2015 to 2017)
") Appendix Table 1: Rate of Uninsurance by Select Demographics (2015 to 2017) Appendix Table 1: Rate of Uninsurance by Uninsurance Rate Select Demographics (2015 to 2017) 2015 2017 Statewide 4.3% 6.3% *
Appendix Table 1: Rate of Uninsurance by Select Demographics (2015 to 2017) Appendix Table 1: Rate of Uninsurance by Uninsurance Rate Select Demographics (2015 to 2017) 2015 2017 Statewide 4.3% 6.3% *
Results from the 2009 Virgin Islands Health Insurance Survey
 2009 Report to: Bureau of Economic Research Office of the Governor St. Thomas, US Virgin Islands Ph 340.714.1700 Prepared by: State Health Access Data Assistance Center University of Minnesota School of
Health Economics Program
 Health Economics Program Issue Brief November, 2010 Distribution of Health Insurance Coverage in Minnesota, 2008 The Health Economics Program of the Minnesota Department of Health monitors the Minnesota
kaiser medicaid commission on and the uninsured How Will Health Reform Impact Young Adults? By Karyn Schwartz and Tanya Schwartz Executive Summary
 I S S U E P A P E R kaiser commission on medicaid and the uninsured How Will Health Reform Impact Young Adults? By Karyn Schwartz and Tanya Schwartz Executive Summary May 2010 The health reform law that
Minnesota Health Care Spending Trends,
 Minnesota Health Care Spending Trends, 1993-2000 April 2003 h ealth e conomics p rogram Health Policy and Systems Compliance Division Minnesota Department of Health Minnesota Health Care Spending Trends,
Vermont Department of Financial Regulation Insurance Division 2014 Vermont Household Health Insurance Survey Initial Findings
 Vermont Department of Financial Regulation Insurance Division 2014 Vermont Household Health Insurance Survey Initial Findings Brian Robertson, Ph.D. Mark Noyes Acknowledgements: The Department of Financial
MEMORANDUM. Gloria Macdonald, Jennifer Benedict Nevada Division of Health Care Financing and Policy (DHCFP)
") MEMORANDUM To: From: Re: Gloria Macdonald, Jennifer Benedict Nevada Division of Health Care Financing and Policy (DHCFP) Bob Carey, Public Consulting Group (PCG) An Overview of the in the State of Nevada
MEMORANDUM To: From: Re: Gloria Macdonald, Jennifer Benedict Nevada Division of Health Care Financing and Policy (DHCFP) Bob Carey, Public Consulting Group (PCG) An Overview of the in the State of Nevada
Children s Disenrollment from MaineCare: A Survey of Disenrolled Families. Erika C. Ziller, M.S. Stephenie L. Loux, M.S. May 2003
 Children s Disenrollment from MaineCare: A Survey of Disenrolled Families Erika C. Ziller, M.S. Stephenie L. Loux, M.S. May 2003 Children s Disenrollment from MaineCare: A Survey of Disenrolled Families
Who Remains Uninsured in Colorado and Why?
 COLORADO HEALTH ACCESS SURVEY SURVEY SNAPSHOT Who Remains Uninsured in Colorado and Why? OCTOBER 2016 Colorado s insured rate is at an all-time high. More than 93 percent of Coloradans had health insurance
The Uninsured at the Starting Line
 REPORT The Uninsured at the Starting Line February 2014 Findings from the 2013 Kaiser Survey of Low-Income Americans and the ACA PREPARED BY Rachel Garfield, Rachel Licata, and Katherine Young The Uninsured
Employer-Sponsored Health Insurance in the Minnesota Long-Term Care Industry:
 Minnesota Department of Health Employer-Sponsored Health Insurance in the Minnesota Long-Term Care Industry: Status of Coverage and Policy Options Report to the Minnesota Legislature January, 2002 Health
Massachusetts Household Survey on Health Insurance Status, 2007
 Massachusetts Household Survey on Health Insurance Status, 2007 Division of Health Care Finance and Policy Executive Office of Health and Human Services Massachusetts Household Survey Methodology Administered
Audience Profile Individual
 Audience Profile Individual Current Demographics/Landscape [Total Minnesota population: 5.3 million] Uninsured 1 53.8% Male 30.1% * 101 200% FPL 46.2% Female 25.1% * 201 300% FPL 31.7% Age 35 54 24.1%
FREQUENTLY ASKED QUESTIONS ABOUT FREE AND REDUCED PRICE SCHOOL MEALS
 FREQUENTLY ASKED QUESTIONS ABOUT FREE AND REDUCED PRICE SCHOOL MEALS Dear Parent/Guardian: Children need healthy meals to learn. Mariemont City School District offers healthy meals every school day. Lunch
Highlights from the 2004 Florida Health Insurance Study Telephone Survey
 Highlights from the 2004 Florida Health Insurance Study Telephone Survey In 1998, the Florida legislature created the Florida Health Insurance Study (FHIS) to provide reliable estimates of the percentage
Household Survey and Employer Survey Findings about Health Insurance Coverage in Montana
 Final Report Household Survey and Employer Survey Findings about Health Insurance Coverage in Montana February 2004 Steve Seninger, Ph.D., Principal Investigator Director of Economic Analysis Bureau of
Free and Reduced Price Meal Application Packet
 St Catharine School Cafeteria 614.235-3593 2018-2019 Free and Reduced Price Meal Application Packet Page 2-3 Frequently Asked Questions about Free & Reduced Price School Meals Page 4-5 Instructions for
The Uninsured in Texas
 H E A L T H P O L I C Y C E N T E R Funded by The Uninsured in Texas Statewide and Local Area Views Matthew Buettgens, Linda J. Blumberg, and Clare Pan December 2018 The number of insured people in the
Health Insurance Coverage in Oklahoma: 2008
 Health Insurance Coverage in Oklahoma: 2008 Results from the Oklahoma Health Care Insurance and Access Survey July 2009 The Oklahoma Health Care Authority (OHCA) contracted with the State Health Access
Palm Beach County Augmentation to the 2004 Florida Health Insurance Study
 to the 2004 Florida Health Insurance Study Final Report November 2004 Prepared by: University of Florida Department of Health Services Research, Management and Policy P.O. Box 100195, Gainesville, FL 32610
THE MISSOURI FOUNDATION FOR HEALTH. Presentation of Findings from a Survey of 800 Likely Voters in Missouri May 10-14, 2007
 THE MISSOURI FOUNDATION FOR HEALTH Presentation of Findings from a Survey of 800 Likely Voters in Missouri May 10-14, 2007 Survey Methodology Lake Research Partners designed and administered this survey,
ESPRI Hempstead- needs assessment survey
 ESPRI Hempstead- needs assessment survey February 14, 2018 ESPRI HEMPSTEAD- NEEDS ASSESSMENT SURVEY - FEBRUARY 14, 2018 1 Contents I. Introduction.....2 II. Executive Summary... 3 III. Methodology... 4
Member Research Update
 Member Research Update AUDREY MORSE GASTEIER Director of Policy and Outreach MARISSA WOLTMANN Associate Director of Policy and ACA Implementation Board of Directors Meeting, October 13, 2016 Overview Today
Hamilton Local School District. Parent/Guardian:
 Hamilton Local School District J. Michael Meade, Director of Operations Hamilton Local School District Columbus, OH 43207 Phone: 614.491.8044 x 1236 Fax: 614.491.8323 Parent/Guardian: www.hamiltonrangers.org
Colorado s Eligible but Not Enrolled Population Continues to Decline Another Drop During Second Year of ACA
 Colorado s but Not Enrolled Population Continues to Decline Another Drop During Second Year of ACA APRIL 2017 The number of uninsured Coloradans who did not enroll in Medicaid or Child Health Plan Plus
FREE AND REDUCED PRICE SCHOOL MEALS APPLICATION FORMS INSTRUCTIONS FOR SCHOOL DISTRICTS SCHOOL YEAR This packet contains:
 This packet contains: FREE AND REDUCED PRICE SCHOOL MEALS APPLICATION FORMS SCHOOL YEAR 2018-2019 INSTRUCTIONS FOR SCHOOL DISTRICTS Required information that must be provided to households: Letter to Households
FREE AND REDUCED APPLICATION for SCHOOL MEALS
 DELAWARE CITY SCHOOLS 2016-2017 FREE AND REDUCED APPLICATION for SCHOOL MEALS Please complete the School Meals Application form. Those who are eligible for school meal benefits will also qualify for a
A PARTNERSHIP OF THE KAISER FAMILY FOUNDATION AND THE NEWSHOUR WITH JIM LEHRER. The NewsHour with Jim Lehrer/Kaiser Family Foundation.
 HEALTH DESK A PARTNERSHIP OF THE KAISER FAMILY FOUNDATION AND THE NEWSHOUR WITH JIM LEHRER Highlights and Chartpack The NewsHour with Jim Lehrer/Kaiser Family Foundation National Survey on the Uninsured
THE COMMONWEALTH FUND SURVEY OF HEALTH CARE IN NEW YORK CITY
 THE COMMONWEALTH FUND SURVEY OF HEALTH CARE IN NEW YORK CITY David Sandman, Cathy Schoen, Catherine Des Roches, and Meron Makonnen MARCH 1998 THE COMMONWEALTH FUND The Commonwealth Fund is a philanthropic
Health Insurance Coverage in the District of Columbia
 Health Insurance Coverage in the District of Columbia Estimates from the 2009 DC Health Insurance Survey The Urban Institute April 2010 Julie Hudman, PhD Director Department of Health Care Finance Linda
KNOX COUNTY CAREER CENTER FREQUENTLY ASKED QUESTIONS ABOUT FREE AND REDUCED PRICE SCHOOL MEALS
 KNOX COUNTY CAREER CENTER FREQUENTLY ASKED QUESTIONS ABOUT FREE AND REDUCED PRICE SCHOOL MEALS Dear Parent/Guardian: Children need healthy meals to learn. Knox County Career Center offers healthy meals
Massachusetts Application for Free and Reduced Price School Meals
 Grade STEP 1 2016-2017 Massachusetts Application for Free and Reduced Price School Meals If you have received a Notice of Direct Certification from the school district for free meals, do not complete this
FEDERAL ELIGIBILITY INCOME CHART For School Year
 2018-2019 School Year Dear Parent/Guardian: Children need healthy meals to learn. Glennallen School offers healthy meals every school day. Lunch costs are: Grades K-5 at $4.00, Grades 6-12 at $4.25 and
Dear Parent/Guardian:
 Dear Parent/Guardian: Children need healthy meals to learn. Bradford Exempted Village School District offers healthy meals every school day. Breakfast costs Elementary -$1.75 & MS/HS- $1.85; lunch costs
Profile of Ohio s Medicaid-Enrolled Adults and Those who are Potentially Eligible
 Thalia Farietta, MS 1 Rachel Tumin, PhD 1 May 24, 2016 1 Ohio Colleges of Medicine Government Resource Center EXECUTIVE SUMMARY The primary objective of this chartbook is to describe the population of
FREQUENTLY ASKED QUESTIONS ABOUT FREE AND REDUCED PRICE SCHOOL MEALS
 ATTENTION: If you have received by mail, a green notice of Direct Certification for free meals, DO NOT COMPLETE THIS APPLICATION but contact the school if any children in the household were not listed
ASSESSING THE RESULTS
 HEALTH REFORM IN MASSACHUSETTS EXPANDING TO HEALTH INSURANCE ASSESSING THE RESULTS May 2012 Health Reform in Massachusetts, Expanding Access to Health Insurance Coverage: Assessing the Results pulls together
NORTH DAKOTA HEALTH INSURANCE STUDY STATE PLANNING GRANT INITIATIVE
 NORTH DAKOTA HEALTH INSURANCE STUDY STATE PLANNING GRANT INITIATIVE FINAL REPORT INCLUDING ACTIVITIES IN THE THIRD YEAR OF FUNDING Funded through a HRSA State Planning Grant SUBMITTED TO THE U.S. SECRETARY
FREQUENTLY ASKED QUESTIONS ABOUT FREE AND REDUCED PRICE SCHOOL MEALS
 FREQUENTLY ASKED QUESTIONS ABOUT FREE AND REDUCED PRICE SCHOOL MEALS Dear Parent/Guardian: Children need healthy meals to learn. The Copley-Fairlawn City School District offers healthy meals every school
FREQUENTLY ASKED QUESTIONS ABOUT FREE AND REDUCED PRICE SCHOOL MEALS
 FREQUENTLY ASKED QUESTIONS ABOUT FREE AND REDUCED PRICE SCHOOL MEALS Dear Parent/Guardian: Children need healthy meals to learn. TCTC offers healthy meals every school day. Breakfast costs $1.50; lunch
MinnesotaCare: Key Trends & Challenges
 MinnesotaCare: Key Trends & Challenges Julie Sonier In 1992, Minnesota enacted a sweeping health care reform bill to improve access to and affordability of health insurance coverage, with the goal of reaching
HEALTH INSURANCE COVERAGE IN MAINE
 HEALTH INSURANCE COVERAGE IN MAINE 2004 2005 By Allison Cook, Dawn Miller, and Stephen Zuckerman Commissioned by the maine health access foundation MAY 2007 Strategic solutions for Maine s health care
Volunteer Income Tax Assistance
 Volunteer Income Tax Assistance The VITA Program provides free tax preparation services to low income residents of Winnebago County Tax Services Provided in Calendar Year 2016 1 Site Coordinators Sue Panek
2005 Health Confidence Survey Wave VIII
 2005 Health Confidence Survey Wave VIII June 30 August 6, 2005 Hello, my name is [FIRST AND LAST NAME]. I am calling from National Research, a research firm in Washington, D.C. May I speak to the youngest
ACA Coverage Expansions and Low-Income Workers
 ACA Coverage Expansions and Low-Income Workers Alanna Williamson, Larisa Antonisse, Jennifer Tolbert, Rachel Garfield, and Anthony Damico This brief highlights low-income workers and the impact of ACA
BAY VILLAGE CITY SCHOOLS 377 DOVER CENTER RD. BAY VILLAGE, OH (440) FAX (440)
 FAX (440)") BAY VILLAGE CITY SCHOOLS 377 DOVER CENTER RD. BAY VILLAGE, OH 44140 (440)617-7300 FAX (440)617-7301 Dear Parent/Guardian: Children need healthy meals to learn. Bay Village Schools offers healthy meals
BAY VILLAGE CITY SCHOOLS 377 DOVER CENTER RD. BAY VILLAGE, OH 44140 (440)617-7300 FAX (440)617-7301 Dear Parent/Guardian: Children need healthy meals to learn. Bay Village Schools offers healthy meals
BROOKLYN CITY SCHOOLS 2018/2019
 BROOKLYN CITY SCHOOLS 2018/2019 FREQUENTLY ASKED QUE STIONS ABOUT FREE AND REDUCED PRICE SCHOOL MEALS Dear Parent/Guardian: Children need healthy meals to learn. Brooklyn City School District offers healthy
Health Insurance Coverage for Hispanic/Latino Children: 1996 to 2005
 1 Health Insurance Coverage for Hispanic/Latino Children: 1996 to 2005 Alissa Van Wie Division of Health Policy and Management School of Public Health University of Minnesota Submitted on May 20, 2007
Introduction. My name is. I am calling from the University of Montana in Missoula on behalf of the State of Montana.
 Introduction My name is. I am calling from the University of Montana in Missoula on behalf of the State of Montana. We're calling households across the state to see how well people are accessing health
The Uninsured at the Starting Line in Missouri
 REPORT The Uninsured at the Starting Line in Missouri April 2014 Missouri findings from the 2013 Kaiser Survey of Low-Income Americans and the ACA Prepared by: Rachel Licata and Rachel Garfield Kaiser
Health Insurance Coverage of Children in Iowa. Results from the Iowa Child and Family Household Health Survey. Fifth report in a series
 Health Policy 5-1-2004 Health Insurance Coverage of Children in Iowa. Results from the Iowa Child and Family Household Health Survey. Fifth report in a series Peter C. Damiano University of Iowa Jean C.
HEALTH COVERAGE AMONG YEAR-OLDS in 2003
 HEALTH COVERAGE AMONG 50-64 YEAR-OLDS in 2003 The aging of the population focuses attention on how those in midlife get health insurance. Because medical problems and health costs commonly increase with
FREQUENTLY ASKED QUESTIONS ABOUT FREE AND REDUCED PRICE SCHOOL MEALS
 FREQUENTLY ASKED QUESTIONS ABOUT FREE AND REDUCED PRICE SCHOOL MEALS Dear Parent/Guardian: Children need healthy meals to learn. Medford Township School District offers healthy meals every school day.
Randall Chun, Legislative Analyst Updated: December MinnesotaCare
 INFORMATION BRIEF Research Department Minnesota House of Representatives 600 State Office Building St. Paul, MN 55155 Randall Chun, Legislative Analyst Updated: December 2017 MinnesotaCare MinnesotaCare
Profile of Minnesota s Uninsured
 Putting Out the Welcome Mat: Targeting Outreach Under the Affordable Care Act Profile of Minnesota s Uninsured Jessie Kemmick Pintor, MPH MN Health Services Research Conference March 5 th, 2013 Funded
Issue Brief. Does Medicaid Make a Difference? The COMMONWEALTH FUND. Findings from the Commonwealth Fund Biennial Health Insurance Survey, 2014
 Issue Brief JUNE 2015 The COMMONWEALTH FUND Does Medicaid Make a Difference? Findings from the Commonwealth Fund Biennial Health Insurance Survey, 2014 The mission of The Commonwealth Fund is to promote
2003 Alabama Health Care Insurance and Access Survey: Select Results
 2003 Alabama Health Care Insurance and Access Survey: Select Results Funded by the 2002 HRSA State Planning Grant Report to: Alabama Department of Public Health Alabama Department of Public Health 201
FREQUENTLY ASKED QUESTIONS ABOUT FREE AND REDUCED PRICE SCHOOL MEALS
 FREQUENTLY ASKED QUESTIONS ABOUT FREE AND REDUCED PRICE SCHOOL MEALS Dear Parent/Guardian: Children need healthy meals to learn. Hilliard City Schools offers healthy meals every school day. Breakfast costs
One Quarter Of Public Reports Having Problems Paying Medical Bills, Majority Have Delayed Care Due To Cost. Relied on home remedies or over thecounter
 PUBLIC OPINION HEALTH SECURITY WATCH June 2012 The May Health Tracking Poll finds that many Americans continue to report problems paying medical bills and are taking specific actions to limit personal
Issue Brief. Sources of Health Insurance and Characteristics of the Uninsured: Analysis of the March 2007 Current Population Survey. No.
 Issue Brief Sources of Health Insurance and Characteristics of the Uninsured: Analysis of the March 2007 Current Population Survey By Paul Fronstin, EBRI No. 310 October 2007 This Issue Brief provides
FREE/REDUCED LUNCH PACKET
 FREE/REDUCED LUNCH PACKET CHILD S NAME ( PLEASE PRINT ) PLEASE FILL OUT ONE APPLICATION PER FAMILY. You DO NOT have to fill out more than one application. If you have already completed an application,
DO NOT WRITE BELOW THIS LINE FOR SCHOOL USE ONLY
 Date Withdrew Attachment Va F R D 2018-2019 Application for Free and Reduced Price School Meals/Milk To apply for free and reduced price meals for your children, read the instructions on the back, complete
CHART BOOK: A PROFILE OF HEALTH COVERAGE FOR MISSISSIPPI CHILDREN
 CHART BOOK: A PROFILE OF HEALTH COVERAGE FOR MISSISSIPPI CHILDREN June 2018 Overview UNINSURED ADULTS Mississippi County-Level Data UPDATE PUBLISHED JULY 2017 Researchers from the State Health Access Data
Child s First Name MI Child s Last Name Grade
 2017-2018 Prototype Household Application for Free and Reduced Price School Meals Complete one application per household. Please use a pen (not a pencil). Apply online: on Infinite Campus STEP 1 Definition
Reynoldsburg City Schools Free and Reduced Price School Meals
 Reynoldsburg City Schools Free and Reduced Price School Meals Dear Parent/Guardian: Children need healthy meals to learn. Reynoldsburg City Schools offers healthy meals every school day. Breakfast costs
1. Do I need to fill out a Meal Benefit Form for each of my children in child care? only
 18 Dear Parent/Guardian: This letter is intended for parents or guardians of children enrolled in a child care center. This child care center offers healthy meals to all enrolled children as part of our
JAMES A GARFIELD LOCAL SCHOOL DISTRICT- 2018/2019 APPLICATION
 JAMES A GARFIELD LOCAL SCHOOL DISTRICT- 2018/2019 APPLICATION Dear Parent/Guardian: Children need healthy meals to learn. James A Garfield Local SD offers healthy meals every school day. Breakfast costs
AMERICA AT HOME SURVEY American Attitudes on Homeownership, the Home-Buying Process, and the Impact of Student Loan Debt
 AMERICA AT HOME SURVEY 2017 American Attitudes on Homeownership, the Home-Buying Process, and the Impact of Student Loan Debt 1 Objective and Methodology Objective The purpose of the survey was to understand
Health Insurance Status of Massachusetts Residents
 Massachusetts Division of Health Care Finance and Policy Health Insurance Status of Massachusetts Residents Fifth Edition December 2006 Amy M. Lischko, Commissioner Mitt Romney, Governor Commonwealth of
FREQUENTLY ASKED QUESTIONS ABOUT FREE AND REDUCED PRICE SCHOOL MEALS
 FREQUENTLY ASKED QUESTIONS ABOUT FREE AND REDUCED PRICE SCHOOL MEALS Dear Parent/Guardian: Children need healthy meals to learn. Fairborn City Schools offers healthy meals every school day. Elementary
Although several factors determine whether and how women use health
 CHAPTER 3: WOMEN AND HEALTH INSURANCE COVERAGE Although several factors determine whether and how women use health care services, the importance of health coverage as a critical resource in promoting access
Voices of 50+ Hispanics in Arizona: Dreams & Challenges
 2011 Voices of 50+ Hispanics in Arizona: Dreams & Challenges Executive Summary AARP has a strong commitment to help improve the lives of the 50+ population. As part of the Association s continuous communication
MAJORITIES OF CALIFORNIANS SUPPORT THE NATION S NEW HEALTH CARE LAW, BUT THINK MORE HEALTH CARE SYSTEM CHANGES ARE NEEDED.
 THE FIELD POLL THE INDEPENDENT AND NON-PARTISAN SURVEY OF PUBLIC OPINION ESTABLISHED IN 1947 AS THE CALIFORNIA POLL BY MERVIN FIELD Field Research Corporation 601 California Street, Suite 900 San Francisco,
FREQUENTLY ASKED QUESTIONS ABOUT FREE AND REDUCED-PRICE SCHOOL MEALS. FEDERAL ELIGIBILITY INCOME CHART for School Year: 2019
 FREQUENTLY ASKED QUESTIONS ABOUT FREE AND REDUCED-PRICE SCHOOL MEALS Dear Parent/Guardian: Children need healthy meals to learn Crescent Public Schools offers healthy meals every school day. Breakfast
FREQUENTLY ASKED QUESTIONS ABOUT FREE AND REDUCED-PRICE SCHOOL MEALS. FEDERAL ELIGIBILITY INCOME CHART for School Year: 2018
 FREQUENTLY ASKED QUESTIONS ABOUT FREE AND REDUCED-PRICE SCHOOL MEALS Dear Parent/Guardian: Children need healthy meals to learn. Name of School/School District offers healthy meals every school day. Breakfast
Household Application for Free and Reduced Price School Meals Complete one application per household. Please use a pen (not a pencil).
.") 2017-2018 Household Application for Free and Reduced Price School Meals Complete one application per household. Please use a pen (not a pencil). Apply online: STEP 1 List ALL Household Members who are
2017-2018 Household Application for Free and Reduced Price School Meals Complete one application per household. Please use a pen (not a pencil). Apply online: STEP 1 List ALL Household Members who are
Estimates of Children and Parents without Health Insurance in New Jersey: Report to the NJ FamilyCare Outreach, Enrollment, and Retention Work Group
 The Institute for Health, Health Care Policy and Aging Research Estimates of Children and Parents without Health Insurance in New Jersey: Report to the NJ FamilyCare Outreach, Enrollment, and Retention
Voices of African Americans 50+ in New York: Dreams & Challenges
 2011 Voices of African Americans 50+ in New York: Dreams & Challenges Executive Summary AARP has a strong commitment to help improve the lives of the 50+ population. As part of the Association s continuous
FREE AND REDUCED PRICE SCHOOL MEALS APPLICATION FORMS INSTRUCTIONS FOR SCHOOL DISTRICTS SCHOOL YEAR This packet contains:
 This packet contains: FREE AND REDUCED PRICE SCHOOL MEALS APPLICATION FORMS SCHOOL YEAR 2018-2019 INSTRUCTIONS FOR SCHOOL DISTRICTS Required information that must be provided to households: Letter to Households
Our school provides healthy meals each day. Breakfast costs $1.50; lunch costs $2.50 (k-8), $2.75 (9-12)
, $2.75 (9-12)") Pacelli Catholic Schools Dear Parent/Guardian: Our school provides healthy meals each day. Breakfast costs $1.50; lunch costs $2.50 (k-8), $2.75 (9-12) Your children may qualify for free or reduced-price
Pacelli Catholic Schools Dear Parent/Guardian: Our school provides healthy meals each day. Breakfast costs $1.50; lunch costs $2.50 (k-8), $2.75 (9-12) Your children may qualify for free or reduced-price
Sincerely, Yours for Children, Inc.
 303-313 Washington St. Auburn, MA 01501 1-800-222-2731 Fax 508-721-0919 E-mail: yfci@yoursforchildren.com Dear Parent/Guardian: This letter is intended for parents or guardians of children enrolled at
HEALTH INSURANCE COVERAGE AMONG WORKERS AND THEIR DEPENDENTS IN NEW YORK,
 HEALTH INSURANCE COVERAGE AMONG WORKERS AND THEIR DEPENDENTS IN NEW YORK, 2001 2002 UNITED HOSPITAL FUND Danielle Holahan Elise Hubert URBAN INSTITUTE John Holahan Linda Blumberg HEALTH INSURANCE COVERAGE
U.S. Senate Finance Committee Coverage Policy Options Detailed Section by Section Summary May 18, 2009
 U.S. Senate Finance Committee Coverage Policy Options Detailed Section by Section Summary May 18, 2009 This document outlines the 61-page report, Expanding Health Care Coverage: Proposals to Provide Affordable
Racial/Ethnic Disparities Related to Health Insurance Coverage, Access to Care and Ease in Health Care Services among Children in 2012 CCHAPS Data
 118 Racial/Ethnic Disparities Related to Health Insurance Coverage, Access to Care and Ease in Journal of Health Disparities Research and Practice Volume 8, Issue 1, Spring 2015, pp. 118-127 2011 Center
Table 1. Underinsured Indicators Among Adults Ages Insured All Year, 2003, 2005, 2010, 2012, 2014, 2016
 How Well Does Insurance Coverage Protect Consumers from Health Care Costs? Tables 1 The following tables are supplemental to a Commonwealth Fund issue brief, S. R. Collins, M. Z. Gunja, and M. M. Doty,
Elementary Middle High Elementary Middle High N/A N/A N/A N/A N/A
 Dear Parent/Guardian: Children need healthy meals to learn. The RINGWOOD BOARD OF ED offers healthy meals every school day at the prices listed below. Your children may qualify for free meals or for reduced
Health Coverage by Race and Ethnicity: Examining Changes Under the ACA and the Remaining Uninsured
 November 2016 Issue Brief Health Coverage by Race and Ethnicity: Examining Changes Under the ACA and the Remaining Uninsured Samantha Artiga, Petry Ubri, Julia Foutz, and Anthony Damico Executive Summary
Issue Brief June, 2009
 This document is made available electronically by the Minnesota Legislative Reference Library as part of an ongoing digital archiving project. http://www.leg.state.mn.us/lrl/lrl.asp Health Economics Program
FREQUENTLY ASKED QUESTIONS ABOUT FREE AND REDUCED PRICE SCHOOL MEALS. Dear Parent/Guardian: May 21, 2018
 GALENA CITY SCHOOL DISTRICT Sidney Huntington School and Galena Interior Learning Academy School Year 2018-2019 LETTER TO HOUSEHOLDS FOR APPLICATIONS FOR FREE AND REDUCED PRICE MEALS FREQUENTLY ASKED QUESTIONS
FREQUENTLY ASKED QUESTIONS ABOUT FREE AND REDUCED-PRICE SCHOOL MEALS. FEDERAL ELIGIBILITY INCOME CHART for School Year: 2017
 FREQUENTLY ASKED QUESTIONS ABOUT FREE AND REDUCED-PRICE SCHOOL MEALS Dear Parent/Guardian: Children need healthy meals to learn. Marietta Public School offers healthy meals every school day. Breakfast
***IMPORTANT*** FREE & REDUCED PRICE MEALS APPLICATION INSTRUCTIONS
 ***IMPORTANT*** FREE & REDUCED PRICE MEALS APPLICATION INSTRUCTIONS 2018-2019 There is no need for you to complete this application if you have already received a letter from us stating that your child(ren)
Dear Parent/Guardian:
 303-313 Washington St. Auburn, MA 01501 1-800-222-2731 Fax 508-721-0919 E-mail: yfci@yoursforchildren.com Dear Parent/Guardian: Young children need healthy meals to learn. This letter is intended for parents