EUROLINK Osiguruvanje A.D., Skopje
|
|
|
- Andrea Dawson
- 5 years ago
- Views:
Transcription

1 Financial Statements and Independent Auditors Report EUROLINK Osiguruvanje A.D., Skopje 31 December 2016 This is an English translation of the original Report issued in Macedonian, in case of any discrepancies between the English and Macedonian version the Macedonian text shall prevail.
2 EUROLINK Osiguruvanje A.D., Skopje C O N T E N T S Independent Auditors Report 1 Statement of financial position (Balance sheet) 3 Statement of Comprehensive Income (Income Statement) 9 Statement of Cash Flows 13 Statement of Changes in Equity 15 Notes to the financial statements 17
3
4
5 3 Financial Statements 31 December 2016 Statement of financial position (Balance sheet) As of In Denars Description No. of Item Notes Current year Amount Previous year ASSETS A. INTANGIBLE ASSETS ( ) ,823,150 2,493, Goodwill Other intangible assets 003 1,823,150 2,493,158 B. INVESTMENTS ( ) ,093, ,100,268 I. LAND, BUILDINGS AND OTHER TANGIBLE ASSETS ( ) Land and buildings used for Company s operations ( ) Land Buildings Land, buildings and other assets not used for Company s operations ( ) Land Buildings Other tangible assets II. FINANCIAL INVESTMENTS IN COMPANIES IN A GROUP SUBSIDIARIES, ASSOCIATES AND JOINT CONTROLLED ENTITIES ( ) 1. Shares, equity interests and other equity instruments of value in companies in a group subsidiaries 2. Debt securities issued by companies in a group subsidiaries and loans to companies in a group - subsidiaries 3. Shares, equity interests and other equity instruments in associates ,122,999 17,353, Debt securities issued by associates and loans to associates Other financial investments in companies in a group subsidiaries Other financial investments in associates Investments in joint controlled entities ,122,999 17,353,339 III. OTHER FINANCIAL INVESTMENTS ( ) ,970, ,746, FINANCIAL INVESTMENTS HELD TO MATURITY ( ) ,495, ,408, Debt securities with maturity up to one year ,917, , Debt securities with maturity over one year ,578, ,584,230 See accompanying notes to the financial statements
6 4 Financial Statements 31 December 2016 Statement of financial position (Balance sheet) (continued) In Denars Amount Description No. of Item Notes Current year Previous year Financial investments available-for-sale ( ) ,371, ,035, Debt securities with maturity up to one year Debt securities with maturity over one year Shares, equity interests and other equity instruments ,062,628 5,866, Shares and equity interests in investment funds ,308, ,169, Financial investments for trading ( ) Debt securities with maturity up to one year Debt securities with maturity over one year Shares, equity interests and other equity instruments Shares and equity interests in investment funds Deposits, loans and other placements ( ) ,102, ,302, Given deposits ,102, ,300, Loans secured with mortgages Other loans 038-2, Other placements Derivative financial instruments IV. DEPOSITS OF REINSURANCE COMPANIES AT CEDENTS, BASED ON REINSURANCE CONTRACTS C. PART FOR CO-INSURANCE AND REINSURANCE IN GROSS TECHNICAL PROVISIONS ( ) 1. Part for co-insurance and reinsurance in gross unearned premium reserve 2. Part for co-insurance and reinsurance in gross mathematical reserve ,876, ,699, ,144, ,410, Part for co-insurance and reinsurance in gross claims reserve ,731,615 14,289, Part for co-insurance and reinsurance in gross reserves for bonuses and discounts Part for co-insurance and reinsurance in gross equalization reserve Part for co-insurance and reinsurance in other gross technical provisions Part for co-insurance and reinsurance in gross technical provisions for life insurance where the insurer takes over the 049 investment risk - - D. FINANCIAL INVESTMENTS WHERE THE INSURER TAKES OVER THE INVESTMENT RISK (INSURANCE CONTRACTS) See accompanying notes to the financial statements
7 5 Financial Statements 31 December 2016 Statement of financial position (Balance sheet) (continued) In Denars Amount Description No. of Item Notes Current year Previous year E. DEFERRRED AND CURRENT TAX ASSETS ( ) Deferred tax assets Current tax assets F. RECEIVABLES ( ) ,561, ,578,298 I. RECEIVABLES FROM DIRECT INSURANCE WORKS ( ) ,894, ,893, Receivables from insurers ,894, ,893, Receivables from agents Other receivables from direct insurance works II. RECEIVABLES FROM DIRECT CO-INSURANCE AND REINSURANCE WORKS ( ) 059 1,701, Receivables from co-insurance and reinsurance premium Receivables from participation in claims fees from coinsurance and reinsurance 061 1,701, Other receivables from co-insurance and reinsurance works III. OTHER RECEIVABLES ( ) ,965,411 13,685, Other receivables from direct insurance works ,199,590 8,340, Receivables from financial investments 065 5,659,139 4,351, Other receivables 066 1,106, ,176 IV. RECEIVABLES BASED ON UNSUBSCRIBED BUT NOT PAID IN CAPITAL G. OTHER ASSETS ( ) ,372,714 30,933,178 I. TANGIBLE ASSETS USED FOR OPERATIONS (OTHER THAN LAND AND BUILDINGS) ( ) ,915,557 13,198, Equipment ,075,765 12,979, Other tangible assets , ,165 II. CASH AND OTHER CASH EQUIVALENTS ( ) ,457,157 17,734, Cash in banks ,190,726 17,503, Cash on hand , , Restricted cash to cover mathematical reserves Other cash and cash equivalents III. INVENTORIES AND SMALL INVENTORY See accompanying notes to the financial statements
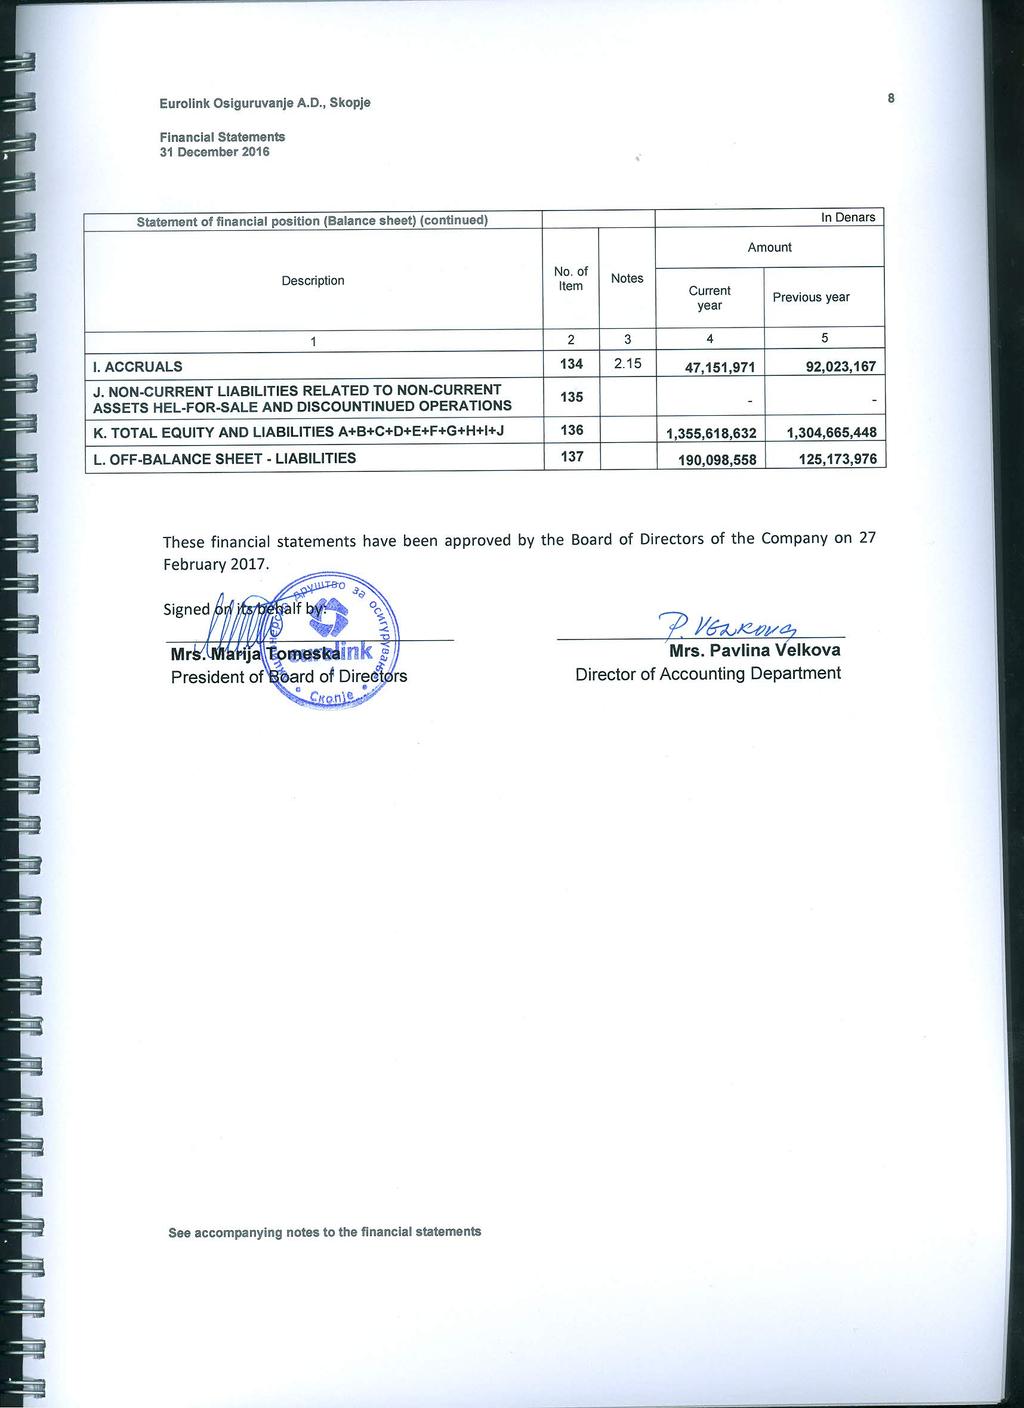
8 6 Financial Statements 31 December 2016 Statement of financial position (Balance sheet) (continued) In Denars Amount Description No. of Item Notes Current year Previous year H. PREPAIDS ( ) ,891, ,860, Accrued income based on interest and rents Deferred acquisition costs ,613,091 92,900, Other accrued income and deferred expenses ,278,407 12,960,992 I. NON-CURRENT ASSETS HELD FOR SALE AND DISCOUNTINUED OPERATIONS J. TOTAL ASSETS (A+B+C+D+E+F+G+H+I) 083 1,355,618,632 1,304,665,448 K. OFF-BALANCE SHEET ASSETS ,098, ,173,976 LIABILITIES А. EQUITY AND RESERVES ( ) ,068, ,704,069 I. SUBSCRIBED CAPITAL ( ) ,326, ,326, Subscribed capital from ordinary shares ,326, ,326, Subscribed capital from preference shares Subscribed and non-paid-in capital II. PREMIUMS ON SHARES ISSUED III. REVALUATION RESERVES ( ) ,753,861 (1,019,049) 1. Tangible assets Financial investments 093 3,753,861 (1,019,049) 3. Other revaluation reserves IV. RESERVES ( ) ,500, ,081, Legal reserves ,500, ,081, Statutory reserves Reserves for treasury shares Purchase of treasury shares Other reserves V. RETAINED EARNINGS, NET ,896,896 50,060,153 VI. LOSSES CARRIED FORWARD VII. PROFIT FOR THE CURRENT ACCOUNTING PERIOD ,591,172 49,255,114 VIII. LOSS FOR THE CURRENT ACCOUNTING PERIOD See accompanying notes to the financial statements
9 7 Financial Statements 31 December 2016 Statement of financial position (Balance sheet) (continued) In Denars Amount Description No. of Item Notes Current year Previous year B. SUBORDINATED LIABILITIES C. GROSS TECHNICAL PROVISIONS ( ) ,327, ,298,230 I. Gross unearned premium reserves ,005, ,370,419 II. Gross mathematical reserve III. Gross claim s reserve ,285, ,679,443 IV. Gross reserves for bonuses and discounts ,036,667 24,248,368 V. Gross equalization reserve VI. Gross other technical provisions D. GROSS TECHNICAL PROVISIONS RELATED TO CONTRACTS WHERE THE INSURER TAKES OVER THE INVESTMENT RISK E. OTHER RESERVES ( ) Reserves for employees Other reserves F. DEFERRED AND CURRENT TAX LIABILITIES ( ) ,864,862 3,916, Deferred tax liabilities Current tax liabilities 119 4,864,862 3,916,449 G. LIABILITIES ARAISING FROM DEPOSITS OF COMPANIES FOR REINSURANCE AT CEDENTS, BASED ON INSURANCE 120 CONTRACTS - - H. LIABILITIES ( ) ,206,110 43,723,533 I. LIABILITIES FROM DIRECT INSURANCE WORKS ( ) 122 3,247,300 1,788, Liabilities to insurers 123 3,240,300 1,666, Liabilities to agents Other liabilities from direct insurance works 125 7, ,149 II. LIABILITIES FROM CO-INSURANCE AND REINSURANCE WORKS ( ) ,040,154 8,239, Liabilities based on co-insurance and reinsurance premiums ,040,154 8,239, Liabilities based on participation in coverage of claims Other liabilities from co-insurance and reinsurance works III. OTHER LIABILITIES ( ) ,918,656 33,695, Other liabilities from direct insurance works ,792,712 13,334, Liabilities from financial investments Other liabilities ,125,944 20,360, See accompanying notes to the financial statements
10
11 9 Financial Statements 31 December 2016 Statement of Comprehensive Income (Income Statement) Description For the year then ended on No. of Item Notes Current year Amount In Denars Previous year А. REVENUES FROM OPERATIONS ( a ) ,707, ,028,421 I. EARNED PREMIUM (NET PREMIUM INCOME) ( ) ,211, ,781, Gross policy insurance premium ,595, ,743, Gross policy co-insurance premium Gross policy reinsurance/ retrocession premium Gross policy premium delivered in co-insurance Gross policy premium delivered in reinsurance/retrocession ,483, ,246, Change in gross unearned premium reserves 207 3,634,908 91,077, Change in gross unearned premium reserves part for co-insurance Change in gross unearned premium reserves part for reinsurance 209 (36,265,171) 63,361,849 II. INCOME FROM INVESTMENTS ( ) ,746,853 31,127, Income from subsidiaries, associates and joint controlled entities 2. Income from investments in land and buildings ( ) Income from rents Income from increasing the value of land and buildings Income from sale of land and buildings Interest income ,812,518 27,263, Foreign exchange gains , , Value adjustments (unrealized gains, reduction at fair value) 6. Realised gains from sale of financial assets-capital gains ( ) , , Financial investments available-for-sale , , Financial investments for trading (at fair value) Other financial investments Other income from investments 223 3,382,809 2,870,723 See accompanying notes to the financial statements
12 10 Financial Statements 31 December 2016 Statement of comprehensive income (Income statement) (continued) In Denars Description No. of Item Notes Current year Amount Previous year III. INCOME FROM REINSURANCE PROVISIONS 223а ,277,398 23,333,915 IV. OTHER INSURANCE TECHNICAL INCOME, LESS FOR REINSURANCE ,727,384 7,189,832 V. OTHER INCOME ,744,191 4,595,722 B. EXPENSES FROM OPERATIONS ( ) ,870, ,956,948 I. CLAIMS INCURRED (Claims expenses, net) ( ) ,105, ,656, Gross paid claims ,711, ,231, Income decrease from gross realized subrogation receivables ,539,455 8,321, Gross paid claims part for co-insurance Gross paid claims part for reinsurance/retrocession ,230,053 72,920, Changes in gross claim s reserve ,606,101 (33,593,546) 6. Changes in gross claim s reserve part for co-insurance Changes in gross claim s reserve part for reinsurance ,442,420 (43,259,731) II. CHANGES IN OTHER TECHNICAL PROVISIONS, NET OF REINSURANCE ( ) 1. Changes in mathematical reserve, net of reinsurance ( ) (211,701) 2,394, Changes in gross mathematical reserve Changes in gross mathematical reserve part for coinsurance/reinsurance 2. Changes in equalization reserve, net of reinsurance ( ) Changes in gross equalization reserve Changes in gross equalization reserve part for coinsurance/ reinsurance 3. Changes in other technical provisions, net of reinsurance ( ) (211,701) 2,394, Changes in other gross technical provisions 243 (211,701) 2,394, Changes in other gross technical provisions part for co-insurance and reinsurance III. CHANGES IN GROSS MATHEMATICAL RESERVE FOR LIFE INSURANCE WHERE THE INSURER TAKES OVER THE INVESTMENT RISK, NET OF REINSURANCE ( ) Changes in gross mathematical reserve for life insurance where the insurer takes over the investment risk 2. Changes in gross mathematical reserve for life insurance where the insurer takes over the investment risk part for coinsurance and reinsurance See accompanying notes to the financial statements
13 11 Financial Statements 31 December 2016 Statement of comprehensive income (Income statement) (continued) In Denars Description No. of Item Notes Current year Amount Previous year IV. EXPENSES FOR BONUSES AND DISCOUNTS, NET OF REINSURANCE ( ) ,104,750 30,676, Expenses for bonuses (related to result) 249 5,940,654 6,737, Expenses for discounts (not related to result) ,164,096 23,939,468 V. NET EXPENSES FOR INSURANCE IMPLEMENTATION ( ) ,423, ,192, Acquisition costs ( a ) ,595, ,545, Fees ,126,987 37,827, Gross salaries for employees in the internal sales network 253а 75,681,631 64,934, Other acquisition costs ,499,550 18,143, Change in Deferred acquisition costs (+/-) 255 (14,713,090) (8,361,148) 2. Administration expenses ( ) ,828, ,647, Depreciation of tangible and intangible assets that serve in ordinary course of operations 257 5,778,994 5,187, Costs for employees (258а+258б+258в+258г+258д) ,005,249 51,185, Salaries and compensations 258а 32,647,297 32,642, Expenses for taxes on salaries and compensations 258б 3,099,498 3,070, Contributions for mandatory social insurance 258в 12,691,758 13,061, Costs for additional pension insurance for employees 258г Other costs for employees 258д 2,566,696 2,410, Charges for services of individuals who perform no operations (contracts, copyright agreements and other legal 259 relations) all fees included 11,278,474 7,927, Other administration expenses (260а+260б+260в) ,765, ,346, Costs for services 260а 73,119,382 66,919, Operating costs 260б 6,235,407 7,123, Costs for reservations and other operating costs 260в 53,410,763 38,303,904 VI. EXPENSES FROM INVESTMENTS ( ) , , Depreciation and value adjustments of tangible assets not used for operations See accompanying notes to the financial statements Interest expenses 263 2,232 6, Foreign exchange losses , , Impairment provision(unrealized losses, reduction at fair value) 5. Realised losses from sale of financial assets-capital loss ( ) Financial investments available-for-sale
14 12 Financial Statements 31 December 2016 Statement of comprehensive income (Income statement) (continued) In Denars Description No. of Item Notes Current year Amount Previous year Financial investments for trading (at fair value) Other financial investments Other expenses from investments VII. OTHER INSURANCE TECHNICAL EXPENSES, LESS REINSURANCE ( ) ,449,377 33,937, Expenses for prevention Other insurance technical expenses, less for reinsurance ,449,377 33,937,195 VIII. VALUE ADJUSTMENTS OF RECEIVABLES BASED ON PREMIUM ,660,290 (1,884,719) IX. OTHER EXPENSES, INCLUDING VALUE ADJUSTMENTS ,197,048 3,853,114 X. PROFIT FOR THE YEAR BEFORE TAXATION ( ) ,836,675 60,071,473 XI. LOSS FOR THE YEAR BEFORE TAXATION ( ) XII. INCOME TAX (EXPENSE) ,245,503 10,816,359 XIII. DEFERRED TAX XIV. PROFIT FOR THE YEAR AFTER TAXATION ( ) ,591,172 49,255,114 XV. LOSS FOR THE YEAR AFTER TAXATION ( ) XVI. OTHER COMPREHENSIVE INCOME / (LOSS) 4,772,910 (1,637,460) Changes at fair value of financial assets available-for-sale 4,772,910 (1,637,460) Income tax on components from other comprehensive income - - INCOME / (LOSS) ATTRIBUTED TO THE SHAREHOLDERS 52,364,082 47,617,654 See accompanying notes to the financial statements
15 13 Financial Statements 31 December 2016 Statement of Cash Flows Description A. CASH FLOWS FROM OPERATING ACTIVITIES For the period from to Amount In Denars No. of Item Current year Previous year I. CASH INFLOWS FROM OPERATING ACTIVITIES ( ) ,118, ,774, Insurance and co-insurance premiums and advances received 2. Reinsurance and retrocession premium 3. Inflows from participation in coverage of claims 4. Interest received from insurance works ,079, ,799, (137,683,222) (266,625,273) Other inflows from operating activities 305 (15,277,705) (8,399,413) II. CASH OUTFLOWS FROM OPERATING ACTIVITIES ( ) ,215, ,965, Paid claims, agreed insurance amounts, participation in coverage of claims from co-insurance and advances given ,712, ,733, Paid claims and participation in coverage of claims from reinsurance and retrocession 308 (28,528,684) (72,920,477) 3. Co-insurance, reinsurance and retrocession premiums 4. Fees and other personal expenses 5. Other expenses for insurance works 6. Interests paid 7. Income tax and other charges 8. Other outflows from regular activities ,232 6, ,066,474 14,575, ,962, ,570,590 III. CASH INFLOW FROM OPERATING ACTIVITIES, NET ( ) ,903,496 45,808,873 IV. CASH OUTFLOWS FROM OPERATING ACTIVITIES, NET ( ) B. CASH FLOWS FROM INVESTING ACTIVITIES I. CASH INFLOWS FROM INVESTING ACTIVITIES ( ) ,419,593 80,316, Inflows from intangible assets 2. Inflows from tangible assets , , Inflows from tangible assets not used for Company s operations 4. Inflows from investments in the companies in a group: subsidiaries, associates and joint controlled entities 5. Inflows from investments held-to-maturity 6. Inflows from other financial placements 7. Dividends received and other participation in income 8. Interest received ,559, ,120 58, ,504,463 26,699,453 See accompanying notes to the financial statements
16 14 Financial Statements 31 December 2016 Statement of cash flows (continued) DESCRIPTION In Denars Amount No. of Item Current year Previous year II. CASH OUTFLOWS FROM INVESTING ACTIVITIES ( ) ,600, Outflows from intangible assets , Outflows from tangible assets 328-2,200, Outflows from tangible assets not used for Company s operations Outflows from investments in the companies in a group: subsidiaries, associates and joint controlled entities Outflows from investments held-to-maturity , Outflows from other financial placements ,933,511 98,649, Outflows from dividends and other participation in income Outflows from interests 334 III. CASH INFLOW FROM INVESTING ACTIVITIES, NET ( ) 335 IV. CASH OUTFLOWS FROM INVESTING ACTIVITIES, NET ( ) C. CASH FLOWS FROM FINANCING ACTIVITIES ,180,958 21,452,929 I. CASH INFLOWS FROM FINANCING ACTIVITIES ( ) Inflows from increase of share capital Inflows from received long-term and short-term credits and loans Inflows from other long-term and short-term liabilities 340 II. CASH OUTFLOWS FROM FINANCING ACTIVITIES ( ) 1. Outflows from repayment of long-term and short-term credits and loans and other liabilities ,000,000 20,000, Outflows from purchase of treasury shares Outflows from dividends paid ,000,000 20,000,000 III. CASH INFLOWS FROM FINANCING ACTIVITIES, NET ( ) 345 IV. CASH OUTFLOWS FROM FINANCING ACTIVITIES, NET ( ) ,000,000 20,000,000 D. TOTAL CASH INFLOWS ( ) ,538, ,091,647 E. TOTAL CASH OUTFLOWS ( ) ,815, ,735,703 F. CASH INFLOWS, NET ( ) 349-4,355,944 G. CASH OUTFLOWS, NET ( ) ,462 - H. CASH AND CASH EQUIVALENTS AT THE BEGINNING OF THE ACCOUNTING PERIOD I. EFFECT ROM CHANGE IN FOREIGN EHXCHANGE CURRENCY IN CASH AND CASH EQUIVALENTS J. CASH AND CASH EQUIVALENTS AT THE END OF THE ACCOUNTING PERIOD ( ) ,734,619 13,378, ,457,157 17,734,619 See accompanying notes to the financial statements
17 15 Financial statements 31 December 2016 Statement of Changes in Equity In Denars Share capital Premiums from issued shares Legal reserves Statutory reserves Reserves Reserves of treasury shares Other reserves Total reserves Purchase of treasury shares Revaluated reserves Retained earnings (with + sign) or transferred losses (with - sign) Profit (with + sign)/loss (with - sign) for the current year Total equity and reserves As of 01 January ,326, ,055, ,055, ,411 46,007,574 36,078, ,086,415 Changes in accounting policies Adjustments in the previous period As of 01 January 2015 adjusted 195,326, ,055, ,055, ,411 46,007,574 36,078, ,086,415 Profit or loss for ,255,114 49,255,114 Profit or loss for ,255,114 49,255,114 Non-owners changes in equity (1,637,460) - - (1,637,460) Unrealised profit/loss from tangible assets Unrealised profit/loss from financial investments availablefor-sale (1,637,460) - - (1,637,460) Realised profit/loss from financial investments availablefor-sale Other non-owners changes in equity Transactions with owners ,026, ,026, ,052,579 (36,078,868) (20,000,000) Increase / Decrease of share capital Other payments made by owners Dividends paid (20,000,000) (20,000,000) Other allocation to owners ,026, ,026, ,052,579 (16,078,868) - As of ,326, ,081, ,081,771 - (1,019,049) 50,060,153 49,255, ,704,069 See accompanying notes to the financial statements
18 16 Financial statements 31 December 2016 Statement of changes in equity (continued) In Denars Во денари Share capital Premiums from issued shares Legal reserves Statutory reserves Reserves Reserves of treasury shares Other reserves Total reserves Purchase of treasury shares Revaluated reserves Retained earnings (with + sign) or transferred losses (with - sign) Profit (with + sign)/loss (with - sign) for the current year Total equity and reserves Changes in accounting policies 195,326, ,081, ,081,771 - (1,019,049) 50,060,153 49,255, ,704,069 Adjustments in the previous period As of 01 January As of 01 January 2016 adjusted 195,326, ,081, ,081,771 - (1,019,049) 50,060,153 49,255, ,704,069 Profit or loss for ,591,172 47,591,172 Profit or loss for ,591,172 47,591,172 Non-owners changes in equity ,772, ,772,910 Unrealised profit/loss from tangible assets Unrealised profit/loss from financial investments availablefor-sale ,772, ,772,910 Realised profit/loss from financial investments availablefor-sale Other non-owners changes in equity Transactions with owners ,418, ,418, ,836,743 (49,255,114) (28,000,000) Increase / Decrease of share capital Other payments made by owners Dividends paid (28,000,000) (28,000,000) Other allocation to owners ,418, ,418, ,836,743 (21,255,114) - As of ,326, ,500, ,500,142-3,753,861 54,896,896 47,591, ,068,151 See accompanying notes to the financial statements
19 17 Notes to the financial statements 1. General information and disclosures 1.1 General information EUROLINK Osiguruvanje AD Skopje ( the Company ) is Shareholders Company incorporated and domiciled in the Republic of Macedonia. The address of the Company s registered office is as follows: Nikola Kljusev No Skopje The Republic of Macedonia The Company is 100% subsidiary of GOFI - GROUP OF FINANCE AND INVESTMENT SA. Switzerland, foreign legal entity registered in Switzerland. The Company is licensed to perform 18 classes of non-life insurance. The Company performs its activities on the territory of the Republic of Macedonia and as of 31 December 2016 employs 217 employees (2015: 202 employees). 1.2 Applied accounting policies and valuation techniques Accounting policies The principal accounting policies adopted in the preparation of these financial statements are set out below. The determination of the Company s accounting policies is based on acknowledged, familiar and practical experiences of the provisions of the Law on Insurance Supervision, International financial reporting standards in accordance with the Rulebook for accounting 1, the Rulebook on the methods of evaluation of items on the balance sheet and preparation of financial statements as well as internal rulebooks of the Company. Basis for preparation The Company maintains its accounting records and prepares its financial statements in accordance with the Law on Trade Companies, Law on Insurance Supervision and by laws prescribed by the Insurance Supervision Agency of the Republic of Macedonia. The financial statements have been prepared as of and for the years that ended on the 31 December 2016 and The basic accounting policies used in the preparation of the financial statements are presented below. These policies are consistently applied to all years presented, unless otherwise stated. 1 This Rulebook comprise International Financial Reporting Standards (IFRS), International Accounting Standards (IAS) and Interpretations together with all documents issued by International Accounting Standards Board as of 1 January 2009.
20 18 As of and for the year then ended on 31 December 2016 Applied accounting policies and valuation techniques (continued) Basis of preparation (continued) Current and comparative data stated in these financial statements are expressed in Denar thousand. The Company s reporting and functional currency is Macedonian Denar (MKD). Where necessary, the previous year presentations have been adjusted to conform to the changes in the current year Use of estimates and judgements The preparation of financial statement requires the Company to make judgements, estimates and assumptions that affect the application of policies and reported amounts of assets and liabilities, income and expenses. The estimates and associated assumptions are based on historical experience and various other factors that are believed to be reasonable under the circumstances, the results of which form the basis of making the judgements about carrying values of assets and liabilities that are not readily apparent from other sources. Actual results may differ from these estimates. The estimates and underlying assumptions are reviewed on an on-going basis. Revisions to accounting estimates are recognised in the period in which the estimate is revised if the revision affects only that period, or in the future periods, if the revision affects the future periods. Judgement made by the Management that have significant effect on the financial statements and estimates with a significant risk of material adjustment in the next year are disclosed in Note Foreign currency transactions Transactions denominated in foreign currencies have been translated into Denar at rates set by the National Bank of the Republic of Macedonia on the date when occurred. Assets and liabilities denominated in foreign currencies are translated at the Statement of financial position date using official rates of exchange prevailing on that date, and any foreign exchange gains or losses, resulting from foreign currency translation, are included in the Statement of comprehensive income in the period in which they occurred. The middle exchange rates used for conversion of the Statement of financial position items denominated in foreign currencies are as follows: MKD MKD 1 EUR USD GBP CHF
21 19 As of and for the year then ended on 31 December 2016 Applied accounting policies and valuation techniques (continued) Intangible assets Intangible assets that refer to acquired software by the Company are measured at cost less accumulated amortisation and accumulated impairment losses if such exists. Subsequent expenditures are capitalised only when an inflow of future economic benefits for the Company are probable and when the cost of the asset can be measured reliably. All other expenditure is expensed in profit and loss as incurred. Amortisation Amortisation of intangible assets is calculated on a straight-line basis over the estimated useful lives of intangible assets from the date that they are available for use, so as to write-off the cost of the asset. Annual amortisation rate according to the estimated useful lives, for the current and previous period for the software is 25% Property and equipment Recognition and measurement Property and equipment are measured at cost less accumulated depreciation and accumulated impairment losses. Cost includes expenditures that are directly attributable to the acquisition of the asset. When parts of an item of property or equipment have different useful lives, they are accounted for as separate items (major components) of property and equipment. Gains and losses on disposal of an item of property and equipment are determined by comparing the proceeds from disposal with the carrying amount of property and equipment and are recognised net within other operating income in profit or loss. Subsequent costs The cost of replacing part of an item of property and equipment is recognised in the carrying amount of the item if it is probable that the future economic benefits embodied within the part will flow to the Company and its cost can be measured reliably. The carrying amount of the replaced part is derecognised. The costs of the day-to-day servicing of property and equipment are recognised in current profit or loss as incurred. Depreciation Depreciation of property and equipment is calculated on a straight-line basis over the estimated useful lives of an asset, so as to write-off the cost of the asset. Leased assets are depreciated over the shorter of the lease term and their useful lives unless it is reasonably certain that the Company will obtain ownership by the end of the lease term. Depreciation rates, based on the estimated useful lives, for the current and comparative periods are as follows: Computers 25 % Furniture,equipment,vehicles and other assets % Depreciation methods, useful lives and residual values are reviewed at each reporting date.
22 20 As of and for the year then ended on 31 December 2016 Applied accounting policies and valuation techniques (continued) Impairment of non-financial assets The carrying amount of the Company s non-financial assets, are assessed at Statement of financial position date to determine whether there is any indication of impairment. If such indication exists, the asset s recoverable amount is estimated. An impairment loss is recognised if the carrying amount of an asset or its cash-generating unit exceeds its recoverable amount. A cash-generating unit is the smallest identifiable asset group that generates cash flows that are largely independent from other assets and groups. Impairment losses are recognised in profit or loss. Impairment losses recognised in respect of cash-generating units are allocated to reduce the carrying amount of the assets in the unit (group of units) on a pro rata basis. The recoverable amount of an asset or cash-generating unit is the greater of its value in use and its fair value less costs to sell. In assessing value in use, the estimated future cash flows are discounted to their net present value using a pre-tax discount rate that reflects current market assessments of the time value of money and the risks specific to the asset. Impairment losses recognised in prior periods are assessed at each reporting date for any indications that the loss has decreased or no longer exists. An impairment loss is reversed if there has been a change in the estimates used to determine the recoverable amount. An impairment loss is reversed only to the extent that the asset s carrying amount does not exceed the carrying amount that would have been determined, net of amortisation, if no impairment loss had been recognised Financial instruments Classification of financial assets Financial instruments are classified into four categories, depending on the purpose for which the assets were acquired, the categories are as follows: Financial instruments at fair value through profit or loss are financial instruments which are acquired principally for the purpose of trading or, which, on initial recognition are designated by the Company at fair value through profit or loss. The Company has no financial assets classified under this category. Held to maturity investments are non-derivative financial instruments with fixed payments and fixed maturity that the Company has the positive intention and ability to hold to maturity. As of 31 December 2016 and 2015, the Company classifies the government bonds and bills as financial assets held to maturity. Loans and receivables are non-derivative financial instruments with fixed payments that are not quoted in an active market, other than those that the Company intends to sell in the near term, those that the Company upon initial recognition designates at fair value through profit or loss, or available for sale, or those where the Company may not recover its initial investment, other than because of credit deterioration. As of 31 December 2016 and 2015 the Company classifies cash and cash equivalents, receivables from insurers and other receivables from direct works, time deposits in domestic banks, assets from reinsurance and investments in joint controlled entities as loans and receivables. Available-for-sale financial instruments are non-derivative financial instruments that are either designated in this category or are not classified in any of the other categories. As of 31 December 2016 and 2015, the Company classifies its investments in shares and stakes in investment funds as financial assets available-for-sale.
23 21 As of and for the year then ended on 31 December 2016 Applied accounting policies and valuation techniques (continued) Financial instruments (continued) Classification, initial recognition and subsequent mesurement of financial liabilities Financial liabilities are classified in accordance with the agreed engagement. Financial liabilities at amortized cost consist of reinsurance and insurance liabilities, finance lease liabilities and other liabilities. They are stated at fair value net of transaction costs and subsequently measured at amortized cost using the effective interest method. Financial lease liabilities are initially recorded at their fair value. Subsequently finance lease liabilities are measured at their amortized cost using the effective interest rate method. Initial recognition The Company initially recognises loans and receivables and deposits on the date that they are originated. All other financial assets and liabilities are initially recognised on the trade date at which the Company becomes a party to the contractual provisions of the instrument. All financial assets, except financial assets at fair value through profit and loss, are initially measured at fair value plus transaction costs that are directly attributable to their acquisition. Derecognition The Company derecognises a financial asset when the contractual rights to the cash flows from the asset expire, or it transfers the rights to receive the contractual cash flows on the financial asset in a transaction in which substantially all the risks and rewards of ownership of the financial asset are transferred. Any interest in transferred financial asset that is created or retained by the Company is recognised as a separate asset or liability. The Company derecognizes a financial liability when its contractual obligations are discharged or cancelled or expired. Off-setting Financial assets and liabilities are offset and the net amount is reported in the Balance Sheet only when the Company has a legally enforceable right to offset the recognised amounts and there is an intention to settle on a net basis, or realise the asset and settle the liability simultaneously. Income and expenses are presented on a net basis only when permitted by the accounting standards or for gains and losses arising from a group of similar transactions, such as in the Company s trading activity. Subsequent measurement of financial assets After initial recognition, the Company measures financial assets designated as available-forsale, at fair values without any deduction for transaction costs it may incur on their sale. The fair value of quoted financial assets is their bid prices at the day of the Statement of Financial Position.
24 22 As of and for the year then ended on 31 December 2016 Applied accounting policies and valuation techniques (continued) Financial instruments (continued) If the market on which the financial asset is quoted is not active, the Company establishes fair values by using a valuation technique. Valuation techniques include the use of recent arm s length market transactions between familiarized parties if available, references to the current fair value of another instrument that is substantially the same, discounted cash flow analysis and optional pricing models. If the value of equity instruments cannot be reliably measured, they are measured at cost. Held to maturity investments and loans and receivables are measured at amortised cost using the effective interest method, less impairment losses. Unrealised gains and losses arising from changes in the fair value of available-for-sale financial assets are recognised in comprehensive income, except for impairment losses, that are recognised in the profit or loss for the period. When available-for-sale financial assets are sold or impaired, the cumulative gains or losses previously recognised in comprehensive income are recognised in the profit or loss. Where available-for-sale financial assets are interest bearing, interest calculated using the effective interest method is recognised in profit or loss Impairment of financial assets Assets carried at amortized cost The Company regularly performs evaluation of the items of balance sheet (Statement of financial position) according the Rulebook on the methods of evaluation of balance sheet and preparation of financial statements, Law on Trade Companies and according the Rulebook on chart of accounts. The Company classifies its receivables based on insurance premiums, subrogation receivables and other receivables depending on the period of delays in payment in liability settlement by the debtor, as of the date of maturity of the receivable and other receivables. Based on this classification, the Company determines adequate impairment provision- Special reserve of receivables in the following manner: Group of receivables Period of delays in payment in debtors liability settlement Impairment provision (in % of total value of individual receivable) A Up to 30 days 0% B 31 to 60 days 10%-30% C 61 to 120 days 31%-50% D 121 to 270 days 51%-70% E 271 to 365 days 71%-90% F more than 365 days 100% For receivables from legal entities, for which bankruptcy procedure is acknowledged, the Company recognise impairment provision of 100%, as well as for those insurance agreements (policies) where the agreed maturity period is determined after the expiration of the agreement.
25 23 As of and for the year then ended on 31 December 2016 Applied accounting policies and valuation techniques (continued) Impairement of financial assets (continued) Assets carried at fair value The Company assesses at each date of the Statement of financial position, whether there is objective evidence that a financial asset is impaired. Significant or prolonged decline in the fair value of the financial asset below its cost is considered as objective evidence in determining whether the assets are impaired. If any such evidence exists for financial assets available for sale, the cumulative loss measured as the difference between the acquisition cost and the current fair value is recognized in the current profits and losses. If, in a subsequent period, the fair value of a debt instrument classified as available for sale increases and the increase can be objectively related to an event occurring after the impairment loss was recognized in current profits or loss, the impairment loss is reversed through profits and losses. For impared available-for-sale equity securities any subsequent increase in the fair value is not canceled in the profit and loss but recognised in other comprehensive income Cash and cash equivalents Cash and cash equivalents comprise cash in hand and call deposits which are subject to insignificant risk of changes in their fair value. Cash and cash equivalents are carried at amortised cost in the Balance Sheet Employee benefits Defined contribution plans The Company pays contributions to the pension funds as prescribed by the national legislation. Contributions, based on salaries, are made to the national organizations responsible for the payment of pensions. There is no additional liability in respect of these plans. Obligations for contributions to defined contribution pension plans are recognised as an expense in the profit or loss. Short-term employee benefits Short-term employee benefit obligations are measured on an undiscounted basis and are expensed as the related service is provided. The Company recognises liability and expense for the amount expected to be paid under cash bonus or profit-sharing plans if the Company has a present legal or constructive obligation to pay this amount as a result of past service provided by the employee and the obligation can be estimated reliably.
26 24 As of and for the year then ended on 31 December 2016 Applied accounting policies and valuation techniques (continued) Current and deferred tax expense The current tax expense at a rate of 10% is calculated on the profit for the period determined as the difference between total revenues and total expenditures increased by non-deductible expenses for tax purposes, corrected for tax credit and understated revenues. The tax base is reduced by the amount of income from dividends realized through participation in the capital of another taxpayer - resident of the Republic of Macedonia, provided that they are taxed at the taxpayer who pays dividend. Taxpayers who carry out payments on accumulated gains realized in the period from 2009 to 2013 for dividends and other distributions of profits are obliged to calculate and pay income tax. Deferred tax expenses is provided in full, using the liability method, on temporary differences arising between the tax bases of assets and liabilities and their carrying values for financial reporting purposes. The tax rates that are currently valid are used in determination of deferred tax expense. Deferred tax expense is recognized in the statement of comprehensive income except when it relates to items charged or credited directly to equity, in which case the deferred tax is also dealt with in equity. Deferred tax assets are recognized to the extent that it is probable that future taxable profit will be available against which the temporary differences can be utilized Lease The determination of whether an arrangement is, or contains a lease is based on the substance of the arrangement in regard to whether the fulfilment of the arrangement is dependent on the use of a specific asset or assets or the arrangement conveys a right to use the asset. Company as a lessee Finance leases, which transfers to the Company substantially all the risks and benefits incidental to ownership of the leased item, are capitalized at the inception of the lease at the fair value of the leased vehicles/equipment subject of lease or, if lower, at the present value of the minimum lease payments. Lease payments are apportioned between the finance charges and reduction of the lease liability so as to achieve a constant rate of interest on the remaining balance of the liability. Finance charges are charged directly against income. Leased assets are depreciated over the shorter of the estimated useful life of the asset or the lease term, if there is no reasonable certainty that the Company will obtain ownership by the end of the lease term. Payments of the operating leasing are recognized as an expense in the current profit and loss on a straight-line basis over the lease term Provisions A provision is recognised in the Statement of financial position when the Company has a present legal or constructive obligation as a result of a past event that can be reasonably measured, and it is probable that an outflow will be required to settle the obligation. The Company does not determine provisions using discount rate before taxation.
27 25 As of and for the year then ended on 31 December 2016 Applied accounting policies and valuation techniques (continued) Shareholders capital, reserves and dividends payment Ordinary shares Ordinary shares are classified as equity. Repurchase of treasury shares When the Company purchase treasury shares, the amount of the consideration paid, including directly attributable costs is recognised as a change in equity. Repurchased shares are classified as treasury shares and presented as a deduction from total equity. When treasury shares are sold or reissued subsequently the amount received is recognised as an increase on equity, and the resulting surplus or deficit of the transaction is transferred to/from share premium. The Company has no realized purchase of treasury shares. Reserves Reserves which consist of revalorization reserves and statutory reserves are created throughout the periods based on losses/gains from revalorization of financial assets available-for-sale, in the case of revalorization reserves as well as by allocation of the retained earnings on the basis of the legislation and the decisions of the Management and the Company s Shareholders. Dividends Dividends are recognised as a liability in the period in which they are declared Revenues Earned premiums from insurance contracts Gross policy premiums reflects the operations during the year and do not include taxes based on premiums. Investment income Investment income comprises interest and dividend income, net gains on financial assets classified as fair value through profit and loss, and realised gains on financial assets classified as available-for-sale. Fee and commission income Fee and commission income represents income from reinsurers based on the reinsurance contracts with sliding scale and agreed commission, as commission based on deciding service claims. Fee and commissions income is recognized when the related service is performed.
28 26 As of and for the year then ended on 31 December 2016 Applied accounting policies and valuation techniques (continued) Expenses Expenses for subscribed premiums Expenses for subscribed premiums consist of direct and indirect expenses from signed insurance contracts such as fees for agents, brokers and other distributive channels, as well as other expenses included in the sales. Rent expenses Payments based on rents are recognised as expenses to profit and loss using the straight - line method during the rent period. Received discounts are recognised to profit and loss as integral part of the total rent expenses. Finance expenses Finance expenses consist of finance expenses for financial lease and profit and loss for foreign exchange differences of monetary assets and liabilities in foreign currencies Classification of insurance contracts Contracts under which the Company accepts significant insurance risk from another party (the policyholder) by agreeing to compensate the policyholder if a specified uncertain future event occur (the insured event) are classified as insurance contracts. Insurance risk is risk other than financial risk. Financial risk is the risk of a possible future change in one or more of a specified interest rate, security price, commodity price, foreign exchange rate, index of prices or rates, credit rating or credit index or other variable which changes, in the case of a non-financial variable when the variable is not specific to a party of the contract. Insurance contracts may also transfer some financial risk. Once a contract is classified as an insurance contract it remains classified as an insurance contract until all rights and obligations are extinguished or expired Insurance contracts General insurance contracts Premiums Gross premiums written reflect the operations during the year, and exclude any taxes or duties based on premiums. Earned proportion of premiums is recognised as revenue. Premiums are earned from the date of concluding the insurance contract until the reporting period, based on the pro rata temporis model. Outward reinsurance premiums are recognised as an expense in accordance with pro rata temporis method in the same accounting period as the premiums for the related direct insurance business. Unearned premium reserve Unearned premium reserve comprises the proportion of gross premiums written which is estimated to be earned in the following financial year, calculated separately for each insurance contract using the daily pro rata method. For insurance contracts for which the amount of insurance coverage (risk) is increasing or decreasing linearly for the duration of the contract, the unearned premium reserve may be calculated separately for each separate contract with different method than the pro-rata method. The Company uses only the pro-rata method for calculation of the unearned premium reserves for each separate insurance contract.
29 27 As of and for the year then ended on 31 December 2016 Applied accounting policies and valuation techniques (continued) Insurance contracts (continued) Claims Claims incurred comprise the settlement and handling costs of paid claims arising from events covered with the insurance agreements, expenses for claims provisions and the compensation from reinsurers based on their participation in outstanding claims and provisions for incurred and reported claims. Paid claims are recorded in the moment of processing the claims and are recognized in the amount to be paid to settle the claims. Claims paid are increased by claims settlement and handling costs. Reserves for reported and non-reported incurred claims include reserves for claims that are allocated in the amount of estimated liabilities that the Company is obligated to pay, based on insurance contracts where the insured event occurred by the end of the accounting period, no matter whether it has been reported by the end of the accounting period. Reserves for outstanding claims are not discounted. Anticipated reinsurance recoveries based on the participation of resolved claims and participation in reserves in incurred and reported claims as presented separately as assets. Fees from reinsurers and other fees are assessed on the same way as reported claims. The Company anticipate participation in reinsurance incurred reserves but non-reported claims and they are not expressed as assets in the balances. The management consider that the gross claims provision and the related reinsurance recoveries are fairly stated on the basis of the information currently available to them. However, the ultimate liability will vary as a result of subsequent information and events and may result in adjustments to the amounts reserved. Adjustments to the amounts of claims provisions established in prior years are reflected in the financial statements for the period in which the adjustments are made, and disclosed separately if material. The methods used, and the estimates made, are reviewed regularly. Reinsurance assets Re-insurance premiums are recognised as expenses in accordance with the basis for premiums recognition from related contracts with the insurer. For the basic insurance business, re-insurance premiums are recognised as expenses during the period covered by the re-insurance in accordance with the expected behaviour of the re-insured risk. The Company for property insurance, third party liability insurance and green card insurance has secured general contract for re-insurance such as XOL (disproportionate contracts for reinsurance such as excess claims contracts). For accident insurance, the Company has provided Treaty proportional reinsurance contract for a limited number of clients. Furthermore, for larger clients/risks, the Company provides re-insurance contracts where the risk is fully ceded. Premium reserve part of the re-insurance This type of reserve consists of part of the premium transferred to re-insurance recognised as deferred expense in the next year, calculated for each re-insurance contract separately, using the pro-rata method.
30 28 As of and for the year then ended on 31 December 2016 Applied accounting policies and valuation techniques (continued) Insurance contracts (continued) Deferred acquisition costs Expenses incurred during signing of the general insurance contracts, which are deferred, include direct expenses such as fees and indirect expenses such as administrative cost related to the offers processing and policy issuance. With general re-insurance contracts the deferred acquisition cost are proportional to the expenses for written premiums corresponding to the gross policy premium not earned as of Balance sheet date. Liability adequacy test Liability adequacy tests for unearned premiums reserves are performed in order to determine whether the unearned premiums reserves from the insurance contracts are enough for liability settlement in the next accounting period arising from expected future claims and future claims expenses. The lack is recognised to profit and loss for the current year. During the calculation the assumption of unchanged development of claims in the following accounting period is used. Receivables and liabilities from the insurance The amounts due to and due from insurers, agents and other receivables represent financial instruments and are included in receivables and liabilities from insurance and not in insurance contracts reserves Related party transactions In accordance with the Law on insurance supervision related parties are considered two or more legal entities or individuals that are mutually connected in one of the following manners: a) by management or capital, or in any other manner, when they mutually determine their business policy or work in coordination with each other in order to ensure customary commercial advantages; b) when one entity has significant influence over the adoption of the financial and business decisions of the other entity; c) the work or the results from the work of one entity has significant influence over the work and the results of the work of the other entity. The entities are also related when one legal entity or individual has participating interest in another legal entity. Related entities include: a) close family members; b) members of the management body, supervisory body or procurator, as well as members of their close family; c) persons employed on the basis of an employment contract with special terms and conditions, as well as members of their close family; d) in a manner that one entity, that is, entities that are related entities, jointly, directly or indirectly have participating interest in another entity; e) in a manner that a same entity, that is, entities that are considered related has participating interest in both entities.
31 29 As of and for the year then ended on 31 December 2016 Applied accounting policies and valuation techniques (continued) Events after the reporting date Events after the reporting date that provide additional information about a Company s financial position at the reporting date (adjusting events) are reflected in the financial statements. Events after the reporting date that are not adjusting events are disclosed in the notes when material.
32 30 As of and for the year then ended on 31 December Accounting estimates and judgements In the application of the accounting policies to these financial statements, the Management of the Company makes estimates and assumptions about the carrying amounts of assets and liabilities that are not readily apparent from their sources. The estimates and associated assumptions are based on historical experience and other factors that are considered to be relevant. Actual results may differ from these estimates. The estimates and underlying assumptions are reviewed on an on-going basis. Revisions to accounting estimates are recognised in the period in which the estimate is revised if the revision affects only that period or in the period of the revision and future periods if the revision affects both current and future periods Key sources of estimation uncertainty Presented below is information about the assumptions and uncertainties relating to insurance liability as well disclosure of the risk factors in these contracts. Insurance contract provision The assumptions used for reporting of insurance assets and liabilities are intended to result in provisions which are sufficient to cover any liabilities arising out of insurance contracts so far as can reasonably be foreseen. However, given the uncertainty in establishing a provision for outstanding claims, it is likely that the final outcome will prove to be different from the original liability established. In any case, the deviation from the amounts for reported but unsolved claims defined as liabilities (RBNS), with the amounts at their settlement are levelled with additional provisions for incurred bun not reported claims (IBRN). General insurance contracts Provision is made at the Balance Sheet date for the expected ultimate cost of settlement of all claims incurred in respect of events up to that date, whether reported or not, together with related claims handling expenses, less amounts already paid. The provision for claims is not discounted for the time value of money. The sources of data used as inputs for the assumptions are typically internal to the Company, using detailed studies that are carried out at least annually. The assumptions are checked to ensure that they are consistent with observable information or other published information.
33 31 As of and for the year then ended on 31 December 2016 Accounting estimates and judgments (continued) Key sources of estimation uncertainty (continued) General insurance contracts (continued) The Company pays particular attention to current trends. Each notified claim is assessed on a separate case-by-case basis with due regard to the claim circumstances, information available from loss adjusters and historical evidence of the size of similar claims. Case estimates are reviewed regularly and are updated as and when new information arises. The provision estimation differs by class of insurance due for a number of reasons, including: - Differences in the conditions of the insurance contracts; - Differences in the complexity of claims; - The severity of individual claims; - Difference in the period between the occurrence and reporting of claims Significant delays can be experienced in the notification and settlement of certain type of general insurance claims, therefore the ultimate cost of which cannot be known with certainty at the Balance sheet date. Key statistical method used is a chain ladder method - (Chain Ladder Method) that uses historical data to estimate the expected outcome of future liabilities arising from insurance contracts based on incurred but not reported claims and provision for reopened claims. The application of the historical data means that development pattern of claims will occur again in the future. This is not always the case, methods of valuation vary depending on conditions. The reasons may be: - Economic, legal, political and social trends (resulting, for example, in a difference in expected levels of inflation); - Changes in the portfolio of insurance contracts; - The impact of large losses. Claims on general insurance contracts are payable on a claims-occurrence basis. The contracts are concluded for short periods, mostly for one year for which the Company is being liable for all insured events that occurred during the term of the contract. Assumptions The principal assumption underlying the estimates is the Company s past claims development experience. This includes assumptions in respect of average claim costs, claims handling costs, claims inflation factors and claim numbers for each accident year. Judgement is used to assess the extent to which external factors such as judicial decisions and government legislation affect the estimates. No change in assumptions for general insurance contracts provision occurred in 2016 that had a material effect on the financial statements.
34 32 As of and for the year then ended on 31 December 2016 Accounting estimates and judgments (continued) Key sources of estimation uncertainty (continued) General insurance contracts (continued) Impairment of financial assets The impairment of doubtful receivables is based on estimated risk of losses resulting from the inability of customers to settle their obligations, following the Management s decisions. In estimating the appropriateness of the loss due to impairment of disputed receivables, the estimation is based on the aging of account receivables balance and historical write-off experience, customer credit-worthiness and changes in customer payment terms. This involves making assumptions about future customer behaviour, as well as future cash flows. The Management considers that the provisions recognised correspond to the estimated potential losses from impaired receivables.
35 33 As of and for the year then ended on 31 December Insurance and financial risk management Risk management objectives and policies for mitigating insurance risk The Company s management of insurance risk is a critical aspect of the business. The objective is to select assets with duration and maturity value which matches the expected cash outflows from the insurance contracts claims. The primary insurance activity carried out by the Company includes compensation of claims to persons or organisations Company s insurers, arising from the insured events. The Company is exposed to the uncertainty surrounding the timing, frequency and severity of claims under the contracts. The Company manages its insurance risk through setting limits on amounts of insurance, approval procedures to accept the risks in insurance, pricing guidelines, procedures for application, assessment and decision regarding claims and centralised management of reinsurance. Underwriting policy The Company underwriting strategy seeks diversity to ensure a balanced portfolio and is based on a large portfolio of similar risks over a number of years and, as such, reduces the variability of the outcome. The underwriting strategy is set out in an annual business plan that establishes the classes of business to be written, and the industry sectors in which the Company is prepared to underwrite. All general insurance contracts are annual in nature and the Company have the right to refuse renewal or to change the terms and conditions of the contract at renewal. Reinsurance policy The Company reinsures a portion of the insurance contracts in order to control its exposures to losses and protect capital resources. The Company buys a combination of proportionate and non-proportionate reinsurance treaties to reduce the net exposure to the insurance risk. In addition, the Company provides facultative reinsurance for certain specific insured risks. Facultative reinsurance is subject to pre-approval and the total expenditure on facultative reinsurance is regularly monitored. The Company monitors the financial condition of reinsurers on an ongoing basis and reviews its reinsurance arrangements periodically. The Company s management sets the minimum security criteria for acceptable reinsurance and monitors the purchase of reinsurance against those criteria. The Company s management also monitors the ongoing adequacy of the reinsurance programme. The Company utilises a reinsurance agreement with non-affiliated reinsurers to control its exposure to losses resulting from one occurrence.
36 34 As of and for the year then ended on 31 December 2016 Insurance and financial risk management (continued) Assets/ liabilities matching Assets covering technical provisions are those of the Company that serve to cover future liabilities arising from insurance contracts and possible losses in terms of those risks that the Company is obliged to set aside assets for covering technical provisions. The Company actively manages its financial position using an approach that balances quality, diversification, liquidity and investment return, taking into consideration the limits prescribed by the Law on insurance supervision. Presented below are assets/liabilities matching according to the local regulatory requirements, in relation to assets covering the technical provisions: In Denars Assets Bank deposits and cash equivalents 413,558, ,734,619 Bonds and other securities guaranteed by RM 119,495, ,408,244 Securities available-for-sale 139,371, ,035, ,425, ,178,814 Liabilities (net technical reserves) Reserves for transferred premiums, net of the reinsurers part 339,860, ,960,337 Reserves for bonuses and discounts 24,036,667 24,248,368 Reserves for claims, net of the reinsurers part 304,553, ,390, ,451, ,598,953 Asset/liability matching 3,974,878 27,579,861 Assets covering the technical reserves are calculated in accordance with the Rulebook on types and characteristics of assets covering the technical reserves and assets covering the mathematical reserves, as well as detailed placement and restriction of those investment and their valuation. In accordance with the requirements of the Law on insurance supervision, the bank deposits may not exceed 60% of the total assets covering the technical reserves, cash and cash equivalents may not exceed 3% of the total assets covering the technical reserves. Also, bonds and other securities issued and guaranteed by the Republic of Macedonia may not exceed 80% of the total assets covering the technical reserves. Furthermore, the securities classified as available-for-sale, holdings and shares in investments funds registered in the Republic of Macedonia may not exceed 20%, while the shares traded on regulated market in the Republic of Macedonia may not exceed 25%. Furthermore, according the Law on insurance supervision, the total deposits of one insurance company in one bank may not exceed 25% of the assets covering the technical reserves of the Company, as well as the total holdings in one particular investment fund may not exceed 10%. As of 31 December 2016 and 2015, the Company is in compliance with prescribed indexes.
37 35 As of and for the year then ended on 31 December 2016 Insurance and financial risk management (continued) Insurance against consequences of an accident (accident) Characteristics This type of insurance regulates the relation between the insurance parties in event of death as consequence of an accident, permanent disability (disability) as a consequence of an accident, impermanent disability to work and incurred health disorder that requires medical attention (medical expenses). Risk Management The elementary risks in this class of insurance are related with the type of operations of the prospective insurers, their age and gender. The biggest risk arises from the nature of this class of insurance that is unpredictable and happens unexpectedly. The event causing damage usually happens unexpectedly and the cause of claim is easily determined. In this case the claim may be reported in delayed period, and it will be completed after treatment completion and finalisation of the documentation. Accordingly, insurance against consequences of an accident (accident) is classified as long-term due to delayed time schedules. Liability to third parties Characteristics The Company concludes insurance contracts for liability to third parties. Under these contracts compensation is paid for the occurrence of insured event. It may be of material or nonmaterial nature. The settlement period of the material claim is shorter than the period of the nonmaterial claim due to the nature of the claim. The most of the insurance contracts with incurred material claim against liability to third parties are not subject to significant complexity so that the final outcome is less uncertain. For nonmaterial claims duration of the process of payment of claims from the reporting date of the claim to date of solving the same depends on several factors such as the nature of cover and the policy conditions. Risk Management Risks arising from liability of third parties are managed primarily through risk selection, appropriate investment strategy, estimation and reinsurance. The Company therefore monitors and reacts to changes in the general economic and commercial environment in which it operates to ensure that only risks which meet the Company s criteria, are subject to insurance. For liability contracts for nonmaterial claims, the key risk is the trend for courts to award higher levels of compensation which can significantly varies between court cases and courts.
38 36 As of and for the year then ended on 31 December 2016 Insurance and financial risk management (continued) Property Characteristics The Company contracts property insurance in the Republic of Macedonia. Property insurance indemnifies, subject to any limits or excesses, the policyholder against the loss or damage to their own property. The event of damage to buildings or other property usually occurs unexpectedly (as for fire and burglary) and the cause is easily determinable. The claim will thus be promptly reported and can be settled without delay. Property insurance is classified as is classified as shortterm, which means that increase in expenses and returns on investment are of minor importance. Risk Management The key risks associated with this product are insurance risk, competitive risk and claims experience risk (including the variable incidence of natural disasters). The risk of these insurances is the risk that the Company may underestimate the insured risk. The risk on any policy will vary according to many factors such as location, safety measures and the characteristics of property. For insurance of property of individuals, it is expected that there will be large numbers of properties with similar risk profiles. However, for commercial business this will not be the case. Many commercial property proposals comprise a unique combination of location, type of business, and safety measures in place. Calculating a premium commensurate with the risk for these policies will be subjective, and hence risky. The Company reinsures risk of damage above the standard amount set aside by the Company. Insurance of motor vehicles (Casco) Characteristics The Company concludes insurance contracts for vehicles on the Republic of Macedonia. Fast payment protects the insured from loss of value of physical damage to vehicle and property at the time of occurrence of harmful events. Risk Management In general, claims reporting lags are minor, and claim complexity is relatively low, bearing moderate risk. The Company monitors and reacts to changes in trends of injury awards, litigation and the frequency of claims appeal. The frequency of claims is affected by adverse weather conditions. In addition, there is a correlation with the price of fuel and economic activity, which affect the amount of traffic activity.
39 37 As of and for the year then ended on 31 December 2016 Insurance and financial risk management (continued) Tourist assistance Characteristics Based on the insurance contracts, and depending on the type of insurance coverage, the Company provides services specified in the policy, arising from insured cases arising abroad and are associated with travel abroad, and healthcare and insurance, travel assistance and insurance, accident insurance, baggage insurance, business assistance and insurance, trip cancellation, additional insurance for ski package (with extra charge premiums) additional insurance against sport accidents (with extra charge premiums). Risk Management The frequency of these claims is directly related to the travel of insurers and the number of reported claims is higher during summer period. The event causing claim usually is easily determined. In this case the claim will be reported and can be resolved without delays. Accordingly, the travel insurance is classified as shortterm, which means that increase in expenses and returns on investment are of minor importance. Claims development Run off analysis is especially for provision for incurred and reported claims and provision for incurred but not reported claims, as well as on cumulative basis, is done in accordance with the Rulebook for minimum standards for the calculation of technical provision, that is applicable since 01 January Concentrations of insurance risks A key aspect of the insurance risk faced by the Company is the extent of concentration of insurance risk which may exist where a particular harmful event could impact significantly upon the Company s liabilities. Such concentrations may arise from a single insurance contract or through a small number of related contracts, and relate to circumstances where significant liabilities could arise. An important aspect of the concentration of insurance risk is that it may arise from the accumulation of risks within a number of individual insurance classes. Geographic and sector concentrations The risks underwritten by the Company are located in the Republic of Macedonia. The management believes that the Company has no significant concentrations of exposure to any group of policyholders measured by social, professional, age or similar criteria. These risks are managed through contracts for reinsurance. The Company enters into reinsurance contracts, as they are - excess of loss coverage over the following classes of insurance: property and liability to third parties as well as full reinsurance of individual classes of insurance which provides protection against total risk. The Company assesses the costs and benefits associated with the reinsurance programme on a regular basis.
40 38 As of and for the year then ended on 31 December 2016 Insurance and financial risk management (continued) Interest rate risk The Company s exposure on interest rate risk is concentrated in the investment in securities portfolio. The liabilities from insurance contracts are short-term and the interest rate risk is mitigated by investing in debt instruments that are mostly fixed-income (government bonds and bills). The short-term liabilities for insurance and reinsurance are not directly sensitive on the market interest rates due to their non-interest bearing character.
41 39 As of and for the year then ended on 31 December 2016 Insurance and financial risk management (continued) Interest rate risk (continued) As of 31 December 2016 In Denars Instruments with fixed interest rate Total Instrument with variable interest rate up to 1 month 1-3 months 3-12 months 1-5 years More than 5 years Non-interest bearing Assets Debt securities held to maturity 119,495,973-9,983,112 20,000,000 27,934,292 61,578, Securities available-for-sale 139,371, ,371,589 Time deposits 530,102, ,000, ,100, ,002, Investments in joint controlled entities 18,122,999 18,122, Insurance receivables and other receivables from direct works 262,561, ,561,255 Cash and cash equivalents 17,457,157 17,190, ,431 Reinsurance assets 127,876, ,876,526 Liabilities Liabilities (54,206,110) (54,206,110) 1,160,782,317 35,313,725 9,983, ,000, ,034, ,581, ,869,691
42 40 As of and for the year then ended on 31 December 2016 Insurance and financial risk management (continued) Interest rate risk (continued) As of 31 December 2015 In Denars Instruments with fixed interest rate Total Instrument with variable interest rate up to 1 month 1-3 months 3-12 months 1-5 years More than 5 years Non-interest bearing Assets Debt securities held to maturity 116,408, , ,584, Securities available-for-sale 130,035, ,035,951 Time deposits 504,300, ,300, Investments in joint controlled entities 17,353,339 17,353, Insurance receivables and other receivables from direct works 273,578, ,578,298 Cash and cash equivalents 17,734,619 17,503, ,064 Reinsurance assets 123,699, ,699,277 Liabilities Liabilities (43,723,533) (43,723,533) 1,139,386, ,156, , ,584, ,821,057 Sensitivity analysis of interest rates Sensitivity analysis is determined based on the Company's exposure to changing interest rates on financial instruments at the Balance sheet date. As of 31 December 2016, if interest rates are 200 basis points higher/lower, and the other variables constant, the profit before tax of the Company for the year ended 31 December 2016 will be decreased/increased by approximately Denar 456,250 (2015: Denar 444,604).
43 41 As of and for the year then ended on 31 December 2016 Insurance and financial risk management (continued) Credit risk The Company is exposed to credit risk, which is the risk that the counterparties may not be able to pay the amounts in full when they are due. To control exposure to credit risk, the Company performs ongoing credit evaluations of the financial condition of these counterparties on a regular basis. Insurance receivables The Company is exposed to credit risk in the event where its customers from the provision of insurance services fail to meet their payment obligations. The Company's exposure to credit risk is limited to the carrying value of premium and other receivables. The premium receivables are owed by a large number of customers on normal credit terms and therefore there is minimal concentration of credit risk. The Company monitors premium receivables on an ongoing basis with the result that the Company's exposure to bad debts is controlled. Analysis of the age structure of due trade receivables for unpaid premiums is presented in Note 2.7. Reinsurance assets The Company has exposure to credit risk in relation to its reinsurance assets. Reinsurance is placed with high rated counterparties and concentration of risk is avoided by following policy guidelines in respect of counterparties' limits that are set each year and are subject to regular reviews. The management of the Company performs assessment of the creditworthiness of reinsurers to update reinsurance strategy. Securities available-for-sale and securities held to maturity The Company is exposed to credit risk in respect of securities available-for-sale and securities held to maturity in terms of possible uncollectibility from other parties. However, taking into account that the Company invests in government bills, government bonds, investment funds, listed companies and term deposits in domestic banks is not expected these investments will not be recovered. Maximum exposure to credit risk The maximum exposure of the Company to credit risk is limited to the carrying amount of the financial assets recognized at the date of the financial statement, which are presented in the following table: In Denars Financial investements available-for-sale 139,371, ,035,951 Debt securities held to maturity 119,495, ,408,244 Term deposits 530,102, ,300,000 Investments in jointly controlled entities 18,122,999 17,353,339 Reinsurance assets 127,876, ,699,277 Receivables from insurers and other receivables from direct operations 262,561, ,578,298 Cash and cash equivalents 17,457,157 17,734,619 1,214,988,427 1,183,109,728
44 42 As of and for the year then ended on 31 December 2016 Insurance and financial risk management (continued) Foreign exchange risk The Company is exposed to risk in relation to the effects of fluctuations in the prevailing exchange rates that reflect the financial position and cash flow. The Company does not use hedging financial instruments due to the fact that these types of instruments are not in common use in the Republic of Macedonia. The tables below show the Company's exposure to currency risk 31 December 2016 MKD EUR USD CHF Other currencies In Denars Total assets 1,180,969, ,648, ,355,618,632 Intangibles 1,823, ,823,150 Investments 768,338,616 38,754, ,093,489 Part of co-insurance and reinsurance in the gross technical reserves - 127,876, ,876,526 Financial investments for which the insured assumes the investment risk (insurance contracts) Current and deferred tax assets Receivables 260,859,886 1,701, ,561,255 Other Assets 24,056,801 6,315, ,372,714 Prepaid Expenses 125,891, ,891,498 Total liabilities 1,342,578,479 12,771, , ,275 1,355,618,632 Equity and reserves 453,068, ,068,151 Subordinated liabilities Gross technical reserves 796,327, ,327,538 Gross technical reserves of contracts in which the insured assumes the investment risk Other reserves Current and deferred tax liabilities 4,864, ,864,862 Liabilities arising from deposits of companies for reinsurance at cedents, from reinsurance contracts Liabilities from direct insurance, co-insurance and reinsurance, and other payables 41,165,957 12,771, , ,275 54,206,110 Accruals 47,151, ,151,971 Difference unreconciled currency structure (161,608,528) 161,877,618 (145,815) - (123,275) - Total
45 43 As of and for the year then ended on 31 December 2016 Insurance and financial risk management (continued) Foreign exchange risk (continued) 31 December 2015 MKD EUR USD CHF Other currencies In Denars Total Total assets 1,136,668, ,996, ,304,665,448 Intangibles 2,493, ,493,158 Investments 725,291,662 42,808, ,100,268 Part of co-insurance and reinsurance in the gross technical reserves - 123,699, ,699,277 Financial investments for which the insured assumes the investment risk (insurance contracts) Current and deferred tax assets Receivables 272,279,890 1,298, ,578,298 Other Assets 30,742, , ,933,178 Prepaid Expenses 105,860, ,860,993 Total liabilities 1,296,425,733 7,905, , ,304,665,448 Equity and reserves 428,704, ,704,069 Subordinated liabilities Gross technical reserves 736,298, ,298,230 Gross technical reserves of contracts in which the insured assumes the investment risk Other reserves Current and deferred tax liabilities 3,916, ,916,449 Liabilities arising from deposits of companies for reinsurance at cedents, from reinsurance contracts Liabilities from direct insurance, co-insurance and reinsurance, and other payables 35,483,818 7,905, , ,723,533 Accruals 92,023, ,023,167 Difference unreconciled currency structure (159,757,104) 160,091,799 (334,695) - - -
46 44 As of and for the year then ended on 31 December 2016 Insurance and financial risk management (continued) Liquidity risk The major liquidity risk confronting the Company is the daily call on its available cash resources in respect of claims arising from insurance contracts. The Company owns / maintains a highly satisfactory level of funds at all time, for payment of matured liabilities for payment and potential liabilities as they fall due. The analysis of the maturity of assets according to their remaining period until the date of their contractual maturity is as follows (In Denars): 31 December 2016 Up to 1 year 1-3 years 3-5 years 5-10 years years years Over 20 years Total Assets 976,028, ,581,497 1,823, ,185,627 1,355,618,632 Intangibles - - 1,823, ,823,150 Investments 429,326, ,581, ,185, ,093,489 Part of co-insurance and reinsurance in the gross technical reserves 127,876, ,876,526 Financial investments for which the insured assumes the investment risk (insurance contracts) Current and deferred tax assets Receivables 262,561, ,561,255 Other Assets 30,372, ,372,714 Prepaid Expenses 125,891, ,891,498 Total Liabilities and equity 1,160,292, ,326,080 1,355,618,632 Equity and reserves 257,742, ,326, ,068,151 Subordinated liabilities Gross technical provisions 796,327, ,327,538 Gross technical provisions of contracts in which the insured assumes the investment risk Other reserves Current and deferred tax liabilities 4,864, ,864,862 Liabilities arising from deposits of companies for reinsurance at cedents, from reinsurance contracts Liabilities from direct insurance, co-insurance and reinsurance, and other payables 54,206, ,206,110 Accruals 47,151, ,151,971 Difference unreconciled age structure (184,264,194) 343,581,497 1,823, (161,140,453) - Total
47 45 As of and for the year then ended on 31 December 2016 Insurance and financial risk management (continued) Liquidity risk (continued) 31 December 2015 Up to 1 year 1-3 years 3-5 years 5-10 years years years Over 20 years Total Assets 733,068, ,604,013 12,773, ,219,439 1,304,665,448 Intangibles - - 2,493, ,493,158 Investments 198,996, ,604,013 10,280, ,219, ,100,268 Part of co-insurance and reinsurance in the gross technical reserves 123,699, ,699,277 Financial investments for which the insured assumes the investment risk (insurance contracts) Current and deferred tax assets Receivables 273,578, ,578,298 Other Assets 30,933, ,933,178 Prepaid Expenses 105,860, ,860,993 Total Liabilities and equity 1,109,339, ,326,080 1,304,665,448 Equity and reserves 233,377, ,326, ,704,069 Subordinated liabilities Gross technical provisions 736,298, ,298,230 Gross technical provisions of contracts in which the insured assumes the investment risk Other reserves Current and deferred tax liabilities 3,916, ,916,449 Liabilities arising from deposits of companies for reinsurance at cedents, from reinsurance contracts Liabilities from direct insurance, coinsurance and reinsurance, and other payables 43,723, ,723,533 Accruals 92,023, ,023,167 Difference unreconciled age structure (376,270,747) 535,604,013 12,773, (172,106,641) - Total Capital management The Insurance Supervision Agency is a main regulatory body that monitors the capital adequacy of the Company as a whole. The Company is directly supervised by the regulatory body. Company s capital The Company s capital according the legislative requirements is consist of core and additional capital and is calculated as follows: When calculating the core capital of the Company, the following items are taken into considerations: Paid-in shareholders capital excluding the paid-in shareholders capital from cumulative preference shares; Reserves of the Company (legal and statutory) which do not arise from insurance contracts; Retained earnings carried forward; Retained earnings from the current year (after taxation and other contributions and the dividend payable), if the amount of the profit has been verified by a certified auditor.
48 46 As of and for the year then ended on 31 December 2016 Insurance and financial risk management (continued) Capital management (continued) Company s capital (continued) When calculating the core of the Company for insurance, the following items are considered as deductible: Treasury shares own by the Company; Long-term intangible assets; Uncovered loss and loss from the current year carried forward. The insurance Company is required to set aside reserves not less than one third of the profit shown in the annual accounts unless the profit is used to cover previous years' losses, until the level of the Company s safety provisions reaches 50% of the average insurance premiums collected over the last two years, whereby previous years' premiums are increased for the value of the retail price index growth, inclusive of the year for which the profit is distributed. When calculating the additional capital of the insurance undertaking, the following items are taken into consideration: paid-up share capital from cumulative preference shares; subordinate debt instruments; securities with unlimited maturity; When calculating the capital of the Company, the additional capital referred above is taken into consideration only up to the amount not higher than 50% of the core capital. When calculating the capital of the Company, the amounts of core and additional capital shall be reduced by the following items: - Investment made by the Company into shares or subordinate debt instruments issued by another insurance undertaking or other financial institution in which the Company holds a share of more than 10%, as well as other investments in those entities, which are included in the calculation of the respective capital of those entities; - Investment made by the Company into shares or subordinate debt instruments issued by another insurance undertaking or other financial institution other than those referred above, which exceed 10% of the capital of the insurance undertaking calculated prior to the deduction of the items listed above. Guarantee Fund of the Company According the requirements of the Law on insurance supervision the Guarantee Fund must not be less than one third of the required level of solvency margin of the Company. Also, the guarantee fund shall not be less than EUR 3,000,000 if the Company performs insurance operations in all classes of insurance in the group of non-life insurance. As of 31 December 2016 and 2015 the Company is in compliance with these legal requirements. Required solvency margin The capital of the insurance company engaged in non-life insurance and / or reinsurance at any time should be at least equal on the required level of solvency margin of the insurance company that is calculated using the Premium Rate Method and the Claims Rate Method, depending on which method provides higher result. The solvency margin for the year ended 31 December 2016 is in amount of Denar 130,181,939 (2015: Denar 117,544,730).
49 47 As of and for the year then ended on 31 December 2016 Insurance and financial risk management (continued) Capital management (continued) The Company s management policy is to maintain stability in the capital of the Company to maintain investor s confidence, market and to support future business development. Management of the Company monitors the return on equity, defined as earnings from operations. The Company also takes in consideration the impact that the level of capital on the return to shareholders and the need to maintain a ratio between higher returns and security provided by strong capital position. The Company is not exposed to external influences on changes in equity. During the year there were no materially significant changes in the approach of the Company referring to the capital management. Sensitivity analysis The Company has estimated the impact of changes in certain key variables on the profit for the year, equity and the coverage coefficient. Compared with the current equity position of the equity, profit for the year, equity, coverage index and solvency with own capital as of 31 December 2016 and 31 December 2015 is shown in the table below. 31 December 2016 Profit for the period Equity and reserves Required level of solvency margin Coverage index Change in coverage index Current equity position 47,591, ,068, ,181, % Investment yield (+2%) 48,126, ,603, ,181, % 0% Investment yield (-2%) 47,056, ,533, ,181, % (1%) 5% decrease in claims incurred 34,835, ,312, ,181, % (9%) 5% increase in claims incurred 60,346, ,823, ,181, % 20% 2% decrease in admin. and insurance provision expenses 42,652, ,007, ,181, % (6%) 2% increase in admin. and insurance provision expenses 52,530, ,007, ,181, % 0% Required level of solvency margin Change in coverage index 31 December 2015 Profit for the period Equity and reserves Coverage index Current equity position 49,255, ,704, ,544, % Investment yield (+2%) 49,877, ,326, ,544, % 1% Investment yield (-2%) 48,632, ,081, ,544, % (1%) 5% decrease in claims incurred 37,122, ,571, ,544, % (10%) 5% increase in claims incurred 61,387, ,836, ,544, % 21% 2% decrease in admin. and insurance provision expenses 44,965, ,993, ,544, % (7%) 2% increase in admin. and insurance provision expenses 53,544, ,993, ,544, % (0%) The results from all simulations show good level of capitalization of the Company. The most significant impact on the profit for the period, equity and the coverage index has a potential change in claims incurred. This analysis has been prepared for a change in one variable with other assumptions remaining constant. It should be noted that the information in the table above has been produced using a deterministic approach, so is a distribution free analysis with no correlations between the key variables.
50 48 As of and for the year then ended on 31 December 2016 Insurance and financial risk management (continued) Sensitivity analysis (continued) Where variables are considered to be non-material, no impact has been assessed for insignificant changes to these variables. Particular variables may not be considered material at present, but if the materiality level of an individual variable change, assessment of changes to that variable in the future may be required. Fair value Financial instruments recognized at fair value The financial assets measured according to the fair value in the statement of financial position are further categorized in accordance with the hierarchy of the fair value are shown in the next table. This hierarchy groups the financial assets and liabilities into three levels that are based on the significance of the incoming data used during the measurement of the fair value of the financial assets. Fair value hierarchy is as follows: Level 1: quoted prices (not adjusted) on the active markets for identical assets or liabilities; Level 2: other incoming data, aside from the quoted prices, included in Level 1 which are available for asset or liability observing, directly (i.e. as prices), or indirectly (i.e. made of prices) and Level 3: incoming data on the asset or liability that are not based on data available for market observing. The financial assets that are recognized according to their fair values in the Statement of financial position are grouped according to the hierarchy level of the fair value, as follows: 2016 Level 1 Level 2 Level 3 Total Assets Financial investments available-for-sale 16,062, ,308, ,371, Level 1 Level 2 Level 3 Total Assets Financial investments available-for-sale 5,866, ,169, ,035,951 Financial investments available-for-sale consists of investments in shares of companies listed on the Macedonian Stock Exchange and investments in stakes in investments funds. They are recognised at fair value based on their market price at the reporting date.
51 49 As of and for the year then ended on 31 December 2016 Insurance and financial risk management (continued) Fair value (continued) Financial instruments not recognized at fair value The following table summarizes the difference between the carrying values and the fair values to those financial assets and liabilities that are not recognised in the Balance Sheet at their fair value: Total carrying value Total carrying Total fair value value Total fair value Assets Debt securities held to maturity 119,495, ,200, ,408, ,256,655 Time deposits 530,102, ,102, ,300, ,300,000 Investments in joint controlled entities 18,122,999 18,122,999 17,353,339 17,353,339 Reinsurance assets 127,876, ,876, ,699, ,699,277 Insurance receivables and other receivables from direct works 262,561, ,561, ,578, ,578,298 Cash and cash equivalents 17,457,157 17,457,157 17,734,619 17,734,619 1,075,616,838 1,080,321,760 1,053,073,777 1,059,922,188 Liabilities Liabilities 54,206,110 54,206,110 43,723,533 43,723,533 54,206,110 54,206,110 43,723,533 43,723,533
52 50 As of and for the year then ended on 31 December 2016 Insurance and financial risk management (continued) Financial instruments by category Loans and receivables Held to maturity Available-forsale Total 31 December 2016 Assets according to the Statement of financial position Financial investments available-for-sale ,371, ,371,589 Debt securities held to maturity - 119,495, ,495,973 Deposits, loans and other placements 530,102, ,102,928 Investments in joint controlled entities 18,122, ,122,999 Reinsurance assets 127,876, ,876,526 Insurance receivables and other receivables from direct works 262,561, ,561,255 Cash and cash equivalents 17,457, ,457, ,120, ,495, ,371,589 1,214,988,427 Liabilities at fair value through profits and losses Оther financial liabilities Total Liabilities according to the Statement of financial position Liabilities - 54,206,110 54,206,110-54,206,110 54,206, December 2015 Loans and receivables Held to maturity Available-forsale Total Assets according to the Statement of financial position Financial investments available-for-sale ,035, ,035,951 Debt securities held to maturity - 116,408, ,408,244 Term deposits 504,302, ,302,734 Investments in joint controlled entities 17,353, ,353,339 Reinsurance assets 123,699, ,699,277 Insurance receivables and other receivables from direct works 273,578, ,578,298 Cash and cash equivalents 17,734, ,734, ,668, ,408, ,035,951 1,183,112,462 Liabilities at fair value through profits and losses Оther financial liabilities Total Liabilities according to the Statement of financial position Liabilities - 43,723,533 43,723,533-43,723,533 43,723,533
53 51 As of and for the year ended 31 December 2016 (All amounts expressed in Denar, unless otherwise stated) 2. Information and disclosures to the Statement of financial position (Balance Sheet) 2.1 Intangible assets Software Total Cost As of 01 January ,013,395 16,013,395 Additions 1,735,040 1,735,040 As of 31 December ,748,435 17,748,435 As of 01 January 2016 Additions 17,748,435 17,748,435 As of 31 December , ,397 18,128,832 18,128,832 Accumulated amortisation As of 01 January ,439,967 14,439,967 Amortisation for the year 815, ,310 As of 31 December ,255,277 15,255,277 As of 01 January ,255,277 15,255,277 Amortisation for the year 1,050,405 1,050,405 As of 31 December ,305,682 16,305,682 Net carrying value As of 31 December ,493,158 2,493,158 As of 31 December ,823,150 1,823, Land, buildings and other assets not used in the main business operations As of 31 December 2016 and 2015, the Company has no investments in land, buildings and other assets not used in the main business operations. 2.3 Investments in jointly controlled entities As of 31 December 2016, investments in jointly controlled entities are in the amount of Denar 18,122,999 (2015: Denar 17,353,339) relates to the founders share in National Insurance Bureau in accordance with the requirements of the Law on Insurance Supervision of the Republic of Macedonia. National Insurance Bureau is a non-profit organization founded by all domestic insurance companies whose purpose is to protect the interests of its members in international insurance of motor vehicles and represents members in front of the international insurance companies. Investments in joint controlled entities are invested interest bearing deposits held in a separate bank account. National Insurance Bureau is obliged not to invest and to return the deposit to each member in case of termination of their operations with insurance of motor vehicles.
54 52 As of and for the year ended 31 December 2016 (All amounts expressed in Denar, unless otherwise stated) 2.4 Other financial investments Financial investments held to maturity (net value) 119,495, ,408,244 Financial investments available-for-sale - shares 16,062,628 5,866,100 Financial investments available-for-sale stakes in investment funds 123,308, ,169,851 Deposits, loans and other placements 530,102, ,302, ,970, ,746, Debt securities held to maturity Government bonds 110,209, ,478,260 Accumulated amortisation (5,635,736) (8,070,016) Government bills 15,000,000 - Accrued interest income (77,406) - 119,495, ,408,244 Quoted 119,495, ,408,244 Not quoted ,495, ,408,244 Government bonds with maturity within 1 year 43,090, ,185 Government bills 15,000,000 - Accrued interest income (173,071) (52,171) Debt securities held to maturity within 1 year 57,917, ,014 Government bonds with maturity over 1 year 67,023, ,602,075 Accumulated amortization (5,444,837) (8,017,845) Debt securities held to maturity over 1 year 61,578, ,584, Shares, stakes and other equity instruments Equity securities 16,062,628 5,866,100 Stakes in investment funds 123,308, ,169, ,371, ,035,951 Quoted 16,062,628 5,866,100 Not quoted 123,308, ,169, ,371, ,035,951 Changes in fair value of investments As of 31 December 2016 the Company reassessed the carrying values of its investments in securities available-for-sale, through their comparation with the quoting prices of Macedonian Stock Exchange at the reporting date. On the basis of the performed assessment of the financial investments in shares and stakes in investments funds the Company made adjustments (increase) on the carrying value of investments to their fair value, for the amount of Denar 4,772,910 (2015: increase Denar 1,637,460) that is recognized in the revaluation reserves that are part of the Company s capital.
55 53 As of and for the year ended 31 December 2016 (All amounts expressed in Denar, unless otherwise stated) Deposits, loans and other placements Term deposits in domestic banks (short-term) 248,100, ,000,000 Term deposits in domestic banks (long-term) 282,002, ,300,000 Other loans - 2, ,102, ,302,734 Short-term term deposits maturing within a period not exceeding 12 months from the reporting date and bear interest at rate of 2.10% to 4.30% p.a. Long-term term deposits maturing within a period exceeding more than 12 months from the reporting date and bear interest at rate of 2.50% to 3.70 % p.a. 2.5 Part for co-insurance and reinsurance in gross technical provisions Gross provision for unearned premiums As of 01 January 109,410,082 46,048,233 Movement for the period (Note 3.1) (36,265,171) 63,361,849 As of 31 December 73,144, ,410,082 Gross provision for claims As of 01 January 14,289,195 57,548,926 Movement for the period 40,442,420 (43,259,731) As of 31 December 54,731,615 14,289,195 Part for reinsurance in gross technical provisions 127,876, ,699, Deferred and current tax assets Receivables for overpaid personal tax Receivables for overpaid income tax Receivables The receivables in the table below are shown in gross amount less impairment provision of receivables from insurance contracts, according to the Rulebook on the methods of evaluation of items on the balance sheet and preparation of financial statements, adopted by the Insurance Supervision Agency: Receivables form insurers 336,108, ,660,836 Impairment provision of receivables from insurance contracts (93,214,459) (100,767,761) 242,894, ,893,075 Receivables on the basis on participation in claims from co-insurance and reinsurance 1,701,369-1,701,369 - Other receivables from insurance direct operations 34,550,978 26,273,523 Impairment provision of other receivables from insurance direct operations (23,351,388) (17,932,560) 11,199,590 8,340,963 Receivables for financial investments 5,659,139 4,351,084 Other receivables 1,231,817 1,144,483 Impairment provision of other receivables (125,135) (151,307) 6,765,821 5,344, ,561, ,578,298
56 54 As of and for the year ended 31 December 2016 (All amounts expressed in Denar, unless otherwise stated) Receivables (continued) Analysis of the age structure of receivables from insurers as of 31 December 2016 is as follows: Receivables Impairment provision Present value of receivables Impairment Present value Receivables provision of receivables to 30 days 19,883,958 (52,269) 19,831,689 23,697,574 (834,438) 22,863, days 10,546,657 (1,123,790) 9,422,867 9,776,996 (1,066,120) 8,710, days 13,638,843 (4,331,779) 9,307,064 12,477,780 (3,983,509) 8,494, days 17,497,026 (9,057,704) 8,439,322 14,538,090 (7,439,562) 7,098, days 5,543,243 (3,944,097) 1,599,146 5,543,071 (3,940,617) 1,602,454 over 365 days 73,058,587 (73,058,587) - 81,902,908 (81,902,908) - Matured receivables 140,168,314 (91,568,226) 48,600, ,936,419 (99,167,154) 48,769,265 Not matured receivables 195,940,620 (1,646,233) 194,294, ,724,417 (1,600,607) 212,724, ,108,934 (93,214,459) 242,894, ,660,836 (100,767,761) 261,493,682 As of 31 December 2016, the Company performed assessment on the collectability of insurance receivables, and performed write offs due uncollectability on the account of current expenses in the amount of Denar 10,219,868 (2015: Denar 2,081,496) (Note 3.10).
57 55 As of and for the year ended 31 December 2016 (All amounts expressed in Denar, unless otherwise stated) 2.8 Tangible assets used for operations As of 31 December 2016 Furniture and office equipment Leasehold Improvements Motor vehicles Other assets Computers Total As of 01 January 2016 net of accumulated depreciation 4,396, ,105 47,427 5,997,085 2,061,099 13,198,559 Additions 1,401, , ,336,211 4,445,587 Write off of cost (280,959) (280,959) Write off of accumulated depreciation 280, ,959 Depreciation expense (1,950,099) (267,243) (43,998) (2,148,961) (318,288) (4,728,589) As of 01 January 2016 net of accumulated depreciation 3,848,559 1,136,423 3,429 3,848,124 4,079,022 12,915,557 As of 1 January 2016 Cost 23,081,175 9,911, ,455 15,927,488 4,373,270 53,579,444 Accumulated depreciation (18,684,332) (9,214,951) (239,028) (9,930,403) (2,312,171) (40,380,885) Net carrying value 4,396, ,105 47,427 5,997,085 2,061,099 13,198,559 As of 31 December 2016 Cost 24,202,031 10,618, ,455 15,927,488 6,709,481 57,744,072 Accumulated depreciation (20,353,472) (9,482,194) (283,026) (12,079,364) (2,630,459) (44,828,515) Net carrying value 3,848,559 1,136,423 3,429 3,848,124 4,079,022 12,915,557
58 56 As of and for the year ended 31 December 2016 (All amounts expressed in Denar, unless otherwise stated) As of 31 December 2015 Computers Furniture and office equipment Other tangible assets Leasehold Improvements Total Computers As of 01 January 2015 net of accumulated depreciation 2,623, , ,718 5,348,404 2,190,801 10,998,116 Additions 3,024, ,064-3,160, ,021 6,573,130 Write off of cost (1,530,430) (77,208) (1,607,638) Write off of accumulated depreciation 1,530, ,208 1,607,638 Depreciation expense (1,251,498) (248,321) (57,291) (2,511,854) (303,723) (4,372,687) As of 01 January 2015 net of accumulated depreciation 4,396, ,105 47,427 5,997,085 2,061,099 13,198,559 As of 1 January 2015 Cost 21,587,095 9,696, ,455 12,766,953 4,276,457 48,613,952 Accumulated depreciation (18,963,264) (8,966,630) (181,737) (7,418,549) (2,085,656) (37,615,836) Net carrying value 2,623, , ,718 5,348,404 2,190,801 10,998,116 As of 31 December 2015 Cost 23,081,175 9,911, ,455 15,927,488 4,373,270 53,579,444 Accumulated depreciation (18,684,332) (9,214,951) (239,028) (9,930,403) (2,312,171) (40,380,885) Net carrying value 4,396, ,105 47,427 5,997,085 2,061,099 13,198,559 Pledge over equipment As of 31 December 2016 and 2015 the Company has no equipment under pledge. 2.9 Cash and cash equivalents Cash in bank 17,190,726 17,503,555 Cash on hand 266, ,064 17,457,157 17,734,619
59 57 As of and for the year ended 31 December 2016 (All amounts expressed in Denar, unless otherwise stated) 2.10 Prepaids As of 31 December 2016 prepaids are in amount of Denar 125,891,498 and consist of deferred acquisition costs in amount of Denar 107,613,091 and other accrued income in amount of Denar 18,278,407 (2015: Denar 105,860,993 of which the amount of Denar 92,900,001 refers to deferred acquisition costs and the amount of Denar 12,960,992 refers to other accrued income) Deferred premiums costs acquisition (balance) 83,772,572 74,297,420 Deferred premiums costs brokers (balance) 23,840,519 18,602,581 As of 31 December ,613,091 92,900,001 Deferred acquisition costs Accrued income for commission from reinsurance 6,312,213 6,119,659 Other accrued income 11,966,194 6,841,333 18,278,407 12,960, Equity and reserves As of 31 December 2016 shareholders capital consists of 3,200 (2015: 3,200) ordinary shares with nominal value of EUR 1,000 per share, respectively to Denar 195,326,080. Shareholders of ordinary shares are entitled to receive dividends that can be declared. As of 31 December 2016 and 2015 the Company's shareholders structure is: % од акциите со право на глас GOFI - GROUP OF FINANCE AND INVESTMENT SA, Switzerland 100% 100% Statutory reserves Safety reserve Under local statutory legislation, the Company is required to set aside 1/3 of its net profit for the year (unless the profit is used to cover previous years' losses) in a statutory reserve at a level not lower than 50% of the average insurance premiums collected over the last two years, whereby previous years' premiums are increased for the value of the retail price index growth, inclusive of the year for which the profit is distributed. The safety reserves are used for covering long term insurance liabilities. As of 31 December 2016 the total statutory reserve amounts to Denar 151,500,142 (2015: Denar 135,081,771).
60 58 As of and for the year ended 31 December 2016 (All amounts expressed in Denar, unless otherwise stated) Equity and reserves (continued) Revaluation reserve Revaluation reserve for financial assets available-for-sale includes cumulative net effect of the changes in the fair value of investments available-for-sale until their derecognition or impairment. As of 31 December 2016 revaluation reserve of the Company amounts to Denars (3,753,861) (2015: Denars 1,019,049) Opening balance (1,019,049) 618,411 Realized gain/losses from financial investments available for sale (429,411) (653,036) Unrealised gain/losses from financial investments available for sale 5,202,321 (984,424) 3,753,861 (1,019,049) Net retained earnings During 2016 the Company distributed dividends in a gross amount of Denar 28,000,000. As of 31 December 2016, the Company has retained net earnings in amount of Denar 54,896,896.
61 59 As of and for the year ended 31 December 2016 (All amounts expressed in Denar, unless otherwise stated) 2.12 Gross tehnical reserves As of 31 December 2016, gross technical reserves of the Company consist of the following types of provisions: gross provisions for unearned premiums, provisions for claims and provisions for bonuses and discounts Gross Reinsurance Net Gross Reinsurance Net As of 01 January 736,298,230 (123,699,277) 612,598, ,420,050 (103,597,159) 572,822,891 Movement on gross provisions for claims 56,606,101 (40,442,420) 16,163,681 (33,593,546) 43,259,731 9,666,185 Movement on unearned premium 3,634,908 36,265,171 39,900,079 91,077,657 (63,361,849) 27,715,808 Provisions for bonuses and discounts (211,701) - (211,701) 2,394,069-2,394,069 As of 31 December 796,327,538 (127,876,526) 668,451, ,298,230 (123,699,277) 612,598,953 Gross Reinsurance Net Gross Reinsurance Net As of 01 January 326,927,811 (14,289,195) 312,638, ,127,288 (57,548,926) 300,578,362 Movement on provisions for incurred, reported claims 77,636,596 (36,346,590) 41,290,006 (26,605,004) 42,500,719 15,895,715 Movement on provisions for direct costs (2,500) - (2,500) (3,333) - (3,333) Movement on provisions for indirect costs (206,556) - (206,556) (557,527) - (557,527) Movement on provisions for incurred, but not reported claims (20,821,439) (4,095,830) (24,917,269) (6,427,682) 759,012 (5,668,670) Reserves for bonuses and discounts (211,701) - (211,701) 2,394,069-2,394,069 As of 31 December 383,322,211 (54,731,615) 328,590, ,927,811 (14,289,195) 312,638,616 Gross Reinsurance Net Gross Reinsurance Net As of 01 January 409,370,419 (109,410,082) 299,960, ,292,762 (46,048,233) 272,244,529 Policy premium for the current year 845,595,266 (142,483,661) 703,111, ,743,673 (259,246,098) 622,497,575 Costs for bonuses and discounts (37,104,750) - (37,104,750) (30,676,883) - (30,676,883) Earned premiums in the current year (804,855,608) 178,748,832 (626,106,776) (759,989,133) 195,884,249 (564,104,884) As of 31 December 413,005,327 (73,144,911) 339,860, ,370,419 (109,410,082) 299,960,337
62 60 As of and for the year ended 31 December 2016 (All amounts expressed in Denar, unless otherwise stated) Gross technical provisions (continued) Movement in unearned premium, provision for claims and provisions for bonuses and discounts in 2016: Insurance against accident Insurance of motor vehicles Health insurance Insurance of aircrafts Insurance of vessels Insurance of goods in transport Insurance of property against fire Other insurance of property Third party liability insurance Aircraft liability insuranc e Vessels liability insuran ce General liability insurance Fin. losses Tourist assistanc e Total Provisions for unearned premiums 48,946,505 4,998,057 38,317,146 2,023,592 93, ,976 35,751,761 64,770, ,663, , ,402 26,736, ,266 8,321, ,005,327 Reinsurance unearned premiums (304,583) (3,202,864) (522,868) (2,057,816) - - (12,224,368) (39,354,540) - (608,738) - (14,869,134) ,144,911 Net unearned premiums (less reinsurance unearned premiums) 48,641,922 1,795,193 37,794,278 (34,224) 93, ,976 23,527,393 25,415, ,663, , ,402 11,867, ,266 8,321, ,860,416 Provision for claims 50,564, ,756 25,249, ,522 31,277,637 32,861, ,149, ,954,405-4,005, ,285,544 Provisions for bonuses and discounts 24,036, ,036,667 Change in provisions for claims IBNR part for reinsurance (3,800,837) (11,725,446) (15,526,283) Change in provisions for claims RBNS part for reinsurance (2,177,560) (13,093,763) (23,828,597) (105,412) (39,205,332) Net provisions for claims (less reinsurance transferable part) 68,622, ,756 25,249, ,522 6,458,428 9,033, ,044, ,954,405-4,005, ,590, ,264,280 1,910,949 63,043,979 (34,224) 93, ,498 29,985,821 34,449, ,707, , ,402 16,821, ,266 12,327, ,451,012
63 61 As of and for the year ended 31 December 2016 (All amounts expressed in Denar, unless otherwise stated) Gross technical provisions (continued) Movement in unearned premium, provision for claims and provisions for bonuses and discounts in 2016: Insurance against accident Health insurance Insurance of motor Insurance of Insurance of vehicles aircrafts vessels Insurance of goods in transport Insurance of property against fire Other insurance of property Third party liability insurance Aircraft liability insurance Vessels liability insurance General liability insurance Fin. losses Tourist assistan ce Total Provisions for unearned premiums 37,272,674 1,818,293 33,239,860 2,320,105 68, ,923 31,423,351 95,432, ,411, , ,745 27,242,431 16,770 8,032, ,370,419 Reinsurance unearned premiums (278,121) (1,814,328) (524,495) (2,320,470) - - (12,452,384) (75,514,898) - (685,102) - (15,820,284) - (109,410,082) Net unearned premiums (less reinsurance unearned premiums) 36,994,553 3,965 32,715,365 (365) 68, ,923 18,970,967 19,917, ,411,485 (734) 141,745 11,422,147 16,770 8,032, ,960,337 Provision for claims 47,572,172-23,947,722-1,111, ,785 15,544,445 8,701, ,393, ,977,664-4,308, ,679,443 Provisions for bonuses and discounts 24,248, ,248,368 Change in provisions for claims IBNR part for reinsurance (2,818,625) (8,611,828) (11,430,453) Change in provisions for claims RBNS part for reinsurance (607,245) (80,000) - (2,171,497) (2,858,742) Net provisions for claims (less reinsurance transferable part) 68,394,670-23,947,722-1,111, ,785 6,852,617 8,701, ,222, ,977,664-4,308, ,638, ,389,223 3,965 56,663,087 (365) 1,179, ,708 25,823,584 28,619, ,633,608 (734) 141,745 16,399,811 16,770 12,340, ,598,953
64 62 As of and for the year ended 31 December 2016 (All amounts expressed in Denar, unless otherwise stated) 2.13 Deferred and current tax liabilities Deferred tax liabilities - - Current tax liabilities 4,864,862 3,916,449 4,864,862 3,916, Liabilities Liabilities based on coinsurance and reinsurance premiums 13,040,154 8,239,715 Co-insurers payables 3,240,300 1,666,126 Other insurance liabilities from direct insurance operations 17,792,712 13,334,614 Other insurance liabilities from direct insurance operations 7, ,149 Other liabilities 20,125,944 20,360,929 54,206,110 43,723, Accruals Accruals for reinsurance 42,097,867 89,997,884 Accruals for brokers 1,140, ,730 Other accruals 3,914,086 1,485,553 47,151,971 92,023,167
65 63 As of and for the year ended 31 December 2016 (All amounts expressed in Denar, unless otherwise stated) 3. Information and disclosures to the Income Statement (the Statement of comprehensive income) 3.1 Earned premium Earned premiums as of 31 December 2016 Gross policy insurance premiums Change in gross provisions for unearned premiums Gross reinsurance policy premiums Change in gross provisions for unearned premiums Part for reinsurance (Note 2.5) Net income from insurance premiums Insurance against consequences of an accident 121,445,469 (11,673,831) (16,539,007) 26,462 93,259,093 Health insurance 11,558,353 (3,179,764) (5,492,900) 1,388,536 4,274,225 Insurance of motor vehicles 81,599,315 (5,077,286) (1,051,513) (1,627) 75,468,889 Insurance of aircrafts 5,698, ,512 (5,790,571) (262,654) (58,045) Insurance of vessels 202,125 (24,872) ,253 Insurance of goods in transport 2,532,131 12, ,545,078 Insurance of property against fire 87,840,469 (4,328,410) (45,211,528) (228,016) 38,072,515 Other insurance of property 73,264,064 30,662,382 (21,086,005) (36,160,358) 46,680,083 Third party liability insurance 372,665,714 (10,251,606) (10,849,063) - 351,565,045 Aircraft liability insurance 2,014,166 (145,544) (1,790,881) (76,364) 1,377 Vessels liability insurance 263,320 12, ,663 General liability insurance 57,939, ,130 (34,672,193) (951,150) 22,822,678 Financial losses 331,508 (154,496) ,012 Insurance for tourist assistance 28,240,073 (289,413) ,950,660 Вкупно 845,595,266 (3,634,908) (142,483,661) (36,265,171) 663,211,526
66 64 Information and diclosures to the Income statement (the Statement of comparehensive income) (continued) As of and for the year ended 31 December 2016 (All amounts expressed in Denar, unless otherwise stated) Earned premium (continued) Earned premiums as of 31 December 2015 Gross policy insurance premiums Change in gross provisions for unearned premiums Gross reinsurance policy premiums Change in gross provisions for unearned premiums Part for reinsurance (Note 2.5) Net income from insurance premiums Insurance against consequences of an accident 99,366,341 (3,141,604) (8,274,847) 41,246 87,991,136 Health insurance 2,948,404 (445,543) (3,075,601) 441,578 (131,162) Insurance of motor vehicles 70,800,927 7,391,276 (1,051,871) 524,495 77,664,827 Insurance of aircrafts 6,476, ,824 (6,476,682) (341,312) (26,829) Insurance of vessels 133,053 35, ,120 Insurance of goods in transport 3,110,743 (26,514) (686,784) - 2,397,445 Insurance of property against fire 78,898,960 3,606,230 (44,475,221) (3,346,629) 34,683,340 Other insurance of property 192,872,230 (67,547,385) (146,838,936) 64,960,898 43,446,807 Third party liability insurance 342,043,359 (27,863,808) (10,341,494) - 303,838,057 Aircraft liability insurance 1,989,370 (26,783) (1,991,971) 22,450 (6,934) Vessels liability insurance 272,220 (33,062) ,158 General liability insurance 55,987,692 (3,621,097) (36,032,691) 1,059,123 17,393,027 Loan insurance 26,750 (16,770) - - 9,980 Insurance for tourist assistance 26,817, , ,114,803 Total 881,743,673 (91,077,649) (259,246,098) 63,361, ,781, Investment income Investment income 4,115,644 5,033,696 Interest income from government bonds and government bills 18,038,852 21,678,106 Interest income from term deposits in banks Interest income from current accounts in banks 31,364 2,734 Interest income from loans given 625, ,633 Interest income from GF 22,812,518 27,263,903 Foreign exchange gains 122, ,515 Foreign exchange gains 122, ,515 Other investment income 2,420,689 2,812,723 Interest income from government bills 962,120 58,000 Dividends 3,382,809 2,870,723 Realized gains from investments sold (stakes) 429, ,036 26,746,853 31,127,177
67 65 Information and diclosures to the Income statement (the Statement of comparehensive income) (continued) As of and for the year ended 31 December 2016 (All amounts expressed in Denar, unless otherwise stated) 3.3 Other insurance technical income, less reinsurance Reinsurance commissions 18,277,398 23,333,915 Income from GF from realised subrogation receivables and fee for processing claims 4,271,260 5,449,225 Income from companies for processing claims service claims 986, ,150 Income from claims and compensation bonuses of claims 7,264,406 - Other 2,205, ,457 33,004,782 30,523, Other income Interest income and income from court collected receivables 2,054,538 2,057,349 Other income 2,689,653 2,538,373 4,744,191 4,595,722
68 66 Information and diclosures to the Income statement (the Statement of comparehensive income) (continued) As of and for the year ended 31 December 2016 (All amounts expressed in Denar, unless otherwise stated) 3.5 Incurred claims Gross Reinsurance Net Incurred, paid claims in the current year 279,711, ,231,843 30,230,053 72,920, ,481, ,311,366 Changes in provisions of incurred, reported claims 77,427,540 (27,165,864) 36,346,590 (42,500,719) 41,080,950 15,334,855 Changes in provisions of incurred, but not reported claims (20,821,439) (6,427,682) 4,095,830 (759,012) (24,917,269) (5,668,670) Income from subrogation receivables (10,539,455) (8,321,366) - - (10,539,455) (8,321,366) Incurred claims (expenses for claims, net) 325,777, ,316,931 70,672,473 29,660, ,105, ,656,185
69 67 Information and diclosures to the Income statement (the Statement of comparehensive income) (continued) As of and for the year ended 31 December 2016 (All amounts expressed in Denar, unless otherwise stated) Incurred claims (continued) Analysis of incurred claims as of 31 December 2016 Total paid claims Changes in gross provisions for claims Participation of reinsurers in paid claims Participation of reinsurers in changes in provisions for claims Income from gross realised subrogation receivables Net Insurance against consequences of an accident 71,591,024 2,991,916 (11,493,494) (2,552,527) - 60,536,919 Health insurance 405, , ,130 Insurance of motor vehicles 38,993,971 1,301, (3,083,869) 37,212,081 Insurance of aircrafts Insurance of vessels 1,353,923 (1,111,233) ,690 Insurance of goods in transport 99,510 (16,263) ,247 Insurance of property against fire 13,553,525 15,733,192 (1,954,041) (16,127,381) - 11,205,295 Other insurance of property 32,641,815 24,160,306 (16,782,518) (23,828,597) - 16,191,006 Third party liability insurance 110,887,442 13,756,362-2,066,085 (7,455,586) 119,254,303 Aircraft liability insurance Vessels liability insurance General liability insurance 2,537,757 (33,547) ,504,210 Loan insurance Insurance for tourist assistance 7,646,882 (292,367) ,354,515 Total 279,711,223 56,606,101 (30,230,053) (40,442,420) (10,539,455) 255,105,396 Analysis of incurred claims as of 31 December 2015 Total paid claims Changes in gross provisions for claims Participatio n of reinsurers in paid claims Participatio n of reinsurers in changes in provisions for claims Income from gross realised subrogation receivables Net Insurance against consequences of an accident 60,868,884 (5,106,528) (3,078,184) 777,078-53,461,250 Insurance of motor vehicles 11, ,096 Insurance of aircrafts 45,234,866 2,101, (2,067,488) 45,268,645 Insurance of vessels Insurance of goods in transport - 497, ,523 Insurance of property against fire 34,502 18, ,706 Other insurance of property 10,505,739 2,666,108 (5,182,839) 776,841-8,765,849 Third party liability insurance 11,334, , ,523,510 Aircraft liability insurance 112,762,246 5,810, (6,248,838) 112,324,363 Vessels liability insurance General liability insurance Loan insurance 65,911,364 (40,115,371) (64,659,454) 41,705,812-2,842,351 Insurance for tourist assistance (5,040) (5,040) Total 7,569, , ,913,932 Insurance against consequences of an accident 314,231,843 (33,593,546) (72,920,477) 43,259,731 (8,321,366) 242,656,185
70 68 Information and diclosures to the Income statement (the Statement of comparehensive income) (continued) As of and for the year ended 31 December 2016 (All amounts expressed in Denar, unless otherwise stated) 3.6 Change in other technical provisions, net reinsurance Change in other gross technical provisions (211,701) 2,394,069 (211,701) 2,394, Costs for bonuses and discounts, net reinsurance During 2016 total costs for bonuses and discounts in the amounted to Denar 37,104,750 refers to costs for bonuses in the amount of Denar 5,940,654 and costs for discounts in the amount of Denar 31,164,096 (2015: Denar 30,676,882 of which the costs for bonuses are in amount of Denar 6,737,414 and costs for discounts are in amount of Denar 23,939,468). 3.8 Insurance acquisition costs, net Acquisition costs Salaries for employees sale 75,681,631 64,934,858 Commission 46,126,987 37,827,484 Advertisement 10,878,763 9,754,585 Printed policies 2,125,994 2,997,377 External representation 7,494,793 5,392,008 Change in deferred acquisition costs (14,713,090) (8,361,148) 127,595, ,545,164 The table below shows the change in deferred acquisition costs for the years ended 31 December 2016 and 2015: Deferred costs for premiums acquisition (movement) 9,475,152 3,950,434 Deferred costs for premiums brokers (movement) 5,237,938 4,410,714 Movement of deferred acquisition costs for policy premiums 14,713,090 8,361,148 Administrative costs Employees costs 51,005,249 51,185,543 -administration salaries 48,438,553 48,775,187 -other employees costs 2,566,696 2,410,356 Rents 29,962,153 30,443,958 Rents of assets for operations 689,434 1,145,162 Board of Directors costs 41,587,891 28,559,198 Phone costs 6,833,116 6,364,828 Sponsorship and representation 12,290,472 10,255,023 Depreciation of tangible and intangibles assets 5,778,994 5,187,997 Services to individuals 11,278,474 7,927,508 Fee for use of own vehicle 6,181,835 4,380,762 Utilities 3,478,287 3,869,353 Security costs 1,954,008 1,964,628 Bank charges 3,024,191 2,641,600 Office materials and consumables 1,621,895 1,678,551 Other administrative costs 25,142,270 21,043,627 Administrative costs 200,828, ,647,738
71 69 Information and diclosures to the Income statement (the Statement of comparehensive income) (continued) As of and for the year ended 31 December 2016 (All amounts expressed in Denar, unless otherwise stated) Insurance acquisition costs, net (continued) Employee s expenses Salaries expenses in the Company are separately recorded, the part of the salaries in sales is part of the acquisition costs and the salaries for the employees in the administration in valuation and in liquidation of claims are presented as administrative costs. Liabilities related to salaries and contributions of the Company are presented in total Net salaries 83,661,056 76,478,410 Contributions 40,459,128 37,231, ,120, ,710, Other insurance technical expenses, less reinsurance Expenses for claims paid to GF for NN vehicles 11,758,372 10,191,799 Fire fight contribution 8,020,213 8,170,699 Health insurance contribution 3,726,125 3,421,149 Insurance Supervision agency contribution 5,577,954 6,268,365 Expenses for National Insurance Bureau 3,601,984 3,183,818 Subrogation costs from NIB 1,261,184 1,233,593 Other expenses 1,503,545 1,467,772 35,449,377 33,937, Value adjustments on receivables based on premium Impairment provision of receivables from insurers (7,553,302) (3,950,681) Collected written-off receivable (6,276) (15,534) Permanent write off of receivables from insurers (Note 2.7) 10,219,868 2,081,496 2,660,290 (1,884,719) 3.11 Other expenses, including value adjustments Impairment provision of other receivables from direct works 5,392,656 2,874,053 Write-off of Other receivables from insurance direct operations 123,186 - Other financial expenses 1,681, ,061 7,197,048 3,853,114
72 70 Information and diclosures to the Income statement (the Statement of comparehensive income) (continued) As of and for the year ended 31 December 2016 (All amounts expressed in Denar, unless otherwise stated) 3.12 Tax expense Current tax expenses (income tax) 14,245,503 10,816,359 Deferred income tax ,245,503 10,816,359 The reconciliation of the total tax expense in the Income Statement for the years ended 31 December 2016 and 2015 is as follows: Profit before tax 61,836,675 60,071,473 Non-deductible expenses for tax purposes 84,224,388 53,202,878 Tax base 146,061, ,274,351 Decrease of tax base - Dividends 962,120 58,000 - Repayment of a part of a loan which increased the tax base for the previous period - 1,000,000 -Amount of carried investments out of the profit (reinvested) 2,643,912 4,052,759 Tax base after deductions 142,455, ,163,592 Calculated income tax 14,245,503 10,816,359 Decrease of tax base purchase of fiscal cash registers - - Calculated tax expense 14,245,503 10,816,359 Effective tax rate Earnings per share The basic earnings per share is calculated by dividing the profit attributable to shareholders of ordinary shares by the weighted average number of ordinary shares during the year: Earning attributable to shareholders 47,591,172 49,255,114 Less: dividends for preference shares - - Net earnings attributable to holders of ordinary shares 47,591,172 49,255,114 Weighted average number of ordinary shares 3,200 3,200 Basic earnings per share (Denars per share) 14,872 15,392
73 71 As of and for the year ended 31 December 2016 (All amounts expressed in Denar, unless otherwise stated) 4. Receivables and liabilities from companies in a group subsidiaries, associates and joint controlled entities Transactions with Gofi Group The Shareholder of the Company GOFI - GROUP OF FINANCE AND INVESTMENT SA, SWITZERLAND, is also a shareholder in other legal entities, including companies and financial institutions that jointly referred to as the Gofi Group. As of 31 December 2016 and during the year transactions with related parties were as follows: Key management personnel Other related parites Total Total Assets 963, ,667, ,631,833 Receivables 963,962 13,303,702 14,267,664 - Receivables from insurers based on insurance premiums 502, , ,848 - Receivables from subrogation Receivables from investments Other receivables 461,273 13,165,543 13,626,816 Investments - 226,102, ,102,928 - Given deposits - 226,102, ,102,928 Off-balance sheet records - 10,261,241 10,261,241 - Guarantees and other forms of warranty - 10,261,241 10,261,241 Total Liabilities 2,345,735 11,064,841 13,410,576 Liabilities 2,345, ,600 3,149,335 - Liabilities towards insurers for claims, insurance amounts and other agreed amounts - 135, ,149 - Liabilities from financial investments Other liabilities 2,345, ,451 3,014,186 Off-balance sheet records - 10,261,241 10,261,241 - Guarantees and other forms of warranty - 10,261,241 10,261,241 Total Revenues 832,350 12,752,204 13,584,554 Total Expenses - 26,133,583 26,133,583 Short-term benefits for key management personnel 32,079,049-32,079,049
74 72 Receivables and liabilities from companies in a group subsidiaries, associates and joint controlled entities (continued) As of and for the year ended 31 December 2016 (All amounts expressed in Denar, unless otherwise stated) Transactions with Gofi Group (continued) As of 31 December 2015 and during the year transactions with related parties were as follows: Key management personnel Other related parites Total Assets 487, ,477, ,965,074 Receivables 487,167 23,469,711 23,956,878 - Receivables from insurers based on insurance premiums 376, , ,779 - Receivables from subrogation Receivables from investments - 169, ,150 - Other receivables 111,066 23,106,883 23,217,949 Investments - 250,300, ,300,000 - Given deposits - 250,300, ,300,000 Off-balance sheet records - 9,708,196 9,708,196 - Guarantees and other forms of warranty - 9,708,196 9,708,196 Total Liabilities 2,227,255 10,641,835 12,869,090 Liabilities 2,227, ,639 3,160,894 - Liabilities towards insurers for claims, insurance amounts and other agreed amounts Liabilities from financial investments Other liabilities 2,227, ,639 3,160,894 Off-balance sheet records - 9,708,196 9,708,196 - Guarantees and other forms of warranty - 9,708,196 9,708,196 Total Revenues 829,386 16,384,989 17,214,375 Total Expenses - 55,064,226 55,064,226 Short-term benefits for key management personnel 30,462,383-30,462,383 Total Transactions with the National Insurance Bureau Investments in joint controlled entities 18,122,999 17,353,339 Receivables from the National Insurance Bureau 822, ,353 Liabilities to the National Insurance Bureau - 6,150 Income from investments 625, ,633 Income from claims proceedings 316, ,750 Income from realized subrogation receivables 3,954,535 5,172,475 Expenses 16,621,540 14,609,210
75 73 As of and for the year ended 31 December 2016 (All amounts expressed in Denar, unless otherwise stated) 5. Data for index of claims, index of expenses and combined index of claims by classes of insurance In accordance with the Rulebook on minimal standards for calculation of the technical reserves issued by the Insurance Supervision Agency of the Republic of Macedonia, the Company calculates the index of claims, the index of expenses and the combined index. Index of claims The annual index of claims under class of insurance represent the ratio between claims incurred and net earned premiums for certain class of insurance, expressed as decimal rounded to four decimals. The following table shows the index of claims for Annual index of claims for the period Index of claims with effect of reinsurance Index of claims without effect of reinsurance accident 01 88,6% 92,8% health 02 14,5% 7,4% motor vehicles (Casco) 03 62,8% 62,0% railways vehicles (Casco) 04 0,0% 0,0% aircrafts (Casco) 05 0,0% 0,0% vessels (Casco) ,1% 161,1% goods in transport (Cargo) 07 4,4% 4,4% property against fire and other dangers 08 34,6% 41,3% property other 09 40,8% 64,2% АО (total) 10 46,4% 44,3% aircraft liability 11 0,0% 0,0% vessel liability 12 0,0% 0,0% general liability 13 13,3% 5,2% loans 14 0,0% 0,0% quarantees 15 0,0% 0,0% financial losses 16 0,0% 0,0% legal protection 17 0,0% 0,0% tourist assistance 18 47,8% 47,8% Total 51,3% 50,5%
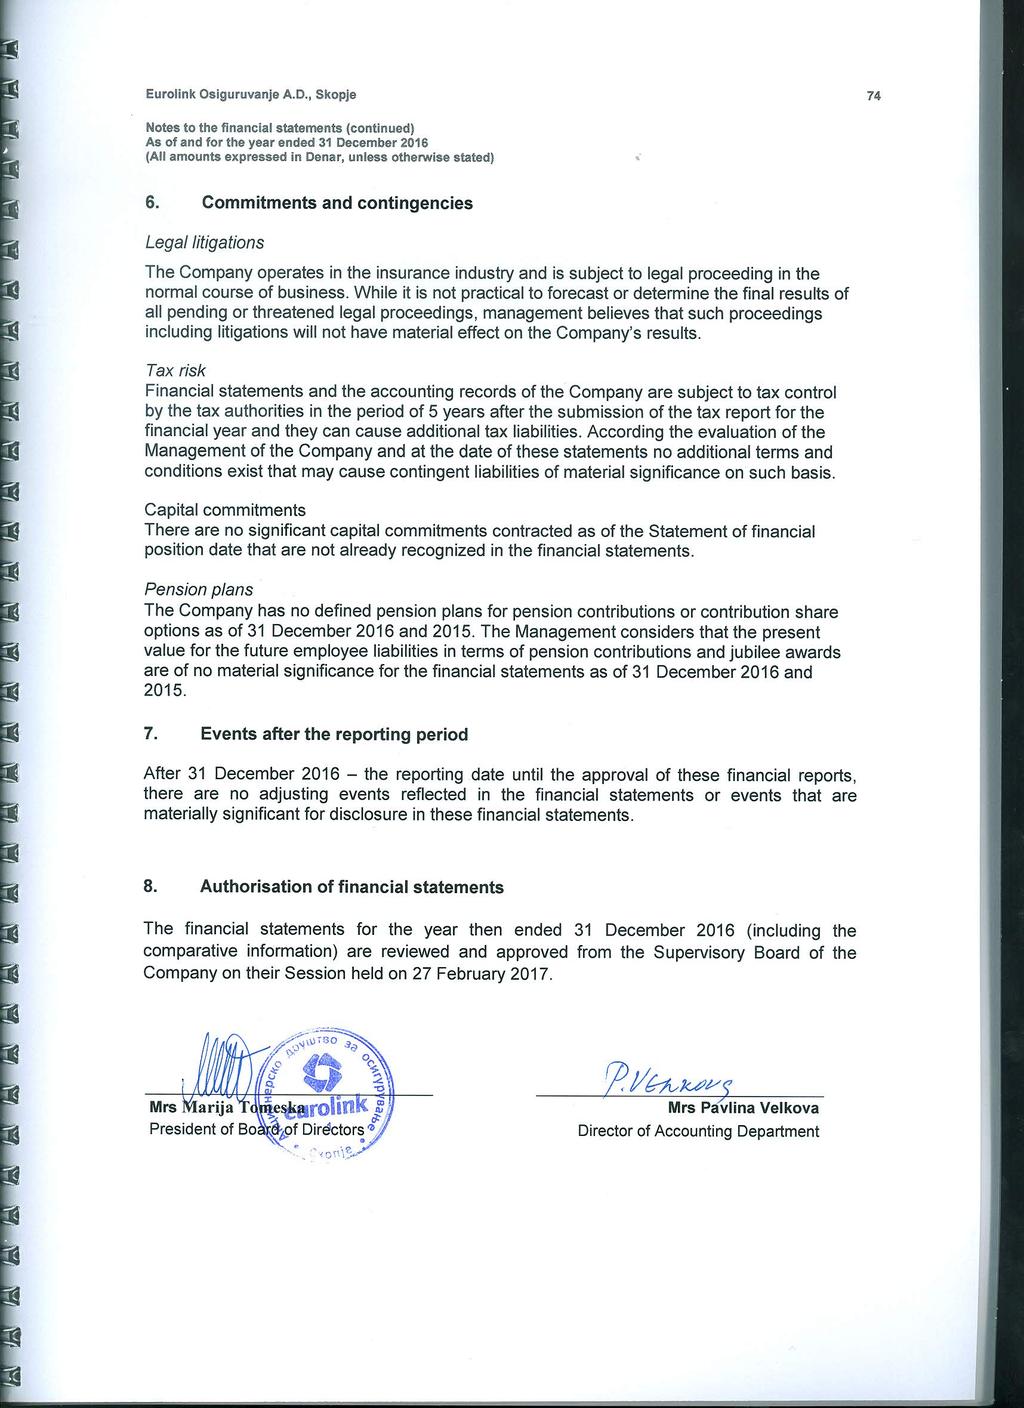
76
EUROLINK Osiguruvanje A.D., Skopje
 Financial Statements and Independent Auditor s Report EUROLINK Osiguruvanje A.D., Skopje 31 December 2017 This is an English translation of the original Report issued in Macedonian, in case of any discrepancies
ALBSIG AD, Skopje. Financial Statements and Independent Auditors Report. 31 December 2012
 Financial Statements and Independent Auditors Report 31 December 2012 This is an English translation of the original Report issued in Macedonian, in case of any discrepancies between the English and Macedonian
TTK BANKA AD Skopje. Financial Statements and Independent Auditors Report. 31 December 2011
 Financial Statements and Independent Auditors Report TTK BANKA AD Skopje 31 December 2011 This is an English translation of the original Report issued in Macedonian, in case of any discrepancies between
Eurostandard Banka AD, Skopje
 Financial statements and Independent Auditors Report Eurostandard Banka AD, Skopje 31 December 2012 This is an English translation of the original Report issued in Macedonian, in case of any discrepancies
INDEPENDENT AUDITOR S REPORT AND FINANCIAL STATEMENTS FOR THE PERIOD ENDING 31 DECEMBER 2013 (According IFRS) Skopje, March 2014
 Skopje, March 2014") INDEPENDENT AUDITOR S REPORT AND FINANCIAL STATEMENTS FOR THE PERIOD ENDING 31 DECEMBER 2013 (According IFRS) Skopje, March 2014 These reports are translation from the official ones issued on macedonian
INDEPENDENT AUDITOR S REPORT AND FINANCIAL STATEMENTS FOR THE PERIOD ENDING 31 DECEMBER 2013 (According IFRS) Skopje, March 2014 These reports are translation from the official ones issued on macedonian
Eurostandard Banka AD, Skopje
 Financial Statements and Independent Auditors Report Eurostandard Banka AD, Skopje 31 December 2011 This is an English translation of the original Report issued in Macedonian, in case of any discrepancies
Universal Investment Bank AD Skopje. Financial Statements for the year ended 31 December 2007
 for the year ended 31 December 2007 Contents Auditors' report Balance sheet 1 Income statement 2 Statement of changes in equity 3 Statement of cash flows 4 Notes to the financial statement 5 Income
Universal Investment Bank AD Skopje. Financial Statements for the year ended 31 December 2010
 for the year ended 31 December 2010 Contents Independent Auditors' report Statement of financial position 1 Statement of comprehensive income 2 Statement of changes in equity 3 Statement of cash flows
Financial statements and Independent Auditors Report. TTK Banka AD Skopje. 31 December 2010
 Financial statements and Independent Auditors Report TTK Banka AD Skopje 31 December 2010 This is an English translation of the original Report issued in Macedonian, in case of any discrepancies between
Consolidated Financial Statements and Independent Auditors Report. Eurostandard Banka A.D., Skopje. 31 December 2010
 Consolidated Financial Statements and Independent Auditors Report Eurostandard Banka A.D., Skopje 31 December 2010 Contents Page Independent Auditors Report 1 Consolidated Income Statement 3 Consolidated
Eurostandard Banka AD, Skopje
 Financial reports and Independent Auditors Report Eurostandard Banka AD, Skopje This is an English translation of the original Report issued in Macedonian, in case of any discrepancies between the English
EUROSTANDARD Banka AD Skopje. Consolidated Financial Statements for the year ended 31 December 2007
 Consolidated Financial Statements for the year ended 31 December 2007 Contents Auditors' report Financial Statements Consolidated balance sheet 2 Consolidated income statement 3 Consolidated statement
Alpha Bank AD Skopje. Financial Statements for the year ended 31 December 2007
 for the year ended 31 December 2007 Contents Auditors' report Balance sheet 2 Income statement 3 Statement of changes in equity 4 Statement of cash flows 5 Notes to the financial statement 6 Balance sheet
Financial Statements and Independent Auditors Report. Eurostandard Banka AD, Skopje. 31 December 2008
 Financial Statements and Independent Auditors Report Eurostandard Banka AD, Skopje 31 December 2008 Eurostandard Banka AD Skopje Contents page Independent Auditors Report 1 Income Statement 2 Balance Sheet
UNIVERSAL INVESTMENT BANK AD - Skopje. INDEPENDENT AUDITOR S REPORT AND FINANCIAL STATEMENTS FOR THE PERIOD ENDING 31 DECEMBER 2017 (According IFRS)
") UNIVERSAL INVESTMENT BANK AD - Skopje INDEPENDENT AUDITOR S REPORT AND FINANCIAL STATEMENTS FOR THE PERIOD ENDING 31 DECEMBER 2017 (According IFRS) Skopje, March 2018 Universal Investment Bank, AD Skopje
UNIVERSAL INVESTMENT BANK AD - Skopje INDEPENDENT AUDITOR S REPORT AND FINANCIAL STATEMENTS FOR THE PERIOD ENDING 31 DECEMBER 2017 (According IFRS) Skopje, March 2018 Universal Investment Bank, AD Skopje
Financial statements and independent auditor s report. Sileks Banka ad, Skopje. 31 December 2007
 Financial statements and independent auditor s report Sileks Banka ad, Skopje 31 December 2007 Sileks Banka ad, Skopje Contents Page Independent Auditor s Report 1 Statement on income 3 Balance sheet 4
Financial statements and Independent Auditor's Report. Ohridska Banka A.D., Ohrid. 31 December 2009
 Financial statements and Independent Auditor's Report Ohridska Banka A.D., Ohrid 31 December 2009 Contents Page Independent Auditors Report 1 Income statement 3 Statement of comprehensive income 4 Statement
Union Bank of Nigeria Plc
 Union of Nigeria Plc IFRS Consolidated Financial Statements IFRS Consolidated Financial Statements For the interim period ended 30 June 2012 UNION BANK OF NIGERIA PLC Consolidated and Separate Statements
Financial Statements and Independent Auditors' Report. Universal Investment Bank AD, Skopje. 31 December 2013
 Financial Statements and Independent Auditors' Report Universal Investment Bank AD, Skopje 31 December 2013 Universal Investment Bank, AD Skopje Contents Page Independent Auditors Report 1 Statement of
31 December Financial Statements and Independent Auditor s Report. STOPANSKA BANKA AD Bitola
 Financial Statements and Independent Auditor s Report STOPANSKA BANKA AD Bitola 31 December 2017 This is an English translation of the original Report issued in Macedonian, in case of any discrepancies
Financial statements as at
 as at This version of our report is a translation from the original, which was prepared in Croatian language. All possible care has been taken to ensure that the translation is an accurate representation
Financial statements as at
 Financial statements as at 31 December 2011 Contents Management Board's Report 1 Responsibilities of the Management and Supervisory Board for the preparation and approval of the annual financial statements
QATAR REINSURANCE COMPANY LIMITED BERMUDA CONSOLIDATED FINANCIAL STATEMENTS AND INDEPENDENT AUDITOR S REPORT FOR THE YEAR ENDED DECEMBER 31, 2016
 BERMUDA CONSOLIDATED FINANCIAL STATEMENTS AND INDEPENDENT AUDITOR S REPORT FOR THE YEAR ENDED DECEMBER 31, 2016 CONSOLIDATED FINANCIAL STATEMENTS AND INDEPENDENT AUDITOR S REPORT INDEX Page Independent
UNIVERZAL BANKA a.d. Beograd FINANCIAL STATEMENTS FOR THE YEAR ENDED 31 DECEMBER 2007
 UNIVERZAL BANKA a.d. Beograd FINANCIAL STATEMENTS FOR THE YEAR ENDED 31 DECEMBER 2007 TABLE OF CONTENTS Independent Auditors Report 1 Income statement 2 Balance sheet 3 Cash Flow Statement 4 Statement
Consolidated Financial Statements of ANGOSTURA HOLDINGS LIMITED. December 31, 2014 (Expressed in Trinidad and Tobago Dollars)
") Consolidated Financial Statements of (Expressed in Trinidad and Tobago Dollars) Consolidated Statement of Comprehensive Income Year ended (Expressed in Trinidad and Tobago Dollars) Restated Notes 2014
Consolidated Financial Statements of (Expressed in Trinidad and Tobago Dollars) Consolidated Statement of Comprehensive Income Year ended (Expressed in Trinidad and Tobago Dollars) Restated Notes 2014
JSC «AsiaСredit Bank (АзияКредит Банк)» Financial Statements for the year ended 31 December 2010
» Financial Statements for the year ended 31 December 2010") JSC «AsiaСredit Bank (АзияКредит Банк)» Financial Statements for the year ended 31 December Contents Independent Auditors Report Statement of Comprehensive Income 5 Statement of Financial Position 6 Statement
JSC «AsiaСredit Bank (АзияКредит Банк)» Financial Statements for the year ended 31 December Contents Independent Auditors Report Statement of Comprehensive Income 5 Statement of Financial Position 6 Statement
QATAR REINSURANCE COMPANY LIMITED (PREVIOUSLY KNOWN AS QATAR REINSURANCE COMPANY LLC) BERMUDA
 BERMUDA") (PREVIOUSLY KNOWN AS QATAR REINSURANCE COMPANY LLC) BERMUDA CONSOLIDATED FINANCIAL STATEMENTS AND INDEPENDENT AUDITOR S REPORT FOR THE YEAR ENDED DECEMBER 31, 2015 CONSOLIDATED FINANCIAL STATEMENTS AND
(PREVIOUSLY KNOWN AS QATAR REINSURANCE COMPANY LLC) BERMUDA CONSOLIDATED FINANCIAL STATEMENTS AND INDEPENDENT AUDITOR S REPORT FOR THE YEAR ENDED DECEMBER 31, 2015 CONSOLIDATED FINANCIAL STATEMENTS AND
UNIVERZAL BANKA A.D. BEOGRAD
 UNIVERZAL BANKA A.D. BEOGRAD FINANCIAL STATEMENTS FOR THE YEAR ENDED 31 DECEMBER 2009 Univerzal banka a.d. Beograd TABLE OF CONTENTS Page Independent Auditors Report 1 Income statement 2 Balance sheet
Fast Retailing Co., Ltd. Consolidated Financial Statements for the year ended 31 August 2016
 Fast Retailing Co., Ltd. Consolidated Financial Statements for the year ended CONSOLIDATED STATEMENT OF FINANCIAL POSITION FAST RETAILING CO., LTD. and consolidated subsidiaries and 2015 Millions of yen
Financial statements and Independent auditor's report. Central Cooperative Bank AD, Skopje. 31 December 2009
 Financial statements and Independent auditor's report Central Cooperative Bank AD, Skopje 31 December 2009 Contents Page Independent Auditor Report 1 Income Statement 3 Balance Sheet 4 Statement of Changes
Financial Statements prepared in accordance with International Financial Reporting Standards
 Financial Statements prepared in accordance with International Financial Reporting Standards For the year ended 31 December 2012 Financial statements for the year ended 31 December 2012 Contents Independent
Tirana Bank sh.a. Financial Statements as of and for the year ended 31 December 2016
 Financial Statements as of and for the year ended 31 December 2016 TABLE OF CONTENT AUDITOR S REPORT STATEMENT OF PROFIT OR LOSS AND OTHER COMPREHENSIVE INCOME 8 STATEMENT OF FINANCIAL POSITION 9 STATEMENT
Financial Statements and Independent Auditors Report. Eurostandard Banka AD, Skopje. 31 December 2009
 Financial Statements and Independent Auditors Report Eurostandard Banka AD, Skopje 31 December 2009 Eurostandard Banka AD Skopje Content Page Independent Auditors Report 1 Income Statement 3 Balance sheet
Financial Statements and Independent Auditors Report. TTK Bank s.c. Skopje. 31 December 2009
 Financial Statements and Independent Auditors Report TTK Bank s.c. Skopje 31 December 2009 Content Page Independent Auditors Report 3 Income statement 4 Balance sheet 6 Statement of changes in equity 9
ERSTE BANK A.D., NOVI SAD FINANCIAL STATEMENTS FOR THE YEAR ENDED 31 DECEMBER 2014
 FINANCIAL STATEMENTS FOR THE YEAR ENDED 31 DECEMBER 2014 ERSTE BANK a.d. NOVI SAD CONTENT Page Independent Auditors' Report 1 Income statement for the year ended 31 December 2014 2 Statement of comprehensive
NOTES TO THE GROUP ANNUAL FINANCIAL STATEMENTS FOR THE YEAR ENDED 30 SEPTEMBER 2014
 14 NOTES TO THE GROUP ANNUAL FINANCIAL STATEMENTS 1. ACCOUNTING POLICIES The financial statements are presented in South African Rand, unless otherwise stated, rounded to the nearest million, which is
Financial Statements and Independent Auditors Report. Stater Banka AD, Kumanovo. 31 December 2009
 Financial Statements and Independent Auditors Report Stater Banka AD, Kumanovo 31 December 2009 Stater Banka AD, Kumanovo Content Page Independent Auditors Report 1 Income Statement 4 Balance sheet 5 Statement
JSC ASIAСREDIT BANK (АЗИЯКРЕДИТ БАНК) Financial Statements for the year ended 31 December 2012
 Financial Statements for the year ended 31 December 2012") JSC ASIAСREDIT BANK (АЗИЯКРЕДИТ БАНК) Financial Statements for the year ended 31 December CONTENTS STATEMENT OF MANAGEMENT S RESPONSIBILITIES FOR THE PREPARATION AND APPROVAL OF THE FINANCIAL STATEMENTS
JSC ASIAСREDIT BANK (АЗИЯКРЕДИТ БАНК) Financial Statements for the year ended 31 December CONTENTS STATEMENT OF MANAGEMENT S RESPONSIBILITIES FOR THE PREPARATION AND APPROVAL OF THE FINANCIAL STATEMENTS
Orange Rules GUARANTY TRUST BANK PLC
 Orange Rules GUARANTY TRUST BANK PLC Contents Page Consolidated financial statements Consolidated statement of financial position 1 Consolidated statement of comprehensive income 2 Consolidated statement
Union Bank of Nigeria Plc IFRS Consolidated Financial Statements For the year ended 31 December 2011
 Union Bank of Nigeria Plc IFRS Consolidated Financial Statements For the year ended 31 December 2011 Draft for Discussion purposes only Consolidated and Separate Statements of Financial Position Group
Fast Retailing Co., Ltd. Consolidated Financial Statements for the year ended 31 August 2017
 Fast Retailing Co., Ltd. Consolidated Financial Statements for the year ended CONSOLIDATED STATEMENT OF FINANCIAL POSITION FAST RETAILING CO., LTD. and consolidated subsidiaries and 2016 Millions of yen
PUBLIC JOINT STOCK COMPANY JOINT STOCK BANK UKRGASBANK Financial Statements. Year ended 31 December 2011 Together with Independent Auditors Report
 PUBLIC JOINT STOCK COMPANY JOINT STOCK BANK UKRGASBANK Financial Statements Year ended 31 December 2011 Together with Independent Auditors Report Contents Independent Auditors Report Statement of financial
YIOULA GLASSWORKS S.A. AND SUBSIDIARIES NOTES TO THE CONSOLIDATED FINANCIAL STATEMENTS SEPTEMBER 30, 2012
 1. CORPORATE INFORMATION: Yioula Glassworks S.A., a corporation formed under the laws of the Hellenic Republic (also known as Greece), οn August 5, 1959, by Messrs Kyriacos and Ioannis Voulgarakis is the
Statement of profit or loss for the year ended 31 March 2018 (Expressed in United States dollars)
") Statement of profit or loss for the year ended 31 March 2018 (Expressed in United States dollars) Note Interest income 4(a) 32,407,110 29,988,115 Interest expense 4(b) (9,879,516) (7,319,963) Net interest
Statement of profit or loss for the year ended 31 March 2018 (Expressed in United States dollars) Note Interest income 4(a) 32,407,110 29,988,115 Interest expense 4(b) (9,879,516) (7,319,963) Net interest
Continuing operations Revenue 3(a) 464, ,991. Revenue 464, ,991
 464, ,991. Revenue 464, ,991") STATEMENT OF PROFIT OR LOSS For the year ended 30 June 2017 Consolidated Consolidated Note Continuing operations Revenue 3(a) 464,411 323,991 Revenue 464,411 323,991 Other Income 3(b) 4,937 5,457 Share
STATEMENT OF PROFIT OR LOSS For the year ended 30 June 2017 Consolidated Consolidated Note Continuing operations Revenue 3(a) 464,411 323,991 Revenue 464,411 323,991 Other Income 3(b) 4,937 5,457 Share
CONTENTS Consolidated Financial Statements INDEPENDENT AUDITORS REPORT
 2007 Consolidated Financial Statements CONTENTS INDEPENDENT AUDITORS REPORT Consolidated balance sheet...1 Consolidated income statement...2 Consolidated statement of changes in equity...3 Consolidated
The accompanying notes form an integral part of the financial statements.
 5 Statement of Profit or Loss and Other Comprehensive Income Year ended Notes $ 000 $ 000 Interest income: Interest on loans 185,459 158,179 Interest on deposits with banks 186,987 84,929 Interest on investment
Notes to the Accounts
 Notes to the Accounts 1. Accounting Policies Statement of compliance The Group financial statements consolidate those of the Company and its subsidiaries (together referred to as the Group ), equity account
UNITY BANK PLC Unaudited Management Accounts 31 March 2017
 UNITY BANK PLC Unaudited Management Accounts 31 March 2017 1.1 Corporate Information Unity Bank Plc provides banking and other financial services to corporate and individual customers. Such services include
UNITY BANK PLC UNAUDITED FINANCIAL STATEMENTS Jun-17
 UNITY BANK PLC UNAUDITED FINANCIAL STATEMENTS Jun-17 1.1 Corporate Information Unity Bank Plc provides banking and other financial services to corporate and individual customers. Such services include
Open Joint Stock Company Raiffeisen Bank Aval Consolidated Financial Statements
 Open Joint Stock Company Raiffeisen Bank Aval Consolidated Financial Statements Year ended 31 December Together with Independent Auditors Report Consolidated Financial Statements CONTENTS INDEPENDENT AUDITORS
CREDIT BANK OF MOSCOW (open joint-stock company) Consolidated Financial Statements for the year ended 31 December 2010
 Consolidated Financial Statements for the year ended 31 December 2010") CREDIT BANK OF MOSCOW (open joint-stock company) Consolidated Financial Statements Contents Independent Auditor s Report... 3 Consolidated Statement of Comprehensive Income... 4 Consolidated Statement
CREDIT BANK OF MOSCOW (open joint-stock company) Consolidated Financial Statements Contents Independent Auditor s Report... 3 Consolidated Statement of Comprehensive Income... 4 Consolidated Statement
AS PARITATE BANKA. Consolidated and Bank Annual Report for the year ended 31 December 2006
 Consolidated and Annual Report for the year ended 31 December 2006 CONTENTS Page REPORT OF THE COUNCIL AND THE MANAGEMENT BOARD 2 THE SUPERVISORY COUNCIL AND BOARD OF THE BANK 3 STATEMENT OF THE MANAGEMENT
INSURANCE COMPANY IC GROUP LLC
 INSURANCE COMPANY IC GROUP LLC with Independent Auditors' Report CONTENTS PAGE Statement of management s responsibilities 2 INDEPENDENT AUDITORS REPORT 3 CONSOLIDATED STATEMENT OF FINANCIAL POSITION 4
Consolidated Financial Statements of ANGOSTURA HOLDINGS LIMITED. December 31, 2017 (Expressed in Trinidad and Tobago Dollars)
") Consolidated Financial Statements of ANGOSTURA HOLDINGS LIMITED (Expressed in Trinidad and Tobago Dollars) Financial Statements C O N T E N T S Page Statement of Management Responsibilities 1 Independent
Consolidated Financial Statements of ANGOSTURA HOLDINGS LIMITED (Expressed in Trinidad and Tobago Dollars) Financial Statements C O N T E N T S Page Statement of Management Responsibilities 1 Independent
BANCA INTESA A.D. BEOGRAD
 FINANCIAL STATEMENTS FOR THE YEAR ENDED 31 DECEMBER 2011 TABLE OF CONTENTS PAGE INDEPENDENT AUDITOR S REPORT 1 INCOME STATEMENT 2 BALANCE SHEET 3 STATEMENT OF CHANGES IN EQUITY 4 CASH FLOW STATEMENT 5-6
STRUCTURED CONNECTIVITY SOLUTIONS (PTY) LTD (Registration number 2002/001640/07) Historical FInancial Information for the year ended 31 August 2012
 LTD (Registration number 2002/001640/07) Historical FInancial Information for the year ended 31 August 2012") STRUCTURED CONNECTIVITY SOLUTIONS (PTY) LTD Historical FInancial Information for the year ended 31 August 2012 Index The reports and statements set out below comprise the historical financial information
STRUCTURED CONNECTIVITY SOLUTIONS (PTY) LTD Historical FInancial Information for the year ended 31 August 2012 Index The reports and statements set out below comprise the historical financial information
Financial Statements and Independent Auditors Report. Poshtenska Banka AD, Skopje. 31 December 2009
 Financial Statements and Independent Auditors Report Poshtenska Banka AD, Skopje 31 December 2009 Contents Page Independent Auditors Report 1 Income Statement 3 Balance Sheet 4 Statement of Changes in
TOTAL ASSETS 417,594, ,719,902
 WABERER'S International NyRt. CONSOLIDATED STATEMENT OF FINANCIAL POSITION data in EUR Description Note FY 2014 FY 2015 restated NON-CURRENT ASSETS Property 8 15,972,261 17,995,891 Construction in progress
Notes to the financial statements
 11 1. Accounting policies 1.1 Nature of business Super Group Limited (Registration number 1943/016107/06), the holding Company of the Group (the Company), is a Company listed on the Main Board of the JSE
Accounting policies. 1. Introduction. 2. Basis of presentation. 3. Consolidation
 2 202 FirstRand Group annual financial statements Accounting policies 1. Introduction FirstRand Limited ( the Group ) is an integrated financial services company consisting of banking, insurance and asset
Notes to the accounts for the year ended 31 December 2012
 1 General information ( the Company ) is incorporated in Hong Kong and its shares are listed on The Stock Exchange of Hong Kong Limited. The address of the Company s registered office and principal place
JSC VTB Bank (Georgia) Consolidated financial statements
 Consolidated financial statements") Consolidated financial statements For the year ended 31 December 2017 together with independent auditor s report 2017 consolidated financial statements Contents Independent auditor s report Consolidated
Consolidated financial statements For the year ended 31 December 2017 together with independent auditor s report 2017 consolidated financial statements Contents Independent auditor s report Consolidated
HSBC Bank Armenia cjsc. Financial Statements for the year ended 31 December 2006
 Financial Statements for the year ended 31 December 2006 Contents Independent Auditor s Report 2 Income Statement 3 Balance Sheet 4 Statement of Cash Flows 5 Statement of Changes in Shareholders Equity
Notes to the financial statements
 1 General information ( the Company ) is incorporated in Hong Kong and its shares are listed on The Stock Exchange of Hong Kong Limited. The address of the Company s registered office and principal place
Abbreviated financial statement of Bank Zachodni WBK SA
 Abbreviated financial statement of Bank Zachodni WBK SA 1. Income statement of Bank Zachodni WBK S.A... 3 2. Balance sheet of Bank Zachodni WBK S.A.... 4 3. Movements on equity of Bank Zachodni WBK S.A...
Issued share capital. Share premium Retained earnings
 Unconsolidated statement of changes in equity for the three months ended 31 March 2011 unaudited Issued share capital Share premium Retained earnings Revaluation reserve Statutory reserve in BGN 000 Balance
Consolidated Financial Statements of ANGOSTURA HOLDINGS LIMITED. December 31, 2011 (Expressed in Trinidad and Tobago Dollars)
") Consolidated Financial Statements of ANGOSTURA HOLDINGS LIMITED (Expressed in Trinidad and Tobago Dollars) Limited and its subsidiaries (the Group), which comprises the consolidated statement of We have
Consolidated Financial Statements of ANGOSTURA HOLDINGS LIMITED (Expressed in Trinidad and Tobago Dollars) Limited and its subsidiaries (the Group), which comprises the consolidated statement of We have
Independent Auditor s report to the members of Standard Chartered PLC
 Financial statements and notes Independent Auditor s report to the members of Standard Chartered PLC For the year ended 31 December We have audited the financial statements of the Group (Standard Chartered
Doha Insurance Company Q.S.C.
 FINANCIAL STATEMENTS 31 December 2014 STATEMENT OF INCOME For the year ended 31 December 2014 Notes Gross premiums 533,715,317 516,669,468 Reinsurers share of gross premiums (403,053,662) (410,411,989)
Ameriabank cjsc. Financial Statements for the year ended 31 December 2012
 Financial Statements for the year ended 31 December Contents Independent Auditors Report... 3 Statement of comprehensive income... 4 Statement of financial position... 5 Statement of cash flows... 6 Statement
ALAHLI TAKAFUL COMPANY (A SAUDI JOINT STOCK COMPANY)
") ALAHLI TAKAFUL COMPANY (A SAUDI JOINT STOCK COMPANY) FINANCIAL STATEMENTS AND INDEPENDENT AUDITORS REPORT FOR THE YEAR ENDED 31 DECEMBER 2018 ALAHLI TAKAFUL COMPANY (A SAUDI JOINT STOCK COMPANY) FINANCIAL
ALAHLI TAKAFUL COMPANY (A SAUDI JOINT STOCK COMPANY) FINANCIAL STATEMENTS AND INDEPENDENT AUDITORS REPORT FOR THE YEAR ENDED 31 DECEMBER 2018 ALAHLI TAKAFUL COMPANY (A SAUDI JOINT STOCK COMPANY) FINANCIAL
GROUP FINANCIAL STATEMENTS 45
 GROUP FINANCIAL STATEMENTS 45 CONSOLIDATED STATEMENT OF FINANCIAL POSITION for the year ended 31 March 2010 at 31 March 2010 Notes 2010 2009 2010 2009 ASSETS N$ '000 N$ '000 N$ '000 N$ '000 Non-current
RBC Royal Bank (Trinidad and Tobago) Limited. Financial Statements 31 October 2011
 Limited. Financial Statements 31 October 2011") Financial Statements Contents Statement of Management Responsibilities Page 1 Independent Auditor's Report 2 Statement of Financial Position 3 Statement of Comprehensive Income 4 Statement of Changes in
Financial Statements Contents Statement of Management Responsibilities Page 1 Independent Auditor's Report 2 Statement of Financial Position 3 Statement of Comprehensive Income 4 Statement of Changes in
SPARKASE BANKA MAKEDONIJA AD Skopje. Financial Statements for Year ended December 31, 2015 and Independent Auditors Report
 Financial Statements for Year ended and Independent Auditors Report CONTENTS Page Independent Auditors Report 1-2 Income Statement 3 Statement of Comprehensive Income 4 Balance Sheet 5 Statement of Changes
Annual Financial Report KONAMI CORPORATION and its subsidiaries Consolidated Financial Statements For the fiscal year ended March 31, 2015
 Annual Financial Report KONAMI CORPORATION and its subsidiaries Consolidated Financial Statements For the fiscal year ended March 31, 2015 KONAMI CORPORATION TABLE OF CONTENTS 1. Consolidated Financial
Profit before income tax , ,366 Income tax 20 97,809 12,871 Profit for the year 209, ,237
 4 CITIBANK, N.A. JAMAICA BRANCH Statement of Profit or Loss and Other Comprehensive Income Year ended Notes $ 000 $ 000 Interest income: Interest on loans 304,394 279,843 Interest on deposits with banks
Open Joint Stock Company Raiffeisen Bank Aval Consolidated Financial Statements
 Open Joint Stock Company Raiffeisen Bank Aval Consolidated Financial Statements For the year ended 31 December Together with Independent Auditors Report Consolidated Financial Statements CONTENTS INDEPENDENT
Learn Africa Plc. Quarter 1 Unaudited Financial Statement 1 st January to 31 st March 2018
 Learn Africa Plc Quarter 1 Unaudited Financial Statement 1 st January to 31 st March 2018 1 Contents Statements of Accounting Policies 3 Statement of Comprehensive Income 11 Statement of Financial Position
FINANCIAL REPORT - Consolidated financial statements - Notes to the consolidated financial statements
 FINANCIAL REPORT - Consolidated financial statements 80 - Notes to the consolidated financial statements 86 - Statutory financial statements Euronav NV 147 Een Nederlandstalige versie van de geconsolideerde
Financial statements. Financial strength
 Financial statements Financial strength Consolidated Income Statement 66 Consolidated Statement of Comprehensive Income 67 Consolidated Statement of Financial Position 68 Consolidated Statement of Changes
Ardshinbank CJSC. Interim Financial Statements for the period ended 30 September 2016
 Interim Financial Statements for the period ended 30 September 2016 Contents Interim statement of profit or loss and other comprehensive income... 3 Interim statement of financial position... 4 Interim
Bank of Shanghai (Hong Kong) Limited. Directors Report and Consolidated Financial Statements for the year ended 31 December 2016
 Limited. Directors Report and Consolidated Financial Statements for the year ended 31 December 2016") Bank of Shanghai (Hong Kong) Limited Directors Report and Consolidated Financial Statements Year ended 31 December 2016 Contents Page(s) Report of the directors 1-3 Independent auditor s report 4-7 Consolidated
Bank of Shanghai (Hong Kong) Limited Directors Report and Consolidated Financial Statements Year ended 31 December 2016 Contents Page(s) Report of the directors 1-3 Independent auditor s report 4-7 Consolidated
Tekstil Bankası Anonim Şirketi and Its Subsidiaries
 TABLE OF CONTENTS Page ------ Independent Auditors Report Consolidated Statement of Financial Position 1 Consolidated Statement of Comprehensive Income 2-3 Consolidated Statement of Changes in Equity 4
Union Bank of Nigeria Plc
 Consolidated Interim Financial Statements For the period ended 31 March 2013 Table of Contents Consolidated financial statements Page Consolidated financial statements: Consolidated statement of financial
QUAYSIDE HOLDINGS LIMITED AND SUBSIDIARIES
 QUAYSIDE HOLDINGS LIMITED AND SUBSIDIARIES ANNUAL FINANCIAL STATEMENTS For the year ended 30 JUNE 2015 CONTENTS PAGE Auditor s Report 1 Income Statement 4 Statement of Comprehensive Income 5 Statement
FINANCIAL STATEMENTS CONSOLIDATED BALANCE SHEET PROVISIONS CONSOLIDATED INCOME STATEMENT TRADE AND OTHER PAYABLES 84
 56 AALBERTS INDUSTRIES N.V. ANNUAL REPORT 2015 1. CONSOLIDATED BALANCE SHEET 58 18. PROVISIONS 81 2. CONSOLIDATED INCOME STATEMENT 59 19. TRADE AND OTHER PAYABLES 84 3. CONSOLIDATED STATEMENT OF COMPREHENSIVE
Notes to the Financial Statements August 31, 2009
 annual report 2009 79 These notes form an integral part of and should be read in conjunction with the financial statements. 1. GENERAL INFORMATION The Company is incorporated and domiciled in Singapore.
Livestock Improvement Corporation Limited (LIC) ANNUAL REPORT. Year Ended 31 May 2014
 ANNUAL REPORT. Year Ended 31 May 2014") Livestock Improvement Corporation Limited (LIC) ANNUAL REPORT Year Ended 31 May 2014 Income Statement For the year ended 31 May 2014 In thousands of New Zealand dollars Note 2014 2013 2014 2013 Revenue
Livestock Improvement Corporation Limited (LIC) ANNUAL REPORT Year Ended 31 May 2014 Income Statement For the year ended 31 May 2014 In thousands of New Zealand dollars Note 2014 2013 2014 2013 Revenue
PASHA YATIRIM BANKASI A.Ş. FINANCIAL STATEMENTS AS AT 31 DECEMBER 2017 TOGETHER WITH INDEPENDENT AUDITOR S REPORT
 FINANCIAL STATEMENTS AS AT 31 DECEMBER 2017 TOGETHER WITH INDEPENDENT AUDITOR S REPORT CONTENTS Independent auditors review report Statement of financial position... 1 Statement of income... 2 Statement
GRIFOLS, S.A. Annual Accounts and Directors Report. 31 December (With Auditor's Report Thereon)
") Annual Accounts and Directors Report 31 December 2014 (With Auditor's Report Thereon) (Free translation from the original in Spanish. In the event of discrepancy, the Spanishlanguage version prevails)
Annual Accounts and Directors Report 31 December 2014 (With Auditor's Report Thereon) (Free translation from the original in Spanish. In the event of discrepancy, the Spanishlanguage version prevails)
NOTES TO THE FINANCIAL STATEMENTS For the year ended 31st December, 2013
 1. GENERAL Cosmos Machinery Enterprises Limited (the Company ) is a public limited company domiciled and incorporated in Hong Kong and its shares are listed on The Stock Exchange of Hong Kong Limited (the
FInAnCIAl StAteMentS
 Financial STATEMENTS The University of Newcastle ABN 157 365 767 35 Contents 106 Income statement 107 Statement of comprehensive income 108 Statement of financial position 109 Statement of changes in equity
STATEMENT OF COMPREHENSIVE INCOME
 FINANCIAL REPORT STATEMENT OF COMPREHENSIVE INCOME for the year ended 30 June 2014 Notes $ 000 $ 000 Revenue Sale of goods 2 697,319 639,644 Services 2 134,776 130,182 Other 5 1,500 1,216 833,595 771,042
Profit before income tax ,837 1,148,911. Income tax 21 ( 122,084) ( 382,521) Profit for the year 229, ,390
 ( 382,521) Profit for the year 229, ,390") 2 3 4 Statement of Comprehensive Income Year ended Notes $ 000 $ 000 Interest income: Interest on loans 170,781 113,931 Interest on deposits with banks 39,875 50,903 Interest on investment securities 451,678
2 3 4 Statement of Comprehensive Income Year ended Notes $ 000 $ 000 Interest income: Interest on loans 170,781 113,931 Interest on deposits with banks 39,875 50,903 Interest on investment securities 451,678
ALKALOID AD SKOPJE STAND ALONE FINANCIAL STATEMENTS FOR THE YEAR ENDED 31 DECEMBER 2010 AND INDEPENDENT AUDITORS REPORT
 ALKALOID AD SKOPJE STAND ALONE FINANCIAL STATEMENTS FOR THE YEAR ENDED 31 DECEMBER 2010 AND INDEPENDENT AUDITORS REPORT This is an English translation of the original report issued in Macedonian language
CREDIT BANK OF MOSCOW. Consolidated Financial Statements for the year ended 31 December 2009
 Consolidated Financial Statements Contents Independent Auditors Report... 3 Consolidated Statement of Comprehensive Income... 4 Consolidated Statement of Financial Position... 5 Consolidated Statement
KOMERCIJALNA BANKA AD SKOPJE. Consolidated financial statements and Independent Auditors Report for the year ended December 31, 2014
 Consolidated financial statements and Independent Auditors Report for the year ended CONTENTS Page Independent Auditors Report Consolidated statement of profit or loss and other comprehensive Income 1
Unconsolidated statement of shareholders equity for the six months ended 30 June 2010 unaudited in BGN 000 Issued share capital.
 Unconsolidated statement of shareholders equity for the six months ended 30 June 2010 unaudited in BGN 000 Issued share capital Share premium Retained earnings Revaluation reserve Statutory reserve Total
Notes to the Financial Statements
 Notes to the Financial Statements SAM Engineering & Equipment (M) Berhad is a public limited liability company, incorporated and domiciled in Malaysia and is listed on the Main Market of Bursa Malaysia