Results for announcement to the market 2. Appendix 4E compliance matrix 3. Annual Report of nib holdings limited 4
|
|
|
- Abner O’Connor’
- 5 years ago
- Views:
Transcription
1 ABN Preliminary final report for the year ended 30 June 2017 CONTENTS Results for announcement to the market 2 Appendix 4E compliance matrix 3 Annual Report of 4
2 Appendix 4E Results for announcement to the market Movement up / (down) Movement $m $m $m % Revenue from ordinary activities 2, , % Profit from ordinary activities after tax attributable to members % Net profit attributable to members % Amount per security (cps) Franking amount per security Interim Dividend Ordinary Dividend % Special Dividend % Total Interim Dividend % Final Dividend Ordinary Dividend ` % Special Dividend % Total Final Dividend % Record date for determining entitlements to the dividend Date the final dividend is payable 8 September October 2017 Brief explanation of figures reported above: Net profit after tax for the financial year ended 30 June 2017 calculated on a statutory basis equated to a profit of $119.6 million.
3 Appendix 4E Appendix 4E disclosure requirements nib group Appendix 4E Note Number 1. Details of the reporting period and the previous corresponding period All financial data headings 2. Key information in relation to the following: This information must be identified as Results for announcement to the market. 2.1 The amount and percentage change up or down from the previous corresponding period of revenue from ordinary activities. 2.2 The amount and percentage change up or down from the previous corresponding period of profit (loss) from ordinary activities after tax attributable to members. 2.3 The amount and percentage change up or down from the previous corresponding period of profit (loss) attributable to members. 2.4 The amount per security and franked amount per security of final and interim dividends or a statement that it is not proposed to pay dividends. 2.5 The record date for determining entitlements to the dividends (if any). 2.6 A brief explanation of any of the figures in 2.1 to 2.4 necessary to enable the figures to be understood. Results for announcement to the market page 2 Appendix 4E 3. A statement of comprehensive income together with note to the statement, prepared in compliance with AASB 101 Presentation of Financial Statements or the equivalent foreign accounting standard. Annual Report 30 June 2017: Consolidated Income Statement Notes to the Consolidated Financial Statements - Summary of significant accounting policies - Revenue and other income - Expenses - Income tax Note 1 Note 6 Note 7 Note 8a) 4. A statement of financial position together with notes to the statement. The statement of financial position may be condensed but must report as line items each significant class of asset, liability, and equity element with appropriate sub-totals. Annual Report 30 June 2017: Consolidated Balance Sheet Notes to the Consolidated Financial Statements - Deferred tax assets - Deferred tax liabilities - Cash and cash equivalents - Receivables - Financial assets at fair value through profit or loss - Deferred acquisition costs - Property, plant and equipment - Intangible assets - Payables - Borrowings - Outstanding claims liability Unearned premium liability and unexpired risk liability - Premium payback liability - Provisions for employee entitlements - Other liabilities - Contributed equity - Retained profits - Reserves Note 8b) Note 8c) Note 9 Note 10 Note 11 Note 12 Note 13 Note 14 Note 15 Note 16 Note 17 Note 18 Note 19 Note 20 Note 21 Note 22 Note 23 Note A statement of cash flows together with notes to the statement. The statement of cash flows may be condensed but must report as line items each significant form of cash flow and comply with the disclosure requirements of AASB 107 Statement of Cash Flows, or for foreign entities, the equivalent foreign accounting standard. Annual Report 30 June 2017: Consolidated Statement of Cash Flows Notes to the Consolidated Financial Statements - Notes to the statement of cash flows Note 9c) 6. A statement of retained earnings, or a statement of changes in equity, showing movements Annual Report 30 June 2017: Notes to the Consolidated Financial Statements - Retained profits Note 23
4 Appendix 4E 7. Details of individual and total dividends or distributions and dividend or distribution payments. The details must include the date on which the dividend or distribution is payable and (if known) the amount per security of foreign sourced dividend or distribution. Annual Report 30 June 2017: Notes to Consolidated Financial Statements - Dividends Note Details of any dividend or distribution reinvestment plan in operation and the last date for the receipt of an election notice for the participation in any dividend or distribution reinvestment plan. No dividend reinvestment plan. Not applicable 9. Net tangible assets per security with the comparative figure for the previous corresponding period. Net tangible asset backing per ordinary security (cents per share) is (36.92 as at 30 June 2016 amended for retrospective change in accounting policy) 10. Details of entities over which control has been gained or lost during the period, including the following: 10.1 Name of entity The date of the gain or loss of control Where material to the understanding of the report the contribution of such entities to the reporting entity s profit from ordinary activities during the period and the profit or loss of such entities during the whole of the previous corresponding reporting period. Annual Report 30 June 2017 Notes to the Consolidated Financial Statements - Business combination - Interest in other entities Note 32 Note Details of associates and joint venture entities including the following: 11.1 Name of the associate or joint venture entity Details of the reporting entity s percentage holding in each of these entities Where material to the understanding of the report aggregate share of profits (losses) of these entities, details of contributions to net profit for each of these entities, and with comparative figures for the previous corresponding reporting period. 12. Any other significant information needed by an investor to make an informed assessment of the entity s financial performance and financial position. Annual Report 30 June 2017: Notes to the Consolidated Financial Statements - Interest in other entities Note 33 Annual Report 30 June For foreign entities, which set of accounting standards is used in compiling the report (e.g. International Accounting Standards). Not applicable 14. A commentary on the results for the period. The commentary must be sufficient for the user to compare the information presented with equivalent information for previous periods. The commentary must include any significant information needed by an investor to make an informed assessment of the entity s activities and results, which would include but not be limited to discussion of the following: 14.1 The earnings per security and the nature of any dilution aspects Returns to shareholders including distributions and buy backs 14.3 Significant features of operating performance 14.4 The results of segments that are significant to an understanding of the business as a whole A discussion of trends in performance 14.6 Any other factors which have affected the results in the period or which are likely to affect results in the future, including those where the effect could not be quantified. Annual Report 30 June 2017: Operating and Financial Review Directors report Notes to the Consolidated Financial Statements - Earnings per share Notes to the Consolidated Financial Statements - Dividends Operating and Financial Review Notes to the Consolidated Financial Statements - Segment reporting Operating and Financial Review Notes to the Consolidated Financial Statements - Events occurring after the balance sheet date Note 26 Note 25 Note 5 Note 30
5 Appendix 4E 15. A statement as to whether the report is based on accounts which have been audited or subject to review, are in the process of being audited or reviewed, or have not yet been audited or reviewed. The financial report 30 June 2017 has been fully audited Independent auditor s report 16. If the accounts have not yet been audited or subject to review and are likely to be subject to dispute or qualification, a description of the likely dispute or qualification. Not applicable R Toms Date 18 August 2017 Company Secretary
6 nhf asx ANNUAL REPORT 2017 Celebrating 10 years on the Australian Securities Exchange
7 CONTENTS Page Group Performance Highlights 1 Operating and Financial Review 2 Directors Report 16 Auditor s Independence Declaration 23 Remuneration Report 24 Corporate Governance Statement 43 Financial Report Consolidated Income Statement 45 Consolidated Statement of Comprehensive Income 46 Consolidated Balance Sheet 47 Consolidated Statement of Changes in Equity 48 Consolidated Statement of Cash Flows 49 Notes to the Consolidated Financial Statements 50 Directors Declaration 122 Independent Auditor s Report to the Members 123 Shareholder Information 130 Corporate Directory 132 ABN
8
9 Operating and Financial Review CHAIRMAN S REPORT In my report last year I highlighted our ongoing success in growing our core Australian Residents Health Insurance (arhi) business and amplifying the portfolio of adjacent business we ve built in more recent years. It s a very deliberate business strategy supported by deep market insight, customer focus, measured risk-taking and a genuine belief in the role of innovation. FY17 was further evidence of the efficacy of our business strategy. It s pleasing how in weak market conditions our arhi business still managed to grow almost four times the market growth rate. It s a remarkable trend that for more than a decade arhi has consistently grown well ahead of the market. A genuine focus upon improving the customer experience partly explains this success. And as you will read further on it is good to see how initiatives like our new First Choice network for dentists and other ancillary providers has reduced out-of-pocket expenses for customers by an average of 10%. Our customer Net Promotor Score* jumping from 17.7% in the previous year to 23.2% was also a highlight. Organic growth in our international students/workers and World Nomads Group businesses was equally impressive. Although nib New Zealand finished the year slightly down on its stock of policyholders, this was attributable to a specific corporate account loss and our NZ business actually made significant progress in building its direct to consumer channel. The strong performance across the Group translated into another year of significant value creation. Underlying Operating Profit (UOP) of $153.7 million was 16.4% more than FY16 and Net Profit After Tax (NPAT) of $120.2 million 30.9% ahead. Return on Invested Capital of 22.7% beat last year s 19.0%. Importantly and consistent with our business strategy, the underlying operating earnings contribution from adjacent business have grown almost 190% over the past three years and accounted for 30.4% of total Group earnings in FY17. We think we can get this as high as 50% in the years to come. Apart from creating additional enterprise value, this part of our strategy is also diversifying risk. Shareholders can take comfort that we see managing risk at all levels in the business as supporting our ambitions. on a number of fronts and increasingly looking towards consumer empowerment. While there will never be a role for insurers contesting the advice of a doctor, we do want to put into consumers hands information they need to make better decisions around staying healthy, treatment options and choice of clinician. In November 2017 we will celebrate 10 years as an ASX listed company. We are very proud of our performance with Total Shareholder Return over the period of 1166% versus 32% for ASX200. It s a credit to all involved in the company, past and present. Yet we remain ambitious and open-minded about the future. As in the past, communities are going to demand more and more healthcare and the digital age will transform what consumers buy and how they buy it. Beyond our nearer term goals for growth and building enterprise value, we ll constantly examine new opportunities associated with this transformation. As shareholders expect, succession planning and ensuring we have the right skills mix, diversity and experience on our Board and in our senior management ranks remains a priority for the Board. As part of nib s succession planning Non-Executive Director Mr Harold Bentley announced he will retire from the Board in September Harold has been a Non-Executive Director with nib for ten years and on behalf of the Board I would like to thank him for his sound advice, commitment and dedication. He really has made a wonderful contribution especially in his role as Chairman of the Audit Committee. Finally, I take this opportunity to thank my fellow nib Directors, senior management and all our people across the nib Group for another successful year. I especially welcome Anne Loveridge to the Board. Anne, who joined us in February following Harold s announcement has impeccable credentials and is already making a significant contribution. Steve Crane Chairman Ultimately, how well we fulfil our mission of helping people access and afford world class healthcare determines our commercial results. In this way, growing our presence in the markets we operate in and the goal of creating enterprise value are totally aligned. FY17 was also another year of considerable discourse about private health insurance and affordability, especially in Australia. Affordability is a real issue and we insurers need to work even harder at slowing the rate of premium inflation. But pointing the finger at insurers alone ignores the fact that premium inflation is pre-eminently a story of healthcare cost inflation driven by a combination of people having more treatment and medical fee increases. As one example, in FY17 nib paid in excess of $75 million in benefits for public hospital admission, up more than 40% over the past five years. As such, affordability is an issue that demands a whole of system approach both in Australia and New Zealand. We have doctors and hospitals as good as anywhere in the world yet there remains too much evidence of over-servicing, fee variation and potentially avoidable hospital admissions. We re tackling these challenges * Based on arhi Insurance customers. 2
10 Operating and Financial Review continued MANAGING DIRECTOR S REPORT Chairman Steve has already touched upon some of the key highlights for FY17 and this annual report is replete with detail demonstrating what a terrific fiscal year we had. I m especially pleased about how much of the growth in all parts of the business (with the notable exception of nib Options) followed well-conceived and executed tactics. Our whitelabel partnerships with Qantas and Suncorp, building our international students services broker platform, cultivating international students to supply our international workers business and launching a direct to consumer channel in New Zealand are just a few examples. Hard wired in our culture is a philosophy the status quo is death and a belief we must perpetually experiment and adapt to evolving market conditions. Steve has already noted the high level of public, political and investor angst surrounding premium and cost inflation and its implications for private health insurance. To be sure, there is good cause for concern and I can t remember a stronger sense of urgency throughout the industry to rein in medical cost inflation. A good start would be to unwind some of the regulatory failures which force us to pay higher prices than we should for medical devices, place a floor price under hospital fees, prevent us from covering people for medical costs they incur outside a hospital and blunt sensible investment in better managing health outcomes and costs for customers. Like Steve I m looking forward to the future with great anticipation and expectation. We have many well developed plans either underway or in the pipeline and opportunities in healthcare are as plentiful as you ll find in the economy. As in the past, we ll be alert to new opportunities both within established business and beyond. And customers, investors and other key stakeholders can remain confident the pursuit of these will be customer centric, well researched and cognisant of reward versus to risk. My thanks to the Board of Directors, executive team and the almost 1,200 people who are the business we call nib. We speak often at nib about the importance of having the right people on the bus. As our FY17 results show, I m extremely confident that s the case. Mark Fitzgibbon Managing Director I m equally keen on finding ways to enhance the value proposition for consumers. Affordability is a relative concept influenced as much by consumers sense of utility as it is price. Giving consumers more reason to have private health insurance is crucial and drives our thinking around harnessing the digital age to deliver consumers, as Steve has already mentioned, information to help make better healthcare decisions. At the same time, we must accept that increasingly the communities we serve are going to rely on private healthcare funding and delivery due to an ageing population and an escalating dependency ratio of taxpayers to retired. Today about 10% of the entire Australian economy is devoted to healthcare 1 and Governments everywhere are simply running out of the fiscal capacity to pay for booming national healthcare spending (which for every OECD nation has for the past 50 years has in real terms grown at a rate of GDP plus 2%). It doesn t guarantee nib a future but for investors it certainly remains a powerful investment thesis. It also underscores the responsibility we in the private system have to make our spending all the more cost effective and sustainable. As a company, we fully acknowledge the pursuit of our mission brings with it a range of community, social, workplace and environmental responsibilities which we ve captured in this year s report (see our Sustainability section further in this report). 1. Source: WHO Global Health Expenditure Database 3
11 Operating and Financial Review continued OUR STRATEGIC PLAN We exist to help people access and afford world class healthcare when and where needed. OUR VALUE PROPOSITION Providing financial protection against ill health or injury; Ensuring the rapid availability of high quality healthcare products and services; and Assisting people to make better healthcare decisions through knowledge and choice. OUR VISION Our vision for nib is to be a leading financier and facilitator of healthcare with a reputation for product innovation, value for money, awesome customer service, being an employer of choice, a good corporate citizen and delivering strong shareholder returns. OUR KEY BUSINESS STRATEGIES nib s Business Strategy sets out three key levers which we believe will increase earnings and grow enterprise value. 1. Grow our core Australian Residents Health Insurance (arhi) business at a sustainable rate of 4% to 5% (net policyholder growth) with an emphasis upon segmentation and risk selection. 2. Leverage capabilities and assets within the Group to pursue adjacent business opportunities. 3. Create competitive advantage across the Group through constant innovation, agility and cultural alignment. We measure our success by Group revenue and earnings growth, customer satisfaction and total shareholder returns. 4
 (1,401.2) (1,334.1) 67.1 5.0 Gross margin 267.8 234.3 33.5 14.3 16.0% 14.9% Management expenses - marketing (58.5) (47.6) 10.9 22.9 3.5% 3.")
 of associates and joint ventures (0.3) - (0.3) NA (0.1%) 0.0% Underlying operating profit 107.0 94.5 12.5 13.2 6.4% 6.")

12 Operating and Financial Review continued AUSTRALIAN RESIDENTS HEALTH INSURANCE ($m) $m % Policyholder grow th 3.8% 3.8% Net premium revenue 1, , Net claims incurred (excluding claims handling expenses) (1,401.2) (1,334.1) Gross margin % 14.9% Management expenses - marketing (58.5) (47.6) % 3.0% Management expenses - other (102.6) (92.6) % 5.9% Underw riting result % 6.0% Other income % 0.0% Share of net profit / (loss) of associates and joint ventures (0.3) - (0.3) NA (0.1%) 0.0% Underlying operating profit % 6.0% Change nib s flagship Australian Residents Health Insurance business (arhi), has punched well above its weight for the 12 month period and was again an outstanding performer. nib s policyholder base grew 3.8% for the year, almost four-times the industry rate and accounted for more than 30% of total industry growth for the year. arhi UOP rose 13.2% to $107.0 million. We have been able to consistently achieve above-industry policyholder growth for more than a decade. We ve done so through a meaningful combination of deep consumer insight, product innovation, marketing and sales channel experimentation, world class customer service and a preparedness to invest in organic growth. The recent addition of the Suncorp and AAMI brands to our existing whitelabel distribution partners Apia and Qantas is just one example of the way we continue to innovate and challenge the status quo. Affordability and value are two of the major issues facing our customers when it comes to their private health insurance. That s why we worked hard to deliver an annual premium increase this year that is the lowest in 14 years, at 4.48% and under the industry average of 4.84%. We continue to do everything we can to keep a lid on costs, from not paying more than we should when our customers are treated in hospital, to passing on savings we ve made as a result of the reduction in prosthesis prices. These mean premium savings for our customers. We are also investing in and piloting initiatives to better manage our chronically ill customers. For example, our Healthy Weight for Life service is an outpatient knee and hip osteoarthritis management program designed to help our customers reduce joint pain as well as improve their mobility. Helping our customers access high quality health care is at the core of our thinking. We are taking a lead role within the industry to limit unnecessary expense and inefficiency as well as promote greater consumer transparency. There has been plenty of reporting over the past 18 months on prostheses costs. We believe health insurers are being charged too much at rates significantly higher than what public hospitals pay. We think that more can be done to lower prices on prosthetic and medical devices. And as we have clearly stated, nib will pass on all savings to our customers through lower premiums as and when prosthetic prices come down. Another major focus has been improving transparency and increasing the amount of information we can provide to our customers to help them make better, more informed decisions when it comes to their health care. Whitecoat, which can be best explained as the TripAdvisor for health care, is a leading example. We have big plans for deploying Whitecoat and other capabilities designed to help our customers. Over the next 12 months we will start publishing medical specialist costs and quality data that will make it easier for our customers to choose a specialist based on the fees they charge and the frequency they perform the procedure. We continue to place a very high emphasis on providing our customers with exceptional service by putting the customer at the heart of everything we do. We want to make routine transactions as seamless and easy as possible and eliminate any potential customer pain points. A key tool we use to gauge customer satisfaction is our Net Promoter Score (NPS), which measures customer support for nib after a recent enquiry. We take great pride in our efforts to improve our systems, and our investment in our people, which we know is paying off, our NPS for the year reached 23.2% up from 17.7% last year. 5
 (120.9) (121.0) (0.1) (0.1) Decrease in premium payback liability 4.3 15.8 (11.5) (72.8) Gross margin 82.7 68.")

13 Operating and Financial Review continued nib NEW ZEALAND ($m) $m % Policyholder grow th (5.2%) 25.8% Net premium revenue Net claims incurred (excluding claims handling expenses and movement in PPB liability) (120.9) (121.0) (0.1) (0.1) Decrease in premium payback liability (11.5) (72.8) Gross margin % 39.4% Management expenses - marketing (32.8) (26.9) % 15.5% Management expenses - other (26.4) (24.1) % 13.9% Underlying operating profit % 10.0% Change When we acquired our New Zealand operations in 2012, we set some ambitious performance hurdles aimed at shaking up the health insurance industry, growing the market and nib s overall share. We have had some strong gains since acquiring the business, a trend which continued this fiscal period. For FY17 premium revenue was $199.3 million up 14.9% and UOP grew 35.8% to $23.5 million, with this year s result also benefiting from the acquisition of OnePath NZ in FY16. While the result was impacted by the loss of a large corporate account in the second half of the year, we re not anticipating this will have a detrimental impact on future earnings and our long term prospects. Our whitelabel channel capability and pipeline continues to grow with partners such as the Automobile Association of New Zealand, The Warehouse Group and a network of ANZ wealth specialists. We re committing additional effort and investment to expand these channels over the coming 12 months. We have also enjoyed ongoing success with our approach to changing the way health insurance is traditionally purchased in New Zealand. Before we entered the market, most Kiwis with health insurance signed up through a financial advisor or were part of a group scheme with their employer. been impressive with more than half of our sales for the year coming through this channel. In addition, consumers are embracing our online sales portal with 70% of these sales completed online. Like many other countries, the New Zealand healthcare industry is subject to huge medical cost variation with no evidence of better quality care or outcomes. Cost variation is a huge driver of premium inflation, not to mention customer dissatisfaction and an area of opportunity for us to better manage claims costs. Our nib First Choice network is aimed at removing cost uncertainty by offering a network of medical professionals which provides customers with zero out-of-pocket costs. Available to customers from September 2017, First Choice will be a truly national network featuring providers from across New Zealand. It will also make claiming easier and faster with specialists and hospitals able to submit pre-approvals and claims on behalf of customers. Customer service is a high priority and we re making good progress. Our NPS, which asks customers whether they would recommend our services, rose to 12.2% in FY17. This compares very favourably to negative 33% back in Recognising an opportunity for disruption, we launched a directto-consumer health insurance offering in The results have 6
 (2.6) Net claims incurred (excluding claims handling expenses) (28.0) (41.7) (13.7) (32.9) Gross margin 46.8 35.1 11.7 33.3 62.6% 45.7% Management expenses - marketing (6.0) (4.1) 1.9 46.3 8.0% 5.")


14 Operating and Financial Review continued INTERNATIONAL AND NEW BUSINESS International (Inbound) Health Insurance ($m) $m % Policyholder grow th 28.5% 28.0% Net premium revenue (2.0) (2.6) Net claims incurred (excluding claims handling expenses) (28.0) (41.7) (13.7) (32.9) Gross margin % 45.7% Management expenses - marketing (6.0) (4.1) % 5.3% Management expenses - other (15.8) (14.0) % 18.2% Underw riting result % 22.1% Other income % 0.3% Underlying operating profit % 22.4% Australia s popularity as a destination for international students and workers shows no sign of abating with inbound travellers delivering a strong boost to our bottom line. Net policyholder sales for our international (inbound) health insurance business (iihi) were up an impressive 28.5% this year, which in turn lifted UOP by more than 47.7% to $25.4 million. The UOP result also benefited from the decision to not renew a large but unprofitable business account in FY16. In April, the federal Government announced changes to the 457 working visa scheme that are designed to restrict eligibility. While the changes are not helpful, we anticipate the impact on our iihi business will be minimal. Our efforts in recent years to expand into other visa classes has paid off and accounted for the majority of our sales in FY17. Overall, the outlook for our iihi business remains positive. We have a very strong distribution structure and pipeline of sales in place, which combined with stable margins will see this business continue to grow earnings. World Nomads Group ($m) $m % Other income Other expenses (50.1) (40.3) Underlying operating profit (2.2) (22.7) 13.0% 19.4% World Nomads Group (WNG), Australia s third largest travel insurer and global distributor has settled in well under our ownership, with a solid rise in gross written premiums for the year, up 17.5% to $131.8 million 1. Local and international policy sales exceeded 600,000 for the first time, rising 20.1% on last year to over 642,000. Over 40% of all sales came from international markets - the United States being the standout performer with policy sales up 35.0% to almost 100,000. Within the domestic market, we won a new agreement with one of Australia s largest travel agencies, Helloworld Travel. As we flagged to shareholders at the start of the year, there are very significant opportunities for us in the international travel insurance market. Capturing those opportunities requires investment which impacts short-term profitability. This explains UOP for the year falling to $7.5 million down from $9.7 million 1 last year. We expect to continue to invest in WNG in pursuit of growth and value creation, with this ambition to soften earnings in FY18 but that the longer term outlook is highly attractive. 1. World Nomads Group acquired 31 July 2015 with FY16 an 11 month result. Change Change 7
15 Operating and Financial Review continued INTERNATIONAL AND NEW BUSINESS continued Adjacent insurance lines and new business Our investment in adjacent business reflects a view that we have a brand, assets and capabilities that do well in other markets. It s also an important risk management strategy in as much as it reduces our dependency on the highly regulated arhi business. Following several years of investment, nib made the commercial decision during the year to close the nib Options business. nib Options was launched in 2014 in response to the growing demand for safe, reliable and affordable overseas medical treatment. But the business has unfortunately been unable to capitalise on this trend within the expected timeframe. 8
 (1,545.8) (1,481.0) 64.8 4.4 Gross margin 397.3 337.7 59.6 17.6 20.4% 18.6% Management expenses - marketing (97.4) (78.6) 18.8 23.9 5.0% 4.")
 of associates and joint ventures (0.3) - (0.3) NA Underlying operating profit 153.7 132.0 21.7 16.4 7.9% 7.3% Amortisation of acquired intangibles (7.6) (7.8) (0.2) (2.")
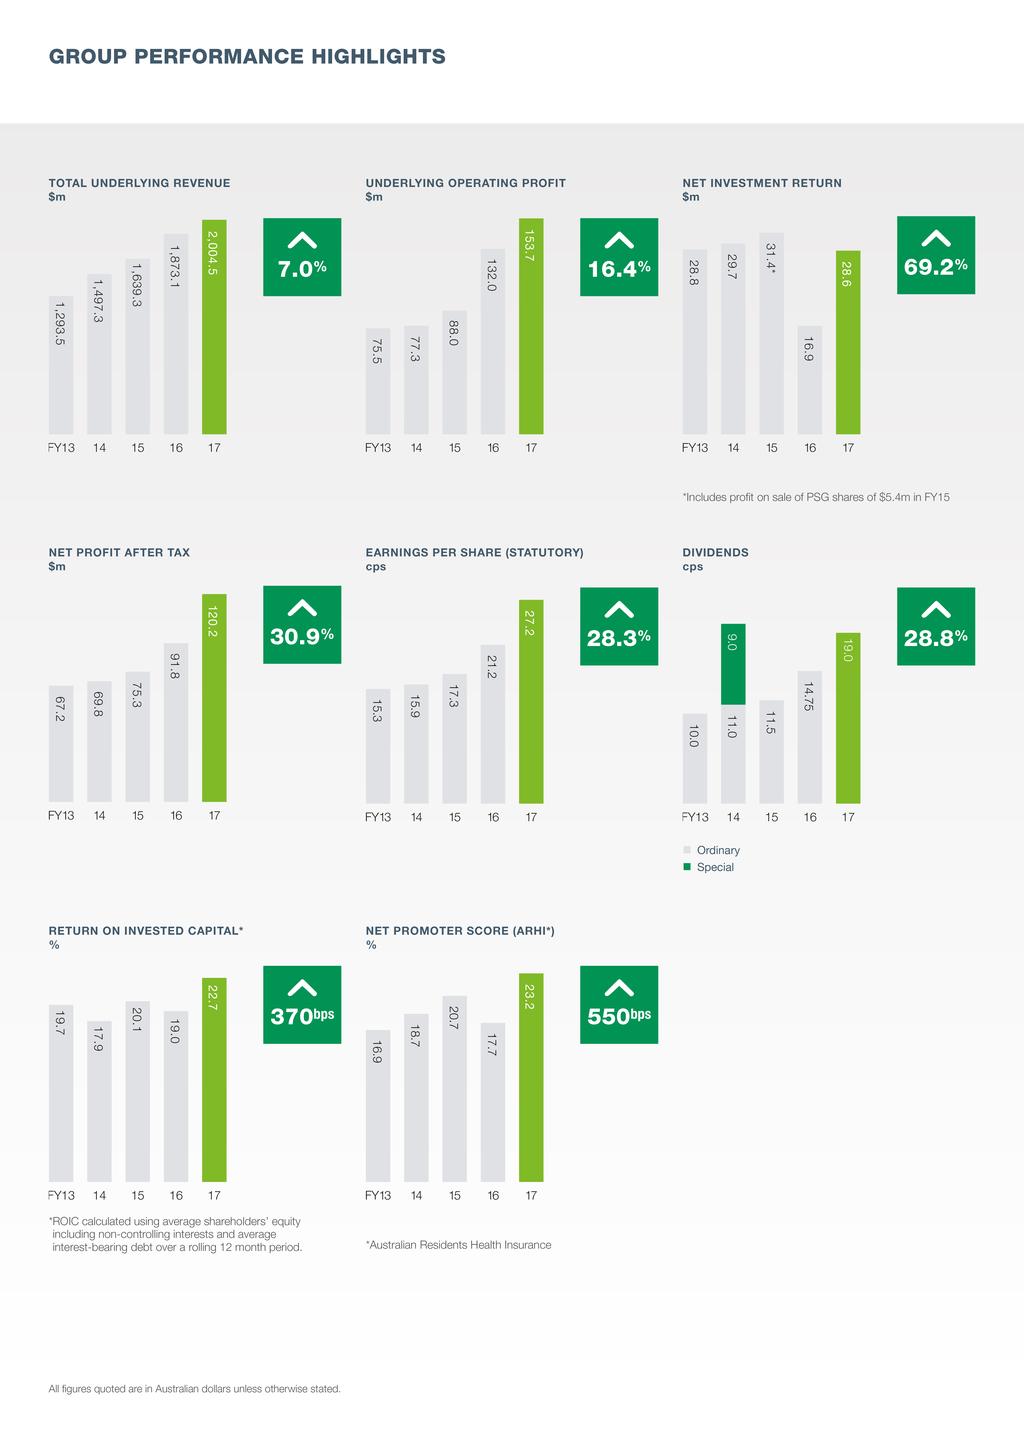
16 Operating and Financial Review continued PROFITABILITY AND SHAREHOLDER RETURN ($m) $m % Net premium revenue 1, , Net claims incurred (excluding claims handling expenses) (1,545.8) (1,481.0) Gross margin % 18.6% Management expenses - marketing (97.4) (78.6) % 4.3% Management expenses - other (144.7) (130.7) % 7.2% Underwriting result % 7.1% Other income Other expenses (62.6) (50.8) Share of net profit / (loss) of associates and joint ventures (0.3) - (0.3) NA Underlying operating profit % 7.3% Amortisation of acquired intangibles (7.6) (7.8) (0.2) (2.6) One-off transaction, merger, acquisition and new business implementation costs 4.5 (3.4) Statutory operating profit % 6.6% Finance costs (4.8) (5.3) Net investment income % 2.7% Profit before tax Tax (54.2) (40.6) NPAT Statutory EPS (cps) Underlying EPS (cps) ROIC (%) Operating cash flow Change November 2017 marks the tenth anniversary of nib s demutualisation and listing on the Australian Securities Exchange (ASX). A decade ago nib was predominantly a single-line, Australia-focused health insurance business with annual revenue of $666.0 million 1 and a debut share price of 85 cents. Today we are significantly more diverse with more than 30% of Group earnings coming from our non-australian residents health insurance businesses, annual underlying revenue of more than $2 billion and a share price which reached a high of $6.48 during the year. The journey has been a positive one for our shareholders who have seen their shares consistently outperform the S&P/ASX200 on a Total Shareholder Return basis. Anyone who invested $1,000 in nib shares at the time of the ASX listing would now have a holding valued 2 at more than $6,700. We have also returned to shareholders more than $160 million via a combination of special dividends and a Capital Return. Building a business which delivers strong sustainable returns for shareholders is integral to our strategy and will continue to be our primary focus. Turning to the 2017 full year results, our strategy of judicious growth and expansion along geographic and business lines proved highly successful. We also continue to benefit from a disciplined focus on operating efficiencies and customer service. Group revenue rose 7.0% to $2.0 billion and UOP increased by an impressive 16.4% to $153.7 million. Statutory operating profit 3 was up 24.7% to $150.6 million. We also generated strong returns from our equities investment portfolio which led to higher investment income of $28.6 million. This helped us report a record Net Profit After Tax (NPAT) of $120.2 million, up 30.9% on the previous year s result. Statutory earnings per share rose 28.3% to 27.2 cents per share. 1. Premium revenue for 12 months to 30 June Share price as at 30 June 2017 of $ The difference between UOP and statutory operating profit reflects one-off transactions and non-cash items associated with business acquisitions. 9
17 Operating and Financial Review continued PROFITABILITY AND SHAREHOLDER RETURNS continued ($m) $m % Assets Cash and cash equivalents Receivables Financial assets at fair value through profit or loss Deferred acquisition costs Assets classified as held for sale NA Property, plant and equipment (3.7) (23.9) Intangible assets (5.4) (2.4) Other assets Total assets 1, , Liabilities Payables Borrow ings Outstanding claims liability Unearned premium liability Premium payback liability (4.4) (16.1) Other liabilities Total liabilities Net assets Total equity Change Our gearing ratio (debt to debt-plus-equity) stood at 26.3% at 30 June 2017 below our target long term average gearing ratio of 30%, noting that for a significant transaction gearing may be above the 30% if necessary to affect the transaction. During the year current debt facilities were refinanced and covenants updated to be consistent with the market. The Group gearing ratio covenant increased to 45% from 35%. This level of gearing gives us the flexibility to use additional debt to pursue potential acquisition opportunities which meet our strategic and investment criteria. As well as using debt to fund acquisitions we may also look to raise equity if and when an investment opportunity arises. Based upon our strong financial results, the Board declared a full year dividend of 19.0 cents per share fully franked (FY16: cents per share). The full year dividend comprises an interim dividend of 8.5 cents per share (paid 3 April 2017) and a final dividend of 10.5 cents per share, payable to shareholders on 6 October The full year dividend represents a payout ratio of 70% of full year NPAT and is consistent with our policy to pay ordinary fully franked dividends between 60%-70% of full year NPAT. 10

18 Operating and Financial Review continued SUSTAINABILITY nib s approach to sustainability is driven by our commitment to fostering healthy futures for our customers, employees, shareholders, and the communities in which we operate. This year, nib concentrated on introducing a sustainability framework across the Group that was founded on research and engagement to make sure we focus on the issues relevant to our business and key stakeholders. A healthy system Health care spending accounts for approximately 10% of Gross Domestic Product (GDP) 1 in Australia and New Zealand. Private health insurance is a vital component in both markets. We take a keen interest in ensuring Government policy, industry practice and innovation adapts to the dynamic nature of healthcare systems. Strong, sustainable and equitable healthcare systems are good for the communities they serve and business. Serving our customers Private health insurance has its origins in financial protection in the event of illness or accident. For many, a serious illness or accident can be catastrophic both to their health and finances. In addition, we provide our customers with access to world class doctors, hospitals and other healthcare services without having to serve long waiting times typical of the public system. More recently, we have sought to add value for customers by offering a range of integrated healthcare management and preventative health programs to help people make better healthcare decisions. nib s establishment of the health provider comparator website Whitecoat is also a great example of empowering consumers in a health industry that is often confusing to navigate. Across the nib Group we promote the philosophy that commercial return only follows how well we do in meeting the needs of our customers. Customer satisfaction and delivering a great customer experience are central to the way we measure how we are doing as a business. Our customer satisfaction and advocacy Net Promoter Score has increased from 17.7% to 23.2% for our arhi business this year. Governing grounds nib s culture and values are sustained by ethical business practices, responsible decision making and good governance throughout the organisation. As detailed in nib s Corporate Governance Statement available at nib.com.au/shareholders, nib s Board and Management are committed to achieving and demonstrating the highest standards of corporate governance and ensuring compliance with the ASX Corporate Governance Council s Corporate Governance Principles and Recommendations. Creating a more sustainable supply chain nib s supply chain includes business partners, vendors, contractors and, importantly, the hospitals and healthcare providers that deliver services required by our customers. We re mindful of the downstream impacts of our procurement decisions, third-party labour conditions, as well as the need for our customers to have access to and choice for world class healthcare. We work with our partners and suppliers to make sure our sustainability values are aligned including compliance with applicable laws and standards of business ethics, health and safety and environment protection. Protecting our environment nib cares for the environment and is committed to pursuing opportunities to improve the environmental impact of our operations. As a good corporate citizen mindful of future generations, especially given the potential health impacts to individuals and communities due to climate change, we have a role to play in supporting carbon reducing initiatives. Our current activities are focused on improvements in energy efficiency and sustainable sourcing for our physical infrastructure. We partner with like-minded businesses and provide opportunities for our employees to participate in sustainable practices such as ongoing reduction in paper and waste, responsible recycling and facilitating transport programs such as carpooling. Fostering a healthy, inclusive and supportive workplace nib s employees are the key to our success and we want to provide a working environment that inspires them to do their very best now and in the future. This starts by attracting and recruiting great talent, helping people develop, engaging employees in our values and creating a culture of innovation. nib s approach to health, safety and wellbeing includes Work, Health and Safety policies and procedures as well as a Groupwide nibwell program facilitating access to preventative health services and interactive initiatives to support employees positive wellness strategies. We are committed to creating and ensuring an inclusive and diverse work environment in which everyone is treated fairly and with respect. We view our diversity as a strength that s consistent with our company mission and corporate responsibility. At nib, we have no room for arrogance, intemperance or bullying. 1. Source: WHO Global Health Expenditure Database 2. Net claims incurred (excluding claims handling), underwriting segments only. 3. Based on Australian Residents Health Insurance customers. 11

19 Operating and Financial Review continued SUSTAINABILITY continued Connecting with our communities We re sharing the power of our people, brands and resources to support healthy communities and fantastic causes. Our impact reaches the communities we operate in and beyond, ranging from grass roots level activities to international projects and partnerships. nib foundation continues to improve community health and wellbeing by supporting Australian charities to deliver effective and innovative health promotion and prevention programs. Since its establishment in 2008, nib foundation has provided $15.8 million in funding to 105 charity partners. The Small Steps payroll giving program conducted by WNG, with 42% participation from WNG employees, has resulted in more than $100,000 in donations to three charities since 2015 and includes 100% company matching for donations. Further nib sustainability information and downloads are available at nib.com.au/shareholders. This year, the foundation s Community Grants program funded 10 new programs that focus on supporting vulnerable youth and carers. In addition, its Multi-Year Partnerships continued to tackle the health and wellbeing challenges facing Australians to help them live healthier lives. We ve seen some great outcomes from our recently completed long-term partnerships including the: Gidget Foundation s development of a ground-breaking model of screening pregnant women for perinatal anxiety and depression in private hospitals; Delivery of Black Dog Institute s unique and engaging mental health awareness program, Headstrong 2.0, to almost 2,800 Australian secondary schools, helping to improve mental health literacy and reducing stigmatising attitudes among young participants; Pilot and expansion of CanTeen s new national counselling service, resulting in around 3,000 sessions each year that have supported young people affected by cancer; and Establishment by the Starlight Children s Foundation of the first of its kind in-hospital program, Livewire, that now delivers more than 30,000 creative sessions annually, providing invaluable social connections and positively impacting the wellbeing of hospitalised teens around Australia. Further, the foundation s annual employee-nominated Good Cause Grants program provided $5,000 funding boosts to five charities close to our employees hearts, while the Flexible Grants program was created to allow the foundation to respond in an agile way to needs as they arise. The Footprints Network was established by World Nomads Group (WNG) in 2006 to make a tangible difference to the lives of people living in impoverished communities. To date, the network funded by online customer transaction micro-donations, has enabled 1.34 million customers to raise more than $3.4 million for 173 projects around the world. nib s workplace fundraising program, Make A Difference (MAD) Committee, has continued to conduct a number of events and initiatives, with more than $66,000 raised in addition to in-kind donations in support of 42 charities since
20 Operating and Financial Review continued PRINCIPAL RISKS AND UNCERTAINTIES nib has established policies for the oversight and management of material business risks. Further information regarding how nib recognises and manages risk is detailed in Principle 7 of our Corporate Governance Statement. The Corporate Governance Statement and nib s Risk Policy are available on our website at nib.com.au Principal risks and uncertainties include: General economic conditions Claims inflation and fraud Performance of adjacent (non- Australian Residents Health Insurance) businesses Investment market performance Competition in the health insurance industry Pricing risk Risk equalisation special account arrangements Merger or acquisition opportunities Compliance with regulation Operational risk Loss of key personnel nib s performance is impacted by Australian economic conditions such as inflation, interest rates, consumer and business spending and employment rates which are outside nib s control. The environment in which nib operates may experience challenging conditions as a result of general uncertainty about future Australian and international economic conditions. nib is subject to significant claims inflation which may not be adequately covered by premium price increases and/or product design changes. Key sources of claims inflation risk include the renewal of key provider contracts on acceptable terms, service utilisation rates, services related to complex and members with high cost needs (usually with chronic diseases), claims leakage, provider and member fraud, public hospital claiming, as well as general provider behaviour, which results in a weakening of nib s gross margin and overall profitability. In recent years, in addition to focusing on its Australian regulated health insurance business, nib has diversified its business and identified adjacent earnings opportunities, such as International (Inbound) Health Insurance, New Zealand and World Nomads Group. These adjacent businesses now make a meaningful contribution to nib s operating result and as a result the performance of these businesses could significantly affect nib s profits. A substantial proportion of nib s profits are generated from its investment portfolio. Consequently, investment performance significantly affects nib s profits and financial position. The industry in which nib operates is competitive. The actions of competitors could result in a reduction in the rate of growth of nib, a decline in the number of people insured by nib and/or declining profit margins. Australian health insurance premium increases for existing products are required to be approved by the Minister for Health. Historically, nib and other health funds have only raised premiums once a year. There is a risk that nib s application for a change in its premium rates may only receive approval at a level lower than originally requested, or may be rejected by the Minister. Such an amendment or rejection may have a negative impact on nib s operating and financial performance. Risk equalisation arrangements apply to the registered health insurance industry in Australia. These arrangements replaced the previous reinsurance arrangements. Under these arrangements all registered health insurers effectively provide reinsurance support so that the industry as a whole shares the hospital costs of high risk groups irrespective of whether those claims are attributable to a policyholder of a particular fund. nib has a business strategy of pursuing merger and acquisition opportunities. The pursuit of merger and acquisition opportunities carries with it risks and there is no guarantee that such a strategy will be successful. nib is subject to a high degree of regulation concerning how private health insurers conduct their health insurance business. Private health insurers must be registered and must comply with a variety of obligations in relation to the conduct of that business including a requirement to have appointed actuaries, compliance with prudential, solvency and capital adequacy standards, exclusion of disqualified persons from management and a number of reporting and notification obligations. If nib does not comply with the regulatory requirements that apply to it, it may suffer a penalty, such as a fine or an obligation to pay compensation. In some cases, a regulator may cancel or suspend its authority to conduct business. A significant failure to comply with regulatory requirements may also give rise to adverse comment by the press and other industry commentators, negatively affecting nib s financial performance. nib is exposed to a variety of operational and general business risks. Exposure to unexpected financial and non-financial losses arising from the way in which nib conducts its business operations may have an adverse effect on earnings and assets of nib as well as its reputation. nib s success depends largely on its key personnel, including senior management. The inability to access and retain services of a significant number of such employees could disrupt nib s business. 13
21 Operating and Financial Review continued PRINCIPAL RISKS AND UNCERTAINTIES continued Tax treatment Technology Litigation and legal action Future events The Federal or State Governments may introduce further or increase taxes, duties (including stamp duty on insurance policies) or other imposts or introduce amendments to existing legislation which may result in an adverse impact on nib and the health insurance industry. The health insurance industry relies increasingly on technology to conduct an efficient and cost effective business. nib faces the risk, in common with other participants, that further technology changes will be required which could result in an increase in costs. In addition, information technology systems risks include complete or partial systems failure, lack of systems capacity, inadequacy to meet changing business requirements, inappropriate or unauthorised systems access and unsuccessful systems integrations. Any major failure or inadequacy in the information technology systems could materially affect nib s business. At any time, nib could be involved in civil proceedings in courts of various jurisdictions. nib may also be exposed to litigation in the future over claims which may affect its business. To the extent that these risks are not covered by nib s insurance policies, litigation or the costs of responding to these legal actions or suggested legal action could have a material adverse impact on nib s financial position, earnings and share price. It is not possible to predict or identify all future events which may impact adversely on nib s profitability or financial position. 14
22 Operating and Financial Review continued FIVE YEAR SUMMARY $m $m $m $m $m Consolidated Income Statement Net premium revenue 1, , , , ,290.4 Net claims incurred (1,545.8) (1,481.0) (1,367.1) (1,255.4) (1,089.6) Gross margin Management expenses (242.1) (209.3) (175.6) (157.9) (124.4) Underwriting result Other income Other expenses (62.6) (50.8) (8.5) (6.8) (4.0) Share of net profit / (loss) of associates and joint ventures (0.3) Underlying operating profit Amortisation of acquired intangibles (7.6) (7.8) (3.5) (4.2) (2.6) One-off transactions, merger, acquisition and new business implementation costs 4.5 (3.4) (2.8) (0.8) (3.6) Statutory operating profit Finance costs (4.8) (5.3) (3.4) (2.7) (1.4) Net investment income Profit before tax Tax (54.2) (40.6) (34.3) (29.4) (29.5) NPAT Consolidated Balance Sheet Total assets 1, , Equity Debt Share Performance Number of shares m Weighted average number of shares - basic m Weighted average number of shares - diluted m Basic earnings per share cps Diluted earnings per share cps Underlying earnings per share cps Share price at year end $ Dividend per share - ordinary cps Dividend per share - special cps Dividend payout ratio - ordinary % Dividend payout ratio - combined ordinary and special % Other financial data ROIC % Group underlying operating revenue $m 2, , , , ,293.5 Operating cash flow $m
23 Directors Report The Directors of (Company) present their report on the consolidated entity (Group) consisting of nib holdings limited and the entities it controlled at the end of or during the year ended 30 June DIRECTORS The following persons were Directors of during the whole of the financial year and up to the date of this report: Steve Crane Lee Ausburn Philip Gardner Donal O Dwyer Mark Fitzgibbon Harold Bentley Christine McLoughlin Annette Carruthers retired as a Director on 28 September Anne Loveridge was appointed as a Director on 20 February PRINCIPAL ACTIVITIES The principal continuing activities of the Group consisted of operating as a private health insurer for Australian residents, New Zealand residents and international students and visitors to Australia as well as specialising in the sale and distribution of travel insurance policies globally. Our vision is to be a leading financier and facilitator of healthcare with a reputation for product innovation, value for money, awesome customer service, being an employer of choice, a good corporate citizen and delivering strong shareholder returns. REVIEW OF OPERATIONS Information on the operations and financial position of the Group and its business strategies and prospects is set out in the Operating and Financial Review on pages 2 to 15 of this Annual Report. DIVIDENDS Dividends paid to shareholders during the financial year were as follows: $m $m Final dividend for the year ended 30 June 2016 of 9.0 cents ( cents) per fully paid share paid on 7 October Interim dividend for the year ended 30 June 2017 of 8.5 cents ( cents) per fully paid share paid on 3 April In addition to these dividends, since the end of the financial year the Directors have recommended the payment of a fully franked final dividend of $46.1 million (10.5 cents per fully paid ordinary share) to be paid on 6 October 2017 out of retained profits at 30 June Subject to franking credit availability, the Board s position is that future ordinary dividends will reflect a dividend payout ratio of 60% to 70% of earnings with additional capacity to pay special dividends as part of future capital management. MATTERS SUBSEQUENT TO THE END OF THE FINANCIAL YEAR No matter or circumstance has arisen since 30 June 2017 that has significantly affected, or may significantly affect: a) the Group s operations in future financial years; or b) the results of those operations in future financial years; or c) the Group s state of affairs in future financial years. SIGNIFICANT CHANGES IN THE STATE OF AFFAIRS There were no other significant changes in the state of affairs of the Group during the financial year. 16
24 Directors Report continued INFORMATION ON DIRECTORS Details of the qualifications, experience, special responsibilities and interests in shares and performance rights of the Directors are as follows: Steve Crane Chairman, Independent Non-Executive Director BCom, FAICD, SF Fin Experience and expertise A Director since 28 September 2010, appointed Chairman on 1 October Approximately 40 years of financial market experience, as w ell as an extensive background in publicly-listed companies. Previously the Chief Executive of BZW Australia and ABN AMRO. Other current directorships Director of APA Group, including APT Pipelines Limited and Chairman of the Taronga Conservation Society Australia. He is also Chairman of Global Valve Technology Limited and a consultant member of the Advisory Board w ith Morgans Financial Ltd. Former directorships in the last 3 years Chairman of IMAN Australian Health Plans Pty Limited. Director of Transfield Services Limited, Bank of Queensland Limited and formerly a member if the CIMB (Australia) Advisory Council. Subsidiary boards and special responsibilities Chairman of and nib health funds limited. Steve is also Chairman of the Nomination Committee. Interests in shares and performance rights Indirect: 250,000 ordinary shares in held by Depeto Pty Ltd. Mark Fitzgibbon Managing Director/Chief Executive Officer MBA, MA, ALCA, FAICD Experience and expertise Mark joined nib health funds limited in October 2002 as Chief Executive Officer (CEO) and led nib through its demutualisation and listing on the ASX in May 2007 w hen he w as appointed Managing Director of nib holdings limited. Other current directorships Director of Knights Rugby League Pty Limited. Former directorships in the last 3 years None. Subsidiary boards and special responsibilities Managing Director of. Director of nib health funds limited, nib health care services pty limited, nib servicing facilities pty limited, nib Global Pty Limited, IMAN Australian Health Plans Pty Limited, nib nz holdings limited, nib nz limited, nib Options Pty Limited, Realsurgeons Pty Limited, Realself Pty Limited and World Nomads Group Pty Limited. Mark is also a member of the Nomination Committee. Interests in shares and performance rights Direct: 1,365,217 ordinary shares in. Indirect: 660,621 ordinary shares in held by Fitz (NSW) Pty Ltd. 273,786 performance rights under FY14-FY17 Long Term Incentive Plan w hich may vest from 1 September ,714 performance rights under FY15-FY18 Long Term Incentive Plan w hich may vest from 1 September ,320 performance rights under FY16-FY19 Long Term Incentive Plan w hich may vest from 1 September ,980 performance rights under FY17-FY20 Long Term Incentive Plan w hich may vest from 1 September Lee Ausburn MPharm, BPharm, Dip Hosp Pharm, FAICD Independent Non-Executive Director Experience and expertise A Director since November With more than 30 years experience in pharmaceuticals, Lee is an experienced Non-Executive Director w ith a w ealth of know ledge in the global health industry. Other current directorships A Director of Australian Pharmaceutical Industries Ltd and SomnoMed Ltd. President of the Pharmacy Foundation at the University of Sydney. Former directorships in the last 3 years Director of IMAN Australian Health Plans Pty Limited. Subsidiary boards and special responsibilities A Director of nib health funds limited. Chairman of the People and Remuneration Committee and a member of the Risk and Reputation Committee and Nomination Committee. Interests in shares and performance rights Indirect: 20,000 ordinary shares in held by Leedoc Pty Ltd and 30,000 ordinary shares in nib holdings limited held by MIML Pension Consolidator (Lee Ausburn). 17
25 Directors Report continued INFORMATION ON DIRECTORS continued Harold Bentley MA Hons, FCA, FCSA, FGIA Independent Non-Executive Director Experience and expertise A Director since 7 November Has over 20 years experience in the insurance sector. Formerly the Chief Financial Officer of Promina Group Ltd and an Audit Manager w ith Pricew aterhousecoopers specialising in finance and insurance companies. Other current directorships None. Former directorships in the last 3 years Director of IMAN Australian Health Plans Pty Limited. Subsidiary boards and special responsibilities Director of nib health funds limited, nib nz holdings limited and nib nz limited. Chairman of the Audit Committee and a member of the Investment Committee, Risk and Reputation Committee and Nomination Committee. Chairman of the nib nz holdings limited s Audit Committee and Chairman of nib nz limited s Board, Audit, Risk and Compliance Committee (BARCC). Interests in shares and performance rights Indirect: 50,000 ordinary shares in held by Sushi Sake Pty Ltd. Dr Annette Carruthers Independent Non-Executive Director until 28 September 2016 MBBS (Hons), FRACGP, FAICD, GradDipAppFin TAASFA Philip Gardner BCom, CPA, CCM, FAICD, JP Experience and expertise A Director from 20 September 2007 to 28 September A general medical practitioner w ith financial qualifications and comprehensive experience in patient care and clinical risk management. Directorships and representative positions in a range of national, state and regional health care organisations. Other current directorships Director of Cater Care Holdings Pty Ltd, Multiple Sclerosis Research Australia and Vice President of MS Australia. Former directorships in the last 3 years Director of IMAN Australian Health Plans Pty Limited, Aged Care Investment Services (the Trustee for the AMP Managed Aged Care Investment Trusts), the NSW Board of the Medical Board of Australia, Hunter Primary Care Ltd, and Hunter Infrastructure and Investment Advisory Board. Subsidiary boards and special responsibilities Director of nib health funds limited (since 2003), nib health care services pty limited, nib nz holdings limited and nib nz limited until 28 September Chairman of the Risk and Reputation Committee and a member of the Audit Committee and Nomination Committee. A member of nib nz limited s Board, Audit, Risk and Compliance Committee (BARCC) and a member of nib nz holdings limited's Audit Committee until 28 September Interests in shares and performance rights Direct: 1,000 ordinary shares in. Indirect: 71,500 ordinary shares in held by Carruthers Future Fund Pty Ltd. Independent Non-Executive Director Experience and expertise A Director since 28 May Current Chief Executive Officer of The Wests Group Australia, a position he has held for more than a decade in w hich time he has overseen the group's significant grow th and expansion. Other current directorships None. Former directorships in the last 3 years Director of IMAN Australian Health Plans Pty Limited, Hunter Funds Management Pty Ltd and Knights Rugby League Pty Limited. Subsidiary boards and special responsibilities A Director of nib health funds limited (since 2005). Chairman of the Investment Committee and a member of the Audit Committee, People and Remuneration Committee and Nomination Committee. Interests in shares and performance rights Indirect: 150,000 ordinary shares in held by Sutton Gardner Pty Ltd. 18
26 Directors Report continued INFORMATION ON DIRECTORS continued Anne Loveridge BA (Hons), FCA, GAICD Christine McLoughlin BA, LLB (Hons), FAICD Donal O'Dw yer MBA, BE Independent Non-Executive Director Experience and expertise Anne w as appointed as an additional Director to the Board in February 2017 and w ill stand for election at the 2017 Annual General Meeting. Over 30 years experience in financial services and regulatory reporting including senior positions at Pricew aterhousecoopers (Australia). Other current directorships Non-Executive Director of Platinum Asset Management, National Australia Bank Limited and Chairman of Bell Shakespeare. Member of Nominations Committee for the International Federation of Accountants (IFAC). Former directorships in the last 3 years Deputy Chairman of Pricew aterhousecoopers (Australia). Subsidiary boards and special responsibilities A Director of nib health funds limited. A member of the Audit Committee, Risk and Reputation Committee and Nomination Committee. Interests in shares and performance rights Direct: 12,500 ordinary shares in. Independent Non-Executive Director Experience and expertise A Director since 20 March Christine is a professional Non-Executive Director. Prior to becoming a professional director she had a range of executive roles in the financial services, telecommunications and professional services sectors. Her w ork in leading companies w ith iconic brands included leadership roles spanning Australia, UK and South East Asia. Other current directorships Non-Executive Director of Suncorp Group Limited, Whitehaven Coal Limited and Spark Infrastructure Group. Chairman of Venues NSW and a member of ASIC's Director Advisory Panel. Former directorships in the last 3 years Director of IMAN Australian Health Plans Pty Limited. Chairman of Australian Payments Council and Deputy Chairman of The Smith Family. Subsidiary boards and special responsibilities A Director of nib health funds limited. Chairman of Risk and Reputation Committee and a member of the Audit and Nomination Committees. Interests in shares and performance rights Indirect: 110,000 shares in held by Dundas Street Investments Pty Ltd. Independent Non-Executive Director Experience and expertise A Director since 22 March Highly experienced Non-Executive Director and former executive as the w orldw ide President at Cordis Cardiology and President of the Cardiovascular Group, Europe w ith Baxter Healthcare (now Edw ards Lifesciences). Other current directorships Chairman of AtCor Medical Ltd. A Director of Cochlear Ltd, Mesoblast Ltd and Fisher & Paykel Healthcare Corporation Ltd. Former directorships in the last 3 years None. Subsidiary boards and special responsibilities A Director of nib health funds limited. A member of the People and Remuneration Committee, Risk and Reputation Committee and Nomination Committee. Interests in shares and performance rights Indirect: 40,600 shares in held by Dundrum Investments Pty Ltd. 19
27 Directors Report continued COMPANY SECRETARIES Mrs Michelle McPherson (BBUS (Accounting) (UTS), CA, GAICD) was appointed to the position of Company Secretary on 1 September She is currently the Chief Financial Officer and Deputy Chief Executive Officer of the Group. Mrs McPherson is a Director of the Hunter Valley Research Foundation, Hunter Valley Grammar School and a member of the Council of the University of Newcastle. Mrs McPherson also serves as a Director of a number of nib Group companies. Mrs McPherson resigned from her position as Company Secretary effective 15 August Mr. Jordan French (Senior Corporate Counsel/Assistant Company Secretary) was appointed as an additional Company Secretary effective the same date. Ms Roslyn Toms (LLB (UNSW), BA Comms (UCAN/UTS)) was appointed Company Secretary on 29 April Ms Toms is also Group Executive - Legal and Chief Risk Officer and is responsible for managing legal, risk, compliance and governance across the nib group businesses in Australia and its global operations. Ms Toms has over 13 years' experience in-house and in private practice and is a member of the Governance Institute. MEETINGS OF DIRECTORS The number of meetings of s Board of Directors and of each Board committee held during the year ended 30 June 2017, and the numbers of meetings attended by each Director are noted below: Board Audit Committee Risk and Reputation Committee People and Remuneration Committee Investment Committee Nomination Committee Name Held 4 Attended Held Attended Held Attended Held Attended Held Attended Held Attended S Crane * 6 6* 6 6* ** ** 4 4 M Fitzgibbon * 6 6* 6 6* 5 3* 4 4 L Ausburn * ** ** 4 4 H Bentley * P Gardner * A Loveridge * ** ** 4 1 C McLoughlin ** ** 4 4 D O'Dw yer * ** ** 4 4 A Carruthers ** ** 4 2 * Attendance at Committee meetings in an ex-officio capacity. ** Not a member of the relevant committee. 1. A Loveridge commenced as a Director on 20 February 2017 and was appointed a member of the Audit Committee and the Risk and Reputation Committee. 2. C McLoughlin was appointed as Chair of the Risk and Reputation Committee and a member of the Audit Committee in November C McLoughlin ceased to be a member of the People and Remuneration Committee in November C McLoughlin's attendance at meetings of the Audit Committee prior to November 2016 and at the People and Remuneration Committee after November 2016, were in an ex-officio capacity. 3. A Carruthers retired as a Director on 28 September Includes two unscheduled Board meetings. nib s Non-Executive Directors participated in a number of site visits, work related functions and staff events during the course of the year in Newcastle, Sydney and Auckland. LIKELY DEVELOPMENTS AND EXPECTED RESULTS FROM OPERATIONS Additional comments on expected results on operations of the Group are included in this Annual Report under Operating and Financial Review on pages 2 to 15. Further information on likely developments in the operations of the Group have not been included in this Annual Report because the Directors believe it would be likely to result in unreasonable prejudice to the Group. REMUNERATION REPORT The Remuneration Report is set out on pages 24 to 42 of the Annual Report and forms part of this Report. 20
28 Directors Report continued ENVIRONMENTAL REGULATION The Group is not subject to any specific environmental regulation and has not breached any legislation regarding environmental matters. SHARES UNDER PERFORMANCE RIGHTS Unissued ordinary shares of under performance rights at the date of this report are as follows: Issue price Number under Date performance rights granted Expiry date of shares performance right 29 November September 2017 nil 559, December September 2018 nil 473, May September 2018 nil 22, January September 2019 nil 628, September September 2019 nil 14,099 5 December September 2020 nil 591,228 Shares may be issued or acquired on-market at the election of the Company. It is anticipated that the performance rights will be satisfied through on-market share purchases administered by the nib Holdings Ltd Share Ownership Plan Trust. No performance right holder has any right under the performance rights to participate in any other share issue of the Company or any other entity. NON-AUDIT SERVICES The Company may decide to employ the auditor on assignments additional to their statutory audit duties where the auditor s expertise and experience with the Group are important. Details of the amounts paid or payable to the auditor (PricewaterhouseCoopers) for audit and non-audit services during the year are disclosed in Note 31- Remuneration of Auditors. The Board of Directors has considered the position and, in accordance with advice received from the Audit Committee, is satisfied that the provision of the non-audit services is compatible with the general standard of independence for auditors imposed by the Corporations Act The Directors are satisfied that the provision of non-audit services by the auditor, as set out in Note 1, did not compromise the auditor independence requirements of the Corporations Act 2001 for the following reasons: all non-audit services have been reviewed by the Audit Committee to ensure that they did not impact the impartiality and objectivity of the auditor none of the services undermine the general principles relating to auditor independence as set out in APES 110 Code of Ethics for Professional Accountants. INSURANCE OF OFFICERS During the financial year, the Group paid a premium in respect of a contract insuring the Directors and Officers of the Group against liability incurred as such a Director or Officer, other than conduct involving wilful breach of duty in relation to the Group, to the extent permitted by the Corporations Act The contract of insurance prohibits disclosure of the nature of the liability and the amount of the premium. AUDITOR S INDEPENDENCE DECLARATION A copy of the Auditor s Independence Declaration as required under section 307C of the Corporations Act 2001 is set out on page
29 Directors Report continued CHIEF EXECUTIVE OFFICER/CHIEF FINANCIAL OFFICER DECLARATION The Chief Executive Officer and the Chief Financial Officer have given the declarations to the Board concerning the Group s financial statements required under section 295A(2) of the Corporations Act 2001 and Recommendation 7.3 of the ASX Corporate Governance Council s Corporate Governance Principles and Recommendations. ROUNDING OF AMOUNTS The Company is of a kind referred to in Instrument 2016/191, issued by the Australian Securities and Investments Commission, relating to the rounding off of amounts in the Directors Report and Financial Report. Amounts in the Directors Report and Financial Report have been rounded off to the nearest hundred thousand dollars in accordance with that Instrument. This report is made in accordance with a resolution of the Directors. On behalf of the Board Steve Crane Director Harold Bentley Director Newcastle, NSW 18 August
30 Auditor s Independence Declaration As lead auditor for the audit of for the year ended 30 June 2017, I declare that to the best of my knowledge and belief, there have been: (a) (b) no contraventions of the auditor independence requirements of the Corporations Act 2001 in relation to the audit; and no contraventions of any applicable code of professional conduct in relation to the audit. This declaration is in respect of and the entities it controlled during the period. Caroline Mara Partner PricewaterhouseCoopers Newcastle 18 August 2017 PricewaterhouseCoopers, ABN Level 3, 45 Watt Street, PO Box 798, NEWCASTLE NSW 2300 T: , F: , Liability limited by a scheme approved under Professional Standards Legislation. 23
31 Remuneration Report MESSAGE FROM THE BOARD Dear Shareholder It is with pleasure that we present our Remuneration Report for the financial year to 30 June While the past 12 months have not been without challenge, our well-defined business strategy and resulting financial performance are hallmarks of another strong period for nib. I have been Chair of our People and Remuneration Committee for nearly two years and am proud of the progress we have made during this time, in particular in the development of our people. It is a credit to nib s senior management team that we have created a culture which: - admires and supports intellectual rigour; - places a high value on educational and professional development; - welcomes diversity of thought; and - understands that being an employer of choice reflects the benefits, engagement and recognition we offer our employees. During the year, two additional Executive roles were added to further strengthen the nib organisational structure, including Group Executive People & Talent Development to meet the needs of our growing and diverse organisation and Group Executive Legal & Chief Risk Officer to bolster our capability and focus on risk. Executive remuneration has again been in the spotlight during the past 12 months. Our approach to remuneration is simple: 1. Our remuneration philosophy needs to be fit for purpose and aligned to our organisational strategy. 2. Our shareholders need to understand what we pay our people as well as how performance is measured and rewarded - transparency is key. 3. Remuneration must be linked to short and long term shareholder value creation, the two are inextricably linked. We remain active in engaging and seeking feedback from a range of key interest groups including shareholders, proxy advisors and the Australian Shareholders Association about our remuneration approach. The key objective of the remuneration framework we ve developed and refined over many years is to attract, retain, reward and incentivise our executives to deliver value that is aligned with our culture, overall business strategy and shareholder interests. At last year s Annual General Meeting, our shareholders voted overwhelmingly in favour of our Remuneration Report. This indicated to us that they share the Board s view that our remuneration policies and framework are aligned with their own interests. Those same policies are reflected in the Remuneration Report for FY17. Further information regarding executive remuneration, as well as total remuneration mix and performance against both short and long term incentive hurdles for FY17, can be found on pages 29 to 35 of the Annual Report. As we have stated previously, both in consultations with key stakeholders and in past Remuneration Reports, the Board s aim has been to position the fixed remuneration of our executive team between the 50th and 75th percentile of benchmarked companies. Last year s benchmarking against our defined peer group, which includes companies of similar market capitalisation and those in our industry or related sectors, identified that our Managing Director s fixed and variable remuneration combined was below that target range. Based on this assessment, his FY18 Total Fixed Remuneration will be increased by 3% and both his short-term incentive (STI) and long-term incentive (LTI) maximum opportunity has been increased from 100% of TFR to 125%. This November marks 10 years since our listing on the Australian Securities Exchange. It has been a tremendous journey and nib has become a larger and much more diverse organisation. During this time we have continued to grow our core Australian residents health insurance business, successfully diversified our earnings into new markets and expanded our business from being an Australian-only health insurer to a business that now operates across the globe. As can be seen from our financial results, this expansion and diversification continues to deliver value for our shareholders. To position nib for ongoing growth and success in the decade ahead, our People and Remuneration Committee must focus on ensuring we have a succession planning process and a remuneration structure that will meet our future needs. We must have the right skills mix, experience, diversity and capacity. 24
32 Remuneration Report continued MESSAGE FROM THE BOARD continued At this year s AGM we will be seeking shareholder approval to increase the fee pool for Non-Executive Directors from $1.5 million to $1.9 million, effective 1 January The current aggregate fee pool was set at the AGM in October 2013 and since that time nib has increased the number of Non-Executive Directors on the board from five to six and we have also added two additional residential Non-Executive Directors to our nib New Zealand subsidiary as well as two new Non-Executive Directors to our World Nomads Group business. The Director fee pool increase allows nib to attract and retain appropriate talent for the increased complexity, workload and responsibilities required. Furthermore, while the Board is not currently proposing to increase its size, the current cap does not provide the Board with strategic flexibility to make additional Board appointments should the business need arise. During the year, nib appointed Ms Anne Loveridge as an independent Non-Executive Director. Anne has made a great contribution since joining in February and is a highly experienced director with extensive knowledge of financial and regulatory reporting, risk management and compliance frameworks. Her appointment follows the announcement earlier this year by Harold Bentley that he would be retiring from the Board. As always, we welcome your feedback and look forward to another successful year. Yours sincerely Lee Ausburn Chairman People and Remuneration Committee 25
33 Remuneration Report continued CONTENTS Page Key terms used in this Report 26 Who this Report covers 27 Our remuneration governance 28 Executive remuneration structure 29 Executive remuneration mix 29 Executive remuneration mix fixed remuneration 30 Executive remuneration mix variable remuneration 30 Executive remuneration for the Financial Year ended 30 June Linking Remuneration with Performance 34 Executive Employment Conditions 35 Non-Executive Director remuneration 36 Detailed disclosure of Executive remuneration 38 Detailed disclosure of Non-Executive remuneration 39 Equity instruments held by key management personnel 40 KEY TERMS USED IN THIS REPORT FY16 Financial year ended 30 June 2016 FY17 Financial year ended 30 June 2017 FY18 Financial year ended 30 June 2018 AGM Annual General Meeting Group consolidated entity KMP Key Management Personnel (those Directors and Executives who have responsibility for planning, directing and controlling the activities of nib, either directly or indirectly) KPI Key Performance Indicator LTI Long-Term Incentive LTIP Long-Term Incentive Plan NPAT Net Profit After Tax STI Short-Term Incentive TFR Total Fixed Remuneration TSR Total Shareholder Return 26
34 Remuneration Report continued WHO THIS REPORT COVERS This Report presents the remuneration arrangements for nib s key management personnel. Executive Director Mark Fitzgibbon Managing Director/Chief Executive Officer (MD/CEO) Other Executives Rob Hennin David Kan Rhod McKensey Michelle McPherson Brendan Mills Chief Executive Officer New Zealand (CEO NZ) Group Executive International and New Business (GEINB) Group Executive Australian Residents Health Insurance (GEARHI) Deputy Chief Executive Officer/Chief Financial Officer (DCEO/CFO) Chief Information Officer (CIO) Roslyn Toms Group Executive Legal and Chief Risk Officer (GELCRO) (appointed 1 May 2017) Justin Vaughan Group Executive Benefits and Provider Relations (GEBPR) Independent Non-Executive Directors Steve Crane Lee Ausburn Harold Bentley Chairman Chairman People and Remuneration Committee Member Risk and Reputation Committee Chairman Audit Committee Chairman Board, Audit, Risk and Compliance Committee New Zealand Director New Zealand subsidiaries Member Investment Committee Member Risk and Reputation Committee Annette Carruthers Chairman Risk and Reputation Committee (until 28 September 2016) Member Audit Committee (until 28 September 2016) Member Board Audit Risk and Compliance Committee New Zealand (until 28 September 2016) Director New Zealand subsidiaries (until 28 September 2016) Philip Gardner Chairman Investment Committee Member Audit Committee Member People and Remuneration Committee Anne Loveridge Member Audit Committee (appointed 20 February 2017) Member Risk and Reputation Committee (appointed 20 February 2017) Christine McLoughlin Donal O Dwyer Chair of Risk and Reputation Committee (appointed October 2016), and member of Risk and Reputation Committee (until October 2016) Member of People and Remuneration Committee (until October 2016) Member Audit Committee (appointed October 2016) Member People and Remuneration Committee Member Risk and Reputation Committee 27
35 Remuneration Report continued OUR REMUNERATION GOVERNANCE The role of our People and Remuneration Committee (Committee) is to ensure alignment of nib s remuneration framework to the short-term and long term performance of the nib Group. As part of this process the Committee seeks advice and feedback from a range of external remuneration consultants, specialists, major shareholders and shareholder advisory groups. When assessing our remuneration framework the Committee ensures there is a clear link to nib s culture and business strategy, diversity, people and development strategy, succession planning and employee development and engagement. The Committee includes the following independent Non-Executive Directors: Lee Ausburn (Chairman) Donal O Dywer Philip Gardner Shareholders can view the Committee Charter on the nib website (nib.com.au/shareholders). Executive remuneration arrangements are set against a comparator group of listed organisations or peers, which nib determines in consultation with external remuneration advisors. In May 2016 Guerdon Associates provided the Committee with remuneration data to inform our FY17 and FY18 analyses. nib typically seeks external remuneration data every two years, with this information previously provided in May 2014 to inform our FY15 and FY16 analyses. The Committee considered the data provided by Guerdon Associates together with a range of other factors as well as supplementary data, such as the ongoing growth of the company and external competitive landscape, in setting Executive remuneration for FY18. In establishing our peer group, companies from the following sectors and industries were considered: Health insurance Other insurance Other finance sector Consumer discretionary; and Healthcare We continue to find it challenging to define a peer group in the Australian market of a similar size (market capitalisation) and industry sector. As a result comparator companies were chosen based on size and broad operational parameters. We also consider current market expectations and industry landscape within our sector in forming a view of benchmarking executive remuneration. The primary peer group contained 20 companies, and a further 25 companies were represented in the supplementary comparator group which was used in addition for specific roles. The primary peer group was chosen based on market capitalisation and pre-tax profit broadly being between 50% and 200% of nib, with nib positioned around the middle of the group. Aligning remuneration, particularly that of our executives, with shareholder interests is a key objective. As our shareholders have seen, the remuneration paid to our executives has increased over time, in particular our Managing Director s TFR has increased 50.7% over the past five years. To provide some context as to how remuneration is linked to shareholder value, over the same five-year period our revenue has grown 55.0%, underlying operating profit has risen 104.7%, total shareholder return has been 378% compared to 73% for S&P/ASX 200 companies, market capitalisation has increased from approximately $650 million to more than $2.5 billion and our arhi net promoter score has risen from 16.9% to 23.2%. 28
36 Remuneration Report continued EXECUTIVE REMUNERATION STRUCTURE nib s remuneration framework provides a mix of fixed and variable remuneration with a blend of short-term and long-term incentives. There are three components of total remuneration: fixed remuneration, comprising base remuneration package, superannuation and insurance cover; short-term incentives based on predetermined Key Performance Indicator (KPI) targets established by the Board and an assessment of leadership; and longer-term incentives based on predetermined TSR and EPS performance established by the Board. A significant portion of remuneration for our Managing Director/CEO and Chief Financial Officer/Deputy CEO is performance based through STI and LTI arrangements. These Executives have claw-back arrangements in place for any amount of remuneration, STI and LTI received. If the Board becomes aware of a material misstatement of our financial accounts or statements, and nib has awarded an executive a remuneration increase, incentive payment or award (STI and LTI) having regard to misstatement, the Board may, (in its absolute discretion) require the executive to: repay the Company any amount of remuneration, STI or LTI received by the MD/CEO and CFO/DCEO; or forfeit or cancel any remuneration increase, STI or LTI award (whether vested or unvested). From FY18 current claw-back arrangements have been extended to all Executives and a malus condition included by way of amendment to STI and LTI Plan Rules. EXECUTIVE REMUNERATION MIX The remuneration structure for each executive is made up of the following components: The graph below illustrates the FY17 remuneration mix for our Executives. Any variations in target remuneration mix between executive roles reflect position responsibilities. As can be seen from the graph a large portion of Executive remuneration is at risk and subject to meeting performance hurdles as set out through the STI and LTI for each Executive. 100% % target remuneration opportunity 90% 80% 70% 60% 50% 40% 30% 20% 10% 0% 33% 27% 27% 27% 25% 25% 25% 25% 14% 14% 14% 13% 13% 13% 13% 17% 14% 14% 14% 13% 13% 13% 13% 17% 45% 45% 45% 50% 50% 50% 50% 33% MD/ CEO DCEO/CFO GEARHI CEO NZ CIO GEBPR GELCRO GEINB Base remuneration package and benefits Short-term performance incentives opportunity - cash Short-term performance incentives - deferred into shares Longer-term performance incentives opportunity 29

37 Remuneration Report continued EXECUTIVE REMUNERATION MIX FIXED REMUNERATION Fixed remuneration for Executives is determined with reference to a benchmarking process, external market factors, competition to attract and retain talent, as well as consideration of the expertise of the individual in the role. Fixed remuneration includes cash salary, superannuation and insurance cover. The fixed remuneration may be salary packaged at no additional cost to the Group. EXECUTIVE REMUNERATION MIX VARIABLE REMUNERATION Short-term incentives (STI) nib s short-term incentive (STI) plan for each Executive is structured as follows. Performance criteria for STI is based on two components: 1. Leadership assessment which makes up 20% of the total STI. The leadership component ensures we continue to focus and recognise the contribution of our Executives in developing a high performance organisational culture and is assessed as part of annual performance reviews. In making an assessment of leadership, factors which are considered include: having a clear sense of purpose for company; ability to garner support amongst Executive team, employees and stakeholders; is a motivator adept at initiating and managing change; leads by example and with integrity; and has a strong sense of ethics and is innovative, balancing entrepreneurship with prudent assessment of business and financial risk. 2. Performance assessment which makes up 80% of the total STI. The performance component is assessed against predetermined performance milestones for each Executive (for FY17 this is set out on Page 33). In some instances an Executive s STI assessment may include strategic milestones. The Board is responsible for assessing the performance of the MD/CEO and the MD/CEO is responsible for assessing the performance of the other executives (with approval of the resulting STI awards by the Board following a recommendation from the Committee). The actual level of STI paid to each Executive is determined at the end of the financial year based on the Executive s achievement of predetermined performance milestones and an annual performance review. The cash component of the bonuses is payable on 15 October each year in respect of the prior financial year. 30

38 Remuneration Report continued EXECUTIVE REMUNERATION MIX VARIABLE REMUNERATION continued Long-term incentives (LTI) nib s long-term incentive (LTI) plan for each executive is structured as follows. The purpose of the LTI is to balance short-term performance objectives with the creation of long-term shareholder value by focusing overall Group performance over a multi-year period. The nib LTI is an incentive provided to eligible Executives if specific measures are met over a four-year period. LTI targets are set in the interests of creating long term shareholder value and to assist nib to attract, reward, motivate and retain executives. LTIP participants are granted performance rights that enable the Executive to acquire shares in nib for nil consideration if performance conditions are met and the employees are still employed by nib at the end of the vesting period. No dividends are received on unvested rights. The vesting date may be accelerated at the Board s discretion: - in the event of death of a participant; - on cessation of employment for other reasons (including total and permanent disablement, redundancy and retirement); or - on winding up, delisting, change of control and reconstruction or amalgamation. Participation in the plan is at the Board s discretion and no individual has a contractual right to participate in the plan or to receive any guaranteed benefits. The performance hurdles for the nib LTI are Total Shareholder Return (TSR) relative to the S&P/ASX200 over four years and EPS growth over the performance period. The LTI is allocated in two equal tranches; 50% for TSR and 50% for EPS. The Board s view is that our current LTI performance hurdles being Earnings Per Share (EPS) and Total Shareholder Return (TSR) relative to S&P/ASX200 group of companies remain appropriate and aligned to our remuneration philosophy. We will continue to assess the appropriateness of these performance hurdles each year and consult with shareholders, proxy advisors and other shareholder representative groups regarding any future amendments to ensure they are aligned to shareholder interests. A condition of acceptance for each Executive in the LTI Plan is the requirement for 50% of the LTI to have a two-year escrow period. This escrow period extends beyond employment at nib ceasing, including termination. If vesting conditions are met, the performance rights will vest on 1 September following the end of the performance period. On the vesting date, Executives who hold vested performance rights will be either issued or transferred shares in nib for each vested performance right. There is no re-testing of performance. 31
39 Remuneration Report continued EXECUTIVE REMUNERATION FOR THE FINANCIAL YEAR ENDED 30 JUNE 2017 Actual remuneration for each Executive in FY17 included a fixed component, as well as a variable component made up of an STI payment and LTI award. A full breakdown of executive remuneration details has been prepared in accordance with statutory requirements and accounting standards. This detailed disclosure (statutory tables) is located on page 38 of this Report. The table below shows the key elements of total reward for each executive for FY17. This includes the cash component elements paid to each executive for the year as well as the value of equity held in escrow (not subject to forfeiture conditions), and equity from previous years that vested in FY17 and which was originally reported under accounting standards in the year they were granted. Total reward (received or available) Total fixed remuneration 1 STI applicable to the FY16 year 2 paid in Sept 2016 (FY17) Shares held in Cash escrow LTI vested in FY17 3 $ $ $ $ $ Mark Fitzgibbon 1,012, , , ,826 2,716,946 Rob Hennin 418, , , ,945 David Kan 500,001 89,544 89, ,089 Rhod McKensey 580, , , ,592 1,077,252 Michelle McPherson 595, , , ,275 1,185,615 Brendan Mills 357,001 66,943 66, , ,727 Roslyn Toms 4 278,922 38, ,285 Justin Vaughan 350,000 68,432 68, ,864 4,091,821 1,044,441 1,007,928 1,560,533 7,704, Total fixed remuneration comprises Cash salaries and fees and superannuation. 2. FY16 STI paid in the FY17 year. 3. Value of shares issued during the year on exercise of performance rights. 4 Roslyn Toms was appointed Group Executive Legal and Chief Risk Officer on 1 May Before this appointment she was the company's General Counsel/Company Secretary. Amounts shown above include all Ms Toms' remuneration during the reporting period, whether as an Executive Officer or General Counsel/Company Secretary. Amounts received in her position as Group Executive Legal and Chief Risk Officer amounted to $92,994, made up of cash salary of $56,871, cash bonus of $16,203, non-monetary benefits of $448, superannuation of $3,269 and share based bonus of $16,203. Short-term incentives for the financial year ended 30 June 2017 The specific KPIs and weighting for FY17 for our Managing Director and CFO which constitutes 80% of their total STI are: KPI Weighting Mark Fitzgibbon (MD/CEO) Michelle McPherson (CFO/DCEO) Growth Group premium revenue 10% - Profitability - Group underlying operating profit 40% 40% WNG underlying operating profit 10% - Underlying EPS 20% 20% Cost control Group underlying management expense ratio (excluding acquisition costs) - 30% Customer satisfaction arhi customer satisfaction 20% 10% Short-term performance targets are set for achieving specific financial business and individual performance outcomes and awards are made relative to stretch performance. Due to the commercial and strategic nature of the STI targets for our other Executives, nib does not disclose the specific KPIs for these key management personal. 32
40 Remuneration Report continued EXECUTIVE REMUNERATION FOR THE FINANCIAL YEAR ENDED 30 JUNE 2017 continued Short-term incentives for the financial year ended 30 June 2017 continued Each Executive has a target STI opportunity. For FY17, 50% of the awarded STI must be deferred into shares, with half the shares vesting after one year and the second half after two years. These shares are subject to a real risk of forfeiture during the deferral period being a service condition. Actual FY17 STIs awarded and forfeited (as a percentage of total STI) for each Executive are set out below. A more detailed description of performance against STI performance hurdles is shown on page 34. FY17 STI Bonus FY16 STI Bonus Awarded Forfeited Awarded Forfeited % % % % Mark Fitzgibbon 97.5% 2.5% 87.4% 12.6% Rob Hennin 89.8% 10.2% 92.2% 7.8% David Kan 90.0% 10.0% 82.0% 18.0% Rhod McKensey 92.5% 7.5% 87.2% 12.8% Michelle McPherson 90.3% 9.7% 85.8% 14.2% Brendan Mills 90.0% 10.0% 84.6% 15.4% Roslyn Toms % 7.7% na na Justin Vaughan 97.5% 2.5% 96.0% 4.0% Group average 92.5% 7.5% 87.2% 12.8% 1. STI award % for FY17and FY16 is for period as executive Long-term incentives for the financial year ended 30 June 2017 nib LTI performance rights vest in accordance with the achievement of the following vesting conditions: Vesting Condition 1 Vesting Condition 2 50% of the performance rights (Tranche 1) 50% of the performance rights (Tranche 2) Total shareholder return targets (TSR Hurdle) for the relevant Earnings per share grow th targets (EPS Hurdle) for the relevant performance period are met performance period are met TSR Hurdle (Tranche 1) - 100% vesting For the four year performance period ended 30 June 2017, nib s TSR was ranked at the 93.6th percentile to our peer group (S&P/ASX 200). As per the TSR vesting conditions for the FY14-FY17 LTI (as set our below) this translates to a 100% vesting of the performance rights for tranche 1. nib's TSR performance compared to the relevant peer group Performance of Tranche 1 performance rights vesting >= 75th percentile 100% >= 50th percentile to 74th percentile Pro-rata straight line vesting betw een 50% and 100% < 50th percentile 0% EPS Hurdle (Tranche 2) - 100% vesting For the 12 months to 30 June 2017 nib s EPS was 27.2 cps. As per the EPS vesting conditions for the FY14-FY17 LTI (as set our below) this translates to EPS CAGR of 10% from the base EPS of 15.3 cps and 100% vesting of the performance rights for tranche 2. Percentage of performance rights vesting FY14-FY17 LTIP 15.3 cps 100% 26.8 cps 75% 22.4 cps 50% 20.1 cps 25% 17.2 cps 0% nil For the purpose of the calculation, 25% to 50% will be discrete thresholds, with performance above the 50% entitlement calculated on a pro rata basis to a maximum entitlement of 100% 33
41 Remuneration Report continued LINKING REMUNERATION WITH PERFORMANCE The components of remuneration that are linked to performance are the STI and LTI plans. Set performance indicators determine 80% of the STI award, while 20% is assessed on the leadership of each Executive. Commercially sensitive and strategic milestone targets were set for some of our Executives which are dependent and assessed on their segment and area of responsibility. The following table shows key performance indicators for the Group over the last five years: FY17 FY16 FY15 FY14 FY13 Financial results $m $m $m $m $m Growth Group premium revenue 1, , , , ,290.4 Profitability nib Group underlying operating profit WNG underlying operating profit na na na Underlying EPS cps Cost Control Group underlying management expense ratio excluding acquisition costs % Results against KPIs (excluding leadership component) are detailed in the table below. KPI Grow th Group premium revenue Result Group premium revenue up 6.8% to $1.9 billion, w ith approximately 70% of maximum STI aw arded for this target. Profitability nib Group underlying operating Group underlying operating profit up 16.4% to $153.7 million, w ith 100% of maximum STI aw arded for this target. profit WNG underlying operating WNG underlying oerating profit w as $7.5 million, w ith 100% of maximum STI aw arded for this target. profit Underlying EPS Underlying EPS of 27.7cps up 21%, w ith 100% of maximum STI aw ared for this target. Cost control Group underlying management expense ratio excluding Approximately 70% of maximum STI aw arded for this target. acquisition costs Customer satisfaction A range of metrics are used to measure customer satisfaction, including NPS w hich resulted in 100% of maximum arhi customer satisfaction STI aw arded for this target. 34
42 Remuneration Report continued EXECUTIVE EMPLOYMENT CONDITIONS Executive contracts summarise employment terms and conditions, including remuneration arrangements and compensation. A significant portion of remuneration for our Managing Director/CEO and Chief Financial Officer/Deputy CEO is performance based through STI and LTI arrangements. These Executives have claw-back arrangements in place for any amount of remuneration, STI and LTI received. From FY18 current claw-back arrangements have been extended to all Executives and a malus condition included by way of amendment to STI and LTI Plan Rules. The table below provides a summary of the agreements. Service agreement effective Term of agreement Termination provision Mark Fitzgibbon (MD/CEO) 1 July 2010 Open contract w ith notice period Michelle McPherson (CFO/DCEO) 1 July 2010 Open contract w ith notice period Rhod McKensey (GEARHI) 1 July 2014 Open contract w ith notice period Rob Hennin (CEO NZ) 6 May 2013 Open contract w ith notice period Brendan Mills (CIO) 1 June 2012 Open contract w ith notice period Justin Vaughan (GEBPR) 1 August 2013 Open contract w ith notice period David Kan (GEINB) 19 December 2014 Open contract w ith notice period Roslyn Toms (GELCRO) 1 May 2017 Open contract w ith notice period The agreement may be terminated early by nib giving notice w ith immediate effect or by the relevant Executive giving three months notice. Termination payments For our Australian Executives with open contracts effective pre August 2014, the Group may terminate the Executive s contract with 12 months written notice and may make a payment in lieu of all or part of the notice period. For our Australian Executives with open contracts effective post August 2014, the Group may terminate the Executive s contract with six months written notice and may make a payment in lieu of all or part of the notice period. In the case of a New Zealand Executive, the Group may terminate the Executive s contract with nine months written notice and may make a payment in lieu of all or part of the notice period. The Executive may also receive the following benefits upon termination: a pro-rata STI payment based on the period of the financial year during which the Executive was employed and the Board s assessment of the Executive s performance against the key performance indicators as at the date of termination; and/or the Board has discretion to determine that all or a portion of unvested performance rights of a participant of the LTIP are to be vested upon termination. At the 2011 Annual General Meeting nib received shareholder approval for the payment of termination benefits which may exceed the 12 month salary limit on termination benefits under the Corporations Act In response to shareholder feedback, the Board has since determined that this approval will only be undertaken for Executives who held this position at the date of shareholder approval. The only current Executives this approval would be applicable to are Mark Fitzgibbon (MD/CEO), Michelle McPherson (Deputy CEO/CFO) and Rhod McKensey (Group Executive Australian Residents Health Insurance). Minimum shareholding requirements While nib does not set minimum shareholding requirements on our Executives, the Board s view is that the deferral arrangements under the STI and LTI means all Executives have an appropriate minimum equity holding. 35
43 Remuneration Report continued NON-EXECUTIVE DIRECTOR REMUNERATION Fees and payments to Non-Executive Directors reflect the Board role, market fee levels, and the objective of the Group to attract highly skilled and experienced non-executive directors. Non-Executive Director fees Our Non-Executive Directors are paid a base fee, plus they also receive an additional fee for being members of other nib Board Committees. Non-executive director fees are reviewed annually by the Committee and approved by the Board. In 2016, nib engaged the services of Guerdon Associates to conduct a benchmarking and market remuneration analysis, which together with supplementary data was utilised this year. Non-executive director fees are determined within the $1.5 million aggregate nib directors fee pool limit. Directors fees and superannuation are paid out of this pool. Travel allowances, non-monetary benefits and retirement benefits are not included in this pool. At this year s AGM nib will be seeking shareholder approval to increase the fee pool for Non-Executive Directors from $1.5 million to $1.9 million, effective 1 January The current aggregate fee pool was set at the AGM in October 2013 and since that time nib has increased the number of Non- Executive Directors on the board from five to six and we have also added two additional residential Non-Executive Directors to our nib New Zealand subsidiary as well as two new Non-Executive Directors to our World Nomads Group business. The Director fee pool increase allows nib to attract and retain appropriate talent for the increased complexity, workload and responsibilities required. Furthermore, while the Board is not currently proposing to increase its size, the current cap does not provide the Board with strategic flexibility to make additional Board appointments should the business need arise. The current aggregate fee pool was set at the AGM in October 2013 and since that time nib has increased the number of Non-Executive Directors on the board from five to six, we have also added two additional residential Non-Executive Directors to our nib New Zealand subsidiary as well as two new Non-Executive Directors to our World Nomads Group business. Furthermore, while the Board is not currently proposing to increase its size, the current cap does not provide the Board with strategic flexibility to make additional Board appointments should it wish to do so for succession planning at an appropriate time. Although an increase in the fee pool is being sought, it does not imply that the full amount will be used. The fee pool is a maximum annual limit and does not indicate that fees will necessarily be increased accordingly to that limit. Non-Executive Director fees will continue to be reviewed annually and adjustments only made which are in accordance with our existing remuneration structure. The following table shows the fees (inclusive of superannuation) for nib s Australian boards and committees: $ $ Base fees Chairman 278, ,000 Other Non-Executive Directors 120, ,000 Additional fees * Audit committee Chairman 31,000 31,000 Member 12,500 12,500 Investment committee Chairman 17,000 17,000 Member 10,000 10,000 Risk and Reputation committee Chairman 25,000 25,000 Member 12,500 12,500 People and Remuneration committee Chairman 25,000 25,000 Member 12,500 12,500 Nomination committee Chairman - - Member - - * The Chairman of the Board does not receive additional fees for involvement in committees. 36
44 Remuneration Report continued NON-EXECUTIVE DIRECTOR REMUNERATION continued Non-Executive Director fees continued The following fees (inclusive of superannuation) for the New Zealand boards and committees have applied: $ $ NZ Base fees Chairman * 73,355 72,000 Member 38,306 37,000 NZ Board, Audit, Risk and Compliance committee Chairman 9,318 9,000 Member - - * The Chairman of the NZ Board is not a member of the nib holdings Board Principle 2 of nib s Corporate Governance Statement (which is available at ww.nib.com.au/shareholders/company-profile/corporategovernance) includes the committee membership of each of nib s NEDs (Non-Executive Directors). Minimum shareholding requirements nib requires all Non-Executive Directors ( only) to hold a minimum of 50% of their first year s total annual base director s fee in shares, which is to be accumulated within three years of appointment (based on the share price at the date of joining the Board). All current Non-Executive Directors () comply with this requirement as at 30 June
45 Remuneration Report continued DETAILED DISCLOSURE OF EXECUTIVE REMUNERATION Details of the remuneration of the Executives of the nib holdings group are set out in the following tables. Short-term employee benefits Cash salary and fees 1 Cash bonus Non-monetary benefits 3 Post-employment benefits Superannuation Retirement benefits Long-term benefits Long service leave Termination benefits Share-based payments Termination Performance benefits Bonus 4 rights Total Executives $ $ $ $ $ $ $ $ $ $ 2017 Mark Fitzgibbon 976, ,350 12,828 35,000-16, ,350 1,291,530 3,319,857 Rob Hennin 389, ,500 11,004 30, , , ,253 David Kan 518, ,000 3,846 19, ,000 86, ,370 Rhod McKensey 539, ,570 4,461 30,000-9, , ,327 1,233,546 Michelle McPherson 577, ,245 4,576 33,154-9, , ,957 1,369,953 Brendan Mills 334,604 95,589 2,746 19,616-5,947-95, , ,344 Roslyn Toms 2 258,005 49,453 2,145 19, , ,422 Justin Vaughan 319, ,919 2,692 30, ,919 77, ,531 3,915,306 1,303,626 44, ,846-42,371-1,272,226 2,486,603 9,282, Mark Fitzgibbon 828, ,560 10,999 35,000-14, , ,706 2,318,652 Rob Hennin 372, ,275 8,412 27, ,098 62, ,858 David Kan 442,561 89,544 3,098 19, ,544 45, ,940 Rhod McKensey 516, ,210 3,759 25,631-9, , ,472 1,016,747 Michelle McPherson 524, ,170 3,871 24,847-9, , ,960 1,113,079 Brendan Mills 302,839 67,743 2,230 19,308-5,350-67,743 52, ,633 Justin Vaughan 273,018 69,888 2,027 19, ,888 43, ,708 3,260,406 1,006,390 34, ,772-38,351-1,013,213 1,308,089 6,831,617 1 Includes cash salary and fees and short-term compensated absences, such as annual leave entitlements accrued but not taken during the year. 2 Roslyn Toms was appointed Group Executive Legal and Chief Risk Officer on 1 May Before this appointment she was the company's General Counsel/Company Secretary. Amounts shown above include all Ms Toms' remuneration during the reporting period, whether as an Executive Officer or General Counsel/Company Secretary. Amounts received in her position as Group Executive Legal and Chief Risk Officer amounted to $92,994, made up of cash salary of $56,871, cash bonus of $16,203, non-monetary benefits of $448, superannuation of $3,269 and share based bonus of $16, Non-monetary benefits includes insurance cover and cost of benefits and associated Fringe Benefits Tax. 4 Includes bonus share rights. Refer to Share-based payments. 38
46 Remuneration Report continued DETAILED DISCLOSURE OF NON-EXECUTIVE REMUNERATION Details of the remuneration of the Directors of the nib holdings group are set out in the following tables. Short-term employee benefits Cash salary and fees Non-monetary benefits Post-employment benefits Retirement Superannuation benefits Total Non-Executive Directors $ $ $ $ $ 2017 Steve Crane 258,684-19, ,300 Lee Ausburn 144,521-13, ,250 Harold Bentley 186,874-35, ,874 Annette Carruthers (until 28/9/16) 43,516 4,863 4,134 1,443 53,956 Philip Gardner 148,630-14, ,750 Anne Loveridge (from 20/2/2017) 48,251-4,584-52,835 Christine McLoughlin 141,796-13, ,267 Donal O'Dyw er 133,105-12, ,750 1,105,377 4, ,299 1,443 1,228, Steve Crane 222,692-19, ,000 Lee Ausburn 122,527-11, ,167 Harold Bentley 169,500-35, ,500 Annette Carruthers 163,927-15,573 5, ,890 Philip Gardner 134,247-12, ,000 Christine McLoughlin 126,332-12, ,334 Donal O'Dyw er (from 22/3/2016) 33,122-3,147-36, , ,423 5,390 1,087,160 39
47 Remuneration Report continued EQUITY INSTRUMENTS HELD BY KEY MANAGEMENT PERSONNEL Reconciliation of performance rights help by KMP The numbers of performance rights over ordinary shares in the Company held during the financial year by each Executive of nib holdings limited are set out below. Balance at the start of the year Vested and exercised Forfeited Granted as Name & Grant dates Unvested compensation Number % Number % 40 Other Changes Balance as the end of the year Vested and exercisable Unvested Mark Fitzgibbon 19 Nov 2012 (FY13 - FY16 LTIP) 331, ,353 62% 124,412 38% Nov 2013 (FY14 - FY17 LTIP) 273, , Dec 2014 (FY15 - FY18 LTIP) 234, , Jan 2016 (FY16 - FY19 LTIP) 284, ,320 5 Dec 2016 (FY17 - FY20 LTIP) - 225, ,980 Michelle McPherson 19 Nov 2012 (FY13 - FY16 LTIP) 107,871-67,419 62% 40,452 38% Nov 2013 (FY14 - FY17 LTIP) 89, , Dec 2014 (FY15 - FY18 LTIP) 74, , Jan 2016 (FY16 - FY19 LTIP) 89, ,819 5 Dec 2016 (FY17 - FY20 LTIP) - 79, ,716 Rhod McKensey 19 Nov 2012 (FY13 - FY16 LTIP) 75,013-46,883 62% 28,130 38% Nov 2013 (FY14 - FY17 LTIP) 79, , Dec 2014 (FY15 - FY18 LTIP) 55, , Jan 2016 (FY16 - FY19 LTIP) 69, ,787 5 Dec 2016 (FY17 - FY20 LTIP) - 77, ,708 Brendan Mills 19 Nov 2012 (FY13 - FY16 LTIP) 38,587-24,116 62% 14,471 38% Nov 2013 (FY14 - FY17 LTIP) 33, , Dec 2014 (FY15 - FY18 LTIP) 36, , Jan 2016 (FY16 - FY19 LTIP) 41, ,394 5 Dec 2016 (FY17 - FY20 LTIP) - 39, ,860 Rob Hennin 19 Nov 2012 (FY13 - FY16 LTIP) Nov 2013 (FY14 - FY17 LTIP) 57, , Dec 2014 (FY15 - FY18 LTIP) 40, , Jan 2016 (FY16 - FY19 LTIP) 49, ,492 5 Dec 2016 (FY17 - FY20 LTIP) - 56, ,624 Justin Vaughan 19 Nov 2012 (FY13 - FY16 LTIP) Nov 2013 (FY14 - FY17 LTIP) 26, , Dec 2014 (FY15 - FY18 LTIP) 32, , Jan 2016 (FY16 - FY19 LTIP) 37, ,633 5 Dec 2016 (FY17 - FY20 LTIP) - 39, ,076 David Kan 19 Nov 2012 (FY13 - FY16 LTIP) Nov 2013 (FY14 - FY17 LTIP) Dec 2014 (FY15 - FY18 LTIP) 22, , Jan 2016 (FY16 - FY19 LTIP) 56, ,450 5 Dec 2016 (FY17 - FY20 LTIP) - 55, ,824 To date nib s practice has been to source equity for remuneration awards from shares purchased on market. Accordingly, there was no dilution from Executive new issue equity awards in 2017.
48 Remuneration Report continued EQUITY INSTRUMENTS HELD BY KEY MANAGEMENT PERSONNEL continued The terms and conditions of each grant of options affecting remuneration in the current or a future reporting period are: Grant date Vesting and exercise date Expiry date Exercise price Value per performance right at grant date Performance achieved and % vested FY13 - FY16 LTIP 19 Nov Sep Sep 2016 nil % FY14 - FY17 LTIP 29 Nov Sep Sep 2017 nil Vesting date yet to FY15 - FY18 LTIP 22 Dec Sep Sep 2018 nil occur and FY15 - FY18 LTIP 13 May Sep Sep 2018 nil performance not FY16 - FY19 LTIP 22 Jan Sep Sep 2019 nil yet tested FY17 - FY20 LTIP 5 Dec Sep Sep 2020 nil Share holdings The number of shares in the Company held during the financial year by each Director of and other Key Management Personnel of the Group, including their personally related parties, are set out below. Balance at the start of the year Granted during the year as compensation Other changes during the year Balance at the end of the year 2017 Ordinary shares Directors of nib group Steve Crane 250, ,000 Lee Ausburn 50, ,000 Harold Bentley 100,000 - (50,000) 50,000 Annette Carruthers 1 72,500 - (72,500) - Philip Gardner 150, ,000 Anne Loveridge ,500 12,500 Christine McLoughlin 110, ,000 Donal O'Dw yer 25,600-15,000 40,600 Other key management personnel of the Group Mark Fitzgibbon 1,783, ,561 (50,000) 2,025,838 Rob Hennin 38,663 24,916-63,579 David Kan 11,926 19,840-31,766 Rhod McKensey 320,209 78, ,739 Michelle McPherson 608,048 99, ,190 Brendan Mills 58,827 38,949-97,776 Roslyn Toms ,155 11,155 Justin Vaughan 24,056 15,163 (10,000) 29, Annette Carruthers retired as a Director on 28 September 2016, with the change in shareholding reflecting Annette no longer being a Director. 41
49 Remuneration Report continued EQUITY INSTRUMENTS HELD BY KEY MANAGEMENT PERSONNEL continued Share holdings continued Balance at the start of the year Granted during the year as compensation Other changes during the year Balance at the end of the year 2016 Ordinary shares Directors of nib group Steve Crane 200,000-50, ,000 Lee Ausburn 20,000-30,000 50,000 Harold Bentley 100, ,000 Annette Carruthers 72, ,500 Philip Gardner 125,000-25, ,000 Christine McLoughlin 97,500-12, ,000 Donal O'Dw yer ,600 25,600 Other key management personnel of the Group Mark Fitzgibbon 1,594, ,627 (7,000) 1,783,277 Rob Hennin 11,653 26, ,663 David Kan - 11,926-11,926 Rhod McKensey 245,820 74, ,209 Michelle McPherson 512,498 95, ,048 Brendan Mills 38,894 19,933-58,827 Justin Vaughan 5,890 18,166-24,056 In addition to the above shareholding in, in FY16 David Kan acquired one share in both nib Options Holdings (Thailand) Co Ltd and nib Options (Thailand) Co Ltd, as this is a requirement to operate this business in Thailand. Other transactions with key management personnel The wife of Philip Gardner, a Director, is a director and shareholder of XO Digital Pty Limited and Enigma Communications Pty Limited. The Group has entered into contracts with XO Digital Pty Limited for software development and maintenance, and Enigma Communications Pty Limited for graphic design and creative services. The contracts were based on normal commercial terms and conditions. Aggregate amounts of each of the above types of other transactions with key management personnel of the Group: a) Amounts recognised as expense $ $ Softw are maintenance 11,656 - Advertising and promotions 170, ,701 Printing and stationery 82,947 97, , ,083 42
50 Corporate Governance Statement The nib Board and management are committed to achieving and demonstrating the highest standards of corporate governance and ensuring compliance with the ASX Corporate Governance Council s Corporate Governance Principles and Recommendations (3rd edition). The Board is dedicated to, and responsible for, actively promoting ethical and responsible decision making and practices at nib to ensure that practices are in place to maintain confidence in nib s integrity. The 2017 Corporate Governance Statement is dated as at 30 June 2017 and reflects the corporate governance practices in place throughout the 2017 financial year. The Corporate Governance Statement was approved by the Board on 18 August A description of the Group s current corporate governance practices is set out in the Group s Corporate Governance Statement which can be viewed at 43
51 Financial Report CONTENTS Page Consolidated Income Statement 45 Consolidated Statement of Comprehensive Income 46 Consolidated Balance Sheet 47 Consolidated Statement of Changes in Equity 48 Consolidated Statement of Cash Flows 49 Notes to the Consolidated Financial Statements: 1. Summary of Significant Accounting Policies Critical Accounting Judgements and Estimates Risk Management Fair Value Measurement Segment Reporting Revenue and Other Income Expenses Taxation Cash and Cash Equivalents Receivables Financial Assets at Fair Value through Profit or Loss Deferred Acquisition Costs Property, Plant & Equipment Intangible Assets Payables Borrowings Outstanding Claims Liability Unearned Premium Liability and Unexpired Risk Liability Premium Payback Liability Provision for Employee Entitlements Other Liabilities Contributed Equity Retained Profits Reserves Dividends Earnings Per Share Capital Management Commitments for Expenditure Contingent Liabilities Events Occurring after the Balance Sheet Date Remuneration of Auditors Business Combination Interest in Other Entities Related Party Transactions Share-Based Payments Parent Entity Financial Information Company Details
52 Consolidated Income Statement Notes $m $m Premium revenue 6 1, ,820.0 Outw ards reinsurance premium expense 6 (1.3) (1.3) Net premium revenue 1, ,818.7 Claims expense (1,344.5) (1,288.7) Reinsurance and other recoveries revenue RESA levy (176.3) (179.4) State levies (30.0) (29.4) Decrease in premium payback liability Claims handling expenses 7 (16.6) (16.9) Net claims incurred (1,562.4) (1,497.9) Acquisition costs 7 (118.8) (94.6) Other underw riting expenses 7 (111.5) (102.0) Underwriting expenses (230.3) (196.6) Underwriting result Other income Other expenses 7 (66.5) (59.2) Share of net profit / (loss) of associates and joint ventures accounted for using the equity method 33 (0.3) - Operating profit Finance costs 7 (4.8) (5.3) Investment income Investment expenses 7 (1.9) (1.6) Profit before income tax Income tax expense 8(a) (54.2) (40.6) Profit for the year Profit for the year is attributable to: Ow ners of Non-controlling interests (1.1) Cents Cents Earnings per share for profit from continuing operations attributable to the ordinary equity holders of the company Basic earnings per share Diluted earnings per share Earnings per share for profit attributable to the ordinary equity holders of the company Basic earnings per share Diluted earnings per share The above Consolidated Income Statement should be read in conjunction with the accompanying notes 45
53 Consolidated Statement of Comprehensive Income Notes $m $m Profit for the year Other comprehensive income Items that may be reclassified to profit or loss Exchange differences on translation of foreign operations 24 (0.3) 3.2 Income tax related to these items 8(a)(iii) 0.2 (0.6) Items that will not be reclassified to profit or loss Revaluation of land and buildings Income tax related to these items 8(a)(iii) - (0.0) Other comprehensive income for the year, net of tax (0.1) 2.7 Total comprehensive income for the year Total comprehensive income for the year is attributable to: Ow ners of Non-controlling interests (1.1) The above Consolidated Statement of Comprehensive Income should be read in conjunction with the accompanying notes 46
54 Consolidated Balance Sheet Notes $m $m ASSETS Current assets Cash and cash equivalents Receivables Financial assets at fair value through profit or loss Deferred acquisition costs Assets classified as held for sale Total current assets Non-current assets Receivables Investments accounted for using the equity method Deferred acquisition costs Deferred tax assets 8(b) Property, plant and equipment Intangible assets Total non-current assets Total assets 1, ,045.6 LIABILITIES Current liabilities Payables Borrow ings Outstanding claims liability Unearned premium liability Premium payback liability Provision for employee entitlements Current tax liabilities Other liabilities Total current liabilities Non-current liabilities Payables Borrow ings Unearned premium liability Premium payback liability Provision for employee entitlements Deferred tax liabilities 8(c) Other liabilities Total non-current liabilities Total liabilities Net assets EQUITY Contributed equity Retained profits Reserves Capital and reserves attributable to owners of Non-controlling interests 33 (1.0) (1.6) Total equity The above Consolidated Balance Sheet should be read in conjunction with the accompanying notes 47
55 Consolidated Statement of Changes in Equity Attributable to owners of Contributed equity Retained profits Reserves Total Noncontrolling interests Total equity Notes $m $m $m $m $m $m Balance at 1 July (0.5) Profit for the year (1.1) 91.8 Revaluation of land and buildings, net of tax Transfer to retained profits on sale of land and buildings, net of tax (7.9) Movement in foreign currency translation, net of tax Total comprehensive income for the year (5.2) 95.6 (1.1) 94.5 Transactions with owners in their capacity as owners: Shares acquired by the nib Holdings Ltd Share Ow nership Plan Trust 22(c) (2.9) - - (2.9) - (2.9) Issue of shares held by nib Holdings Ltd Share Ow nership Plan Trust to employees 22(c) (0.6) Employee performance rights - value of employee services Dividends paid 25 - (51.6) - (51.6) - (51.6) (1.5) (51.6) 0.4 (52.7) - (52.7) Balance at 30 June (1.6) Balance at 1 July (1.6) Profit for the year Movement in foreign currency translation, net of tax (0.1) (0.1) - (0.1) Total comprehensive income for the year (0.1) Transactions with owners in their capacity as owners: Shares acquired by the nib Holdings Ltd Share Ow nership Plan Trust 22(c) (4.0) - - (4.0) - (4.0) Issue of shares held by nib Holdings Ltd Share Ow nership Plan Trust to employees 22(c) (1.5) Employee performance rights - value of employee services Dividends paid 25 - (76.8) - (76.8) - (76.8) (1.5) (76.8) (0.3) (78.6) - (78.6) Balance at 30 June (1.0) The above Consolidated Statement of Changes in Equity should be read in conjunction with the accompanying notes 48
56 Consolidated Statement of Cash Flows Notes $m $m Cash flows from operating activities Receipts from policyholders and customers (inclusive of goods and services tax) 2, ,935.0 Payments to policyholders and customers (1,558.0) (1,503.1) Payments to suppliers and employees (inclusive of goods and services tax) (312.0) (273.8) Interest received Distributions received Transaction costs relating to acquisition of business combination (0.1) (2.8) Interest paid (4.7) (4.8) Income taxes paid (47.1) (28.6) Net cash inflow from operating activities 9(c) Cash flow s from investing activities Proceeds from disposal of other financial assets at fair value through profit or loss Payments for other financial assets at fair value through profit or loss (318.6) (281.8) Proceeds from sale of assets classified as held for sale Proceeds from sale of property, plant and equipment and intangibles Payments for property, plant and equipment and intangibles 13,14 (15.8) (16.2) Proceeds from sale of business Payment for acquisition of business combination, net of cash acquired - (114.5) Loans provided (1.5) - Net cash (outflow) from investing activities (61.0) (211.8) Cash flows from financing activities Proceeds from borrow ings Repayment of borrow ings (35.0) - Shares acquired by the nib Holdings Ltd Share Ow nership Plan Trust 22(c) (4.0) (2.9) Dividends paid to the company's shareholders 25 (76.8) (51.6) Net cash inflow (outflow) from financing activities (80.8) 30.5 Net (decrease) in cash and cash equivalents 29.9 (32.9) Cash and cash equivalents at beginning of the year Effects of exchange rate changes on cash and cash equivalents (1.8) - Cash and cash equivalents at the end of the year Reconciliation to Consolidated Balance Sheet Cash and cash equivalents Borrow ings - overdraft (1.5) The above Consolidated Statement of Cash Flows should be read in conjunction with the accompanying notes 49
57 Notes to the Consolidated Financial Statements 1. SUMMARY OF SIGNIFICANT ACCOUNTING POLICIES The principal accounting policies adopted in the preparation of these consolidated financial statements are set out below. These policies have been consistently applied to all the years presented, unless otherwise stated. The financial statements are for the consolidated entity consisting of and its subsidiaries. Significant and other accounting policies that summarise the measurement basis used and are relevant to the understanding of financial statements are provided throughout the notes to the financial statements. a) Basis of preparation These general purpose financial statements have been prepared in accordance with Australian Accounting Standards (and interpretations issued by the Australian Accounting Standards Board) and the Corporations Act is a for-profit entity for the purpose of preparing the financial statements. i) Compliance with IFRS The consolidated financial statements of Group also comply with International Financial Reporting Standards (IFRS) as issued by the International Accounting Standards Board (IASB). ii) Historical cost convention These financial statements have been prepared under the historical cost convention, as modified by the revaluation of available-for-sale financial assets, financial assets and liabilities at fair value through profit or loss, certain classes of property, plant and equipment and investment properties. b) Principles of consolidation i) Subsidiaries The consolidated financial statements incorporate the assets and liabilities of all subsidiaries of ( parent entity ) as at 30 June 2017 and the results of all subsidiaries for the year then ended. and its subsidiaries together are referred to in this financial report as the Group. Intercompany transactions, balances and unrealised gains on transactions between Group companies are eliminated. Unrealised losses are also eliminated unless the transaction provides evidence of the impairment of the asset transferred. Accounting policies of subsidiaries are changed where necessary to ensure consistency with the policies adopted by the Group. ii) Associates Associates are all entities over which the group has significant influence but not control or joint control. This is generally the case where the group holds between 20% and 50% of the voting rights. Investments in associates are accounted for using the equity method of accounting (see (iii) below), after initially being recognised at cost. iii) Equity method Under the equity method of accounting, the investments are initially recognised at cost and adjusted thereafter to recognise the Group s share of the post-acquisition profits or losses of the investee in profit or loss, and the Group s share of movements in other comprehensive income of the investee in other comprehensive income. Dividends received or receivable from associates and joint ventures are recognised as a reduction in the carrying amount of the investment. When the Group s share of losses in an equity-accounted investment equals or exceeds its interest in the entity, including any other unsecured long-term receivables, the group does not recognise further losses, unless it has incurred obligations or made payments on behalf of the other entity. Unrealised gains on transactions between the Group and its associates and joint ventures are eliminated to the extent of the Group s interest in these entities. Unrealised losses are also eliminated unless the transaction provides evidence of an impairment of the asset transferred. Accounting policies of equity accounted investees have been changed where necessary to ensure consistency with the policies adopted by the Group. Subsidiaries are all entities (including structured entities) over which the Group has control. The Group controls an entity when the Group is exposed to, or has rights to, variable returns from its involvement with the entity and has ability to affect those returns through its power to direct the activities of the entity. Subsidiaries are fully consolidated from the date on which control is transferred to the Group. They are deconsolidated from the date that control ceases. The acquisition method of accounting is used to account for the acquisition of subsidiaries by the Group (refer to Note 32(b)). 50
58 1. SUMMARY OF SIGNIFICANT ACCOUNTING POLICIES continued b) Principles of consolidation continued iv) Changes in ownership interests The Group treats transactions with non-controlling interests that do not result in a loss of control as transactions with equity owners of the Group. A change in ownership interest results in an adjustment between the carrying amounts of the controlling and non-controlling interests to reflect their relative interests in the subsidiary. Any difference between the amount of the adjustment to non-controlling interests and any consideration paid or received is recognised in a separate reserve within equity attributable to owners of. When the Group ceases to have control, joint control or significant influence, any retained interest in the entity is remeasured to its fair value with the change in carrying amount recognised in profit or loss. This fair value becomes the initial carrying amount for the purposes of subsequently accounting for the retained interest as an associate, jointly controlled entity or financial asset. c) Foreign currency translation i) Functional and presentation currency Items included in the financial statements of each of the Group s entities are measured using the currency of the primary economic environment in which the entity operates (the functional currency ). The consolidated financial statements are presented in Australian dollars, which is s functional and presentation currency. ii) Transactions and balances Foreign currency transactions are translated into the functional currency using the exchange rates prevailing at the dates of the transactions. Foreign exchange gains and losses resulting from the settlement of such transactions and from the translation at period end exchange rates of monetary assets and liabilities denominated in foreign currencies are recognised in profit or loss, except when they are deferred in equity as qualifying cash flow hedges and qualifying net investment hedges or are attributable to part of the net investment in a foreign operation. Foreign exchange gains and losses that relate to borrowings are presented in the income statement, within finance costs. All other foreign exchange gains and losses are presented in the income statement on a net basis within other income or other expenses. Non monetary items that are measured at fair value in a foreign currency are translated using the exchange rates at the date when the fair value was determined. Translation differences on assets and liabilities carried at fair value are reported as part of the fair value gain or loss. For example, translation differences on non monetary assets and liabilities such as equities held at fair value through profit or loss are recognised in profit or loss as part of the fair value gain or loss and translation differences on nonmonetary assets such as equities classified as available for sale financial assets are recognised in other comprehensive income. iii) Group companies The results and financial position of foreign operations (none of which has the currency of a hyperinflationary economy) that have a functional currency different from the presentation currency are translated into the presentation currency as follows: assets and liabilities for each balance sheet presented are translated at the closing rate at the date of that balance sheet; income and expenses for each income statement and statement of comprehensive income are translated at average exchange rates (unless this is not a reasonable approximation of the cumulative effect of the rates prevailing on the transaction dates, in which case income and expenses are translated at the dates of the transactions); and all resulting exchange differences are recognised in other comprehensive income. Goodwill and fair value adjustments arising on the acquisition of a foreign operation are treated as assets and liabilities of the foreign operation and translated at the closing rate. d) Assets backing private health insurance liabilities As part of the investment strategy, the Group actively manages its investment portfolio to ensure that a portion of its investments mature in accordance with the expected pattern of future cash flows arising from private health insurance liabilities. With the exception of property, plant and equipment, and the investment in unlisted equity securities, the Group has determined that all financial assets of nib health funds limited and nib nz limited are held to back private health insurance liabilities. e) Rounding of amounts The company is of a kind referred to in Instrument 2016/191, issued by the Australian Securities and Investments Commission, relating to the rounding off of amounts in the Financial Report. Amounts in the Financial Report have been rounded off in accordance with that Instrument to the nearest hundred thousand dollars, or in certain cases, the nearest dollar. 51
59 1. SUMMARY OF SIGNIFICANT ACCOUNTING POLICIES continued f) New and amended standards adopted by the Group The Group has not applied any new standards or amendments during the annual reporting period commencing 1 July g) New accounting standards and interpretations not yet adopted Certain new accounting standards and interpretations have been published that are not mandatory for 30 June 2017 reporting periods. The Group s assessment of the impact of these new standards and interpretations is set out below. Title of standard Nature of change and impact Mandatory application date AASB 9 Financial Instruments AASB 9 addresses the classification, measurement and derecognition of financial assets and financial liabilities and introduces new rules for hedge accounting. While the Group is yet to undertake a detailed assessment, it doesn t expect any significant impact from this standard. Mandatory for financial years commencing on or after 1 January At this stage, the group does not intend to adopt the standard before its effective date. AASB 15 Revenue from Contracts with Customers The AASB has issued a new standard for the recognition of revenue. This will replace AASB 118 which covers contracts for goods and services and AASB 111 which covers construction contracts. The new standard is based on the principle that revenue is recognised when control of a good or service transfers to a customer. The majority of the Group s revenue is recognised under AASB 1023 General Insurance Contracts which is not impacted by AASB 15. While the Group is yet to undertake a detailed assessment, it doesn t expect any significant impact from this standard. Mandatory for financial years commencing on or after 1 January At this stage, the group does not intend to adopt the standard before its effective date. AASB 16 Leases AASB 16 will primarily affect the accounting of leases by lessees and will result in the recognition of almost all leases on the balance sheet. The standard removes the current distinctions between operating and financing leases and requires recognition of an asset (the right to use the leased item) and a financial liability to pay rentals for almost all the lease contracts. The income statement will also be affected because the total expense is typically higher in the earlier years of a lease and lower in later years. Additionally, operating lease expenses will be replaced with interest and depreciation. As at the reporting date, the Group has noncancellable operating lease commitments of $66.6 million (see Note 28). The Group is currently undertaking a detailed assessment of the impact of this standard. Mandatory for financial years commencing on or after 1 January At this stage, the group does not intend to adopt the standard before its effective date. 52
60 1. SUMMARY OF SIGNIFICANT ACCOUNTING POLICIES continued g) New accounting standards and interpretations not yet adopted continued Title of standard Nature of change and impact Mandatory application date IFRS 17 Insurance Contracts On 19 July 2017, Australian Accounting Standard Board issued AASB 17 Insurance Contracts, incorporating the recently issued IFRS 17 Insurance Contracts. This will replace AASB 4 Insurance Contracts, AASB 1023 General Insurance Contracts and AASB 1038 Life Insurance Contracts. IFRS 17 will change the accounting for insurance contracts by nib. The standard introduces three new measurement approaches for accounting for insurance contracts. These include the Building Block Approach for long term contracts, the Premium Allocation Approach for short term contracts and a Variable Fee Approach for direct participating products. The Group has formed a project team to assess the impact of this change on the operations and financial statements of the business. Disclosure changes and possible impacts on the profit and loss are expected. Mandatory for financial years commencing on or after 1 January At this stage, the group does not intend to adopt the standard before its effective date. 53
61 2. CRITICAL ACCOUNTING JUDGEMENTS AND ESTIMATES The preparation of financial statements requires the use of certain critical accounting estimates. It also requires management to exercise its judgment in the process of applying the Group's accounting policies. The Group makes estimates and assumptions in respect of certain key assets and liabilities. Estimates and judgments are continually evaluated and are based on historical experience and other factors, including expectations of future events that are believed to be reasonable under the circumstances. The key areas in which critical estimates are applied are: Note 12 Deferred acquisition costs Note 14 Goodwill and indefinite life intangibles impairment and useful life of brand names and trademarks Note 17 Outstanding claims liability Notes 18 and 19 Liability adequacy test Note 19 Premium payback liabilities Note 29 Contingent liabilities ACCC matter 54
62 3. RISK MANAGEMENT The financial condition and operations of the Group are affected by a number of key financial and non-financial risks including: Insurance risk Pricing risk Claims inflation Risk equalisation (Australia only) Concentration of insurance contracts Financial risks Fair value interest rate risk Foreign exchange risk Price risk Credit risk Liquidity risk Non-financial risks Operational risk Strategic risk Sovereign risk Regulatory and compliance risk The Board of nib is ultimately responsible for the Group s risk management framework and oversees the Groups operations by ensuring that management operates within the approved risk appetite statement. The Board approved the Group s overall risk management strategy, risk appetite and policies and practices to ensure that risks are identified and managed within the context of this appetite. The Board s sub committees, including the Audit Committee and the Risk and Reputation Committee assist the Board in the execution of its responsibilities. The responsibilities of these Committees are detailed in their respective Charters. The Group s risk management framework is based on a three lines of defence model and provides defined risk ownership responsibilities with functionally independent oversight and assurance. The Group manages risks through: the governance structure established by the Board, implementation of the risk management framework by management, oversight of the risk management framework by the Risk function, the Group s internal policies and procedures designed to identify and mitigate risks, Internal audit which provides independent assurance to the Board regarding the appropriateness, effectiveness and adequacy of controls over activities where risks are perceived to be high, Regular risk and compliance reporting to the Board and relevant Board Committees, Application of solvency and capital adequacy standards for nib health funds limited and nib New Zealand (regulated by APRA and RBNZ respectively). The Group s objective is to manage the Group s risks in line with the Board approved risk appetite statement. Various procedures are in place to identify, mitigate and monitor the risks faced by the Group. Management are responsible for understanding and managing risks, including financial and non-financial risks. The Group s exposure to all high and critical risks, and other Key Enterprise Risks, is reported quarterly to the Board via the Risk and Reputation Committee. a) Insurance risk Insurance risk is the risk that inadequate or inappropriate underwriting, claims management, product design and pricing will expose the Group to financial loss from claims expenditure exceeding the amount implicit in premium income. Insurance risk is seen as a key risk to our PHI focused businesses. There are a number of sources of risk that as a collective require nib to closely review and monitor our control strategies. These risks have Board oversight. These sources include: 55
63 3. RISK MANAGEMENT continued a) Insurance risk continued Description Exposure Mitigation Pricing risk Australian health insurance premium increases for existing products are required to be approved by the minister for Health. Historically, nib and other health funds have only raised premiums once a year. There is a risk that nib s application for a change in premium rates may only receive approval at a level lower than originally requested, or may be rejected by the Minister. Such an amendment or rejection may have a negative impact on nib s operating and financial performance. New Zealand policies do not require approval by the regulator and can be changed at any time during the year. International students health insurance products can raise premiums in line with a Deed set out between the Insurer and the Commonwealth; prices are ordinarily set annually and require notification to the Department of Health. International workers health insurance product premiums do not require approval by a regulator. This risk is managed by establishing product premiums through the use of actuarial models based on historical claims costs and forecast claims inflation. Pricing recommendations are internally prepared by an actuarial team and externally reviewed by the Appointed Actuary. Claims inflation nib is subject to significant claims inflation which may not be adequately covered by premium price increases and/or product design changes. In Australia the principle of community rating prevents private health insurers from improperly discriminating between people who are or wish to be insured, on the basis of their health status, age, race, gender, religious beliefs, sexuality, frequency of need of health care, lifestyle or claims history. Community rating only applies to Australian residents health insurance and international student health insurance, but not to international workers health Insurance or New Zealand health insurance. Claims patterns are monitored and premiums calculated accordingly. A rigorous approach to product design mitigates the risk of the group being exposed to adverse selection. Maintenance of reserves in excess of minimum solvency and capital requirements allows the Group to withstand increased levels of claims inflation. Robust claims handling processes and controls which are well documented. Defined underwriting processes in New Zealand. Risk equalisation special account arrangements Risk equalisation arrangements apply to the registered health insurance industry in Australia. Under these arrangements all registered health insurers effectively provide reinsurance support so that the industry as a whole shares the hospital cost of high risk groups irrespective of whether those claims are attributable to a policyholder of a particular fund. Risk equalisation is only applicable to Australian residents health insurance. Risk equalisation provides some protection to high cost claims however exposes the Group to claims from other health insurers. Actuarial models are used to monitor past experience and predict future costs, premiums are calculated accordingly. Concentration of insurance contracts nib provides health insurance contracts to Australian and New Zealand residents and international students and workers visiting Australia There is no significant risk associated with this concentration of insurance contracts. 56
64 3. RISK MANAGEMENT continued b) Fair value interest rate risk Description Exposure Mitigation Risk of fluctuations in interest rates impacting the Group s financial performance or the fair value of its financial instruments. The Group s main interest rate risk arises from longterm borrowings. Borrowings issued at variable rates expose the Group to cash flow interest rate risk. Borrowings issued at fixed rates expose the Group to fair value interest rate risk if the borrowings are carried at fair value. The Group s borrowings at variable rate were denominated in Australian and New Zealand Dollars. The Group s other interest rate risks arise from: receivables; financial assets at fair value through profit and loss; and cash and cash equivalents All other receivables are non-interest bearing. There is an interest-bearing component of financial assets at fair value through profit and loss. The Group mitigates interest rate risk on long term borrowings by maintaining an appropriate gearing ratio and monitoring and forecasting key indicators such as interest expense coverage. nib receives advice on its investments from its asset consultants. As at the end of the reporting period, the Group had the following variable rate borrowings outstanding: Weighted average interest rate Balance Weighted average interest rate Balance % $m % $m Bank loans 3.1% % Net exposure to cash flow interest rate risk The bank overdraft comprised of the closing positive balance of the bank account, adjusted for unpresented cheques and outstanding deposits is not included in bank loans. An analysis by maturities is provided at 3(f). The table below summarises the sensitivity of the Group s financial assets and financial liabilities to interest rate risk. Interest rate risk bps +100bps +100bps +100bps Carrying amount Profit Equity Profit Equity Carrying amount Profit Equity Profit Equity $m $m $m $m $m $m $m $m $m $m Financial assets Cash and cash equivalents (0.8) (0.8) (0.6) (0.6) Other receivables 10.8 (0.1) (0.1) (0.1) (0.1) Financial assets at fair value through profit or loss (6.0) (6.0) (6.1) (6.1) Financial liabilities Bank loans (151.7) (1.1) (1.1) (151.9) (1.1) (1.1) Premium payback liability (23.0) (0.7) (0.7) (27.4) (1.0) (1.0) Total increase / (decrease) (5.4) (5.4) (5.6) (5.6) 57
65 3. RISK MANAGEMENT continued c) Foreign exchange risk Description Exposure Mitigation Risk of fluctuations in foreign exchange rates impacting the Group s financial performance. The Group operates internationally and is exposed to foreign exchange risk arising from foreign currency translation risk through its subsidiaries located in overseas jurisdictions. In accordance with the policy set out in Note 1(c), foreign exchange gains or losses arising on translation of the Group s foreign operations to the Group s Australian dollar presentation currency are recognised directly in equity. Foreign exchange gains or losses arising on assets and liabilities denominated in foreign currencies are recognised directly in profit and loss. The Group does not hedge this risk. The table below summarises the sensitivity of the Group s equity to a 10% strengthening and weakening of the Australian dollar against the foreign currency, with all other variables held constant. Foreign exchange risk % +10% Exposure Profit Equity Profit Equity Exposure Profit Equity Profit Equity $m $m $m $m $m $m $m $m $m $m Brazilian real (0.4) Canadian dollar (0.1) European euro (0.1) (0.2) Great Britain pound New Zealand dollar (6.3) (5.5) United States dollar (0.8) (0.1) Thai baht Total increase / (decrease) (6.3) (0.1) (5.5) % +10% 58
66 3. RISK MANAGEMENT continued d) Price risk Description Exposure Mitigation Risk of fluctuations in price of equity securities impacting the Group s fair value of its financial instruments. The Group is exposed to equity securities price risk. This arises from investments held by the Group and classified on the balance sheet as at fair value through profit or loss. The Group is not exposed to commodity price risk. To manage its price risk the Group has adopted an investment strategy which delivers a diversified portfolio with a heavier weighting to defensive assets versus growth assets. Profit after tax for the year would increase/decrease as a result of gains/losses on equity securities classified as at fair value through profit or loss. The table below summarises the sensitivity of the Group s financial assets to price risk. Other price risk % unit price Carrying amount Profit Equity Profit Equity +10% unit price -10% unit price +10% unit price Carrying amount Profit Equity Profit Equity $m $m $m $m $m $m $m $m $m $m Financial assets Financial assets at fair value through profit or loss (7.7) (7.7) (6.8) (6.8) Total increase / (decrease) (7.7) (7.7) (6.8) (6.8) Methods and assumptions used in preparing sensitivity analysis The after tax effect on profit and equity of movements in foreign exchange, interest rate and price have been calculated using reasonably possible changes in the risk variables, based on recent interest rate and market movements. An interest rate change of 100 basis points will directly affect interest received on cash and cash equivalents and other receivables. An interest rate change of 100 basis points will inversely affect the unit price of fixed interest investments; this change has been calculated by multiplying the average duration of underlying investments in each portfolio by the interest rate change. All other investments are not directly affected by interest rate changes but would be revalued through profit or loss as their unit price changes. 59
67 3. RISK MANAGEMENT continued e) Credit risk Description Exposure Mitigation Risk that a counterparty will default on its contractual obligations, or from the decline in the credit quality of a financial instrument, resulting in financial loss to the Group. Credit risk arises from: cash and cash equivalents; financial assets and deposits with banks and financial institutions; favourable derivative financial instruments; and credit exposures to policyholders and the Department of Human Services (Private Health Insurance Premiums Reduction Scheme). The maximum exposure to credit risk, excluding the value of any collateral or other security, at balance date is the carrying amount, net of any provisions for impairment loss, as disclosed in the balance sheet and notes to the financial statements. Apart from the Department of Human Services the Group does not have any material credit risk to any other single debtor or group of debtors under financial instruments entered into. Term deposits are held with institutions that have at least an A-2 credit rating. nib receives advice from its asset consultants, Credit risk for premium receivables are minimal due to the diversification of policyholders. The Private Health Insurance Premiums Reduction Scheme receivable is due from a government organisation under legislation. The credit quality of financial assets that are neither past due nor impaired can be assessed by reference to external credit ratings (if available) or to historical information about counterparty default rates Other receivables $m $m Counterparties w ith external credit rating Counterparties w ithout external credit rating Group 1 - new debtors (relationship less than 6 months) Group 2 - existing debtors w ith no defaults in the past Group 3 - existing debtors w ith some defaults in the past. All defaults w ere fully recovered Total other receivables Cash at bank and short-term bank deposits A A BBB Total cash at bank and short-term bank deposits Financial assets at fair value through profit or loss Short term deposits A Interest-bearing securities 1 AAA AA A BBB Sub investment grade Unclassified Total financial assets at fair value through profit or loss The financial assets at fair value through profit and loss with credit risk are held in unit trusts. The above table summarises the underlying investments of the unit trusts. 60
68 3. RISK MANAGEMENT continued f) Liquidity risk Description Exposure Mitigation Risk that the Group won t be able to meet its financial obligations as they fall due, because of lack of liquid assets or access to funding on acceptable terms. Liquidity risk arises from: trade creditors; other payables; and borrowings The Group manages liquidity risk by continuously monitoring forecast and actual cash flows and holding a high percentage of highly liquid investments. The bank overdraft within borrowings comprises the closing positive balances of the bank account, adjusted for unpresented cheques and outstanding deposits. There are no overdraft facilities. Maturities of financial liabilities The table below analyses the Group s financial liabilities into relevant maturity groupings based on the remaining period at the reporting date to the contractual maturity date. The amounts disclosed are the contractual undiscounted cash flows. < 1 month 1-3 months 3-12 months 1-5 years > 5 years Total contractual cash flows Carrying amount Group at 30 June 2017 $m $m $m $m $m $m $m Financial Liabilities Trade creditors Other payables Borrow ings < 1 month 1-3 months 3-12 months 1-5 years > 5 years Total contractual cash flows Carrying amount Group at 30 June 2016 $m $m $m $m $m $m $m Financial Liabilities Trade creditors Other payables Borrow ings
69 4. FAIR VALUE MEASUREMENT a) Fair value hierarchy This section explains the judgements and estimates made in determining the fair values of the financial instruments that are recognised and measured at fair value in the financial statements. To provide an indication about the reliability of the inputs used in determining fair value, the Group classifies its financial instruments into the three levels prescribed under the accounting standards. An explanation of each level follows below the table. The following tables present the Group s assets and liabilities measured and recognised at fair value at 30 June 2017 and 30 June 2016: Level 1 Level 2 Level 3 Total Group at 30 June 2017 $m $m $m $m Assets Cash and cash equivalents and deposits at call Receivables Financial assets at fair value through profit or loss Equity securities Interest-bearing securites Short term deposits Property, plant and equipment Land and buildings Total assets Land and buildings were transferred to assets classified as held for sale during the year. Level 1 Level 2 Level 3 Total Group at 30 June 2016 $m $m $m $m Assets Cash and cash equivalents and deposits at call Financial assets at fair value through profit or loss Equity securities Interest-bearing securites Short term deposits Property, plant and equipment Land and buildings Total assets There were no transfers between level 1 and level 2 during the year. The Group s policy is to recognise transfers into and transfers out of the fair value hierarchy levels as at the end of the reporting period. The fair value of financial instruments traded in active markets (such as financial assets at fair value through profit and loss) is based on quoted market prices at the reporting date. The quoted market price used for financial assets held by the Group is the current bid price. These instruments are included in level 1. 62
70 4. FAIR VALUE MEASUREMENT continued a) Fair value hierarchy continued Level 1 The fair value of financial instruments traded in active markets (such as financial assets at fair value through profit and loss) is based on quoted market prices at the reporting date. The quoted market price used for financial assets held by the Group is the current bid price. These instruments are included in level 1. Level 2 The fair value of financial instruments that are not traded in active markets (for example interest bearing securities) is determined using valuation techniques. The Group uses a variety of methods and makes assumptions that are based on market conditions existing at each balance date. These instruments are included in level 2. Level 3 If one or more of the significant inputs is not based on observable market data, the instrument is included in level 3. b) Valuation techniques used to determine fair values Specific valuation techniques used to value financial instruments include: The use of quoted market prices or dealer quotes for similar instruments. Other techniques, such as discounted cash flow analysis, are used to determine fair value for the remaining financial instruments. All of the resulting fair value estimates for financial instruments are included in level 2. Freehold land and buildings classified as held for sale during the reporting period were measured using a non-recurring level 3 fair value measurement. c) Fair value measurements using significant unobservable inputs (level 3) i) Transfers between levels 2 and 3 There were no transfers between the levels of the fair value hierarchy during the year. There were also no changes during the year to any of the valuation techniques applied as of 30 June i) Valuation process The finance department of the Group includes a team that performs the valuations of non-property assets required for financial reporting purposes, including level 3 fair values. This team reports directly to the Chief Financial Officer (CFO) and the Audit Committee (AC). Discussions of valuation processes and results are held between the CFO, AC and the valuation team at least once every six months, in line with the Group s half-yearly reporting dates. Changes in level 2 and 3 fair values are analysed at each reporting date during the half-yearly valuation discussion between the CFO, AC and the valuation team. As part of this discussion, the team presents a report that explains the reason for the fair value movements. d) Fair values of other financial instruments The Group also had another financial instrument which was not measured at fair value in the balance sheet. This had the following fair value as at 30 June 2017: Carrying Carrying amount Fair value amount Fair value Non-current borrowings $m $m $m $m Bank loans The carrying value less impairment provision of other receivables and payables are assumed to approximate their fair values due to their short-term nature. 63
71 5. SEGMENT REPORTING Operating segments are reported in a manner consistent with the internal reporting provided to Executive management. The chief operating decision maker, who is responsible for allocating resources and assessing performance of the operating segments, has been identified as the Managing Director/Chief Executive Officer (MD/CEO). The MD/CEO assesses the performance of the operating segments based on underlying operating profit. This measurement basis excludes from the operating segments the effects of non-recurring gain on sale of controlling interest of Whitecoat business and profit on sale of the head office building, and non-recurring expenditure such as integration costs, merger and acquisition costs, new business implementation costs and amortisation of acquired intangibles. No information regarding assets, liabilities and income tax is provided for individual Australian Residents Health Insurance and International (Inbound) Health Insurance segments to the MD/CEO. Furthermore, investment income and expenditure for Australia is not allocated to individual Australian segments as this type of activity is driven by the central treasury function, which manages the cash position of the Australian companies. Management has determined the operating segments based on the reports reviewed by the MD/CEO that are used to make strategic decisions. The MD/CEO considers the business from both a geographic and product perspective and has identified five reportable segments: Australian Residents Health Insurance nib s core product offering within the Australian private health insurance industry New Zealand Residents Health Insurance nib s core product offering within the New Zealand private health insurance industry International (Inbound) Health Insurance nib s offering of health insurance products for international students and workers World Nomads Group nib s distribution of travel insurance products nib Options 1 nib s facilitation of access to cosmetic and dental treatment both overseas and here in Australia 1. In May 2017, the Group commenced winding down the operations of nib Options. Business termination costs have been provided for at 30 June
72 5. SEGMENT REPORTING continued For the year ending 30 June 2017 Australian International Residents (Inbound) New Zealand World Health Health Health Nomads nib Unallocated Insurance Insurance Insurance Group Options to segments Total $m $m $m $m $m $m $m Premium revenue 1, ,944.4 Outw ards reinsurance premium expense - (1.3) (1.3) Net premium revenue 1, ,943.1 Claims expense (1,194.9) (28.7) (120.9) (1,344.5) Reinsurance and other recoveries revenue RESA (176.3) (176.3) State levies (30.0) (30.0) Decrease in premium payback liability Claims handling expenses (13.6) (1.0) (2.0) (16.6) Net claims incurred (1,414.8) (29.0) (118.6) (1,562.4) Acquisition costs (73.5) (9.6) (35.7) (118.8) Other underw riting expenses (74.0) (11.2) (21.5) (106.7) Underwriting expenses (147.5) (20.8) (57.2) (225.5) Underwriting result Other income Other expenses (50.1) (3.3) (9.2) (62.6) Share of net profit / (loss) of associates and joint ventures accounted for using the equity method (0.3) (0.3) Underlying operating profit / (loss) (3.3) (6.4) Items not included in underlying operating profit Amortisation of acquired intangibles - (0.8) (4.0) (2.8) - - (7.6) One-off transactions, merger, acquisition and new business implementation costs (0.2) Finance costs (4.8) Investment income 30.5 Investment expenses (1.9) Profit before income tax from continuing operations Inter-segment other income Depreciation and amortisation Total assets ,136.1 Total liabilities Insurance liabilities Outstanding claims liability Unearned premium liability Premium payback liability Total Inter-segment other income is eliminated on consolidation and not included in operating profit. 65
73 5. SEGMENT REPORTING continued For the year ending 30 June 2016 Australian Residents Health Insurance International (Inbound) Health Insurance New Zealand Health Insurance World Nomads Group nib Options Unallocated to segments Total 11 months $m $m $m $m $m $m $m Premium revenue 1, ,820.0 Outw ards reinsurance premium expense - (1.3) (1.3) Net premium revenue 1, ,818.7 Claims expense (1,125.3) (42.4) (121.0) (1,288.7) Reinsurance and other recoveries revenue RESA (179.4) (179.4) State levies (29.4) (29.4) Decrease in premium payback liability Claims handling expenses (14.5) (0.9) (1.5) (16.9) Net claims incurred (1,348.6) (42.6) (106.7) (1,497.9) Acquisition costs (60.9) (6.9) (26.8) (94.6) Other underw riting expenses (64.8) (10.3) (22.7) (97.8) Underwriting expenses (125.7) (17.2) (49.5) (192.4) Underwriting result Other income Other expenses (40.3) (2.6) (7.9) (50.8) Share of net profit / (loss) of associates and joint ventures accounted for using the equity method Underlying operating profit / (loss) (2.6) (4.1) Items not included in underlying operating profit Amortisation of acquired intangibles - (0.8) (3.4) (3.6) - - (7.8) One-off transactions, merger, acquisition and new business implementation costs (1.9) - (1.5) (3.4) Finance costs (5.3) Investment income 18.5 Investment expenses (1.6) Profit before income tax from continuing operations Inter-segment other income Depreciation and amortisation Total assets ,045.6 Total liabilities Insurance liabilities Outstanding claims liability Unearned premium liability Premium payback liability Total Inter-segment other income is eliminated on consolidation and not included in operating profit. 66
74 6. REVENUE AND OTHER INCOME $m $m Premium revenue 1, ,820.0 Outw ards reinsurance premiums (1.3) (1.3) Net premium revenue 1, ,818.7 Other income Travel insurance commission Life and funeral insurance commission and other commissions Agency fee Profit on sale of head office building Deferred profit on sale and leaseback of head office building Gain on sale of controlling interest of Whitecoat business Sundry income Investment income Interest Net realised gain on financial assets at fair value through profit or loss Net unrealised gain on financial assets at fair value through profit or loss (8.0) (7.4) a) Accounting policy Revenue is measured at the fair value of the consideration received or receivable. Amounts disclosed as revenue are net of amounts collected on behalf of third parties. The Group recognises revenue when the amount of revenue can be reliably measured, it is probable that future economic benefits will flow to the entity and specific criteria have been met for each of the Group s activities as described below. The Group bases its estimates on historical results, taking into account the type of customer, the type of transaction and the specifics of each arrangement. Revenue is recognised for the major business activities as follows: i) Premium revenue Premium revenue comprises premiums from private health insurance contracts held by policyholders. Premium revenue is recognised when it has been earned. Premium revenue is recognised from the attachment date over the period of the contract. The attachment date is from when the insurer accepts the risk from the insured under the insurance contract. Revenue is recognised in accordance with the pattern of the incidence of risk expected over the term of the contract. The proportion of the premium received or receivable not earned in the income statement at the reporting date is recognised in the balance sheet as an unearned premium liability. Any non-current portion is discounted based on expected settlement dates. Premiums on unclosed business are brought to account using estimates based on payment cycles nominated by the policyholder. 67
75 6. REVENUE AND OTHER INCOME continued a) Accounting policy continued i) Investment income Net fair value gains or losses on financial assets classified as at fair value through profit or loss are recognised in the period. Rental revenue from leasing of investment properties is recognised in the period in which it is receivable, as this represents the pattern of service rendered through the provision of the properties. Interest income is recognised using the effective interest method. When a receivable is impaired, the Group reduces the carrying amount to its recoverable amount, being the estimated future cash flow discounted at the original effective interest rate of the instrument, and continues unwinding the discount as interest income. Interest income on impaired loans is recognised using the original effective interest rate. ii) Outwards reinsurance Premiums ceded to reinsurers under insurance contracts held by the Group are recognised as an outwards reinsurance expense and are recognised in the income statement from the attachment date over the period of indemnity of the reinsurance contract in accordance with the expected pattern of the incidence of risk ceded. iii) Revenue from travel insurance commission Revenue in the form of commissions is recognised when the sale of an insurance policy to a customer occurs. Revenue is also generated on travel services activities and recognised as the service is performed. 68
76 7. EXPENSES $m $m Expenses by function Claims handling expenses Acquisition costs Other underw riting expenses Other expenses Finance costs Investment expenses Total expenses (excluding direct claims expenses) Expenses by nature Amortisation of acquired intangibles Bank charges Communications, postage and telephone expenses Depreciation and amortisation Employee costs Finance costs Information technology expenses Investment expenses Marketing expenses - excluding commissions Marketing expenses - commissions Merger, acquisition and new business implementation costs Operating lease rental expenses Professional fees Other expenses Total expenses (excluding direct claims expenses)
77 8. TAXATION a) Income tax Notes $m $m i) Income tax expense Recognised in the income statement Current tax expense Deferred tax expense Under (over) provided in prior years Under (over) provided in prior years - research and development tax credit (0.2) (0.5) Income tax expense is attributable to: Profit from continuing operations Aggregate income tax expense Deferred income tax expense included in income tax expense comprises: Increase in deferred tax assets 8(b) (0.6) (0.5) Increase in deferred tax liabilities 8(c) ii) Numerical reconciliation of income tax expense to prima facie tax payable Profit from continuing operations before income tax expense Tax at the Australian tax rate of 30% (2016: 30%) Tax effect of amounts w hich are not deductible (taxable) in calculating taxable income: Sundry items Net assessable trust distributions Imputation credits and foreign tax credits (0.6) (0.6) Adjustment for current tax of prior periods Current year - research and development tax credit (0.3) - Adjustment for current tax of prior periods - research and development tax credit (0.2) (0.5) Unrecognised tax losses and deferred tax assets Differences in foreign tax rates (0.1) (0.3) Income tax expense iii) Tax expense relating to items of other comprehensive income Foreign currency translations 24 (0.2) 0.7 Revaluation of land and buildings (0.2) 0.7 iv) Amounts recognised directly to equity Aggregate current and deferred tax arising in the reporting period and not recognised in net profit or loss or other comprehensive income but directly debited or credited to equity: Transfer from revaluation reserve on sale of land and buildings - (3.4) - (3.4) v) Tax losses Unused tax losses for w hich no deferred tax asset has been recognised Potential tax benefit at 30%
78 8. TAXATION continued b) Deferred tax assets $m $m The balance comprises temporary differences attributable to: Deferred profit on sale and leaseback of head office building Employee benefits Premium payback liabilities Unrealised losses on investments Other Doubtful debts Merger and acquisition costs Outstanding claims Provisions Tax losses Total deferred tax assets Set-off of deferred tax liabilities pursuant to set-off provisions 8(c) (18.9) (17.5) Net deferred tax assets Recovery of total deferred tax assets: Deferred tax assets to be recovered w ithin 12 months Deferred tax assets to be recovered after more than 12 months Movements Deferred profit on sale and leaseback of head office building Employee benefits Premium payback liabilites Unrealised losses on investments Other Total $m $m $m $m $m $m At 1 July (Charged)/credited to the income statement (4.4) (Charged)/credited directly to other comprehensive income Acquisition of businesses At 30 June At 1 July (Charged)/credited to the income statement (0.1) (0.1) (1.2) 2.2 (0.2) 0.6 (Charged)/credited directly to other comprehensive income At 30 June
79 8. TAXATION continued c) Deferred tax liabilities $m $m The balance comprises temporary differences attributable to: Brands and trademarks and customer contracts Deferred acquisition costs Depreciation and amortisation Unrealised foreign exchange gains Unrealised gains on investments Other Asset revaluation Investment in associates and joint ventures Unearned premium liability Total deferred tax liabilities Set-off of deferred tax liabilities pursuant to set-off provisions 8(b) (18.9) (17.5) Net deferred tax liabilities Recovery of total deferred tax liabilities: Deferred tax liabilities to be settled w ithin 12 months Deferred tax liabilities to be settled after more than 12 months Movements Brands and trademarks and customer contracts Deferred acquisition costs Depreciation and amortisation Unrealised foreign exchange losses Unrealised gains on investments Other Total $m $m $m $m $m $m $m At 1 July (Charged)/credited to the income statement (1.8) (1.5) (Charged)/credited directly to other comprehensive income (Charged)/credited directly to equity - - (0.8) - - (2.6) (3.4) Acquisition of businesses At 30 June At 1 July (Charged)/credited to the income statement (0.3) 4.7 (0.5) (0.2) (Charged)/credited directly to other comprehensive income (0.2) (0.2) At 30 June
80 8. TAXATION continued d) Accounting policy The income tax expense or revenue for the period is the tax payable on the current period s taxable income based on the applicable income tax rate for each jurisdiction adjusted by changes in deferred tax assets and liabilities attributable to temporary differences and to unused tax losses. Deferred income tax is provided in full, using the liability method, on temporary differences arising between the tax bases of assets and liabilities and their carrying amount in the consolidated financial statements. However, the deferred income tax is not accounted for if it arises from initial recognition of an asset or liability in a transaction other than a business combination that at the time of the transaction affects neither accounting nor taxable profit or loss. Deferred income tax is determined using tax rates (and laws) that have been enacted or substantially enacted by the reporting date and are expected to apply when the related deferred income tax asset is realised or the deferred income tax liability is settled. Deferred tax assets are recognised for deductible temporary differences and unused tax losses only if it is probable that future taxable amounts will be available to utilise those temporary differences and losses. Deferred tax liabilities and assets are not recognised for temporary differences between the carrying amount and tax bases of investments in controlled entities where the parent entity is able to control the timing of the reversal of the temporary differences and it is probable that the differences will not reverse in the foreseeable future. Deferred tax assets and liabilities are offset when there is a legally enforceable right to offset current tax assets and liabilities and when the deferred tax balances relate to the same taxation authority. Current tax assets and tax liabilities are offset where the entity has a legally enforceable right to offset and intends either to settle on a net basis, or to realise the asset and settle the liability simultaneously. and its wholly-owned Australian controlled entities are a tax consolidated group. Also, nib options pty limited and its wholly-owned Australian controlled entities are a tax consolidated group. As a consequence, the entities within each group are taxed as a single entity and the deferred tax assets and liabilities of these entities are set-off in the consolidated financial statements. Current and deferred tax is recognised in profit or loss, except to the extent that it relates to items recognised in other comprehensive income or directly in equity. In this case, the tax is also recognised in other comprehensive income or directly in equity, respectively. e) Change in accounting policy Recent guidance was published by the International Financial Reporting Interpretation Committee (IFRIC) on applicable indefinite life intangibles for the purposes of measuring deferred tax in accordance with AASB 112 Income Taxes. This latest interpretation requires the recognition of deferred tax liabilities on intangibles assets with indefinite lives if there is no intent to sell the asset. Prior to this interpretation, the Group did not recognise deferred tax liabilities on indefinite life intangibles (Brand Names). As such, the Group has retrospectively changed its accounting policy which has resulted in an increase in Goodwill and Deferred Tax Liabilities of $6.5 million relating to the acquisition of World Nomads Group. 73
81 9. CASH AND CASH EQUIVALENTS $m $m Cash at bank and cash on hand Short term deposits and deposits at call a) Accounting policy Cash and cash equivalents, and bank overdrafts, are carried at face value of the amounts deposited or drawn. For the purpose of the presentation in the consolidated statement of cash flows, cash and cash equivalents includes cash on hand, deposits held at call with financial institutions, other short-term, highly liquid investments with original maturities of three months or less that are readily convertible to known amounts of cash and which are subject to an insignificant risk of changes in value, and bank overdrafts. Bank overdrafts are shown within borrowings in current liabilities on the balance sheet. b) Risk exposure The Group s exposure to interest rate risk is discussed in Note 3(b). The maximum exposure to credit risk at the reporting date is the carrying amount of each class of cash and cash equivalents mentioned above. c) Reconciliation of profit after income tax to net cash inflow from operating activities $m $m Profit for the year Net (gain) / loss on disposal of property, plant and equipment Profit on sale of head office building - (1.4) Deferred profit on sale and leaseback of head office building (0.4) (0.1) Fair value (gain) / loss on other financial assets through profit or loss Share of net (profit) / loss of associates and joint ventures Non-cash employee benefits expense - share-based payments Depreciation and amortisation Gain on sale of controlling interest of Whitecoat business (5.6) - Net exchange differences 0.2 (3.7) Change in operating assets and liabilities, net of effect from purchase of controlled entity Decrease (increase) in current tax assets - - Decrease (increase) in receivables Decrease (increase) in deferred acquisition costs (18.4) (19.1) Decrease (increase) in deferred tax assets 0.8 (1.3) Increase (decrease) in trade payables Increase (decrease) in unearned premium liability Increase (decrease) in premium payback liability (4.4) (13.5) Increase (decrease) in current tax liabilities Increase (decrease) in deferred tax liabilities Increase (decrease) in provisions Net cash flow from operating activities d) Off-balance sheet arrangements World Nomads Group Pty Limited (WNG), a wholly owned subsidiary of, operates bank accounts held in their name on behalf of their underwriters in accordance with contractual terms governing the arrangements. These accounts are not considered part of the cash and cash equivalents of WNG as they do not have the control over the cash. At 30 June 2017 this amounted to $15,839,278 (2016: $17,054,596). 74
82 10. RECEIVABLES $m $m Current Premium receivable Private Health Insurance Premiums Reduction Scheme receivable Other receivables Provision for impairment loss (1.9) (1.1) Prepayments Expected future reinsurance recoveries undiscounted on claims paid on outstanding claims Non-current Other receivables As at 30 June 2017, current receivables of the Group with a nominal value of $1.858 million (2016: $1.092 million) were impaired. The individually impaired receivables relate to premium receivables. The ageing of these receivables is as follows: $m $m 1 to 3 months to 6 months Over 6 months Movements in the provision for impairment of receivables are as follows: $m $m At 1 July Provision for impairment recognised during the year Receivables w ritten off during the year as uncollectible - - Unused amount reversed (0.7) (0.5) As of 30 June 2017 and 2016 no receivables were past due but not impaired. a) Accounting policy Trade and other receivables are recognised initially at fair value and subsequently measured at amortised cost using the effective interest rate method, less provision for impairment. Collectability of trade and other receivables is reviewed on an ongoing basis. Debts which are known to be uncollectible are written off by reducing the carrying amount directly. A provision for impairment is used where there is objective evidence that the Group will not be able to collect all amounts due according to the original terms of the receivables. The amount of the impairment loss is recognised in profit or loss within other expenses. When a receivable for which an impairment allowance had been recognised becomes uncollectible in a subsequent period, it is written off against the provision for impairment account. Subsequent recoveries of amounts previously written off are credited against other expenses in profit or loss. 75
83 10. RECEIVABLES continued a) Accounting policy continued i) Amounts due from policyholders Amounts due from policyholders are initially recognised at fair value, being the amounts due. They are subsequently measured at fair value which is approximated by taking this initially recognised amount and reducing it for impairment as appropriate. A provision for impairment of receivables is established when there is objective evidence that the Group will not be able to collect all amounts due according to the original terms of the receivables. The amount of the provision is the difference between the asset's carrying amount and the value of estimated future cash flows. The impairment charge is recognised in the profit or loss. ii) Interest rate risk Information about the Group s exposure to interest rate risk in relation to other receivables is provided in Note 3. iii) Fair value and credit risk Due to the short-term nature of current receivables, their carrying amount is assumed to approximate their fair value. The maximum exposure to credit risk at the reporting date is the carrying amount of each class of receivables mentioned above. iv) Risk exposure The maximum exposure to credit risk at the reporting date is the carrying amount of each class of receivable mentioned above. Refer to Note 3 for more information on the risk management policy of the Group and the credit quality of the Group s receivables. v) Reinsurance and other recoveries receivable Reinsurance and other recoveries receivable on paid claims, reported claims not yet paid, incurred but not reported (IBNR), and unexpired risk liabilities are recognised as revenue. Recoveries receivable are assessed in a manner similar to the assessment of outstanding claims. Recoveries are measured as the present value of the expected future receipts, calculated on the same basis as the liability for outstanding claims. 76
84 11. FINANCIAL ASSETS AT FAIR VALUE THROUGH PROFIT OR LOSS $m $m Equity securities Interest-bearing securities Short term deposits Changes in fair values of financial assets at fair value through profit or loss are recorded in investment income in profit or loss in Note 6. a) Accounting policy i) Investments and other financial assets The Group classifies its financial assets into financial assets at fair value through profit or loss and available for sale financial assets. ii) Financial assets and liabilities Financial assets are designated at fair value through profit or loss. Initial recognition is at fair value, being acquisition cost, in the balance sheet and subsequent measurement is at fair value with any resultant fair value gains or losses recognised in the profit or loss. Shares, fixed interest securities, options and units in trusts listed on stock exchanges are initially recognised at cost and the subsequent fair value adjustment is taken as the quoted bid price of the instrument at the balance sheet date. All purchases and sales of financial assets that require delivery of the asset within the timeframe established by regulation or market convention ("regular way" transactions) are recognised at trade date, being the date on which the Group commits to buy or sell the asset. In cases where the point between trade and settlement exceeds this time frame, the transaction is recognised at settlement date. Financial assets are derecognised when the rights to receive future cash flows from the assets have expired, or have been transferred, and the Group has transferred substantially all the risks and rewards of ownership. Investments and other financial assets of are also designated as at fair value through the profit or loss as they are managed and their performance is evaluated on a fair value basis, in accordance with a documented investment policy, and information is provided internally on that basis to the entity s key management personnel. iii) Risk exposure Information about the Group s exposure to price risk and interest rate risk is provided in Note 3. 77
85 12. DEFERRED ACQUISITION COSTS $m $m Current Non-current Movements in the deferred acquisition costs are as follows: $m $m Balance at beginning of year Acquisition costs deferred during the year Amortisation expense (41.7) (29.3) Exchange differences Deferred acquisition costs by segment are as follows: $m $m Australian Residents Health Insurance New Zealand Residents Health Insurance International (Inbound) Health Insurance a) Accounting policy Direct acquisition costs incurred in obtaining health insurance contracts, including broker commissions, are deferred and recognised as assets where they can be reliably measured and where it is probable that they will give rise to premium revenue that will be recognised in the consolidated income statement in subsequent reporting periods. This pattern of amortisation reflects the earning pattern of the corresponding premium revenue. b) Critical accounting judgements and estimates i) Australian Residents Health Insurance Deferred acquisition costs are amortised on a straight line basis over a period of 5 years (2016: 5 years), in accordance with the expected pattern of the incidence of risk under the open ended insurance contracts to which they relate, which includes expectations of customers remaining insured. The Group pays an upfront commission to retail brokers on signing up new members to the business. These upfront commissions will give rise to future premium revenue beyond the current period and are able to be measured and directly associated with a particular insurance contract. The Group does not capitalise the indirect administration costs associated with acquiring new members due to the difficulty in measurement. The Group considers the duration of a health insurance contract to be an open ended agreement as the Group stands ready to continue to insure its customers under continuing policies. The Group uses average retention rates to determine the appropriate customer contract life and related amortisation period for customers who purchase insurance through these broker channels. The analysis included extrapolating historical lapse rates for broker acquired customers but truncating the data at 10 years in order to allow for the inherent distortion created by extrapolating historical data. The analysis identified the amortisation period to be 5 years. The Group re-performs this analysis at least every six months for reassessment. A decrease in the expected contract periods of one year would increase amortisation expense by $9.6m for 30 June The recoverability of the related deferred acquisition costs is also considered as part of the liability adequacy test performed. As described in Note 18, the Group has no deficiency in the unearned premium liability at 30 June
86 12. DEFERRED ACQUISITION COSTS continued b) Critical accounting judgements and estimates continued Alternative view General insurers amortise deferred acquisition costs usually over one year, as their policies generally have a defined term of one year. With health insurance, if the contract term is considered to be only the term to which the customer has agreed to, or paid to, the deferred acquisition cost would be amortised over a period of between one and two months, which is the period paid in advance by the customer. However, the Group believes that does not reflect the open ended nature of a health insurance contract, the contract periods to which future premium revenue will arise, nor the expected pattern of the incidence of risk under the insurance contracts to which the costs relate. For these reasons the Group believes the currently adopted treatment is more appropriate. ii) nib New Zealand The Group incurs upfront commission costs that will give rise to future premium revenue and are able to be directly associated with a particular insurance contract. These costs are deferred and amortised over the life of the insurance contract. The Group does not capitalise the indirect administration costs associated with acquiring new members due to the difficulty in identifying and associating those indirect costs with acquiring particular insurance contracts. There are two key assumptions required to recognise the acquisition costs over the life of the insurance contract: the period of the insurance contract is assumed to be the average length of insurance for nib nz limited policyholders who are the subject of an upfront commission; and the average length of insurance for nib nz limited policyholders who are the subject of an upfront commission is calculated by extrapolating historical lapse rates for that group of policyholders. 79
87 13. PROPERTY, PLANT & EQUIPMENT Land & Buildings Plant & Equipment Leasehold Improvements Total $m $m $m $m At 1 July 2015 Cost Accumulated depreciation and impairment - (8.1) (3.9) (12.0) Net book amount Year ended 30 June 2016 Opening net book amount Additions Acquisition of subsidiary Depreciation charge for the year - (2.6) (1.2) (3.8) Exchange differences Closing net book amount At 30 June 2016 Cost Accumulated depreciation and impairment - (11.8) (4.3) (16.1) Net book amount Year ended 30 June 2017 Opening net book amount Additions Assets included in a disposal group classified as held for sale and other disposals 1 (1.9) - - (1.9) Depreciation charge for the year - (2.7) (1.3) (4.0) Exchange differences Closing net book amount At 30 June 2017 Cost Accumulated amortisation and impairment - (14.1) (5.5) (19.6) Net book amount Land and buildings were transferred to assets classified as held for sale during the year. a) Accounting policy All property, plant and equipment are stated at historical cost less depreciation. Historical cost includes expenditure that is directly attributable to the acquisition of the items. Subsequent costs are included in the asset's carrying amount or recognised as a separate asset, as appropriate, only when it is probable that future economic benefits associated with the item will flow to the Group and the cost of the item can be measured reliably. The carrying amount of a replaced part is derecognised. All other repairs and maintenance are charged to profit or loss during the reporting period in which they are incurred. 80
88 13. PROPERTY, PLANT & EQUIPMENT continued a) Accounting policy continued Depreciation is calculated using the straight-line method to allocate their cost or revalued amounts, net of their residual values, over their estimated useful lives, as follows: Plant and equipment 3 to 10 years Leasehold improvements 3 to 10 years The assets' residual values and useful lives are reviewed, and adjusted if appropriate at each reporting date. An asset's carrying amount is written down immediately to its recoverable amount if the asset's carrying amount is greater than its estimated recoverable amount (see Note 14(a)(v)). Gains and losses on disposals are determined by comparing proceeds with carrying amount. These are included in profit or loss. When revalued assets are sold, it is Group policy to transfer the amounts included in other reserves in respect of those assets to retained earnings. 81
89 14. INTANGIBLE ASSETS Goodwill Software Brands and Trademarks Customer Contracts Total $m $m $m $m $m At 1 July 2015 Cost Accumulated amortisation and impairment (1.4) (33.4) (2.8) (8.3) (45.9) Net book amount Year ended 30 June 2016 Opening net book amount Additions Acquisition of subsidiary Amortisation charge for the year - (9.0) (0.8) (4.8) (14.6) Exchange differences Closing net book amount At 30 June 2016 Cost Accumulated amortisation and impairment - (38.7) (4.0) (13.6) (56.3) Net book amount Year ended 30 June 2017 Opening net book amount Additions Disposals - (0.9) - - (0.9) Amortisation charge for the year - (12.5) (0.8) (4.4) (17.7) Exchange differences (0.2) (0.1) - (0.1) (0.4) Closing net book amount At 30 June 2017 Cost Accumulated amortisation and impairment - (47.1) (4.8) (18.0) (69.9) Net book amount Refer to Note 8(e)Income Tax - change in accounting policy a) Accounting policy i) Goodwill Goodwill represents the excess of the cost of an acquisition over the fair value of the Group s share of the net identifiable assets of the acquired subsidiary at the date of acquisition. Goodwill on acquisitions of subsidiaries is included in intangible assets. Goodwill is not amortised. Instead, goodwill is tested for impairment annually, and is carried at cost less accumulated impairment losses. ii) Software Costs incurred in developing products or systems and costs incurred in acquiring software and licences that will contribute to future period financial benefits through revenue generation and/or cost reduction are capitalised to software. Costs capitalised include external direct costs of materials and service and direct payroll and payroll related costs of employees time spent on the project. Amortisation is calculated on a straight-line basis over periods generally ranging from two and a half years to five years. 82
90 14. INTANGIBLE ASSETS continued a) Accounting policy continued iii) Brands and trademarks Brands and trademarks acquired with IMAN Australian Health Plans Pty Ltd have a definite useful life of five years and are carried at cost less accumulated amortisation. Brands and trademarks acquired with nib nz limited (formerly TOWER Medical Insurance Limited) in November 2012 have a useful life of two years and are carried at their fair value at the date of acquisition less accumulated amortisation. Brands and trademarks acquired with World Nomads Group in July 2015 have an indefinite useful life and are carried at fair value at the date of acquisition. iv) Customer Contracts Customer contracts acquired as part of a business combination are recognised separately from goodwill. The customer contracts are carried at their fair value at the date of acquisition less accumulated amortisation and impairment losses. Amortisation is calculated based on the timing of projected cash flows of the contracts over their estimated useful lives, which is approximately four years for IMAN Australian Health Plans Pty Ltd,10 years for nib nz limited and approximately 2.5 years for World Nomads Group. v) Impairment Goodwill and intangible assets that have an indefinite useful life and are not subject to amortisation are tested annually for impairment or more frequently if events or changes in circumstances indicate that they might be impaired. Other assets are tested for impairment whenever events or changes in circumstances indicate that the carrying amount may not be recoverable. An impairment loss is recognised for the amount by which the asset's carrying amount exceeds its recoverable amount. The recoverable amount is the higher of an asset's fair value less costs to sell and value in use. For the purposes of assessing impairment, assets are grouped at the lowest levels for which there are separately identifiable cash inflows which are largely independent of the cash inflows from other assets or groups of assets (cash-generating units). Non-financial assets other than goodwill that suffered impairment are reviewed for possible reversal of the impairment at each reporting date. b) Impairment tests for goodwill and indefinite life intangibles Indefinite life intangibles such as brands and trademarks are allocated to a cash-generating unit (CGU) which may be at a level lower than operating segments. Goodwill is allocated at an operating segment level to a CGU or group of CGUs. The recoverable amount of a CGU is determined based on a value-in-use calculation. The value-in-use calculation uses cash flow projections based on financial budgets and forecast forward projections approved by management covering a three-year period. The recoverable amount exceeds the carrying value of the goodwill or indefinite life intangibles. Australian Residents Health Insurance International Workers Health Insurance New Zealand Residents Health Insurance World Nomads Group Australia Australia New Zealand Australia Total Goodwill $m $m $m $m $m At 30 June At 30 June WorldNomads. com Travel Insurance Direct Suresave Total Brands and trademarks $m $m $m $m At 30 June At 30 June
91 14. INTANGIBLE ASSETS continued c) Key assumptions used for value-in-use calculations The assumptions used for the cash flow projections for the first three years are in line with the current Board approved budget and forecast forward projections. Key assumptions include policyholder growth, claims ratio and the discount factor. Policyholder growth is calculated by forecasting the number of sales each month based on budgeted advertising and promotions spend, less the number of expected lapses each month. Claims ratios are targeted that generate price increases that maintain price competitiveness, cover expected increases in claims costs, do not adversely affect the funds capital adequacy position and enable funding of future business growth. Cash flows beyond the three-year period are extrapolated into perpetuity assuming a growth factor of 3.0%. The Group has applied a posttax discount rate to discount the forecast future attributable post tax cash flows. These assumptions have been used for analysis of each CGU within an operating segment. Management determined policyholder growth and claims ratios based on past performance and its expectations for the future. d) Significant estimate: Impact of possible changes in key assumptions In both 2017 and 2016 there were no reasonably possible changes in any of the key assumptions that would have resulted in an impairment write-down of goodwill in any CGU. The following table sets out the key assumptions for those CGUs that have significant goodwill allocated to them. Policyholder growth Claims ratio Long term growth rate Pre-tax discount rate Goodwill % % % % % % % % Australian Residents Health Insurance International Workers Health Insurance New Zealand Residents Health Insurance Gross written premium growth rate Long term growth rate Pre-tax discount rate % % % % % % World Nomads Group The following table sets out the key assumptions for those CGUs that have significant indefinite life intangibles allocated to them. Gross written premium growth rate Royalty rate Long term growth rate Pre-tax discount rate Brandnames and trademarks % % % % % % % % WorldNomads.com Travel Insurance Direct Suresave
92 15. PAYABLES $m $m Current Outw ards reinsurance expense liability - premiums payable to reinsurers Trade creditors Other payables RESA payable Annual leave payable Non-current Other payables Risk Equalisation Special Account (RESA) levy, represents expenses incurred under Risk Equalisation Trust Fund arrangements which are provided for within the legislation to support the principle of community rating. Annual leave payable is accrued annual leave. The entire amount is presented as current, since the Group does not have an unconditional right to defer settlement. However, based on past experience, the Group does not expect all employees to take the full amount of accrued leave or require payment within the next 12 months. The following amounts reflect leave that is not to be expected to be taken within the next 12 months $m $m Annual leave obligation expected to be settled after 12 months a) Accounting policy These amounts represent liabilities for goods and services provided to the Group prior to the end of the financial year which are unpaid. These amounts are unsecured and are usually paid within 30 days of recognition. i) Risk Equalisation Special Account levy The Risk Equalisation Special Account Levy is accrued based on the industry survey of eligible paid claims to be submitted to APRA. If a private health insurer notifies APRA of a material variation in paid claims which can be quantified, the Group adjusts the risk equalisation expense. 85
93 16. BORROWINGS $m $m Current Bank overdraft Non-current Bank loans (secured) The bank overdraft comprises the closing positive balance of the bank account, adjusted for unpresented cheques and outstanding deposits. The Group has a line-of-credit facility for corporate credit cards issued to nib employees for a total of $4.2 million. Outstanding amounts as at 30 June 2017 are included in Current Liabilities Payables under Trade Creditors. Movements in the bank loans (secured) are as follows: $m $m Balance at beginning of period Proceeds from borrow ings Repayment of borrow ings (35.0) - Amortisation of borrow ing expenses - - Exchange differences (0.2) 4.4 Balance at end of period a) Accounting policy Borrowings are initially recognised at fair value, net of transaction costs incurred. Borrowings are subsequently measured at amortised cost. Any difference between the proceeds (net of transaction costs) and the redemption amount is recognised in profit or loss over the period of the borrowings using the effective interest method. Fees paid on the establishment of loan facilities are recognised as transaction costs of the loan to the extent that it is probable that some or all of the facility will be drawn down. In this case, the fee is deferred until the draw down occurs. To the extent that there is no evidence that it is probable that some or all of the facility will be drawn down, the fee is capitalised as a prepayment for liquidity services and amortised over the period of the facility to which it relates. Borrowings are removed from the balance sheet when the obligation specified in the contract is discharged, cancelled or expired. The difference between the carrying amount of a financial liability that has been extinguished or transferred to another party and the consideration paid, including any non cash assets transferred or liabilities assumed, is recognised in profit or loss as other income or finance costs. Borrowings are classified as non-current liabilities if the Group has an unconditional right to defer settlement of the liability for at least 12 months after the reporting period. 86
94 16. BORROWINGS continued b) Secured liabilities During the year, repaid its AUD $35 million variable rate loan with ANZ and refinanced its existing variable rate loan with NAB increasing from AUD $50 million to AUD $85 million with a maturity date of 16 December The loan is carried at amortised cost and has the same covenants as the NZD $70 million loan detailed below. nib nz holdings limited, a wholly owned subsidiary of, refinanced its existing NZD $70 million variable rate term loan facility from a maturity date of 18 December 2017 to 18 December The bank loan is secured by the shares in nib nz holdings limited and a negative pledge that imposes the following covenants on the Group. The negative pledge states that the Group will ensure that the following financial ratios are met: Financial Covenant Ratio as at 30 June 2017 Group Gearing Ratio will not be more than 45% 26.3% Group Interest Cover Ratio will not be less than 3:1. 38:1 has provided a guarantee and indemnity to the ANZ Bank New Zealand on behalf of nib nz holdings limited in respect of the NZD $70 million term loan facility. has subordinated any amounts owing to it from nib nz holdings limited and nib nz limited in favour of all other creditors of these companies. c) Available debt facility The available debt facility with ANZ has been terminated following the repayment of the $35 million variable rate loan detailed above. d) Risk exposure Information on the sensitivity of the Group s profit and equity to interest rate risk on borrowings is provided in Note 3. 87
95 17. OUTSTANDING CLAIMS LIABILITY $m $m Outstanding claims - central estimate of the expected future payment for claims incurred Risk margin Administration component Gross outstanding claims liability Outstanding claims - expected payment to the RESA 1 in relation to the central estimate Risk margin Net outstanding claims liability Risk Equalisation Special Account (RESA) Levy represents expenses incurred under Risk Equalisation Trust Fund arrangements which are provided for within the legislation to support the principle of community rating. Movements in the gross outstanding claims are as follows: $m $m Gross outstanding claims at beginning of period Risk margin (4.8) (3.9) Administration component (1.4) (1.2) Central estimate at beginning of period Change in claims incurred for the prior year (1.7) 0.4 Claims paid in respect of the prior year (86.6) (77.9) Claims incurred during the period (expected) 1, ,265.4 Claims paid during the period (1,240.6) (1,178.0) Acquisition of business Effect of changes in foreign exchange rates Central estimate at end of period Risk margin Administration component Gross outstanding claims at end of period a) Actuarial methods and critical accounting judgements and estimates Provision is made at the period end for the liability for outstanding claims which is measured as the central estimate of the expected payments against claims incurred but not settled at the reporting date under private health insurance contracts issued by the Group. The expected future payments include those in relation to claims reported but not yet paid and claims incurred but not yet reported. This central estimate of outstanding claims is an estimate which is intended to contain no intentional over or under estimation. For this reason the inherent uncertainty in the central estimate must also be considered and a risk margin is added. The estimated cost of claims includes allowances for Risk Equalisation Special Account (RESA) consequences and claims handling expense. The Group takes all reasonable steps to ensure that it has appropriate information regarding its claims exposures. However, given the uncertainty in establishing claims provisions, it is likely that the final outcome will prove to be different from the original liability established. In calculating the estimated cost of unpaid claims, the Group uses estimation techniques based upon statistical analysis of historical experience. Allowance is made, however, for changes or uncertainties which may create distortions in the underlying statistics or which might cause the cost of unsettled claims to increase or reduce when compared with the cost of previously settled claims, including changes in the Group s processes which might accelerate or slow down the development and/or recording of paid or incurred claims, compared with the statistics from previous periods. The calculation is determined taking into account one month of actual post-balance date claims. The risk margin is based on an analysis of the past experience of the Group. This analysis examines the volatility of past payments that is not explained by the model adopted to determine the central estimate. This past volatility is assumed to be indicative of the future volatility. The central estimates are calculated gross of any risk equalisation recoveries. A separate estimate and risk margin is made of the amounts that will be recoverable from or payable to the RESA based upon the gross provision. 88
96 17. OUTSTANDING CLAIMS LIABILITY continued a) Actuarial methods and critical accounting judgements and estimates continued The outstanding claims estimate for Australian segments is derived based on three valuation classes, namely hospital and prostheses services combined, medical services, and general treatment. For the New Zealand segment the outstanding claims estimate is derived based on two valuation classes, surgical and medical. This analysis is supplemented by more granular analysis within classes as appropriate. In calculating the estimated cost of unpaid claims two methods are used. For recent service months for hospital and medical, and for all months for general treatment, a chain ladder method is used; this assumes that the development pattern of the current claims will be consistent with historical experience. For hospital and medical, for recent service months the Bornhuetter-Ferguson method is given some weight, which progressively blends payment experience and prior forecasts of incurred costs. As most claims for health funds are generally settled within one year, no discounting of claims is usually applied as the difference between the undiscounted value of claims payments and the present value of claims payments is not likely to be material. Accordingly, reasonable changes in assumptions would not have a material impact on the outstanding claims balance. b) Actuarial assumptions The following assumptions have been made in determining the outstanding claims liability for claims incurred 12 months to the following financial years: Hospital Medical General Hospital Medical General Australian Residents Health Insurance % % % % % % Assumed proportion paid to date 91.9% 91.5% 98.0% 92.2% 90.8% 97.7% Expense rate 1.40% 1.40% 1.40% 1.4% 1.4% 1.4% Discount rate 0.0% 0.0% 0.0% 0.0% 0.0% 0.0% Risk margin 5.6% 5.6% 5.6% 3.9% 3.9% 3.9% Risk equalisation rate 20.5% 20.5% 0.0% 23.5% 23.5% 0.0% Risk margin for risk equalisation 6.6% 6.6% 0.0% 4.4% 4.4% 0.0% International Students Health Insurance Assumed proportion paid to date 74.0% 87.8% 100.0% 86.4% 92.1% 99.8% Expense rate 2.0% 2.0% 2.0% 2.0% 2.0% 2.0% Discount rate 0.0% 0.0% 0.0% 0.0% 0.0% 0.0% Risk margin 24.8% 24.8% 24.8% 24.8% 24.8% 24.8% International Workers Health Insurance Assumed proportion paid to date 72.3% 79.8% 94.4% 79.1% 83.2% 91.7% Expense rate 6.0% 6.0% 6.0% 5.0% 5.0% 5.0% Discount rate 0.0% 0.0% 0.0% 0.0% 0.0% 0.0% Risk margin 18.5% 18.5% 18.5% 18.5% 18.5% 18.5% Surgical Medical Surgical Medical NZ Health Insurance % % % % Assumed proportion paid to date 88.8% 84.2% 87.5% 79.9% Expense rate 2.2% 2.2% 2.0% 2.0% Discount rate 0.0% 0.0% 0.0% 0.0% Risk margin 5.8% 5.8% 5.8% 5.8% The risk margin of the underlying liability has been estimated to equate to a probability of adequacy of 95% (June 2016: 95%) for the Group. The risk margin within each territory allows for diversification across the entity. The benefit of diversification across the Group is again allocated to the Australian Residents Health Insurance segment. 89
97 17. OUTSTANDING CLAIMS LIABILITY continued c) Process used to determine assumptions The Group conducts sensitivity analysis to quantify the exposure to risk of changes in the key underlying variables. The valuations included in the reported results are calculated using certain assumptions about these variables as disclosed above. The movement in any key variable will impact the performance and equity of the Group. The table below describes how a change in each assumption will affect the insurance liabilities. Key variable Description Impact of movement in variable Chain ladder development factors Chain ladder development factors were selected based on observations of historical claim payment experience. Particular attention was given to the development of the most recent 12 months. An increase or decrease in the chain ladder factors would lead to a higher or lower projection of the ultimate liability and a corresponding increase or decrease in claims expense respectively. Bornhuetter- Ferguson unpaid factors Bornhuetter-Ferguson unpaid factors were selected based on historical patterns of payment (by development) to ultimate incurred claims. That is, the proportion of ultimate incurred claims to be paid by development month is selected based on observations from the historical development. This unpaid proportion is then multiplied by a prior forecast of incurred claims for each service month to determine the outstanding claims estimate. An increase or decrease in the level of unpaid would lead to a higher or lower projection of the ultimate liability and a corresponding increase or decrease on claims expense respectively. Expense rate Claims handling expenses were calculated by reference to past experience of total claims handling costs as a percentage of total past payments. An estimate for the internal costs of handling claims is included in the outstanding claims liability. An increase or decrease in the expense rate assumption would have a corresponding impact on claims expense. Discount rate As most claims for health funds are generally settled within one year, no discounting of claims is applied as the difference between the undiscounted value of claims payments and the present value of claims payments is not likely to be material. N/A Risk equalisation allowance In simplified terms, each organisation is required to contribute to the risk equalisation pool or is paid from the pool to equalise their hospital claims exposure to policyholders aged over 55 years of age and in respect of high cost claims. This is the allowance made in respect of the claims incurred but not yet paid. An estimate for the risk equalisation cost is included in the outstanding claims liability. An increase or decrease in the risk equalisation allowance would have a corresponding impact on RESA Levy. Risk margin The risk margin has been based on an analysis of the past experience of the Group. This analysis examined the volatility of past payments that has not been explained by the model adopted to determine the central estimate. This past volatility has been assumed to be indicative of the future volatility and has been set at a level estimated to equate to a probability of adequacy of 95% at a consolidated level (June 2016: 95%). An estimate of the amount of uncertainty in the determination of the central estimate. An increase or decrease in the risk margin would have a corresponding impact on claims expense. 90
98 17. OUTSTANDING CLAIMS LIABILITY continued d) Sensitivity analysis impact of key variables Profit after tax Equity Recognised amounts in the financial statements attributable to ow ners of Variable Movement in variable Adjustments $m $m Adjusted amounts Adjustments Adjusted amounts $m $m $m $m Chain ladder development factors +0.5% (9.3) (9.3) % Bornhuetter-Ferguson unpaid factors +2.0% (3.2) (3.2) % Expense rate +1.0% (0.7) (0.7) % Risk equalisation allow ance +2.5% (1.3) (1.3) % Risk margin +1.0% (0.8) (0.8) %
99 18. UNEARNED PREMIUM LIABILITY AND UNEXPIRED RISK LIABILITY a) Unearned premium liability $m $m Current Non-current The unearned premium liability reflects premiums paid in advance by customers. Movements in the unearned premium liability are as follows: $m $m Unearned premium liability as at 1 July Acquisition of business Deferral of premiums on contracts w ritten in the period Earning of premiums w ritten in previous periods (151.9) (127.0) Unearned premium liability as at 30 June b) Unexpired risk liability No deficiency was identified as at 30 June 2017 and 2016 that resulted in an unexpired risk liability needing to be recognised. c) Critical accounting judgements and estimates A liability adequacy test is required to be performed for the period over which the insurer is on risk in respect of premiums paid in advance. At each reporting date, the adequacy of the unearned premium liability is assessed by considering current estimates of all expected future cash flows relating to future claims arising from the rights and obligations created. If the sum of the present value of the expected future cash flows relating to future claims plus the additional risk margin to reflect the inherent uncertainty in the central estimate exceeds the unearned premium liability, less related intangible assets and related deferred acquisition costs, then the unearned premium is deemed to be deficient, with the deficiency being recorded in the income statement and an unexpired risk liability created. The Group applies a risk margin to achieve the same probability of sufficiency for future claims as is achieved by the estimate of the outstanding claims liability, refer to Note 17(b). No deficiency was identified as at 30 June 2017 and 2016 that resulted in an unexpired risk liability needing to be recognised. This test is also extended beyond recognised unearned premium liability to include premiums renewable until the next repricing review, usually 1 April each year. 92
100 19. PREMIUM PAYBACK LIABILITY $m $m Current Non current Movements in the premium payback liability are as follows: $m $m Gross premium payback liability at beginning of period Adjustment to ensure reserve exceeds current payout on early lapse - (0.6) Value of payments currently being processed (1.1) (1.0) Risk margin (0.7) (1.3) Central estimate at beginning of period Funding/new accrued Unw ind discount rate Interest rate movement impact (0.7) 2.0 Premium payback payments (6.9) (20.8) Others (0.1) 0.6 Effect of changes in foreign exchange rates (0.2) 2.1 Central estimate at end of the year Adjustment to ensure reserve exceeds current payout on early lapse Value of payments currently being processed Risk margin Total premium payback liability as at 30 June Risk exposure Information about the Group s exposure to interest rate risk in relation to premium payback liability is provided in Note 3(b). a) Actuarial methods and critical accounting judgements and estimates The premium payback liability represents the accrued amount of premium expected to be repaid to certain New Zealand health insurance policyholders. A number of nib nz limited s health insurance policies have a benefit whereby policyholders receive a proportion of premiums paid less claims received over the life of their policy, premium payback, if certain conditions are met. This liability represents a long term health insurance contract liability. The liability was determined based on the discounted value of accumulated excess of premiums over claims at an individual policy level, adjusted for GST recoveries and expected future lapses. A risk margin at 95% probability of sufficiency was estimated by assuming there are no future lapses. Most of the premium payback reserve is held in respect of a group of customers where the historical lapse rate is already very low. The following assumptions have been made in determining the premium payback liability: Lapse rate until 3 years from premium payback date 2.0% % 2.0% % Lapse rate w ithin 3 years of premium payback date 0.0% - 1.0% 0.0% - 1.0% Expense rate 0.0% 0.0% Discount rate for succeeding and follow ing year 2.0% - 2.7% 2.0% Risk margin 2.6% 2.7% The risk margin has been estimated to equate to a 95% probability of adequacy (2016: 95%). 93
101 19. PREMIUM PAYBACK LIABILITY continued b) Premium payback early settlement offer At their policy renewal, eligible premium payback customers have been offered a graduated early settlement based on the date they would become eligible for the full premium payback benefit, contingent on their claims history. Customers receive the settlement offer around two months before their policy renewal. The first settlement offers were made March 2017 for May 2017 policy renewals. 100% of the available offers have been included in the current portion of the premium payback liability in the Consolidated Balance Sheet. As customers may or may not accept the available premium payback settlement offer and recognising that 100% acceptance is unlikely, it is estimated for policyholders that accept the offer, $2.7 million of the total premium payback liability could be settled within the next 12 months. This is in addition to $1.2 million of the premium payback liability that is expected to be settled within the next 12 months in the normal course of business. c) Sensitivity analysis i) Summary The Group conducts sensitivity analysis to quantify the exposure to risk of changes in the key underlying actuarial assumptions. The movement in any key variable will impact the performance and equity of the Group. The table below provides a description of the processes used to determine these assumptions, as well as how a change in each assumption will affect the insurance liabilities. Key variable Description Impact of movement in variable Lapse rate Rate used in calculating the discounted provision to allowed for expected lapses, based on historical experience. An increase or decrease in the lapse assumption would have an inverse impact on the premium payback liability and risk margin. Discount rate Rate used in calculating the discounted provision to allow for expected investment income, based on current yields on New Zealand government debt (risk free rates). An increase or decrease in the discount rate assumption would have an inverse impact on the premium payback liability. Risk margin An estimate of the amount of uncertainty in the determination of the central estimate. An increase or decrease in the risk margin would have a corresponding impact on the premium payback liability. ii) Impact of key variables Profit after tax Equity Recognised amounts in the financial statements attributable to ow ners of Variable Movement in variable Adjustments $m $m Adjusted amounts Adjustments Adjusted amounts $m $m $m $m Lapse rate +1.0% % (0.5) (0.5) Discount rate +1.0% % (0.8) (0.8) Risk margin +1.0% (0.2) (0.2) %
102 19. PREMIUM PAYBACK LIABILITY continued d) Unexpired risk liability A liability adequacy test was performed allowing for the expected cash flows of each policy over the entire product life. The future cash flows include Reserves held at 30 June 2017 including the risk margin; Expected future payments for claims, policy paybacks and management expenses; and Expected future revenue from premiums and investment income. No deficiency was identified at 30 June 2017 (2016: nil) that resulted in an unexpired risk liability needing to be recognised. 95
103 20. PROVISION FOR EMPLOYEE ENTITLEMENTS $m $m Current Long service leave Termination benefits Retirement benefits Non-current Long service leave Amounts not expected to be settled within the next 12 months The current provision for long service leave and retirement benefits includes all unconditional entitlements where employees have completed the required period of service and also those where employees are entitled to pro-rata payments in certain circumstances. The entire amount is presented as current, since the Group does not have an unconditional right to defer settlement. However, based on past experience, the Group does not expect all employees to take the full amount of the provision or require payment within the next 12 months. The following amounts reflect leave that is not to be expected to be taken or paid within the next 12 months $m $m Long service leave obligation expected to be settled after 12 months a) Accounting policy i) Short-term obligations Liabilities for wages and salaries, including non-monetary benefits and annual leave are recognised in payables in respect of employees' services up to the reporting date and are measured at the amounts expected to be paid when the liabilities are settled. The portion not expected to be settled within 12 months is discounted based on expected settlement dates. Liabilities for non-accumulating sick leave are recognised when the leave is taken and measured at the rate paid or payable. ii) Other long-term employee benefit obligations The liability for long service leave is the amount of the future benefit that employees have earned in return for their service in the current and prior periods. The liability is calculated using expected future increases in wage and salary rates and expected settlement dates, and is discounted using G100 treasury discount rates at the balance sheet date which have the maturity dates approximating to the terms of nib s obligations. iii) Bonus plans A liability for employee benefits in the form of bonus plans is recognised in other creditors when at least one of the following conditions is met: there are formal terms in the plan for determining the amount of the benefit, or the amounts to be paid are determined before the time of completion of the financial report, or past practice gives clear evidence of the amount of the obligation. Liabilities for bonus plans are expected to be settled within 12 months and are measured at the amounts expected to be paid when they are settled. iv) Termination benefits Liabilities for termination benefits, not in connection with the acquisition of an entity or operation, are recognised when a detailed plan for the terminations has been developed and a valid expectation has been raised with those employees affected that the terminations will be carried out without possibility of withdrawal. The liabilities for termination benefits are recognised as current provisions, as liabilities for termination benefits are expected to be settled within 12 months of reporting date. 96
104 21. OTHER LIABILITIES $m $m Current Deferred profit on sale and leaseback of head office building Non-current Deferred profit on sale and leaseback of head office building a) Accounting policy The deferred profit relates to the sale and leaseback of the head office building at 22 Honeysuckle Drive, Newcastle in February The excess of the proceeds received over fair value relating to the leaseback portion of the building was deferred and is amortised over the lease term of 15 years. The subsequent leasing agreement is treated as an operating lease. The non-current portion of the deferred profit will be amortised between 2016 and the end of the lease term. 97
105 22. CONTRIBUTED EQUITY a) Share capital $m $m Ordinary shares Fully paid Other equity securities Treasury shares (3.1) (1.6) Total contributed equity b) Movements in share capital Date Details No. of shares Price $ $m 1 July 2015 Opening balance 439,004, June 2016 Balance 439,004, July 2016 Opening balance 439,004, June 2017 Balance 439,004, c) Treasury shares Treasury shares are shares in that are held by the nib Holdings Ltd Share Ownership Plan Trust (trust) for the purpose of issuing shares under the Group s Executive management Short-Term Incentive and Long-Term Incentive share plans. See Note 35 for more information. Date Details No. of shares $m 1 July 2015 Opening balance 31, Acquisition of shares by the Trust 781, Employee share issue - LTIP (196,154) (0.6) Employee share issue - STI (246,173) (0.8) 30 June 2016 Balance 370, Acquisition of shares by the Trust 787, Employee share issue - LTIP (345,771) (1.5) Employee share issue - STI (223,330) (1.0) 30 June 2017 Balance 588, d) Accounting policy i) Ordinary shares Ordinary shares are classified as equity. Incremental costs directly attributable to the issue of new shares are shown in equity as a deduction, net of tax, from the proceeds. If the entity reacquires its own equity instruments, for example as the result of a share buy-back, those instruments are deducted from equity and the associated shares are cancelled. No gain or loss is recognised in the profit or loss and the consideration paid including any directly attributable incremental cost (net of income taxes) is recognised directly in equity. Ordinary shares entitle the holder to participate in dividends and the proceeds on winding up of the company in proportion to the number of and amounts paid on the shares held. On a show of hands every holder of ordinary shares present at a meeting in person or by proxy, is entitled to one vote, and upon a poll each share is entitled to one vote. ii) Employee share trust The Group has formed a trust to administer the Group s executive management Short-Term Incentive and Long Term-Incentive share plans. This trust is consolidated, as the substance of the relationship is that the trust is controlled by the Group. Shares held by the nib Holdings Ltd Share Ownership Plan Trust are disclosed as treasury shares and deducted from contributed equity. 98
106 23. RETAINED PROFITS $m $m Balance at the beginning of the year Net profit Transfer from revaluation reserve on sale of land and buildings, net of tax Dividends (76.8) (51.6) Balance at the end of the financial year
107 24. RESERVES $m $m Revaluation surplus - property, plant and equipment Share-based payments Share-based payments exercised (3.4) (2.3) Foreign currency translation Movements in reserves Note $m $m Revaluation surplus - property, plant and equipment Balance at the beginning of the year Property revaluation - gross Transfer to retained profits on sale of land and buildings - gross - (11.3) Deferred tax 8(a)(iv) Balance at the end of the financial year Share-based payments Balance at the beginning of the year Performance right expense Transfer to share-based payments exercised reserve on exercise of performance rights (0.4) (0.1) Balance at the end of the financial year Share-based payments exercised Balance at the beginning of the year (2.3) (1.8) Transfer from share-based payments reserve on exercise of performance rights Issue of shares held by nib Holdings Ltd Share Ow nership Plan Trust to employees (1.5) (0.6) Balance at the end of the financial year (3.4) (2.3) Foreign currency translation Balance at the beginning of the year Currency translation differences arising during the year - gross (0.3) 3.2 Deferred tax 8(a)(iii) 0.2 (0.6) Balance at the end of the financial year
108 24. RESERVES continued a) Nature and purpose of reserves i) Revaluation surplus property, plant and equipment The property, plant and equipment revaluation surplus is used to record increments and decrements on the revaluation of non-current assets. ii) Share-based payments The share-based payments reserve is used to recognise the fair value of performance rights and bonus share rights issued to employees but not exercised. iii) Share-based payments exercised The share-based payments exercised reserve is used to recognise the difference between fair value of performance rights and bonus share rights accumulated in the share based payments reserve and cost of exercising the rights. iv) Foreign currency translation Exchange rate differences arising on translation of foreign controlled entities are recognised in other comprehensive income as described in Note 1(c) and accumulated in a separate reserve within equity. The cumulative amount is reclassified to profit or loss when the net investment is disposed of. 101
109 25. DIVIDENDS a) Ordinary shares $m $m Final dividend for the year ended 30 June 2016 of 9.0 cents ( cents) per fully paid share paid on 7 October 2016 Fully franked based on tax paid at 30% Interim dividend for the year ended 30 June 2017 of 8.5 cents ( cents) per fully paid share paid on 3 April 2017 Fully franked based on tax paid at 30% Total dividends provided for or paid b) Dividends not recognised at year end $m $m In addition to the above dividends, since the end of the year the Directors have recommended the payment of a final dividend of 10.5 cents ( cents) per fully paid ordinary share, fully franked based on tax paid at 30%. The aggregate amount of the proposed dividend expected to be paid on 6 October 2017 out of retained profits at 30 June 2017, but not recognised as a liability at the end of the year, is: c) Franked dividends The franked portion of the final dividends recommended after 30 June 2017 will be franked out of existing franking credits or out of franking credits arising from the payment of income tax in the year ending 30 June $m $m Franking credits available for subsequent financial years to equity holders of parent entity based on a tax rate of 30% The above amounts represent the balance of the franking account as at the end of the financial year, adjusted for: Franking credits that will arise from the payment of the amount of the provision for income tax; Franking debits that will arise from the payment of dividends recognised as a liability at the reporting date; and Franking credits that will arise from the receipt of dividends recognised as receivables at the reporting date. d) Accounting policy Provision is made for the amount of any dividend declared, being appropriately authorised and no longer at the discretion of the entity, on or before the end of the financial year but not distributed at balance date. 102
110 26. EARNINGS PER SHARE Profit from continuing operations attributable to the ordinary equity holders of the company used in calculating basic/diluted EPS $m Weighted average number of ordinary shares # m Basic / Diluted EPS cents a) Accounting policy i) Basic earnings per share Basic earnings per share is calculated by dividing: the profit attributable to equity holders of the company, excluding any costs of servicing equity other than ordinary shares by the weighted average number of ordinary shares outstanding during the financial year. ii) Diluted earnings per share Diluted earnings per share adjusts the figures used in the determination of basic earnings per share to take into account: the after income tax effect of interest and other financing costs associated with dilutive potential ordinary shares; and the weighted average number of additional ordinary shares that would have been outstanding assuming the conversion of all dilutive potential ordinary shares. b) Information concerning the classification of shares i) Performance rights Performance rights granted to employees under the nib holdings Long-Term Incentive Plan are considered to be potential ordinary shares and are only included in the determination of diluted earnings per share to the extent to which they are dilutive. The performance rights have not been included in the determination of basic earnings per share. Details relating to the performance rights are set out in the Remuneration Report on page 40. The total 2,290,162 performance rights granted (2016-2,238,071) are not included in the calculation of diluted earnings per share because they are contingently issuable ordinary shares and conditions were not satisfied at 30 June These performance rights could potentially dilute basic earnings per share in the future. 103
111 27. CAPITAL MANAGEMENT The Group s objectives when managing capital are to safeguard their ability to continue as a going concern, so that they can continue to provide returns for shareholders and benefits for other stakeholders and to maintain an optimal capital structure to reduce the cost of capital. In order to maintain or adjust the capital structure, the Group has a number of levers, including adjusting the amount of dividends paid to shareholders, returning capital to shareholders, issuing new shares, selling assets, raising or reducing debt or buying back shares. The Group, through earnings and capital management, has achieved a return on equity of 20% or greater for the last five years and continues to target return on equity in the order of 20%. The return on equity as at 30 June 2017 is 29.5%. (2016: 25.8%). While improvement to return on equity can be made through increased profitability, it is also important that capital be managed appropriately; therefore, if funds are not required for strategic reasons, the Group will consider a range of capital management initiatives. At 30 June 2017 the Group had available capital of $19.7 million above our internal benchmark (after allowing for the payment of a fully franked final ordinary dividend of 10.5 cents per share, totalling $46.1 million, in October 2017). Below is a reconciliation of net assets to available capital as at 30 June 2017 (after allowing for payment of a final dividend): Net assets Less: nib health fund capital required (270.4) nib nz capital required (86.0) Capital required looking forw ard 12 months (4.8) nib nz intangibles (37.5) iihi intangibles (20.9) nib Options intangibles (0.1) World Nomads Group intangibles (100.0) Borrow ings Other assets and liabilities 6.2 Final dividend (46.1) Available capital (after allow ing for payment of final dividend) 19.7 $m 104
112 27. CAPITAL MANAGEMENT continued nib health funds limited nib health funds limited, a controlled entity, is required to comply with the Solvency and Capital Adequacy Standards under Schedule 2 and 3 of the Private Health Insurance (Health Benefits Fund Administration) Rules 2007, the Rules are made for the purposes of Part 4-4 of the Private Health Insurance Act To comply with the Solvency Standard, nib health funds limited: (i) (ii) must ensure that, at all times, the value of cash must be equal to or greater than a specified cash management amount, plus any solvency supervisory adjustment (Section 4.2 of the Solvency Standard); must have, and comply with, a board endorsed, liquidity management plan designed to ensure compliance with the solvency requirements described above, and set minimum liquidity requirements and management action triggers (Section 4.3 of the Solvency Standard). To comply with the Capital Adequacy Standard, nib health funds limited: (i) (ii) must ensure that at all times the value of its assets is not less than the amounts calculated under Section 4.2 (a) and (b) of the Capital Adequacy Standard (Capital Adequacy Requirement); must have, and comply with, a written, board endorsed capital management policy. nib health funds limited has a capital management plan which establishes a target for capital held in excess of the regulatory requirement; the aim is to keep a sufficient buffer in line with the Board s attitude to and tolerance for risk. The internal capital target ensures nib has a minimum level of capital given certain stressed capital scenarios. This currently approximates to 14.4% of total projected premiums for the next 12 months. Any capital in excess of the benchmark, taking a 12-month forward looking view, will be reduced by way of dividend to. nib health funds limited paid dividends of $48.0m in September 2016 and $40.0m in February 2017 to. The surplus assets over benchmark at 30 June 2017 and 30 June 2016 were as follows: $m $m Total assets nib health funds limited (excluding unclosed business contributions - unearned) Capital adequacy requirement Surplus assets for Capital Adequacy Net assets nib health funds limited Internal capital target Surplus assets over internal capital target
113 27. CAPITAL MANAGEMENT continued nib nz limited nib nz limited, a controlled entity, is required to comply with the Solvency Standard for Non-Life Insurance Business (2014) published by the Reserve Bank of New Zealand (RBNZ). The Solvency Standards determine the Minimum Solvency Capital (MSC) required. A requirement of nib nz limited s insurance licence is that it maintains capital above the MSC. The overriding objective underpinning nib nz limited s capital management approach is to operate with a level of capital judged to be commercially prudent and within the bounds of the Board s risk appetite which achieves a balance between: Maintaining a buffer above the RBNZ Minimum Solvency Requirement (MSR) for nib nz limited (as defined by the IPSA Solvency Standard for Non-life Insurance Business); Maintaining a level of capital that ensures an appropriate financial strength rating; and Avoiding holding an excessive level of capital, which would otherwise act to reduce returns on capital for the Group. Following a review of nib nz limited s capital levels by the Appointed Actuary, the internal solvency benchmark has been revised to 2.00x MSC (2016: 1.75x MSC plus NZD $10 million). Any capital in excess of the benchmark, taking a 12-month forward looking view, will be reduced by way of dividend to nib nz holdings limited, unless management decide to retain funds for strategic purposes. nib nz limited paid dividends of NZD $9.9m in May 2017 to nib nz holdings limited. The surplus assets over benchmark at 30 June 2017 and 2016 are as follows: Actual Solvency Capital Minimum Solvency Capital Solvency Capital $m $m Net assets nib nz limited Capital Adequacy Coverage Ratio Internal benchmark requirement Surplus/(deficit) assets over internal benchmark 4.1 (7.0) All outstanding discussions with the RBNZ disclosed in the financial statements for the year ended 30 June 2016 have now been resolved. No further adjustments have been made to the Company s solvency returns in the years ended 30 June 2015 or 30 June 2016 as a result. 106
114 28. COMMITMENTS FOR EXPENDITURE a) Operating lease commitments $m $m Commitments for minimum lease payments in relation to non-cancellable operating leases are payable as follow s: - not longer than one year longer than one year and not longer than five years longer than five years The Group entered into an agreement to lease Auckland premises for a lease term of 6 years commencing 1st November As part of the lease a $0.9m bank guarantee was required. b) Capital expenditure commitments $m $m Payable: - not longer than one year
115 29. CONTINGENT LIABILITIES On 30 May 2017, the Australian Competition and Consumer Commission (ACCC) instituted proceedings in the Federal Court against nib health funds limited (nib). The ACCC alleges that nib engaged in misleading and deceptive conduct, unconscionable conduct and made false or misleading representations by failing to notify customers in relation to changes made to its Medigap Scheme. nib denies the ACCC s allegations and intends to defend the claims. In the event that the Court finds in favour of the ACCC, nib may have potential liabilities, including pecuniary penalties. Due to the preliminary nature of the matter, the outcome is uncertain. The matter is listed for mediation in October nib operates in an industry where an increasing number of Australians are facing affordability challenges and are more regularly reviewing their health insurance cover to maximise value from their policy. nib regularly engages with customers and other industry stakeholders to understand potential areas of concern and to implement improvements that enhance the customer experience and improve transparency. Taking into consideration feedback from a range of industry stakeholders, nib has undertaken a comprehensive end-to-end review of our customer communications and the way we advise customers of changes to their nib health cover products. This review has resulted in improvements to nib s practices. On an ongoing basis there is the possibility that nib may receive complaints related to past practices which could give rise to nib incurring costs. The Directors consider that these costs will not materially impact nib s financial position. has provided a guarantee and indemnity to the ANZ Bank New Zealand on behalf of nib nz holdings limited in respect of the NZD $70 million term loan facility. has given an undertaking to extend financial support to nib options pty limited, Realsurgeons pty limited, Realself pty limited and nib Global Pty Limited by subordinating repayment of debts owed by the entities to, in favour of all other creditors. This undertaking has been provided as a result of each of these subsidiaries experiencing deficiencies of capital and reserves, and is intended to enable the entities to continue their operations and fulfil all financial obligations now and in the future. The undertaking is provided for a minimum period of twelve months from 18 August 2017, or if earlier, to the date of sale of the entities should this occur. 108
116 30. EVENTS OCCURRING AFTER THE BALANCE SHEET DATE Premium payback early settlement offer At their policy renewal, eligible premium payback customers were offered a graduated early settlement based on the date they would become eligible for the full premium payback benefit, contingent on their claims history. For eligible premium payback customers with renewal dates in September, early settlement offers have been sent in July. The value of early settlement offers issued in July 2017 is $1.6 million. There have not been any other matters or circumstances that have arisen since the end of the financial year that has significantly affected, or may significantly affect the operations of the Group, the results of those operations, or the state of affairs of the Group in future financial years. 109
117 31. REMUNERATION OF AUDITORS $ $ a) PricewaterhouseCoopers Australia 1. Audit services Audit and review of financial report and other audit w ork under the Corporations Act , ,660 Total remuneration for audit services 450, , Non-audit services Audit-related services Audit of regulatory returns 55,284 56,515 Total remuneration for audit-related services 55,284 56,515 Taxation services Tax compliance services 257, ,574 International tax consulting and tax advice on mergers and acquisitions 84,662 47,700 Total remuneration for taxation services 342, ,274 Other services Accounting advice and support including one off transactions 13,464 76,220 Review of regulatory returns 11,628 11,577 Cyber security consulting services 15,500 - Total remuneration for other services 40,592 87,797 Total remuneration for non-audit services 437, ,586 Total remuneration of PricewaterhouseCoopers Australia 888, ,246 b) Network firms of PricewaterhouseCoopers Australia 1. Audit services Audit and review of financial report and other audit w ork under the Corporations Act , ,799 Total remuneration for audit services 172, , Non-audit services Audit-related services Audit of regulatory returns 11,716 11,193 Total remuneration for audit-related services 11,716 11,193 Taxation services Tax compliance services 34,736 34,068 Tax consulting services 37,549 4,604 International tax consulting and tax advice on mergers and acquisitions - 18,415 Total remuneration for taxation services 72,285 57,087 Other services Accounting advice and support 4,724 27,525 Cyber security consulting services 26,071 - Total remuneration for other services 30,795 27,525 Total remuneration for non-audit services 114,796 95,805 Total remuneration of network firms of PricewaterhouseCoopers 287, ,604 Total auditors' remuneration 1,175,509 1,105,
118 32. BUSINESS COMBINATION a) Prior year As disclosed in the Annual Report for the year ended 30 June 2016, the acquisition of the medical insurance book OnePath Life (NZ) Limited was provisionally determined as the fair values of assets and liabilities may change upon finalisation of the purchase price allocation and alignment with Group accounting policies. The acquisition has now been finalised and there were no changes from the provisional amounts disclosed in the Annual Report for the year ended 30 June b) Accounting policy The acquisition method of accounting is used to account for all business combinations, including business combinations involving entities or businesses under common control, regardless of whether equity instruments or other assets are acquired. The consideration transferred for the acquisition of a subsidiary comprises the fair values of the assets transferred, the liabilities incurred and the equity interests issued by the Group. The consideration transferred also includes the fair value of any contingent consideration arrangement and the fair value of any preexisting equity interest in the subsidiary. Acquisition-related costs are expensed as incurred. Identifiable assets acquired and liabilities and contingent liabilities assumed in a business combination, are with limited exceptions, measured initially at their fair values at the acquisition date. On an acquisition-by-acquisition basis, the Group recognises any non-controlling interest in the acquiree either at fair value or at the non-controlling interest s proportionate share of the acquiree s net identifiable assets. The excess of the consideration transferred, the amount of any non-controlling interest in the acquiree and the acquisition-date fair value of any previous equity interest in the acquiree over the fair value of the Group s share of the net identifiable assets acquired is recorded as goodwill. If those amounts are less than the fair value of the net identifiable assets of the subsidiary acquired and the measurement of all amounts has been reviewed, the difference is recognised directly in profit or loss as a bargain purchase. Where settlement of any part of cash consideration is deferred, the amounts payable in the future are discounted to their present value as at the date of exchange. The discount rate used is the entity s incremental borrowing rate, being the rate at which a similar borrowing could be obtained from an independent financier under comparable terms and conditions. Contingent consideration is classified either as equity or a financial liability. Amounts classified as a financial liability are subsequently remeasured to fair value with changes in fair value recognised in profit or loss. 111
119 33. INTEREST IN OTHER ENTITIES a) Subsidiaries and trusts The consolidated financial statements incorporate the assets, liabilities and results of the following controlled entities in accordance with the accounting policy described in Note 1(b): Beneficial ownership by Consolidated entity Place of Incorporation % % Australia nib health funds limited Australia nib servicing facilities pty limited Australia nib health care services pty limited Australia nib Global Pty Limited Australia IMAN Australian Health Plans Pty Limited Australia nib nz holdings limited New Zealand nib nz limited New Zealand nib Options Pty Limited Australia Realsurgeons Pty Limited Australia Realself Pty Limited Australia nib Options Holdings (Thailand) Co Limited Thailand nib Options (Thailand) Co Limited Thailand Digital Health Ventures Pty Limited Australia nib Philippines Pty Limited Australia nib Asia Pty Ltd Australia World Nomads Group Pty Limited Australia WNG Services Pty Limited Australia World Experiences Assist Pty Limited Australia Suresave Pty Limited Australia Sure-Save.net Pty Ltd Australia SureSave Net Limited New Zealand Travel Insurance Direct Holdings Pty Limited Australia Travel Insurance Direct Pty Limited Australia Travel Insurance Direct (New Zealand) Limited New Zealand Cheap Travel Insurance Pty Limited Australia Holiday Travel Insurance Pty Limited Australia SureCan Technology Pty Ltd Australia The World Nomads Group Holdings Pty Ltd Australia World Nomads Pty Ltd Australia World Nomads Inc United States of America World Nomads Limited United Kingdom World Nomads (Canada) Ltd Canada WorldNomads.com Pty Ltd Australia Cerberus Special Risks Pty Limited Australia Get Insurance Group Pty Limited Australia World Experiences International Holdings Pty Ltd Australia World Experiences Seguros De Viagem Brasil LTDA Brazil Nomadic Insurance Benefits Holdings Limited Ireland 100 N/A Nomadic Insurance Benefits Limited Ireland 100 N/A World Nomads Travel Lifestyle (Europe) Limited Ireland 100 N/A nib Travel Services Ireland Limited Ireland 100 N/A Travellr Pty Limited Australia Travel Insurance Compared Pty Limited Australia TravelClear Pty Limited Australia Travellers Assistance Group Pty Limited Australia Hello Travel Insurance Pty Limited Australia World Experiences Pty Limited Australia World Experiences Group Pty Limited Australia World Experiences Travel Pty Limited Australia
120 33. INTEREST IN OTHER ENTITIES continued also controls the following trusts: nib Holdings Ltd Share Ownership Plan Trust nib salary sacrifice plan and matching plan trust nib Salary Sacrifice (NZ) and Matching Plan (NZ) Trust nib holdings nib nz Employee Share Purchase Scheme Trust b) Non-controlling interests (NCI) Set out below is summarised financial information for each subsidiary that has non-controlling interests that are material to the Group. The amounts disclosed for each subsidiary are before inter-company eliminations. Digital Health Ventures Pty Limited nib Options Pty Limited consolidated group Summarised balance sheet $m $m $m $m Current assets Current liabilities Current net assets / (liabilities) - - (13.1) (9.1) Non-current assets Non-current liabilities Non-current net assets / (liabilities) - (1.9) Net assets / liabilities - (1.9) (12.9) (8.9) Accumulated NCI - (0.9) (1.0) (0.7) Summarised statement of comprehensive income Profit / (loss) for the year 1.9 (1.6) (4.1) (3.1) Other comprehensive income Total comprehensive income / (loss) 1.9 (1.6) (4.1) (3.1) Profit / (loss) allocated to NCI 0.9 (0.8) (0.3) (0.3) Dividends paid to NCI Summarised cash flows Cashflow s from operating activities (2.1) (1.8) (2.5) (2.7) Cashflow s from investing activities 4.4 (1.2) (0.2) (0.1) Cash flow s from financing activities (2.5) Net increase / (decrease) in cash and cash equivalents (0.2)
121 33. INTEREST IN OTHER ENTITIES continued c) Interest in associates and joint ventures On 1 February 2017, Digital Health Ventures Pty Ltd sold the Whitecoat business to Whitecoat Operating Pty Ltd. The Group holds a 35% ownership interest in Whitecoat Holdings Pty Ltd which is the parent company of Whitecoat Operating Pty Ltd $m $m Aggregate carrying amount of individually immaterial associates and joint ventures Aggregate amounts of the Group's share of: Profit/(loss) from continuing operations (0.3) - Total comprehensive income (0.3) - 114
122 34. RELATED PARTY TRANSACTIONS a) Related party transactions with key management personnel Key management personnel are entitled to insurance policies provided at a discount dependant on length of service. These are provided under normal terms and conditions. There were no other related party transactions during the year, as there were no transactions where either party had the presence of control, joint or significant influence to affect the financial and operating policies of the other entity. b) Key management personnel compensation $ $ Short-term employee benefits 6,373,470 5,273,536 Post-employment benefits 336, ,583 Other long-term benefits 42,371 38,351 Termination benefits - - Share-based payments 3,758,829 2,321,301 10,511,257 7,918,771 Detailed remuneration disclosures are provided in the Remuneration Report on pages 24 to 42. c) Transactions with other related parties i) Purchases from entities controlled by key management personnel The Group acquired the following goods and services from entities that are controlled by a close family member of one of the Group s key management personnel: advertising and promotions printing and stationery software development and maintenance Further details of the above transactions with key management personnel are disclosed in the Remuneration Report on page 42. d) Outstanding balances arising from sales/purchases of goods and services There are no outstanding balances at the end of the reporting period in relation to transactions with related parties. 115
123 35. SHARE-BASED PAYMENTS a) Long-term incentive plan (LTIP) Performance rights to acquire shares in are granted to Executives under the Long Term Incentive Plan (LTIP). Information relating to the LTIP is included in the Remuneration Report on page 31. The nib Holdings Ltd Share Ownership Plan Trust administers the Group s Executive management Short-Term incentive and Long-Term Incentive Share Plans. This Trust has been consolidated in accordance with Note 1(b). Set out below is a summary of performance rights granted under the plan: 2017 Grant date Expiry date Exercise price Balance at start of the year Granted during the year Exercised during the year Forfeited during the year Balance at the end of the year Vested and exercisable at end of the year 2016 Number Number Number Number Number Number 19/11/2012 1/09/ ,236 - (345,771) (207,465) /11/2013 1/09/ , ,057-22/12/2014 1/09/ , ,927-13/05/2015 1/09/ , ,956-22/01/2016 1/09/ , ,895-23/09/2016 1/09/ , ,099-5/12/2016 1/09/ , ,228-2,238, ,327 (345,771) (207,465) 2,290,162 - Grant date Expiry date Exercise price Balance at start of the year Granted during the year Exercised during the year Forfeited during the year Balance at the end of the year Vested and exercisable at end of the year Number Number Number Number Number Number 21/12/2011 1/09/ ,307 - (196,154) (196,153) /11/2012 1/09/ , ,236-29/11/2013 1/09/ , ,057-22/12/2014 1/09/ , ,927-13/05/2015 1/09/ , ,956-22/01/2016 1/09/ , ,895-2,001, ,895 (196,154) (196,153) 2,238,071 - b) Employee Share Acquisition (tax exempt) Plan (ESAP) Eligible Australian employees were offered the opportunity to receive part of their salary in the form of shares. All permanent employees who were an employee at the date the offer was made were eligible to participate in the scheme. Employees may elect not to participate in the scheme. ESAP is administered by the Board. Shares granted to the employees by the Board were acquired on-market via a third party trustee plan company. Under the plan, participating employees were allocated an aggregate market value up to $1,000 worth of fully paid ordinary shares in nib holdings limited. Subsequent offers under ESAP are at the Board s discretion. Shares issued under the scheme may not be sold until the earlier of three years after issue or cessation of employment. In all other respects shares rank equally with other fully-paid ordinary shares on issue Number of shares purchased on market under the plan to participating employees 67,343 85,806 The shares were allocated in two tranches. The first tranche of shares were for allocated on 26 August 2016 following nib s FY16 full year results presentation at a volume weighted average price of $4.57. The remaining tranche of shares were allocated on 22 February 2017 following nib s FY17 half year results presentation at a volume weighted average price of $
124 35. SHARE-BASED PAYMENTS continued c) nib NZ Employee Share Purchase Scheme (ESPS) The scheme rules were adopted on 7 November On 9 December 2013 eligible employees were offered the opportunity to receive part of their salary in the form of shares. All full-time and permanent part-time employees who were an employee as at 9 December 2013 and the date shares were allocated to employees were eligible to participate in the scheme. Employees may elect not to participate in the scheme. ESPS is administered by the Board. Shares granted to the employees by the Board were acquired on-market via a third party trustee plan company. Under the scheme, participating employees were allocated an aggregate market value up to NZD $1,000 worth of fully paid ordinary shares in. Subsequent offers under ESPS are at the Board s discretion. Shares issued under the scheme may not be sold until the earlier of three years after issue or cessation of employment. In all other respects shares rank equally with other fully-paid ordinary shares on issue Number of shares purchased on market under the plan to participating employees 2,409 7,672 The shares were allocated in two tranches. The first tranche of shares were for allocated on 24 August 2016 following nib s FY16 full year results presentation at a volume weighted average price of $4.57. The remaining tranche of shares were allocated on 22 February 2017 following nib s FY17 half year results presentation at a volume weighted average price of $5.31. d) nib Salary Sacrifice Plan and Matching Plan Business unit managers were offered the opportunity to receive part of their salary in the form of shares, with an additional amount of shares contributed by the Company. Employees may elect not to participate in the plan. The plan is administered by the Board. Shares granted to the employees by the Board were acquired on-market via a third party trustee plan company. Under the plan, participating employees were allocated an aggregate market value up to $10,000 worth of fully paid ordinary shares in nib holdings limited, made up of $5,000 salary sacrifice and $5,000 matching company component. Subsequent offers under the plan are at the Board s discretion. Shares issued under the plan may not be sold until the earlier of three or seven years after issue, or cessation of employment. In all other respects shares rank equally with other fully paid ordinary shares on issue Number of shares purchased on market under the plan to participating employees 47,452 38,952 e) Salary Sacrifice Plan (NZ) and Matching Plan (NZ) The plan rules were adopted on 28 October On 9 December 2013 New Zealand business unit managers were offered the opportunity to receive part of their salary in the form of shares, with an additional amount of shares contributed by the Company. Employees may elect not to participate in the plan. The plan is administered by the Board. Shares granted to the employees by the Board were acquired on-market via a third party trustee plan company. Under the plan, participating employees were allocated an aggregate market value up to NZD $10,000 worth of fully paid ordinary shares in, made up of NZD $5,000 salary sacrifice and NZD $5,000 matching company component. Subsequent offers under the plan are at the Board s discretion. Shares issued under the scheme may not be sold until the earlier of three or seven years after issue, or cessation of employment. In all other respects shares rank equally with other fully paid ordinary shares on issue Number of shares purchased on market under the plan to participating employees 1,650 2,
125 35. SHARE-BASED PAYMENTS continued f) Short-Term Performance Incentive (STI) All eligible employees have a STI opportunity. For the MD/CEO the maximum target bonus opportunity is 100% of the base remuneration package with 50% of the calculated entitlement to be deferred into shares. For the CFO/DCEO and GEARHI the maximum target bonus opportunity is 60% of the base remuneration package with 50% of the calculated entitlement to be deferred into shares. For other executives the maximum entitlement is 50% of the remuneration package with 50% of the calculated entitlement deferred into shares. The nib Holdings Ltd Share Ownership Plan Trust administers the Group s Executive management Short-Term Incentive and Long-Term Incentive Share Plans. This Trust has been consolidated in accordance with Note1(b). Shares issued by the Trust to the employees are acquired on-market prior to the issue. Shares held by the Trust and not yet issued to employees at the end of the reporting period are shown as treasury shares in financial statements; see Note 22(b). Shares were purchased on market and brokerage fees are borne by nib health funds limited. g) Expenses arising from share-based payments transactions $m $m Shares purchased on market under ESAP and ESPS Shares purchased on market under nib salary sacrifice plan and matching plan and salary sacrifice (NZ) rules and matching plan (NZ) Performance rights granted under LTIP Shares purchased on market under STI h) Accounting policy The fair value of performance rights granted under the nib holdings Long-Term Incentive Plan is recognised as an employee benefit expense with a corresponding increase in equity. The total amount to be expensed is determined by reference to the fair value of the performance rights granted, which includes any market performance conditions but excludes the impact of any service and non-market performance vesting conditions and the impact of any non-vesting conditions. Non-market vesting conditions are included in assumptions about the number of performance rights that are expected to vest. The total expense is recognised over the vesting period, which is the period over which all of the specified vesting conditions are to be satisfied. At the end of each period, the Group revises its estimate of the number of performance rights that are expected to vest based on the non-marketing vesting conditions. It recognises the impact of the revision to original estimates, if any, in profit or loss, with a corresponding adjustment to equity. The nib holdings Long-Term Incentive Plan is administered by the nib Holdings Ltd Share Ownership Plan Trust; see Note 22(d)(ii). When the performance rights are exercised, the trust transfers the appropriate amount of shares to the employee. Under the Employee Share Acquisition (tax exempt) Plan, the nib Salary Sacrifice Plan and Matching Plan and the Short-Term Performance Incentive, shares are acquired on-market and expensed. 118
126 36. PARENT ENTITY FINANCIAL INFORMATION The individual financial statements for the parent entity show the following aggregate amounts: $m $m Balance Sheet ASSETS Current assets Non-current assets Total assets LIABILITIES Current liabilities Non-current liabilities Total liabilities NET ASSETS EQUITY Share capital Share-based payments (0.9) (0.7) Retained profits Total Equity $m $m Profit for the year Total comprehensive income for the year Refer to Note 29 for contingent liabilities of parent entity. a) Accounting policy The financial information for the parent entity,, has been prepared on the same basis as the consolidated financial statements, except as set out below. i) Investments in subsidiaries, associates and joint venture entities Investments in subsidiaries, associates and joint venture entities are accounted for at cost in the financial statements of. Dividends received from associates are recognised in the parent entity s profit or loss, rather than being deducted from the carrying amount of these investments. 119
127 36. PARENT ENTITY FINANCIAL INFORMATION continued a) Accounting policy continued ii) Tax consolidation legislation and its wholly-owned Australian controlled entities have implemented the tax consolidated legislation. The head entity,, and the controlled entities in the tax consolidated group account for their own current and deferred tax amounts. These tax amounts are measured as if each entity in the tax consolidated group continues to be a standalone taxpayer in its own right. In addition to its own current and deferred tax amounts, also recognises the current tax liabilities (or assets) and the deferred tax assets arising from unused tax losses and unused tax credits assumed from controlled entities in the tax consolidated group. The entities have also entered into a tax funding agreement under which the wholly-owned entities fully compensate for any current tax payable assumed and are compensated by nib holdings limited for any current tax receivable and deferred tax assets relating to unused tax losses or unused tax credits that are transferred to under the tax consolidation legislation. The funding amounts are determined by reference to the amounts recognised in the wholly-owned entities financial statements. The amounts receivable/payable under the tax funding agreement is due upon receipt of the funding advice from the head entity, which is issued as soon as practicable after the end of each financial year. The head entity may also require payment of interim funding amounts to assist with its obligations to pay tax instalments. Assets or liabilities arising under tax funding agreements with the tax consolidated entities are recognised as current amounts receivable from or payable to other entities in the Group. Any difference between the amounts assumed and amounts receivable or payable under the tax funding agreement are recognised as a contribution to (or distribution from) wholly-owned tax consolidated entities. 120
128 37. COMPANY DETAILS is a company limited by shares, incorporated and domiciled in Australia. The registered office of the company is: 22 Honeysuckle Drive NEWCASTLE NSW 2300 The Financial Report was authorised for issue by the Directors on 18 August The company has the power to amend and reissue the Financial Report. 121
129 Directors Declaration In the Directors opinion: a) the financial statements and notes set out on pages 44 to 121 are in accordance with the Corporations Act 2001, including: i. complying with Accounting Standards, the Corporations Regulations 2001 and other mandatory professional reporting requirements; and ii. giving a true and fair view of the consolidated entity s financial position as at 30 June 2017 and of its performance for the financial year ended on that date; and b) there are reasonable grounds to believe that will be able to pay its debts as and when they become due and payable. Note 1(a) confirms that the financial statements also comply with International Financial Reporting Standards as issued by the International Accounting Standards Board. The Directors have been given declarations by the Chief Executive Officer and Chief Financial Officer required by section 295A of the Corporations Act This declaration is made in accordance with a resolution of the Directors. On behalf of the Board Steve Crane Director Harold Bentley Director Newcastle, NSW 18 August
130 Independent auditor s report To the members of Report on the audit of the financial report Our opinion In our opinion: The accompanying financial report of (the Company) and its controlled entities (together the Group) is in accordance with the Corporations Act 2001, including: a) giving a true and fair view of the Group s financial position as at 30 June 2017 and of its financial performance for the year then ended b) complying with Australian Accounting Standards and the Corporations Regulations What we have audited The Group s financial report comprises: the consolidated balance sheet as at 30 June 2017 the consolidated income statement for the year then ended the consolidated statement of comprehensive income for the year then ended the consolidated statement of changes in equity for the year then ended the consolidated statement of cash flows for the year then ended the notes to the consolidated financial statements, which include a summary of significant accounting policies the directors declaration. Basis for opinion We conducted our audit in accordance with Australian Auditing Standards. Our responsibilities under those standards are further described in the Auditor s responsibilities for the audit of the financial report section of our report. We believe that the audit evidence we have obtained is sufficient and appropriate to provide a basis for our opinion. Independence We are independent of the Group in accordance with the auditor independence requirements of the Corporations Act 2001 and the ethical requirements of the Accounting Professional and Ethical Standards Board s APES 110 Code of Ethics for Professional Accountants (the Code) that are relevant to our audit of the financial report in Australia. We have also fulfilled our other ethical responsibilities in accordance with the Code. Our audit approach An audit is designed to provide reasonable assurance about whether the financial report is free from material misstatement. Misstatements may arise due to fraud or error. They are considered material if individually, or in aggregate, they could reasonably be expected to influence the economic decisions of users taken on the basis of the financial report. PricewaterhouseCoopers, ABN Level 3, 45 Watt Street, PO Box 798, NEWCASTLE NSW 2300 T: , F: , Liability limited by a scheme approved under Professional Standards Legislation. 123

131 We tailored the scope of our audit to ensure that we performed enough work to be able to give an opinion on the financial report as a whole, taking into account the geographic and management structure of the Company, its accounting processes and controls and the industry in which it operates. Materiality For the purpose of our audit we used overall group materiality of $8.7 million, which represents approximately 5% of the Group s profit before tax. We applied this threshold, together with qualitative considerations, to determine the scope of our audit and the nature, timing and extent of our audit procedures and to evaluate the effect of misstatements on the financial report as a whole. We chose Group profit before tax as the benchmark because, in our view, it is the metric against which the performance of the Group is most commonly measured, and is a generally accepted benchmark. We selected 5% based on our professional judgement noting that it is within the range of commonly acceptable profit related thresholds. Audit scope The Group provides health and medical insurance to Australian and New Zealand residents, medical insurance to international inbound workers and students, as well as distributing travel insurance products both in Australia and internationally. We decided the nature, timing and extent of work that needed to be performed by us and component auditors from other PwC network firms operating under our instruction. We then structured our audit approach as follows: We audited the financial information of financially significant entities within the Group Work was performed by component auditors in New Zealand. For these procedures, we decided on the level of involvement required from us to be able to conclude whether sufficient appropriate audit evidence had been obtained. Our involvement included discussions and written instructions and reporting throughout the year with the component auditors We performed further audit procedures at a Group level, including over the consolidation of the Group s reporting units and the preparation of the financial report. PwC specialists in taxation, information technology and actuarial assisted the audit. Our audit also focused on where the directors made subjective judgements; for example, significant accounting estimates involving assumptions and inherently uncertain future events. Key audit matters Key audit matters are those matters that, in our professional judgement, were of most significance in our audit of the financial report for the current period. The key audit matters were addressed in the context of our audit of the financial report as a whole, and in forming our opinion thereon, and we do not provide a separate opinion on these matters. Further, any commentary on the outcomes of a particular audit procedure is made in that context. We have communicated the key audit matters to the Audit Committee. 124
This report should be read in conjunction with the annual financial report for the year ended 30 June Results for announcement to the market 2
 ABN 51 125 633 856 Half-year report for the period ended 31 December 2017 This report should be read in conjunction with the annual financial report for the year ended 30 June 2017. CONTENTS Results for
FY18 HALF YEAR RESULTS INVESTOR PRESENTATION 19 FEBRUARY 2018
 FY18 HALF YEAR RESULTS INVESTOR PRESENTATION 19 FEBRUARY 2018 DISCLAIMER The material in this presentation is a summary of the results of nib holdings limited (nib) for the six months ended 31 December
nib holdings limited 2018 Annual General Meeting (AGM) Presentation
 Presentation") nib holdings limited Head Office 22 Honeysuckle Drive Newcastle NSW 2300 abn 51 125 633 856 t 13 14 63 f 02 4925 1999 e nib@nib.com.au w nib.com.au 31 October 2018 Company Announcements Office ASX Limited
nib holdings limited Head Office 22 Honeysuckle Drive Newcastle NSW 2300 abn 51 125 633 856 t 13 14 63 f 02 4925 1999 e nib@nib.com.au w nib.com.au 31 October 2018 Company Announcements Office ASX Limited
FULL YEAR RESULTS 2016
 FULL YEAR RESULTS 2016 Disclaimer The material in this presentation is a summary of the results of nib holdings limited (nib) for the 12 months ended 30 June 2016 and an update on nib s activities and
This report should be read in conjunction with the annual financial report for the year ended 30 June 2013.
 ABN 51 125 633 856 Half-year report for the period ended 31 December 2013 This report should be read in conjunction with the annual financial report for the year ended 30 June 2013. CONTENTS Results for
2018 full year results investor presentation. 20 August 2018
 2018 full year results investor presentation 20 August 2018 1 disclaimer The material in this presentation is a summary of the results of nib holdings limited (nib) for the twelve months ended 30 June
1H15 GROUP SUMMARY. Any discrepancies between totals and sums of components in this publication are due to rounding
 2 1H15 GROUP SUMMARY Group premium revenue up 9.1% to $802.3m (1H14: $735.4m). Group operating profit up 1.7% to $42.1m (1H14: $41.4m) 1. Australian residents health insurance (arhi) operating profit up
Computershare 2017 Annual General Meeting
 Computershare 2017 Annual General Meeting Chairman s speech Simon Jones, Chairman Welcome to the Computershare 2017 Annual General Meeting. My name is Simon Jones and I am your Chair. We have a quorum
OPERATING AND FINANCIAL REVIEW
 OPERATING AND FINANCIAL REVIEW 1. About Medibank Medibank Private Limited (Medibank) is Australia s leading private health insurer. Medibank s core business is Health Insurance, whereby it underwrites
Philip Gardner, Independent Non-Executive Director. Steve Crane, Independent Non-Executive Director
 Tuesday 26 October 2010 INTRODUCTION nib s Board and Executive Keith Lynch, Chairman Brian Keane, Independent Non-Executive Director Philip Gardner, Independent Non-Executive Director Steve Crane, Independent
Tailored and experiential training for the insurance industry
 Tailored and experiential training for the insurance industry We believe in learning by doing. Our experiential approach to learning helps engage participants at a deep level and ensure they gain practical
REMUNERATION REPORT For the year ended 30 June 2016
 MESSAGE FROM THE BOARD Dear Shareholder, We are pleased to present our Remuneration Report for the financial year to 30 June 2016. Our aim with remuneration is to retain, reward and incentivise our Executives
CHALLENGER LIMITED ANNUAL GENERAL MEETING CEO S ADDRESS 26 NOVEMBER :30AM THE WESLEY CENTRE 220 PITT STREET SYDNEY
 CHALLENGER LIMITED ANNUAL GENERAL MEETING CEO S ADDRESS 26 NOVEMBER 2012 10:30AM THE WESLEY CENTRE 220 PITT STREET SYDNEY Thank you Peter and good morning. It s an honour to be addressing you, for the
FROM 12 TO 21: OUR WAY FORWARD
 FROM 12 TO 21: OUR WAY FORWARD MESSAGE FROM THE BOARD Weldon Cowan, chair of the board of directors The board of directors shares the corporation s excitement about the next phase of the From 12 to 21
IAG announces FY18 results 15 August 2018
 Financial indicators FY17 FY18 Change GWP ($m) 11,439 11,647 1.8% Insurance profit ($m) 1,270 1,407 10.8% Underlying margin (%) 12.4 14.1 170bps Reported margin (%) 15.5 18.3 280bps Shareholders funds
Suncorp Group Limited ABN
 Suncorp Group Limited ABN 66 145 290 124 Financial results for the full year ended 30 June 2013 Basis of preparation Suncorp Group ( Group, the Group or Suncorp ) is represented by Suncorp Group Limited
GOOD MORNING LADIES AND GENTLEMEN AND WELCOME TO THE 2006 ANNUAL GENERAL MEETING.
 MACQUARIE BANK AGM CHAIRMAN S ADDRESS THURSDAY 20 JULY 2006 (CHECK AGAINST DELIVERY) GOOD MORNING LADIES AND GENTLEMEN AND WELCOME TO THE 2006 ANNUAL GENERAL MEETING. I M DAVID CLARKE, THE CHAIRMAN OF
Schemes spotlight 2016 First Edition
 SCHEMES SPOTLIGHT 2016 Schemes spotlight 2016 First Edition The UK schemes market insight: An in-depth review of the schemes market Published by The number 1 UK brand for schemes 1 A foreword from UK General
This report should be read in conjunction with the annual financial report for the year ended 30 June Results for announcement to the market 2
 ABN 51 125 633 856 Half-year report for the period ended 31 December 2018 This report should be read in conjunction with the annual financial report for the year ended 30 June 2018. CONTENTS Results for
2018 FULL YEAR INVESTOR PRESENTATION SILVER CHEF LIMITED
 2018 FULL YEAR INVESTOR PRESENTATION SILVER CHEF LIMITED 1986 2005 2008 2011 2013 2018 Silver Chef established by Non-Executive Chairman Allan English Silver Chef listed on ASX Launched GoGetta in Australia
Annual Meetings Remarks May 3, Paul Mahon. President and CEO Great-West Lifeco Inc.
 Annual Meetings Remarks May 3, 2018 Paul Mahon President and CEO Great-West Lifeco Inc. Paul Mahon President and CEO Great-West Lifeco Inc. Contents Overview 1 Financial performance highlights 1 Creating
AMBITION GROUP LIMITED
 AMBITION GROUP LIMITED Nimble Adaptable Specialist Half Year Report for the period ended 30th June 2016 & Appendix 4D information Level 5, 55 Clarence St, NSW 2000 Tel: +61 9249 5000 www.ambition.com.au
TABLE OF CONTENTS Interim Profit Announcement 2005
 Profit Announcement For the six months ended 3 March 2005 This interim profit announcement has been prepared for distribution in the United States of America TABLE OF CONTENTS Interim Profit Announcement
Appendix 4D. to the Australian Securities Exchange. Half Year Ended 31 December 2016
 Appendix 4D Half Year Report Appendix 4D Half Year Report to the Australian Securities Exchange Part 1 Name of Entity ABN 21 146 035 127 Half Year Ended 31 December 2017 Previous Corresponding Reporting
Protect your business against the loss of a key person
 LIFE INSURANCE KEY PERSON LIFE INSURANCE Protect your business against the loss of a key person FOR GENERAL USE WITH THE PUBLIC If a key person in your company died today, would it adversely affect your
ASX Release 27 November 2018
 ASX Release 27 November 2018 2018 ANNUAL GENERAL MEETING CHAIRMAN S SPEECH Introduction Welcome to the Bravura Solutions 2018 AGM. Bravura Solutions has enjoyed another successful year in FY18, with the
I look forward to sharing some of these details with you this morning.
 Good morning everyone. I am delighted to be here today as Chief Executive Officer of SunRice. Twelve months ago I stood here and spoke about our company s investment for growth. It is pleasing to report
ASG GROUP DELIVERS SOLID GROWTH ACROSS ALL KEY FINANCIAL INDICATORS
 ASG GROUP LIMITED ASX ANNOUNCEMENT: H1 RESULTS RELEASE DATE: 28 TH FEBRUARY 2012 ASG GROUP DELIVERS SOLID GROWTH ACROSS ALL KEY FINANCIAL INDICATORS Financial Highlights: Revenue of $76.04 million, an
Westpac Banking Corporation 2011 Annual General Meeting
 Westpac Banking Corporation 2011 Annual General Meeting Sydney, Australia 14 December 2011 Chief Executive Officer s Address Gail Kelly Westpac Banking Corporation ABN 33 007 457 141. Introduction Thank
Profit Announcement. For the six months ended 31 March 2007
 Profit Announcement For the six months ended 3 March 2007 Incorporating the requirements of Appendix 4D This interim profit announcement has been prepared for distribution in the United States of America
For personal use only
 NAB 2017 Full Year Results Summary Sarah and Justin Montesalvo Patriot Campers 2017 FINANCIAL HIGHLIGHTS $ 5,285 M Statutory net profit 99 CPS Final dividend 100% franked $ 5.3 BN Dividends declared $
For personal use only
 AUSTRALIAN FINANCE GROUP LIMITED ABN 11 066 385 822 Appendix 4E Preliminary Final Report for the year ended 30 June 2015 Contents Page Results for announcement to market 2 Discussion and analysis of the
APPENDIX 4D. Data # 3 Limited. Reporting period Half-year ended 31 December 2014 Previous corresponding period Half-year ended 31 December 2013
 APPENDIX 4D Name of entity Data # 3 Limited ABN 31 010 545 267 Reporting period Half-year ended 31 December 2014 Previous corresponding period Half-year ended 31 December 2013 RESULTS FOR ANNOUNCEMENT
Sonic Healthcare Limited ABN
 ABN 24 004 196 909 PRELIMINARY FINAL REPORT FOR THE YEAR ENDED 30 JUNE Lodged with the ASX under Listing Rule 4.3A Page 1 of 22 RESULTS FOR ANNOUNCEMENT TO THE MARKET For the year ended Financial Results
UnitedHealth Group Fourth Quarter 2016 Results Teleconference Prepared Remarks January 17, 2017
 UnitedHealth Group Fourth Quarter 2016 Results Teleconference Prepared Remarks January 17, 2017 Moderator: Good morning, I will be your conference operator today. Welcome to the UnitedHealth Group Fourth
amaysim 2018 half year result 1,2 Strong growth in subscribers and record net revenue. Increased investment to drive future growth across the business
 ASX ANNOUNCEMENT 26 February 2018 amaysim 2018 half year result 1,2 Strong growth in subscribers and record net revenue. Increased investment to drive future growth across the business SUMMARY Record statutory
dear fellow shareholders,
 2013 annual report dear fellow shareholders, 2013 was a landmark year for Umpqua Holdings. We celebrated Umpqua Bank s 60th anniversary and the investments and actions taken over the last few years delivered
REMUNERATION REPORT for the year ended 30 June 2017
 REMUNERATION REPORT MESSAGE FROM THE BOARD Dear Shareholder, It is with pleasure that we present our Remuneration Report for the financial year to 30 June 2017. While the past 12 months have not been without
For personal use only
 19 February 2014 Company Announcements Platform Australian Securities Exchange Limited 20 Bridge Street Sydney NSW 2000 Dear Sir/Madam Aristocrat Leisure Limited 2014 Annual General Meeting In accordance
GENDER EQUALITY BOND PROGRESS REPORT
 2017 GENDER EQUALITY BOND PROGRESS REPORT YEAR ENDED 31 DECEMBER 2017 QBE INSURANCE GROUP LIMITED 2 Contents Limited 2017 Gender Equality Bond Report ABN 28 008 485 014 Introduction 3 Framework summary
The attached presentation will be delivered by nib at the UBS Australasia Conference today.
 nib holdings limited Head Office 22 Honeysuckle Drive Newcastle NSW 2300 abn 51 125 633 856 t 13 14 63 f 02 4925 1999 e nib@nib.com.au w nib.com.au 12 November 2018 The Manager Company Announcements Australia
2018 SHAREHOLDER REVIEW
 2018 SHAREHOLDER REVIEW nib holdings limited 2 Group Performance Highlights 4 Chairman s Report 6 Managing Director s Report Year in Review 8 Australian Residents Health Insurance 10 nib New Zealand 12
WESLEYAN PROVIDES HELP WHEN YOU NEED IT MOST INCOME PROTECTION FOR STUDENT AND FOUNDATION DENTISTS
 WESLEYAN PROVIDES HELP WHEN YOU NEED IT MOST INCOME PROTECTION FOR STUDENT AND FOUNDATION DENTISTS 02 Personal Income Protection Plan RELAX, YOU RE COVERED At Wesleyan, we ve been providing specialist
IT TAKES THREE TO TANGO
 IT TAKES THREE TO TANGO Structural Collaboration Between Carriers, Providers and Consumers A HEALTHSCAPE ADVISORS EXECUTIVE BRIEFING This HealthScape Advisors Executive Brief discusses a more comprehensive
RESIDENTIAL PROJECTS AUSTRALIA (RPA)
") COMPANY PROFILE - TRUST - PARTNERSHIP - SECURITY A truly tailored approach Customised investments Client care, guidance and education Trusted relationships National presence International reach Full service
COMPANY PROFILE - TRUST - PARTNERSHIP - SECURITY A truly tailored approach Customised investments Client care, guidance and education Trusted relationships National presence International reach Full service
I m very pleased to be here in Calgary with all of you for CIBC s 148th annual general meeting, and my first as CEO.
 Remarks for Victor G. Dodig, President and Chief Executive Officer CIBC Annual General Meeting Calgary, Alberta April 23, 2015 Check Against Delivery Good morning, ladies and gentlemen. I m very pleased
FY18 Results Presentation Bravura Solutions Limited. 28 August 2018
 FY18 Results Presentation Bravura Solutions Limited 28 August 2018 Important notice and disclaimer The information contained in this document (including this notice) and discussed at this presentation
MOVING THE NEEDLE ON EMPLOYEE FINANCIAL WELLNESS
 HEALTH WEALTH CAREER FINDINGS FROM MERCER CANADA'S INSIDE EMPLOYEES' MINDS SURVEY MOVING THE NEEDLE ON EMPLOYEE PRACTICAL STEPS FOR CANADIAN EMPLOYERS 2 THE CHALLENGE OF EMPLOYEE A GROWING NUMBER OF EMPLOYERS
Please find attached presentation delivered by nib to Macquarie Securities Australia (4 June 2018).
.") nib holdings limited Head Office 22 Honeysuckle Drive Newcastle NSW 2300 abn 51 125 633 856 t 13 14 63 f 02 4925 1999 e nib@nib.com.au w nib.com.au 4 June 2018 The Manager Company Announcements Australia
nib holdings limited Head Office 22 Honeysuckle Drive Newcastle NSW 2300 abn 51 125 633 856 t 13 14 63 f 02 4925 1999 e nib@nib.com.au w nib.com.au 4 June 2018 The Manager Company Announcements Australia
Vero SME Insurance Index Issue 2. Customer insights drive new opportunities
 Vero SME Insurance Index 2018 Issue 2 Customer insights drive new opportunities Vero SME Insurance Index 2018 Issue 2 3 Introduction Welcome to our second issue of the 2018 Vero SME Insurance Index for
Interim FY 2015 results 6 months ended 31 December February 2015
 Interim FY 2015 results 31 December 2014 18 February 2015 Highlights Solid trading result for 1H FY2015; change in accounting policy for acquisition of healthcare practices First half result highlights
General. Meeting. ress
 Westpac Banking Corporation 2011 Annual General Meeting Sydney, Australia 14 December 2011 Chairman s Addr ress Ted Evans AC Westpac Banking Corporation ABN 33 007 457 141. Another challenging but rewarding
Your guide to Aviva Flex-pertise TM
 For use with employers Your guide to Aviva Flex-pertise TM Help your employees reach for more Part of our award-winning Group Protection proposition Welcome to Aviva Flex-pertise Expert support and flexible
For personal use only. Suncorp Group Limited ABN Analyst Pack
 Suncorp Group Limited ABN 66 145 290 124 Analyst Pack for the full year ended 30 June 2014 Basis of preparation Suncorp Group ( Group, the Group or Suncorp ) is represented by Suncorp Group Limited (SGL)
Annual Business Plan July 1, 2015 through June 30, 2016
 www.montanastatefund.com Annual Business Plan July 1, 2015 through June 30, 2016 Table of Contents From the President... 1 Executive Summary... 2 Strategic Framework... 3 Key Success Measures... 4 Organizational
AMP driving value and growth. Andrew Mohl Chief Executive Officer
 AMP driving value and growth Andrew Mohl Chief Executive Officer Outline AMP today 1H 04 financial results Summary Overview Outlook - 2H 2004 and 2005 Strategic focus Industry landscape AMP s competitive
It is therefore pleasing to report that this evolution of BOQ has continued throughout this financial year.
 1 2 Good morning everyone. I will start with the highlights of the results. The strategy we have been implementing in the past few years has transformed BOQ into a resilient, multi-channel business that
NEWS RELEASE ANZ FULL YEAR 2018 RESULT
 31 OCTOBER 2018 NEWS RELEASE ANZ FULL YEAR 2018 RESULT ANZ today announced a Statutory Profit after tax for the Full Year ended 30 September 2018 of $6.40 billion, flat on the comparable period and a Cash
VIRGIN MONEY HOLDINGS (UK) PLC: Q TRADING UPDATE VIRGIN MONEY POWERS AHEAD WITH RECORD MORTGAGE LENDING IN Q1 2016
 PLC: Q TRADING UPDATE VIRGIN MONEY POWERS AHEAD WITH RECORD MORTGAGE LENDING IN Q1 2016") VIRGIN MONEY HOLDINGS (UK) PLC: Q1 2016 TRADING UPDATE VIRGIN MONEY POWERS AHEAD WITH RECORD MORTGAGE LENDING IN Q1 2016 Recognised as one of Britain s most trusted banks 1 Ranked the number one UK lender
VIRGIN MONEY HOLDINGS (UK) PLC: Q1 2016 TRADING UPDATE VIRGIN MONEY POWERS AHEAD WITH RECORD MORTGAGE LENDING IN Q1 2016 Recognised as one of Britain s most trusted banks 1 Ranked the number one UK lender
2014 ANNUAL GENERAL MEETING THURSDAY, 6 NOVEMBER Chairman s Address. by Dr Bob Every AO
 2014 ANNUAL GENERAL MEETING THURSDAY, 6 NOVEMBER 2014 Chairman s Address by Dr Bob Every AO Welcome ladies and gentlemen and thank you for attending Boral s 2014 Annual General Meeting. Over the past 24
2011 INVESTOR BRIEFING
 2011 INVESTOR BRIEFING 14 June 2011 ABN 60 090 739 923 4 AUSTRALIA INTERMEDIATED () Accelerating growth in home markets PETER HARMER CHIEF EXECUTIVE OFFICER 30 BUSINESS OVERVIEW DIVERSE PORTFOLIO MIX Large
Building a best-in-class global insurance and risk solutions provider
 We are a niche specialty property and casualty insurance company with nearly 8,000 employees worldwide. We focus on underserved markets in areas of small commercial business, specialty risk and extended
montanastatefund.com ANNUAL BUSINESS PLAN
 montanastatefund.com ANNUAL BUSINESS PLAN January 1, 2016 through December 31, 2016 TABLE OF CONTENTS From the President... 1 Executive Summary... 2 Strategic Framework... 3 Key Success Measures... 4 Organizational
Intuit Inc. Second-quarter Fiscal 2018 Conference Call Remarks February 22, 2018
 Intuit Inc. Second-quarter Fiscal 2018 Conference Call Remarks February 22, 2018 Introduction Good afternoon and welcome to Intuit s second-quarter fiscal 2018 conference call. I m here with Brad Smith,
ENHANCING VICTORIA S ECONOMIC PERFORMANCE AND PRODUCTIVITY. Cbus is pleased to provide some brief comments in relation to the discussion paper.
 8 August 2017 Email: pjip.submissions@dpc.vic.gov.au ENHANCING VICTORIA S ECONOMIC PERFORMANCE AND PRODUCTIVITY Cbus is pleased to provide some brief comments in relation to the discussion paper. Our comments
Royal Philips Electronics Creating long-term value with sustainability
 Royal Philips Electronics Creating long-term value with sustainability ING Benelux SRI Conference Amsterdam March 25 th, 2010 Important information Forward-looking statements This document and the related
OnePath Australian Shares
 OnePath Australian Shares Fund overview OnePath Australian Shares gives you access to a diverse portfolio of shares in companies listed on the Australian Securities Exchange (ASX). About the manager UBS
GWA Group Limited Chairman s Address Annual General Meeting 30 October 2013
 GWA Group Limited Chairman s Address Annual General Meeting 30 October 2013 Ladies and gentlemen, it is a pleasure for me to address this 21 st Annual General Meeting of GWA Group Limited. The 2012/13
Presentation to J.P. Morgan Australasian Conference October 2014
 nib holdings limited Head Office 22 Honeysuckle Drive Newcastle NSW 2300 abn 51 125 633 856 t 13 14 63 f 02 4925 1999 e nib@nib.com.au w nib.com.au 3 October 2014 The Manager Company Announcements Australia
people and culture are key to our success
 april 2018 dear fellow shareholders, 2017 capped Morgan Stanley s journey through a multi-decade period of challenges and recovery. By transforming our business mix and risk profile, and embracing the
Ana Botín: The board intends to increase the dividend per share by 5% for 2016 PRESS RELEASE
 PRESS RELEASE 2016 ANNUAL GENERAL MEETING Ana Botín: The board intends to increase the dividend per share by 5% for 2016 The total dividend would be EUR 21 cents per share, of which 16.5 would be paid
AUSTRALIAN VINTAGE LTD
 AUSTRALIAN VINTAGE LTD HALF-YEAR REPORT FOR THE HALF-YEAR ENDED 31 DECEMBER 2017 (ACN: 052 179 932 ASX REFERENCE: AVG) RESULTS FOR ANNOUNCEMENT TO THE MARKET REVENUE AND NET PROFIT/LOSS PERCENTAGE CHANGE
Leading light. Full year results to 30 September November 2014
 Leading light Full year results to 30 September 2014 27 November 2014 1 Leading light Disclaimer This presentation has been prepared by TOWER Limited to provide shareholders with information on TOWER s
SCOTIA CAPITAL FINANCIALS SUMMIT
 Address delivered by Réal Raymond President and Chief Executive Officer National Bank of Canada SCOTIA CAPITAL FINANCIALS SUMMIT 2005 Toronto, September 13, 2005 Good morning everybody, I want to start
Financial Year 2016 Results. 17 May 2016
 Financial Year 2016 Results 17 May 2016 Agenda CEO update Financial update Outlook Strategy Update Q&A CEO Update Richard Kimber Chief Executive Officer Delivering on the Accelerate Strategy A 3 year ACCELERATE
Saferoads continues successful business transformation
 Released 25 February 2016 SAFEROADS HOLDINGS LIMITED RESULTS FOR ANNOUNCEMENT TO THE MARKET HALF-YEAR ENDED 31 DECEMBER 2015 Saferoads continues successful business transformation HIGHLIGHTS Ongoing revenue
Strategic priorities. Sustainable banking. Inspire and engage our people. A better bank contributing to a better world. Enhance client centricity
 banking business operations Compliance Employee health and safety Workforce diversity and Environmental impact inclusion Clients interests centre stage and sustainable relationships Privacy of clients
equity story 2017 Helvetia Group
 equity story 2017 Helvetia Holding AG Helvetia Schweizerische Versicherungsgesellschaft AG Helvetia Schweizerische Lebensversicherungsgesellschaft AG Your Swiss Insurer. Helvetia creates sustained value.
For personal use only
 Appendix 4D Half Year Report Appendix 4D Half Year Report to the Australian Securities Exchange Part 1 Name of Entity Dubber Corporation Limited ABN 64 089 145 424 Half Year Ended 31 December 2017 Previous
Westpac Banking Corporation 2018 Annual General Meeting
 Westpac Banking Corporation 2018 Annual General Meeting Perth, Australia Wednesday, 12 December 2018 Chief Executive Officer s Address Brian Hartzer Thank you Chairman, and good morning fellow shareholders.
This report should be read in conjunction with the annual financial report for the year ended 30 June Results for announcement to the market 2
 ABN 51 125 633 856 Half-year report for the period ended 31 December 2015 This report should be read in conjunction with the annual financial report for the year ended 30 June 2015. CONTENTS Results for
Manulife Investor Day 2018 A bold and exciting future
 C$ unless otherwise stated TSX/NYSE/PSE: MFC SEHK: 945 For Immediate Release June 27, 2018 Manulife Investor Day 2018 A bold and exciting future TORONTO Manulife Financial Corporation ( Manulife or the
ASX Announcement. 16 November AGM Presentations
 ASX Announcement 16 November 2016 AGM Presentations In accordance with the ASX Listing Rules and the Corporations Act 2001, attached are the presentations to be given at today s Annual General Meeting.
Appendix 4D PARAGON CARE LIMITED. Reporting Period: Financial Half Year ended 31 Dec 2014
 Appendix 4D Name of Entity: PARAGON CARE LIMITED Reporting Period: Financial Half Year ended 31 Dec 2014 Previous corresponding Period: Financial Half Year ended 31 Dec 2013 Results for Announcement to
Introduction. The Assessment consists of: A checklist of best, good and leading practices A rating system to rank your company s current practices.
 ESG / CSR / Sustainability Governance and Management Assessment By Coro Strandberg President, Strandberg Consulting www.corostrandberg.com September 2017 Introduction This ESG / CSR / Sustainability Governance
J SAINSBURY PLC (THE COMPANY ) ANNUAL REPORT AND FINANCIAL STATEMENTS 2016
 ANNUAL REPORT AND FINANCIAL STATEMENTS 2016") 3 June 2016 J SAINSBURY PLC (THE COMPANY ) ANNUAL REPORT AND FINANCIAL STATEMENTS 2016 The following documents have today been posted or otherwise made available to shareholders: Annual Report and Financial
3 June 2016 J SAINSBURY PLC (THE COMPANY ) ANNUAL REPORT AND FINANCIAL STATEMENTS 2016 The following documents have today been posted or otherwise made available to shareholders: Annual Report and Financial
WORKING IN THE BANK OF ENGLAND S LEGAL DIRECTORATE
 WORKING IN THE BANK OF ENGLAND S LEGAL DIRECTORATE 2 Working at the heart of the UK financial system throws up unique and intellectually stimulating challenges and our lawyers consistently rise to meet
VIRGIN MONEY HOLDINGS (UK) PLC: CAPITAL MARKETS UPDATE
 PLC: CAPITAL MARKETS UPDATE") THIS ANNOUNCEMENT CONTAINS INSIDE INFORMATION 16 November 2017 VIRGIN MONEY HOLDINGS (UK) PLC: CAPITAL MARKETS UPDATE Virgin Money Holdings (UK) plc ( Virgin Money or the Group ) is today giving a Capital
THIS ANNOUNCEMENT CONTAINS INSIDE INFORMATION 16 November 2017 VIRGIN MONEY HOLDINGS (UK) PLC: CAPITAL MARKETS UPDATE Virgin Money Holdings (UK) plc ( Virgin Money or the Group ) is today giving a Capital
LIFE INSURANCE: THE CASE FOR CHANGE
 LIFE INSURANCE: THE CASE FOR CHANGE HOW DO WE MAKE LIFE INSURANCE SUSTAINABLE AND FIT FOR PURPOSE IN A WORLD OF TECHNOLOGICAL CHANGE AND EVOLVING RISKS? WHAT DOES THE FUTURE OF LIFE INSURANCE LOOK LIKE?
ELECTROCOMPONENTS Full-year results for the year ended 31 March 2018
 ELECTROCOMPONENTS Full-year results for the year ended 31 March 2018 24 May 2018 SAFE HARBOUR This presentation contains certain statements, statistics and projections that are or may be forward-looking.
FOCUS. The FINEOS Playbook. Our Culture and Strategy ORGANISATIONAL HEALTH
 FOCUS ORGANISATIONAL HEALTH The FINEOS Playbook Our Culture and Strategy What do we do? We provide customer-centric core software to the Life, Accident and Health industry. What is our vision? A world
TAG PACIFIC HALF YEAR RESULT
 A S X A N N O U N C E M E N T TAG PACIFIC HALF YEAR RESULT Sydney 21 February 2012 Tag Pacific Limited (ASX: TAG) Group EBITDA $5.9 million Statutory NPAT $4.0 million, up $4.1 million on HY2010 Earnings
Appendix 4D Half-Year Report for the six months to 31 December 2016 Name of entity: ABN or equivalent company reference: CSG Limited and its controlle
 CSG Limited Level 1, 357 Collins Street MELBOURNE VIC 3000 Tel: 07 3840-1234 Fax: 07 3840-1266 Email: investor@csg.com.au Website: www.csg.com.au APPENDIX 4D CSG LIMITED AND CONTROLLED ENTITIES HALF-YEAR
Lloyds TSB Group plc Results
 Lloyds TSB Group plc 2004 Results PRESENTATION OF RESULTS In order to provide a clearer representation of the underlying performance of the Group, the results of the Group s life and pensions and general
FY2018 Results CEO and CFO conference call script
 FY2018 Results CEO and CFO conference call script Stuart Irving, Chief Executive Officer and President Good morning everyone and welcome to Computershare s 2018 Full Year Results conference call. We appreciate
Actuarial Transformation The Future Actuary
 Actuarial Transformation The Future Actuary Prepared by: Rick Shaw Kaise Stephan Presented to the Actuaries Institute General Insurance Seminar Sydney This paper has been prepared for the Actuaries Institute
2011 AGM SHAREHOLDERS QUESTIONS & COMMENTS
 IAG encouraged shareholders to ask questions of, or make comments to, the board and management in advance of the 2011 Annual General Meeting (AGM), via a form included with the 2011 Notice of Meeting.
nib MediGap Terms and Conditions Important information for practitioners about participation in nib s medical no-gap scheme
 nib MediGap Terms and Conditions Important information for practitioners about participation in nib s medical no-gap scheme 13 September 2016 2 nib MediGap Terms and Conditions Contents Section 1 How these
ALFI 2020 Ambition: Serving the interests of investors and the economy
 ALFI 2020 Ambition: Serving the interests of investors and the economy ALFI commits to further enhance Luxembourg s position as the international fund centre of reference, recognised as open, reliable
Policy Supporting Families. Policy highlights. Supporting Kiwi families. Delivering for New Zealanders
 Supporting Kiwi families National is helping New Zealand families to get ahead. Our growing economy means we are creating more opportunities than ever before and we are providing more support to families