Investor Briefing & Q Performance. April 2016
|
|
|
- Rudolph Dean
- 5 years ago
- Views:
Transcription

1 Investor Briefing & Q Performance April 2016
2 Presentation Outline 1. Macro-economic overview 2. Governance & leadership structure 3. Regional expansion and diversification 4. Digital bank 5. SME strategy 6. Qualitative analysis 7. Performance of core business (intermediation) 8. Financial performance 2
3 Presentation Outline 1. Macro-economic overview 2. Governance & leadership structure 3. Regional expansion and diversification 4. Digital bank 5. SME strategy 6. Qualitative analysis 7. Performance of core business (intermediation) 8. Financial performance 3
4 Foreign Exchange Rate - Kenya The Kenya Shilling has appreciated by 1.0% on a YTD basis against the USD USD / KES % 0.0 Jul 15 Aug 15 Sep 15 Oct 15 Nov 15 Dec 15 Jan 16 Feb 16 Mar 16 Apr 16 Stability in the foreign exchange market continues to be supported by an improved forex reserves currently at USD 7.6 billion (equivalent to 4.96 months of import cover) and a narrowing current account deficit largely due to the following: - A lower import bill for petroleum products - Recovery in tourism, tea and horticulture exports - Slowdown in consumer imports - Strong diaspora remittances. 4 4
5 KES vs East African Currencies USD vs. USH,TSH, RWF, KSH The Kenya Shilling maintained stability against the regional currencies in KES / USHS -1% KES / TSHS +5% KES / RWF +9% 0.0 Jul 15 Aug 15 Sep 15 Oct 15 Nov 15 Dec 15 Jan 16 Feb 16 Mar 16 Apr
6 FX Reserves - Kenya FX reserves have risen to five months of import cover giving a significant cushion to the shilling Reserves currently stand at $7.62 billion amounting to 4.96 months of import cover Months of Import Cover Desired Minimum Q1 14 Q2 14 Q3 14 Q4 14 Q1 15 Q2 15 Q3 15 Q4 15 Q1 16 Apr-16 Key reasons for increase in reserves are: i. Lower oil prices ii. iii. Falling current account deficit (currently 8.2% of GDP) Increased exports and inflow from tourism 6 6
7 Current Account balance as a % of GDP - Kenya In Percent
8 Inflation - Kenya The latest inflation figure as at end of April was 5.3% (down from 6.45% in March) due to - Food prices (food index is down due to the rains) - Low fuel prices % 7.8% 6.8% 6.5% 5.3% Dec-15 Jan-16 Feb-16 Mar-16 Apr-16 8
9 Interest Rates Due to the high liquidity in the market, interest rates have been dropping since the beginning of February 2016 Political and Economic review in the Sep-Oct region Jul Aug Sep Peak Oct Nov Dec Jan Feb Mar Apr Interbank rate 12.89% 18.81% 19.84% 25.84% 14.87% 8.77% 5.19% 6.13% 4.51% 4.09% 4.05% 91 Days T. Bill 11.33% 11.51% 18.61% 21.35% 22.13% 9.21% 10.41% 11.76% 9.32% 8.41% 8.77% 182 Days T. Bill 364 Days T. Bill 12.15% 12.36% 14.55% 21.61% 22.29% 10.09% 12.34% 14.18% 11.93% 10.66% 10.69% 12.53% 13.82% 16.30% 21.50% 22.36% 11.93% 12.75% 14.92% 13.25% 11.91% 11.80% On March 21 st 2016, the MPC met and retained the CBR Rate at 11.5% (keeping it at the same level for the last 9 months) The MPC had earlier also retained the KBRR at 9.87% (on Jan 20th 2016) 9
10 Kenya s Resilient Economy Kenya s GDP growth rate maintained an upward growth rate with an increasing momentum while Africa is experiencing declining growth rate. Kenya s Gross Domestic Product (GDP) is estimated to have expanded by 5.6% in which was a slight improvement compared to a 5.3% growth in Kenya s GDP growth rate is projected to rise to 5.9% in 2016 and 6.1 % in 2017 predicated on infrastructure investments. Fiscal consolidation is expected to ease pressure on domestic interest rates and increase credit uptake by the private sector. The contraction in the current account deficit will continue to be supported by declining commodity prices and rising exports of tea
11 Economic growth drivers Kenya Tourism showing positive signs of recovery with enhanced security with Kenya registering the highest growth of 27% in Hotel Bookings For The Period May To July In Africa. Government incentive on reduction of park entry fees from $90 to $60 and More chartered airlines from Europe to Mombasa, have boosted the sector. Kenya recorded the fastest rise in foreign direct investments (FDI) in Africa and the Middle East, at 47%. A total of 84 projects worth Sh102 billion from real estate, renewable and geothermal energy as well as roads and railways provide a huge chunk of new jobs for Kenyans. Kenya was ranked 3rd in terms of numbers of projects initiated after the United Arab Emirates (UAE) at 298 and South Africa at 118. Kenya s Agriculture Experiencing Renewed Growth As A Result Of Improved Weather And Rainfall Pattern. According to the KNBS economic Survey, Agriculture value added rose from 3.5% in 2014 to 5.6% in. Total value of marketed production at current prices increased by 11.3% from KSh billion in 2014 to KSh billion in. Total earnings from crop sales increased by 15.5% to KSh billion in
12 Macro-economic Indicators East Africa 12 12
13 Macro-Economic Indicators Summary (East Africa) Uganda Rwanda Tanzania DRC 91 Days T-Bill 15.56% 5.89% 9.02% 4.7% 182 Days T-Bills 16.28% 6.21% 17.67% 5.4% 364 Days T-Bills 16.19% 8.35% 18.81% 8.1% Central Bank Rate 16.0% 12.0% 12.0% 6.5% Inflation 6.2% 5.8% 5.4% 4.5% 13
14 Presentation Outline 1. Macro-economic overview 2. Governance & leadership structure 3. Regional expansion and diversification 4. Digital bank 5. SME strategy 6. Qualitative analysis 7. Performance of core business (intermediation) 8. Financial performance 14
15 2 Strong Governance & Leadership Structure CBK CMA NSE Rating Agencies Equity Group Holdings Limited Shareholders Subsidiary Boards Group Board Subsidiary Boards Board Committees Subsidiary Internal Audit Group Internal Auditor Group Board Committee CEO CEO s office Director Governance, Strategy, Legal, Company Secretary Chief Officer, Finance, Innovation, Payments Director Brand, Culture and HR Board Committees Subsidiary Internal Audit Non-Banking Subsidiaries Corporate Office Banking Subsidiaries* Equity Group Foundation Equity Investment Bank Equity Insurance Agency Consulting Infrastructure Services Group Director, Payments Chief Technology & Information Officer Group Director, Treasury Group Director, Special Projects Group Director, Analytics Group Chief Operating Officer Group Director, Finance Risk and Compliance Officer Group Director Strategic Relations &Partnerships Group Director, Corporate Banking Group Director, SME Banking Equity Bank Kenya Equity Bank Rwanda Equity Bank Tanzania Equity Bank Uganda Equity Bank South Sudan Equity DRC (Pro Credit Bank) Each subsidiary with own Board of Directors compliant with local regulations 15
16 Presentation Outline 1. Macro-economic overview 2. Governance & leadership structure 3. Regional expansion and diversification 4. Digital bank 5. SME strategy 6. Qualitative analysis 7. Performance of core business (intermediation) 8. Financial performance 16
17 3 Regional Expansion Key Metrics for Banking Subsidiaries KES Billion Tanzania Rwanda Uganda S. Sudan DRC Regional Total Regional Contribution Q Regional Contribution Q1 Deposits % 21% Deposits Growth 1% 23% 21% -61% 31% 14% Loan % 13% Loan Growth 37% 21% -1% -89% 71% 56% Assets % 20% Asset Growth 21% 19% 12% -57% 49% 23% PBT % 10% PBT Growth -12% -50% 2% -95% -41% -45% 17
18 3 Regional Subsidiaries Size and Contribution (Assets and PBT contribution by countries) Total Assets split by Country PBT split by Country Rwanda Uganda Tanzania DRC S. Sudan 100.0% 100.0% 3.0% 3.1% 4.0% 3.8% 4.6% 0.0% 8.6% 4.7% 6.4% Rwanda Uganda Tanzania DRC S. Sudan 100.0% 1.9% 1.4% 1.5% 0.0% 4.7% 100.0% 0.8% 1.2% 1.1% 1.5% 0.2% 3.2% 95.1% Kenya 79.8% 78.7% Kenya 90.5% Q1 Q Q1 Q
19 3 Net Interest Margin Percentage Kenya DRC Uganda Q2 15 Q3 15 Q4 15 Q1 16 Q2 15 Q3 15 Q4 15 Q1 16 Q2 15 Q3 15 Q4 15 Q1 16 Rwanda Tanzania South Sudan Q2 15 Q3 15 Q4 15 Q1 16 Q2 15 Q3 15 Q4 15 Q1 16 Q2 15 Q3 15 Q4 15 Q
20 Presentation Outline 1. Macro-economic overview 2. Governance & leadership structure 3. Regional expansion and diversification 4. Digital bank 5. SME strategy 6. Qualitative analysis 7. Performance of core business (intermediation) 8. Financial performance 20
21 4 Execution on Digital Banking (Increased number of Transaction numbers & values) % % Transaction numbers in millions +45% +315% % Q1 Agency Q Q1 ATM Q Q1 Q Merchants Q1 Q Equitel Q1 Q Branch % Transaction value in KES billion +43% -6% % % Q1 Q Q1 Q Q1 Q Q1 Q Q1 Q
22 4 Execution on Digital Banking (Transaction numbers trend) Transactions (Millions) Mobile Agency ATM 6.6 Branch Q Q Q Q1 Q Cash related transactions only 22
23 4 Execution on Digital Banking (Equitel customer numbers up 180% growth YoY) KES 000 Linkage to M-Banking SIM uptake 2,000 1,750 1,500 1,250 1, % % % 1,024 87% 1,085 85% 1,166 86% +180% 1,178 87% 1,369 88% 1,500 89% 1,591 89% 1,665 90% 1,760 90% 1,861 90% 2,000 1,750 1,500 1,250 1, Mar Apr May Jun Jul Aug Sep Oct Nov Dec Jan 2016 Feb 2016 Mar
24 4 Execution on Digital Banking (Mobile Customer Transaction Numbers & Value Trend) Cumulative M-Banking Transactions numbers (millions) 220 Cumulative M-Banking Value (KES billions) Mar Apr May Jun Jul Aug Sep Oct Nov Dec Jan 2016 Feb 2016 Mar
25 25 Execution on Digital Banking (Count of loan disbursements through Mobile vs. Branch) ,200 1,600 2,000 2,400 2,800 3,200 3,600 1,608 (77%) Oct 1, (25%) 1,320 (75%) Sep 1, (28%) 1,087 (72%) Aug 1, (30%) 902 (70%) Jul 1, (33%) 718 (67%) Jun (34%) 623 (66%) May (36%) 524 (64%) 493 (23%) Jan 2016 Feb 2016 Dec 2, (22%) 1,922 (78%) Nov 2, (20%) 2,456 (80%) 3, (19%) 2,749 (81%) Apr (37%) 430 (63%) Mar (39%) 353 (61%) 2,744 Mar (21%) 2,176 (79%) 3,057 Branch Mobile Combined In Thousands Cumulative
26 4 Execution on Digital Banking (KES 14.1 billion Disbursed through Mobile Channel) Disbursement Count (number) Loan Value Disbursement (KES "Billion") 353,052 2,749,290 +1,012% Mar Apr May Jun Jul Aug Sep Oct Nov Dec Jan 2016 Feb 2016 Mar 2016 Cumulative figures 26
27 4 Execution on Digital Banking (Loan Outstanding Trend) In Billions +797% Mar Apr May Jun Jul Aug Sep Oct Nov Dec Jan 2016 Feb 2016 Mar

28 4 Execution on Digital Banking (Loan Repayment Trend) 28
29 4 Continuous Growth in Agency Banking Focus on Variable cost model More transactions now processed under 3 rd party infrastructure saving on fixed costs Number of agents increased to 25,388 agents. 31% growth y/y Transactions (Millions) % Agency Agent 10 transactions registered a 8.0 ATM 26.2% growth More transactions now processed under 3rd party infrastructure Q Q Q Q Q1 Branch Q
30 4 Number and Value of Agents Transactions Transactions in million Value in billion kes Mar Jun Sept Dec Mar Jun Sept Dec 2012 Mar Jun 2013 Sept Dec Mar 2014 Jun Sept Dec 2014 Mar Jun Sept Dec Mar
31 4 Number of Merchants Outlets % 7,749 8,063 6,864 6,153 5,166 5,618 4,412 1,034 1,065 1,083 1,194 1,658 1,519 2,018 2,139 2,668 2,346 2,824 3,066 3,499 3,720 Mar 2011 Jun 2011 Sept 2011 Dec 2011 Mar 2012 Jun 2012 Sept 2012 Dec 2012 Mar 2013 Jun 2013 Sept 2013 Dec 2013 Mar 2014 Jun 2014 Sept 2014 Dec 2014 Mar Jun Sept Dec Mar
32 6 Merchants Turnover and Revenue Revenue in million kes Turnover in billion kes Mar 2011 Jun 2011 Sept Dec 2011 Mar 2012 Jun Sept Dec Mar Jun Sept Dec Mar 2014 Jun Sept Dec Mar 2.9 Jun 3.3 Sept Dec Mar

")


33 4 We are building on our momentum in Payment Processing and Merchants We have partnered with key payment companies which has allowed us to grow our number of transactions and commissions Volume (Millions) Commissions (Millions) +43% 11,057 4, % 7, % Equity is leading in Acquiring and Issuing Best in class payment channel services work well with merchants 117 Q Q1 Merchant Transaction Volumes Q % Merchant Commissions 33
34 Presentation Outline 1. Macro-economic overview 2. Governance & leadership structure 3. Regional expansion and diversification 4. Digital bank 5. SME strategy 6. Qualitative analysis 7. Performance of core business (intermediation) 8. Financial performance 34
35 5 SME contribution to the Loan Book and CASA Loan book split by type Deposit base split by type Agriculture Consumer 100.0% 100.0% 2.8% 2.6% 22.7% 19.9% Term Deposits 100.0% 21.1% 100.0% 21.7% Micro 6.6% 5.9% Savings 43.0% 42.7% SME 49.8% 55.1% Large Enterprises 18.0% 16.5% Current Accounts 35.9% 35.6% Q1 Q Q1 Q
36 5 Growing Non-funded Income as a result of cross-selling to SME s Non Funded Income by Type 15.6 Non- Funded 9.0bn 3.3bn (37%) 10.2bn 3.3bn (33%) 11.1bn 4.1bn (37%) 13.2bn 5.6 (42%) 5.2 (33%) Other Income Foreign Exchange 13.3% 20.5% 15.9% 16.2% Funded 5.7 (63%) 6.9bn (67%) 7.0bn (63%) 7.6 (58%) 10.4 (67%) Fees & Commission 66.2% 68.0% Q Q Q Q1 Q Q1 Q Highlights Non Funded Income: Dropped by 7% YoY mainly due drop in to FX income and Commissions on Loans Funded Income: Interest Income grew by 37% YoY due to growth in loan book and improving NIMs 36
37 Presentation Outline 1. Macro-economic overview 2. Governance & leadership structure 3. Regional expansion and diversification 4. Digital bank 5. SME strategy 6. Qualitative analysis 7. Performance of core business (intermediation) 8. Financial performance 37
 (Profits on capital) (Return on assets) Global Rank 916 88 18 8 2014 Global Rank 999 112 8 4 Equity s Global Credit")
38 6 Equity has earned recognition in Equity s International Rankings Overall Soundness Performance Equity Bank (Capital Assets Ratio) (Profits on capital) (Return on assets) Global Rank Global Rank Equity s Global Credit Rating 38
 KCB 1.44 4.68% 25.0% 3.25% EGHL 1.28 4.88% 25.5% 3.81% COOP 1.18 4.10% 25.2% 3.")
39 6 Equity Group s stock excites Globally Reuters: Equity Group Holding yielding a higher return at a lower risk STOCK Beta Yield (%) ROaE Yield per unit of Risk (Yield/Beta) KCB % 25.0% 3.25% EGHL % 25.5% 3.81% COOP % 25.2% 3.47% Financial Times: Equity Group Holding to outperform the market in


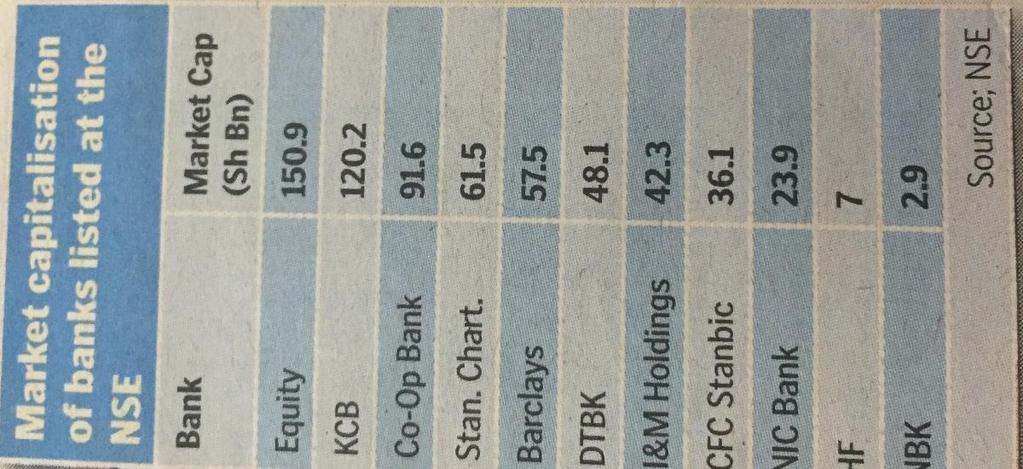
40 6 Equity Bank Most valuable lender listed at the NSE 40
41 6 Equity Bank: Winner Best Bank in Kenya Equity has earned substantial accolades in 2016 Overall Winner Best Bank in Kenya (2016,, 2014 East Africa, 2013, 2012, 2009) Winner Best Bank Tier 1 (2016,, 2014 East Africa, 2013, 2012 ) 41
42 6 Equity Bank: Winner Best Bank in SME Banking Equity has earned substantial accolades in 2016 Best Bank in SME Banking (2016, ) 42
43 6 Equity Bank: Winner Best Bank in Retail Banking Equity has earned substantial accolades in 2016 Best Bank in Retail Banking (2016, ) 43
44 6 Equity Bank: Winner Best Bank in Agency Banking Equity has earned substantial accolades in 2016 Best Bank in Agency Banking (2016, ) 44
45 6 Equity Bank: Winner Best Bank in Micro-Finance Equity has earned substantial accolades in 2016 Best Bank in Micro-Finance (2016,, 2012, 2011, 2010, 2009) 45
46 6 Equity Bank: 1 st Runner Up Best Bank in Customer Satisfaction Equity has earned substantial accolades in 2016 (1 st Runner up 2016, 2 nd Runner up ) 46

47 6 Equity Bank: 2016 Other Awards Equity has earned substantial accolades in
48 6 Equity Bank: 2016 Other Awards Equity has earned substantial accolades in
49 Presentation Outline 1. Macro-economic overview 2. Governance & leadership structure 3. Regional expansion and diversification 4. Digital bank 5. SME strategy 6. Qualitative analysis 7. Performance of core business (intermediation) 8. Financial performance 49
50 7 Funding Base (Significant improvement in funding profile) In KES Billion 15.5% growth in funding with deposits accounting for 70% Other Liabilities Borrowed Funds Shareholders Funds (2%) (7%) 60.9 (16%) 15.5% 46.0 (11%) (16%) 14.7 (3%) Growth per Class 102% 76% 13% Deposits (75%) (70%) 8% Q1 Q
51 7 Deposits by Entity & Type Deposit split by Entity Deposit split by Type 100.0% 100.0% 100.0% 100.0% Rwanda 3.0% 3.3% S. Sudan 9.6% 3.4% 4.0% Term Deposits 21.1% 21.7% Uganda Tanzania DRC 3.6% 4.5% 0.0% 4.1% 6.7% Savings 43.0% 42.7% Kenya 79.3% 78.5% Current Accounts 35.9% 35.6% Q1 Q Q1 Q
52 7 Assets of KSH 430 Billion driven by stable Deposit base In KES billion 15.5% growth in asset base while still maintaining portfolio diversification +15.5% Growth per Asset Class Other Assets Government Securities Cash & Cash Equivalents (9.9%) 48.9 (13.1%) 62.0 (16.6%) 44.5 (10.3%) 62.4 (14.5%) 48.3 (11.2%) 21% 28% -22% Net Loans (60.3%) (63.9%) 22% Q1 Q
53 7 Loan book by Segment and Entity Split across Segments Split across the entities within the Group Agriculture Consumer Micro 100.0% 2.8% 22.7% 6.6% 100.0% 2.6% 19.9% 5.9% S. Sudan Uganda Rwanda DRC Tanzania 100.0% 2.0% 3.1% 3.1% 0.0% 4.9% 100.0% 0.2% 2.5% 3.1% 5.2% 5.6% SME 49.8% 55.1% Kenya 86.9% 83.4% Large Enterprises 18.0% 16.5% Q1 Q Q1 Q
54 5 Increasing Net Interest Margin Percentage Yield on interest Earning Assets Net Interest Margin Q1 15 Q2 15 Q3 15 Q4 15 Q1 16 Cost of funds Q1 15 Q2 15 Q3 15 Q4 15 Q1 16 Q1 15 Q2 15 Q3 15 Q4 15 Q
55 7 Stable NPL Trend over time EBKL Group 3.9% 4.3% 4.1% 4.4% 4.1% 4.5% 3.8% 2.9% 3.3% 3.5% Q1 Q2 Q3 Q4 Q
56 7 Non-Performing Loans: High Coverage Levels (Spec. Prov. + Int. Susp) / Gross NPL (Gen. Prov. + Spec. Prov. + Int. Susp) / Gross NPL 87.0% 86.2% 88.7% 92.8% 84.0% 63.2% 62.5% 65.0% 60.6% 56.0% Q1 Q2 Q3 Q4 Q
57 Presentation Outline 1. Macro-economic overview 2. Governance & leadership structure 3. Regional expansion and diversification 4. Digital bank 5. SME strategy 6. Qualitative analysis 7. Performance of core business (intermediation) 8. Financial performance 57
58 8 Broad base liabilities & funding sources Q1 Q Growth Y/Y Liabilities & Capital (Bn) KSH KSH % Deposits % Borrowed Funds % Other Liabilities % Shareholders Funds % Total Liabilities & Capital % Funding Distribution Shareholders Funds 16% Other Liabilities 2% Borrowed Funds 7% Q1 Shareholders Funds 16% Other Liabilities 3% Borrowed Funds 11% Q % Deposits 70% Deposits 58
59 8 Asset Portfolio & Distribution Q1 Q Growth Y/Y Assets (Bn) KSH KSH % Net Loans % Cash & Cash Equivalents % Government Securities % Other Assets % Total Assets % Asset Distribution Q1 Q Other Assets Other Assets 10% 10% Government Securities 13% Government Securities 15% Cash & Cash Equivalents 17% 60% Net Loans Cash & Cash Equivalents 11% 64% Net Loans 59
60 8 Delivering 20% growth in PAT KES (Billion) Q1 Q Growth Interest Income % Interest Expense (1.9) (2.4) 32% Net Interest Income % Non-Funded Income % Total Income % Loan Loss Provision (0.3) (0.7) 104% Staff Costs (2.5) (3.0) 21% Other Operating Expenses (4.3) (4.7) 8% Total Costs (7.1) (8.4) 17% PBT % Tax (1.8) (2.2) 19% PAT % 60
61 8 Positive Financial Ratios Kenya Kenya Group Group Q1 Q Q1 Q Profitability NIM 10.9% 12.8% 9.9% 11.7% Cost to Income Ratio (with provisions) 50% 46% 54% 53% Cost to Income Ratio (without provision) 48% 43% 51% 49% RoAE 35.9% 37.4% 27.6% 29.1% RoAA 5.2% 5.4% 4.8% 4.8% Asset Quality Cost of Risk 0.46% 0.67% 0.63% 1.03% Liquidity / Leverage Loans / Deposits 86.5% 94.0% 80.8% 91.6% Loans / (Deposits + Borrowed Funds) 77.8% 79.8% 73.8% 79.4% Loans / (Deposits + Borrowing Funds + S/H Funds) 66.1% 67.5% 61.5% 66.2% Liquidity 32.9% 29.4% 39.3% 34.9% Capital Adequacy Ratios Core Capital to Risk Weighted Assets 14.7% 14.8% 16.2% 18.3% Total Capital to Risk Weighted Assets 16.8% 16.1% 18.2% 19.6% Core Capital to Deposits Ratio 18.5% 20.5% 18.8% 24.2% Customer Numbers No. of Customers 8,274,425 8,971,514 9,547,596 10,313,468 61
62 8 Cost to Income Ratio Trend Group Bank 50.9% 47.8% 49.5% 46.5% 48.7% 45.4% 51.2% 47.8% 48.9% 43.3% Q Q Q Q1 Q Total Operating Income up 18% y/y mainly attributed to improved NIM Operating expenses up 17% y/y 62
63 8 RoAA and RoAE overtime RoAE EBKL Group 35.9% 27.6% 35.0% 26.6% 33.0% 25.3% 33.9% 25.5% 37.4% 29.1% Q1 15 Q2 15 Q3 15 Q4 15 Q1 16 RoAA 5.2% 4.8% 5.1% 4.6% 5.0% 4.3% 5.2% 4.5% 5.4% 4.8% EBKL Group Q1 15 Q2 15 Q3 15 Q4 15 Q
64 THANK YOU Dr James Mwangi, CBS Group Managing Director & CEO Web site: 64
Investor Briefing & H Performance Presentation Outline
 Investor Briefing & Performance August Presentation Outline 1. Macro-economic overview 2. Governance & leadership structure 3. Regional expansion and diversification 4. Innovation & digital banking 5.
Investor Briefing & FY 2016 Performance. March 2017
 Investor Briefing & FY Performance March 2017 Turbulent operating environment 2 Public confidence dented by failure of 3 commercial banks Significant variance in interbank rates reflect risk aversion in
Investor Briefing & 2014 Performance. March 2015
 Investor Briefing & 2014 Performance March 2015 1 ST REGIONAL LISTED INVESTMENT GROUP HOLDING COMPANY Shareholders Subsidiary Boards Group Board Subsidiary Boards Group Internal Auditor CEO CEO s office
Investor Briefing Q Performance. Date:17 th May, 2018
 Investor Briefing 2018 Performance Date:17 th May, 2018 1 Equity Group Holdings Plc Headquarters Equity Centre, Upperhill, Nairobi 2 Equity Group s Philosophies Our Purpose We exist to transform the lives
KCB INVESTOR PRESENTATION Q317 GROUP FINANCIAL RESULTS NOVEMBER 2017 JOSHUA OIGARA GROUP CEO & MD LAWRENCE KIMATHI GROUP CFO
 KCB INVESTOR PRESENTATION Q317 GROUP FINANCIAL RESULTS NOVEMBER 2017 JOSHUA OIGARA GROUP CEO & MD LAWRENCE KIMATHI GROUP CFO Macro-Economic Highlights: Kenya GDP Anchored by Non-Agriculture GDP Growth
Investor Briefing Q Performance. 5 th November, 2018
 Investor Briefing 2018 Performance 5 th November, 2018 1 INVESTOR BRIEFING2-01.jpg 2 Equity Group s Philosophies INVESTOR BRIEFING2-02.jpg 3 Governance & Organizational Structure Each subsidiary with own
KCB INVESTOR AND MEDIA PRESENTATION 2012 FULL YEAR GROUP AUDITED FINANCIAL RESULTS
 KCB INVESTOR AND MEDIA PRESENTATION 2012 FULL YEAR GROUP AUDITED FINANCIAL RESULTS 1 Outline 1. East Africa Macroeconomic View 2. The Bank at a Glance 3. 2012 full year KCB group Financial Results 4. Future
NIC Bank Group Analyst Breakfast 24 August 2015
 NIC Bank Group Analyst Breakfast 24 August 2015 John Gachora Group Managing Director David Abwoga Director, Finance and Strategy Page 1 Agenda Who we are Macro-Economic Overview Our Strategy Financial
Investor Briefing & Q Performance
 Investor Briefing & Q1 2017 Performance 1 Equity Group Holdings Limited Headquarters Equity Centre, Upperhill, Nairobi Equity Bank s repositioning to avoid the economic turbulence and to exploit the silver
WHAT DRIVES US. Customer perspective Market share Shared Value Brand position STRATEGY: TRANSFORMATIVE PARTNERSHIPS
 FY 2018 RESULTS OUR STRATEGY WHO WE ARE Our Purpose Simplifying your world to enable your progress Our Promise Go Ahead Our Values Inspiring Simple Friendly WHAT DRIVES US Customer perspective Market share
KCB GROUP PLC INVESTOR PRESENTATION. H FINANCIAL RESULTS
 KCB GROUP PLC INVESTOR PRESENTATION. H1 2018 FINANCIAL RESULTS MACRO-ECONOMIC HIGHLIGHTS Macro-Economic Highlights Kenya GDP Growth Rate (%) 5.7% 5.3% 4.7% 4.7% 6.2% Kenya 5.2% 1.0% Q2 2017 Q3 2017 Q4
Investor Briefing H Performance
 Investor Briefing 2018 Performance INVESTOR BRIEFING2-01.jpg Equity Bank s repositioning to avoid the economic turbulence and to exploit the silver lining opportunities 3 Governance and Organizational
KCB GROUP PLC INVESTOR PRESENTATION. FY17 FINANCIAL RESULTS
 KCB GROUP PLC INVESTOR PRESENTATION. FY17 FINANCIAL RESULTS JOSHUA OIGARA GROUP CEO & MD LAWRENCE KIMATHI GROUP CFO KCB Group at a glance 6,483 staff 15.7M Customers 153,431 shareholders Market Capitalization
KCB INVESTOR PRESENTATION FY2016 GROUP FINANCIAL RESULTS 9 MARCH 2017 JOSHUA OIGARA GROUP CEO & MD LAWRENCE KIMATHI GROUP CFO
 KCB INVESTOR PRESENTATION FY2016 GROUP FINANCIAL RESULTS 9 MARCH 2017 JOSHUA OIGARA GROUP CEO & MD LAWRENCE KIMATHI GROUP CFO Macro-Economic Highlights: Kenya 6.1 4.6 GDP Growth rate (%) 5.7 5.6 5.3 6.0
Investor Briefing Q Financial Results
 Investor Briefing Q3 2013 Financial Results Update on Macroeconomic Environment 2 2 Key Macroeconomic Updates 1 2 3 4 Boosted economic growth prospects in Kenya projected at 6.0% according to World Bank
THE CBK WEEKLY BULLETIN
 December 30, 20 THE CBK WEEKLY BULLETIN Highlights for the Week Overall 12-month inflation eased from 19.7 percent in November 20 to 18.9 percent in December 20, while annual average inflation rose from
Investor Briefing & Q Performance. 30 th October, 2017
 Investor Briefing & Q3 2017 Performance 30 th October, 2017 1 Equity Group Holdings Plc Headquarters Equity Centre, Upperhill, Nairobi Equity Group s Philosophies Our Purpose We exist to transform the
January 27, 2012 THE CBK WEEKLY BULLETIN
 January 27, 2012 Highlights for the Week THE CBK WEEKLY BULLETIN The money market liquidity was tight during the week ending January 25, 2012. The Central Bank mopped Ksh 0.6 billion in the repo market
Weekly Statistical Bulletin
 1 / Central Bank of Kenya Statistical Bulletin Weekly Statistical Bulletin Key Monetary and Financial Indicators January April 6, 2018 22, 2018 Highlights Inflation declined further to 4.2 percent in March
Weekly Statistical Bulletin
 1 / Central Bank of Kenya Statistical Bulletin Weekly Statistical Bulletin Key Monetary and Financial Indicators January July 6, 2018 22, 2018 Real GDP Growth Economic growth accelerated to 5.7 percent
Weekly Statistical Bulletin
 1 / Central Bank of Kenya Statistical Bulletin Weekly Statistical Bulletin Key Monetary and Financial Indicators January 22, 2018 September 28, 2018 Inflation Overall inflation rose to 5.7 percent in September
MPC MARKET PERCEPTIONS SURVEY - SEPTEMBER
 MPC MARKET PERCEPTIONS SURVEY - SEPTEMBER 2018 1 CONTENTS BACKGROUND TO THE MARKET PERCEPTIONS SURVEYS...3 INTRODUCTION......4 SURVEY METHODOLOGY......4 HIGHLIGHTS OF THE SURVEY.......4 CURRENT ECONOMIC
Presentation to Chief Executive Officers of Commercial and Microfinance Banks Dr. Patrick Njoroge Governor, Central Bank of Kenya
 Presentation to Chief Executive Officers of Commercial and Microfinance Banks Dr. Patrick Njoroge Governor, Central Bank of Kenya August 6, 2015 Outline 1. The Information basis for the MPC meeting 2.
MONTHLY ECONOMIC INDICATORS
 MONTHLY ECONOMIC INDICATORS April 1 Monthly Economic Bulletin April Table of Contents 1. INFLATION...3 2. MONEY, CREDIT AND INTEREST RATES...7 3. REAL SECTOR INDICATORS...10 4. BALANCE OF PAYMENTS AND
To be a World Class Modern Central Bank
 1 Monthly Economic Bulletin Table of Contents 1. INFLATION... 2 2. MONEY, CREDIT AND INTEREST RATES... 6 3. REAL SECTOR INDICATOR... 9 4. BALANCE OF PAYMENTS AND EXTERNAL SECTOR INDICATORS... 10 5. DEVELOPMENTS
Nairobi Securities Exchange. 6th June 2015
 Nairobi Securities Exchange Kenya Diaspora Trade and Investment Conference Investment in Securities For The Kenyan Diaspora Geoffrey Odundo Chief Executive 6th June 2015 CONTENTS 1. About the NSE 2. Kenyan
BANK OF UGANDA STATE OF THE UGANDAN ECONOMY DURING 2008/09. Research Function
 BANK OF UGANDA STATE OF THE UGANDAN ECONOMY DURING 2008/09 Research Function Prepared for the meeting of the Board of Directors of the Bank of Uganda 0 Introduction This brief report reviews developments
CBK WEEKLY BULLETIN. The average interbank rate increased to 6.84 percent during the week ending June 12, 2013 from 6.77 percent in the previous week.
 JUNE 14, 2013 Highlights The money market was relatively liquid during the week ending June 12, 2013. The Central Bank liquidity management through open market operations resulted in a net mop up of Ksh
CO-OPERATIVE BANK OF KENYA LTD Q INVESTORS BRIEFING
 CO-OPERATIVE BANK OF KENYA LTD Q3 2015 INVESTORS BRIEFING 1 Macroeconomic Environment 2 Favorable Macro-economic Environment in 2015 Gross Domestic Product (GDP) Kenya s economy remains relatively resilient;
KEY MONETARY AND FINANCIAL INDICATORS
 January 04, 2019 KEY MONETARY AND FINANCIAL INDICATORS Inflation Overall inflation increased marginally to 5.7 percent in December 2018 from 5.6 percent in November, but remained within target, mainly
CBK Weekly Statistical Bulletin of Key Monetary and Financial Indicators
 JANUARY 22, 2016 Highlights The money market was relatively liquid during the week ending January 20, 2016 supported by government payments, redemption of government securities and OMO maturities. The
TRENDS, DYNAMICS, AND CHALLENGES OF CAPITAL FLOWS TO FRONTIER MARKETS
 HIGH-LEVEL CONFERENCE ON MANAGING CAPITAL FLOWS: LESSONS FROM EMERGING MARKETS FOR FRONTIER ECONOMIES MARCH 2, 2015, MAURITIUS TRENDS, DYNAMICS, AND CHALLENGES OF CAPITAL FLOWS TO FRONTIER MARKETS By Henry
MPC MARKET PERCEPTIONS SURVEY - MARCH
 MPC MARKET PERCEPTIONS SURVEY - MARCH 2018 1 CONTENTS BACKGROUND......4 SURVEY METHODOLOGY......4 HIGHLIGHTS OF THE SURVEY.........4 INFLATION EXPECTATIONS....5 EXCHANGE RATE EXPECTATIONS...6 PRIVATE SECTOR
Kenya s IMF Standby Facility, & Cytonn Weekly #31/2018
 Kenya s IMF, & Cytonn Weekly #31/2018 Focus of the Week The International Monetary Fund (IMF) recently concluded their visit to Kenya where they were holding discussions with the Kenyan Government on the
Weekly Statistical Bulletin
 1 / Central Bank of Kenya Statistical Bulletin Weekly Statistical Bulletin Key Monetary and Financial Indicators January May 25, 2018 22, 2018 Interbank Market Activity in the interbank market was subdued
PERFORMANCE OF ECONOMY REPORT December 2017
 PERFORMANCE OF ECONOMY REPORT December 2017 MACROECONOMIC POLICY DEPARTMENT MINISTRY OF FINANCE PLANNING AND ECONOMIC DEVELOPMENT www.finance.go.ug TABLE OF CONTENTS LIST OF ACRONYMS... 3 HIGHLIGHTS...
CBK Weekly Statistical Bulletin of Key Monetary and Financial Indicators
 MARCH 17, 2017 Highlights The money market was relatively liquid during the week ending March 15, 2017, largely supported by net redemption of government securities. The average interbank rate declined
QUARTERLY ECONOMIC REVIEW (QER)
") QUARTERLY ECONOMIC REVIEW (QER) Volume 2 No 4 January - March 2018 OBJECTIVES OF THE CENTRAL BANK OF KENYA The principal objectives of the Central Bank of Kenya (CBK) as established in the CBK Act are:
QUARTERLY ECONOMIC REVIEW (QER) Volume 2 No 4 January - March 2018 OBJECTIVES OF THE CENTRAL BANK OF KENYA The principal objectives of the Central Bank of Kenya (CBK) as established in the CBK Act are:
To be a World Class Modern Central Bank
 1 Monthly Economic Bulletin June 2018 Table of Contents SYMBOLS... 3 DEFINITIONS... 4 1. INFLATION... 6 2. MONEY, CREDIT AND INTEREST RATES... 10 3. REAL SECTOR INDICATORS... 13 4. BALANCE OF PAYMENTS
September 1, Inflation
 1 / CBK Statistical Bulletin Central Bank of Kenya September 1, 2017 Overall inflation increased to 8.0 percent in August 2017 from 7.5 percent in July 2017, largely on account of increases in prices of
PBT growth slightly ahead of FY guidance. 9th November 2015 EQUITY RESEARCH THE COOPERATIVE BANK 3Q15 RESULTS REVIEW
 PBT growth slightly ahead of FY guidance COOP s PBT increased by 33% y/y to KES 12.2bn, slightly ahead of management s full year guidance of 30%. The beat can be ascribed to a lower base as 9M14 s PBT
February 3, Inflation. The Interbank Market
 1 / CBK Statistical Bulletin Central Bank of Kenya February 3, 2018 Inflation Overall inflation increased marginally in January 2018, largely driven by increases in energy prices. It increased to 4.8 percent
MONTHLY ECONOMIC INDICATORS
 MONTHLY ECONOMIC INDICATORS JULY Table of Contents 1. INFLATION... 2 2. MONEY, CREDIT AND INTEREST RATES... 6 3. REAL SECTOR INDICATORS... 9 4. BALANCE OF PAYMENT AND EXTERNAL SECTOR INDICATORS... 10 5.
MONTHLY ECONOMIC INDICATORS
 MONTHLY ECONOMIC INDICATORS May 2018 1 Monthly Economic Bulletin May 2018 Table of Contents SYMBOLS... 3 DEFINITIONS... 4 1. INFLATION... 6 2. MONEY, CREDIT AND INTEREST RATES... 10 3. REAL SECTOR INDICATORS...
MONTHLY ECONOMIC INDICATORS
 To be a World Class Modern Central Bank MONTHLY ECONOMIC INDICATORS August 2018 1 Monthly Economic Bulletin August 2018 Table of Contents SYMBOLS... 3 DEFINITIONS... 4 1. INFLATION... 6 2. MONEY, CREDIT
MONTHLY ECONOMIC INDICATORS
 MONTHLY ECONOMIC INDICATORS SEPTEMBER 0 Table of Contents 1. INFLATION... 2 2. MONEY, CREDIT AND INTEREST RATES... 6 3. REAL SECTOR INDICATORS... 9 4. BALANCE OF PAYMENTS AND EXTERNAL SECTOR INDICATORS...
KEY MONETARY AND FINANCIAL INDICATORS
 February 15, 2019 KEY MONETARY AND FINANCIAL INDICATORS Exchange Rate The Kenya Shilling remained stable against major international and regional currencies during the week ending February 14. It exchanged
PERFORMANCE OF THE ECONOMY REPORT NOVEMBER 2017
 PERFORMANCE OF THE ECONOMY REPORT NOVEMBER 2017 MACROECONOMIC POLICY DEPARTMENT MINISTRY OF FINANCE, PLANNING AND ECONOMIC DEVELOPMENT www.finance.go.ug Table of Contents SUMMARY... 2 REAL SECTOR DEVELOPMENTS...
Financial results presentation Full year 2013
 Financial results presentation Full year 2013 1 Contents Presentation of Speakers 2013 Operating Environment & Banking Industry CAL Bank Performance Highlights Income Statement Balance Sheet Share Price
MFW4A: The impact of the global financial crisis on funding needs and borrowing strategies in Africa
 MFW4A: The impact of the global financial crisis on funding needs and borrowing strategies in Africa Stefan Nalletamby, Coordinator This presentation covers four sections 1. Impact of the financial crisis
MACROECONOMIC POLICY DEPARTMENT MINISTRY OF FINANCE, PLANNING AND ECONOMIC DEVELOPMENT
 PERFORMANCE OF THE ECONOMY REPORT OCTOBER 2018 MACROECONOMIC POLICY DEPARTMENT MINISTRY OF FINANCE, PLANNING AND ECONOMIC DEVELOPMENT www.finance.go.ug TABLE OF CONTENTS LIST OF TABLES... ii LIST OF FIGURES...
Weekly Statistical Bulletin
 1 / Central Bank of Kenya Statistical Bulletin Weekly Statistical Bulletin Key Monetary and Financial Indicators January May 11, 2018 22, 2018 Interbank Market Activity in the interbank market increased
Investor Briefing & Q Results. April 2014
 Investor Briefing & Q1 2014 Results April 2014 Introduction to Equity Bank- Investment Case 2 Clear Strategy to Become One of Africa's Most Respected Banks Building Strategy Equity Bank was founded as
QUARTERLY ECONOMIC REVIEW (QER)
") QUARTERLY ECONOMIC REVIEW (QER) Volume 2 No 5 April - June 2018 OBJECTIVES OF THE CENTRAL BANK OF KENYA The principal objectives of the Central Bank of Kenya (CBK) as established in the CBK Act are: 1)
QUARTERLY ECONOMIC REVIEW (QER) Volume 2 No 5 April - June 2018 OBJECTIVES OF THE CENTRAL BANK OF KENYA The principal objectives of the Central Bank of Kenya (CBK) as established in the CBK Act are: 1)
March 5, 2010 THE CBK WEEKLY BULLETIN. Highlights for the Week
 March 5, 2010 THE CBK WEEKLY BULLETIN Highlights for the Week The 12-month overall inflation rate was 5.2 percent, while the annual average rate, on the other hand stood at 9.3 percent in February 2010.
Monetary Policy Statement
 CENTRAL BANK OF KENYA Monetary Policy Statement Issued under the Central Bank of Kenya Act, Cap 491 Real GDP 450000 425000 400000 375000 350000 325000 300000 275000 250000 225000 200000 REAL GDP (2001
CBK Weekly Statistical Bulletin of Key Monetary and Financial Indicators
 JANUARY 13, 2017 Highlights The money market was relatively tight during the week ending January 11, 2017. The average interbank rate was stable at 7.54 percent in the week ending January 11, 2017 compared
Financial Year End Results Presentation to Investors and Analysts
 Financial Year End 2011 Results Presentation to Investors and Analysts March 2012 Disclaimer The information presented herein is based on sources which Access Bank Plc (the Bank ) regards dependable. This
Monetary Policy Statement
 CENTRAL BANK OF KENYA Monetary Policy Statement Issued under the Central Bank of Kenya Act, Cap 491 Real GDP 1600 1400 1200 1000 800 600 400 200 0 REAL GDP 2001 PRICES KSHS BILLION FOREIGN EXCHANGE RESERVES
QUARTERY ECONOMIC REVIEW (QER)
") QUARTERY ECONOMIC REVIEW (QER) Volume 2 No 3 July September 2017 OBJECTIVES OF THE CENTRAL BANK OF KENYA The principal objectives of the Central Bank of Kenya (CBK) as established in the CBK Act are: 1)
QUARTERY ECONOMIC REVIEW (QER) Volume 2 No 3 July September 2017 OBJECTIVES OF THE CENTRAL BANK OF KENYA The principal objectives of the Central Bank of Kenya (CBK) as established in the CBK Act are: 1)
MPC MARKET PERCEPTIONS SURVEY - JULY
 MPC MARKET PERCEPTIONS SURVEY - JULY 2018 1 CONTENTS BACKGROUND......4 SURVEY METHODOLOGY......4 HIGHLIGHTS OF THE SURVEY.........4 INFLATION EXPECTATIONS....5 EXCHANGE RATE EXPECTATIONS...6 PRIVATE SECTOR
Full Year Investors/Analysts Presentation
 2017 Full Year Investors/Analysts Presentation Outline Macro-economic Review Overview of FY 2017 FY 2017 Performance Review Business Segments and Subsidiary Review Guidance and Plans for 2018 2017 Macro-economic
Sterling Bank PLC H Investor/Creditor Presentation. July 2011
 Sterling Bank PLC H1 2011 Investor/Creditor Presentation July 2011 Important Information Investor Relations This presentation has been prepared by Sterling Bank PLC. It is intended for an audience of professional
Zambia s Economic Outlook
 Zambia s Economic Outlook F R A N C I S C H I P I M O D I R E C T O R E C O N O M I C S B A N K O F Z A M B I A Z A M B I A I N V E S T M E N T C O N F E R E N C E N O V E M B E R 4, 2 0 1 5 L O N D O
ACCESS BANK PLC. Q1 15 Results Presentation to Investors & Analysts. April 2015
 ACCESS BANK PLC Q1 15 Results Presentation to Investors & Analysts April 2015 Disclaimer The information presented herein is based on sources which Access Bank Plc (the Bank ) regards dependable. This
Monetary Policy Statement
 CENTRAL BANK OF KENYA Monetary Policy Statement Issued pursuant to section 4B of the Central Bank of Kenya Act, Cap 491 REAL GDP (2009 PRICES) KSHS MILLION USABLE FOREIGN EXCHANGE RESERVES (USD MILLION)
CBK WEEKLY BULLETIN AUGUST 23, Highlights
 AUGUST 23, 2013 Highlights The money market was relatively liquid during the week ending August 21, 2013. However, the distribution of liquidity was skewed among a few banks. The Central Bank stayed out
Monetary Policy Statement
 CENTRAL BANK OF KENYA Monetary Policy Statement Issued under the Central Bank of Kenya Act, Cap 491 REAL GDP (2001 PRICES) KSHS MILLION FOREIGN EXCHANGE RESERVES (USD MILLION) 450,000 6,000 Real GDP 425,000
Earnings Presentation
 Earnings Presentation BRSA Bank-Only 1Q 2017 May 10, 2017 VakıfBank IR App. Available at Jan-16 Feb-16 Mar-16 Apr-16 May-16 Jun-16 Jul-16 Aug-16 Sep-16 Oct-16 Nov-16 Dec-16 Jan-17 Feb-17 Mar-17 Apr-17
Statistical Release Gross Domestic Product Third Quarter 2012
 Statistical Release Gross Domestic Product Third Quarter 01 1.0 Economic performance Kenya s economy exped by.7 per cent in the third quarter of 01 compared.0 per cent growth recorded in the same quarter
Turkey: Recent Developments and Future Prospects. ISBANK Economic Research Division October 2018
 Turkey: Recent Developments and Future Prospects ISBANK Economic Research Division October 2018 Macroeconomic Outlook Strong Economic Growth Cycle GDP of 851 bn USD (2017), 10.6k USD (2017) per capita
Summary of contents. Operating environment. Levers of institutional growth. Re-affirming the Fund s Mission. Financial Highlights.
 Summary of contents Operating environment Levers of institutional growth Re-affirming the Fund s Mission Financial Highlights The future The Operating Environment 7.00% 6.00% 5.00% 4.00% 3.00% A calm assurance
Central Bank of Kenya. Eighteenth Bi-Annual Report of the Monetary Policy Committee. Issued under the Central Bank of Kenya Act, Cap 491.
 Central Bank of Kenya Eighteenth Bi-Annual Report of the Monetary Policy Committee Issued under the Central Bank of Kenya Act, Cap 491 April 2017 1 The Bi-Annual Report is prepared by the Members of the
MONETARY POLICY COMMITTEE STATEMENT FOR FIRST QUARTER Governor s Presentation to the Media. 16 th May, 2018
 1 MONETARY POLICY COMMITTEE STATEMENT FOR FIRST QUARTER 2018 Governor s Presentation to the Media 16 th May, 2018 INTRODUCTION 2 The presentation is structured as follows: 1. Decision of the Monetary Policy
Abu Dhabi Commercial Bank PJSC Q1 15 Investor presentation
 Abu Dhabi Commercial Bank PJSC Q1 15 Investor presentation THIS PRESENTATION IS NOT AN OFFER OR SOLICITATION OF AN OFFER TO BUY OR SELL SECURITIES. IT IS SOLELY FOR USE AS AN INVESTOR PRESENTATION AND
Monetary Policy Statement
 CENTRAL BANK OF KENYA Monetary Policy Statement Issued under the Central Bank of Kenya Act, Cap 491 Real GDP 450,000 425,000 400,000 375,000 350,000 325,000 300,000 275,000 250,000 225,000 200,000 REAL
Performance and Outlook
 Performance and Outlook November 2017 NSE: AXISBANK BSE: 532215 LSE (GDR): AXB 1 Safe Harbor Except for the historical information contained herein, statements in this release which contain words or phrases
Monthly Report PERFORMANCE OF THE ECONOMY JUNE 2018 MACROECONOMIC POLICY DEPARTMENT MINISTRY OF FINANCE, PLANNING AND ECONOMIC DEVELOPMENT
 Monthly Report PERFORMANCE OF THE ECONOMY JUNE 2018 MACROECONOMIC POLICY DEPARTMENT MINISTRY OF FINANCE, PLANNING AND ECONOMIC DEVELOPMENT www.finance.go.ug Table of Contents SUMMARY... 1 REAL SECTOR DEVELOPMENTS...
China Economic Outlook 2013
 China Economic Outlook 2 Key Developments in Brief - Mild recovery of GDP growth: +8 8.5% - Construction and consumption as main drivers - Inflationary pressure to increase: +3% - Tight labor market and
Banco do Brasil. 2Q10 Conference Call
 Banco do Brasil 2Q10 Conference Call 1 Disclaimer This presentation may include references and statements, planned synergies, increasing estimates, projections of results and future strategy for Banco
Sterling Bank Plc. Analyst/Investor Presentation FY 2014 & Q1 2015
 Sterling Bank Plc Analyst/Investor Presentation FY 2014 & Q1 2015 1 Important Information Notice This presentation has been prepared by Sterling Bank PLC. It is intended for an audience of professional
Macroeconomic and Financial Development: Mongolia
 Macroeconomic and Financial Development: Mongolia WORKSHOPS ON SUPPORTING ASIA PACIFIC LLDCs AND BHUTAN IN MOBILIZING RESOURCES FOR THE SDGs 14 December 201 Current state of macroeconomic and financial
Investors Call Presentation
 Investors Call Presentation Q3 2014 Results 11 NOVEMBER 2014 Forward looking statements This presentation contains or incorporates by reference forward-looking statements regarding the belief or current
Weekly Statistical Bulletin Key Monetary and Financial Indicators
 1 / CBK Statistical Bulletin Weekly Statistical Bulletin Key Monetary and Financial Indicators Central Bank of Kenya July 14, 2017 The money market was fairy tight during the week ending July 12, 2017,
PRESENTATION BY PROF. E. TUMUSIIME-MUTEBILE, GOVERNOR, BANK OF UGANDA, TO THE NRM RETREAT, KYANKWANZI, JANUARY
 BANK OF UGANDA PRESENTATION BY PROF. E. TUMUSIIME-MUTEBILE, GOVERNOR, BANK OF UGANDA, TO THE NRM RETREAT, KYANKWANZI, JANUARY 19, 2012 MACROECONOMIC MANAGEMENT IN TURBULENT TIMES Introduction I want to
KENYA MACROECONOMIC UPDATE: JULY 2016
 KENYA MACROECONOMIC UPDATE: JULY 2016 18 th July 2016 OUTLOOK: POSITIVE GROWTH EXPECTATIONS DESPITE VOLATILE EXOGENOUS SHOCKS Building on our previous report, Kenya Macroeconomic Outlook: 2016, we maintain
Abu Dhabi Commercial Bank PJSC ( ADCB or the Bank ) today reported its financial results for the year ended 31 December 2017.
 today reported its financial results for the year ended 31 December 2017.") Abu Dhabi Commercial Bank Sheikh Zayed Bin Sultan Street P. O. Box: 939, Abu Dhabi http://www.adcb.com ABU DHABI COMMERCIAL BANK PJSC REPORTS FULL YEAR NET PROFIT OF 4.278 BILLION, UP 3% YEAR ON YEAR FOURTH
Abu Dhabi Commercial Bank Sheikh Zayed Bin Sultan Street P. O. Box: 939, Abu Dhabi http://www.adcb.com ABU DHABI COMMERCIAL BANK PJSC REPORTS FULL YEAR NET PROFIT OF 4.278 BILLION, UP 3% YEAR ON YEAR FOURTH
Consolidated financial results for 2Q 2017
 Citi Handlowy Strategy and Investor Relations Department Consolidated financial results for 2Q 2017 August 22 nd, 2017 2Q 2017 summary Consistent growth of customer business: Loan volume growth in institutional
NIC Group Investor Briefing. David Abwoga Finance and Strategy Director Performance Milestones. John Gachora Group Managing Director
 NIC Group 2017 Performance Milestones John Gachora Group Managing Director 2017 Investor Briefing John Gachora Group Managing Director David Abwoga Finance and Strategy Director Who we are Macro-Economic
Kenya s Banking Sector: Is consolidation in the offing after the new regulations?
 Kenya s Banking Sector: Is consolidation in the offing after the new regulations? Presentation by George Bodo Head of Banking Research, Ecobank Capital. October 10th, 2016. Villa Rosa Kempinsky, Nairobi
Central Bank of Kenya. Nineteenth Bi-Annual Report of the Monetary Policy Committee. Issued under the Central Bank of Kenya Act, Cap 491.
 Central Bank of Kenya Nineteenth Bi-Annual Report of the Monetary Policy Committee Issued under the Central Bank of Kenya Act, Cap 491 October 2017 1 The Bi-Annual Report is prepared by the Members of
3Q15 Earnings Presentation
 Earnings Presentation 2 Agenda 1 Highlights...... 3 2 Consolidated Results....... 4 3 4 Famsa Mexico..... 6 Banco Famsa..... 7 5 Famsa USA...... 10 6 Financial Position Items...... 11 3 1. Highlights YTD
INVESTORS CALL PRESENTATION NINE MONTHS 2018 RESULTS POSITIONED FOR GROWTH AND IMPROVED PROFITABILITY
 INVESTORS CALL PRESENTATION NINE MONTHS 2018 RESULTS POSITIONED FOR GROWTH AND IMPROVED PROFITABILITY This presentation contains or incorporates by reference forward-looking statements regarding the belief
Investor Briefing 30 September 2012
 Investor Briefing 30 September 2012 1 Equity Bank at a Glance 2 Equity Story and Key Investment Highlights Technology Customer Base Risk Management Brand Innovation 3 The DNA of our Strategy 1 Pillar I:
Monthly Report PERFORMANCE OF THE ECONOMY SEPTEMBER 2017 MACROECONOMIC POLICY DEPARTMENT MINISTRY OF FINANCE, PLANNING AND ECONOMIC DEVELOPMENT
 Monthly Report PERFORMANCE OF THE ECONOMY SEPTEMBER 2017 MACROECONOMIC POLICY DEPARTMENT MINISTRY OF FINANCE, PLANNING AND ECONOMIC DEVELOPMENT www.finance.go.ug Table of Contents SUMMARY... 1 REAL SECTOR...
Monetary Policy: A Key Driver for Long Term Macroeconomic Stability
 Monetary Policy: A Key Driver for Long Term Macroeconomic Stability Julio Velarde Governor Central Bank of Peru March 2016 Agenda 1. Peru s growth is based on strong fundamentals 2. Recent economic developments
QUARTERLY ECONOMIC REVIEW (QER)
") QUARTERLY ECONOMIC REVIEW (QER) Volume 3 No 3 July - September 2018 OBJECTIVES OF THE CENTRAL BANK OF KENYA The principal objectives of the Central Bank of Kenya (CBK) as established in the CBK Act are:
QUARTERLY ECONOMIC REVIEW (QER) Volume 3 No 3 July - September 2018 OBJECTIVES OF THE CENTRAL BANK OF KENYA The principal objectives of the Central Bank of Kenya (CBK) as established in the CBK Act are:
26 th April 2017 PORTUGAL. January March 2017
 26 th April 2017 PORTUGAL January March 2017 Disclaimer Banco Santander, S.A. ("Santander") cautions that this presentation contains forward-looking statements within the meaning of the US Private Securities
BRI Pursuing a Sustainable and Quality Growth
 PT Bank Rakyat Indonesia (Persero) Tbk. BRI Pursuing a Sustainable and Quality Growth Expanding Micro and Recovering Small and Medium Businesses Financial Updates Q3-2011 Jakarta, 28 October 2011 Agenda
BANCA TRANSILVANIA 2016 Preliminary Financial Results. February 2017
 1 BANCA TRANSILVANIA 2016 Preliminary Financial Results February 2017 DISCLAIMER 2 The information contained in the present document has not been independently verified and no representation or warranty