Project Partners National Treasury of the Republic of South Africa (RSA) and Health Systems Trust (HST) Candy Day HST Emmanuelle Daviaud - SAMRC
|
|
|
- Conrad Gregory
- 5 years ago
- Views:
Transcription
 and Health")

1 Report (February 2014) For PROJECT Development and application of benchmarks for budgeting of nonnegotiable goods and services for South Africa s Provincial Departments of Health Project Partners National Treasury of the Republic of South Africa (RSA) and Health Systems Trust (HST) Candy Day HST Emmanuelle Daviaud SAMRC Report prepared for: National Treasury of the Republic of South Africa Report prepared by: Health Systems Trust 34 Essex Terrace, Westville 3630 Contact details: Tel.: +27 (0) Fax: +27 (0)
2 TABLE OF CONTENTS Summary... 4 Methodology... 4 Results... 6 Conclusion... 8 Background... 9 Setup of the project... 9 Methodology... 9 Results and benchmarks Childhood vaccines HIV test kits HIV: female and male condoms ARV medicines and laboratory tests Blood Laboratory services Medical Medicines Benchmarks summary and comparison with bestperforming hospitals Suggested Budgets per province per NN Comparison of suggested budgets (1&2) with 2013/14 budgets Conclusion Annexure: Additional Tables
3 TABLE OF TABLES Table 1. Childhood vaccines protocols and cost Table 2. ARV medicine and laboratory costs per patient year benchmark Table 3. Benchmarks summary Table 4. Suggested Budgets calculation per type of NN Table 5. Suggested Budgets by NN all levels of care Table 6. Suggested Budgets per capita Table 7. Comparison of Budget and Suggested Budgets Table 8. Vaccines expenditure and expenditure per population under 1 year Table 9. HIV testing kits expenditure and benchmarks Table 10. Condoms expenditure and benchmarks Table 11. ARV medicines expenditure per patient year Table 12. ARVrelated laboratory expenditure per patient year Table 13. Blood in acute hospitals expenditure and benchmark per PDE Table 14. Laboratory services in acute hospitals expenditure and benchmark per PDE Table 15. Medical in acute hospitals expenditure and benchmark per PDE Table 16. Medicines in acute hospitals expenditure and benchmark per PDE Table 17. Benchmarks: comparison with bestperforming hospitals Table 18. Blood : Suggested Budgets by province by level of care Table 19. Laboratory services: Suggested Budgets by province by level of care Table 20. Medical : Suggested Budgets by province by level of care Table 21. Medicines: Suggested Budgets by province by level of care Table 22. Difference between Suggested Budgets and Budget TABLE OF FIGURES Figure 1. on vaccines per child by province Figure 2. per capita total population on HIV testing kits by province Figure 3. per 15+ on condoms by province, 2012/13 only Figure 4. ARV medicines and laboratory expenditure per patient year by province, 2012/ Figure 5. Blood expenditure per PDE acute hospitals by province Figure 6. Laboratory services expenditure per PHC headcount by province Figure 7. Laboratory services expenditure per PDE acute hospitals by province Figure 8. Medical expenditure per PHC headcount by province Figure 9. Medical expenditure per PDE acute hospitals by province Figure 10. Medicines expenditure per PHC headcount Figure 11. Medicines expenditure per PDE acute hospitals by province
4 Summary This project aims to benchmark budgeting for nonnegotiable goods and services, and is part of a range of projects funded by the Belgian Technical Cooperation Agency (BTC) to support National Treasury in costing and budgeting for National Health Insurance (NHI). The focus on nonnegotiable (NN) goods and services is led by the recognition that the share of total expenditure on goods and services is decreasing: over the past three years, Compensation of Employees increased by 12% whilst spending on goods and services increased by 4%. The Minister of Health seeks to ensure that funds for essential goods and services are protected. The objectives of the project are, therefore, for each selected set of nonnegotiable goods and services, to: quantify the last three years expenditure per province; define benchmarks for each of the nonnegotiables; quantify per province and per level of care the required budget, according to the benchmarks, for the next two years; compare existing budgets with suggested MediumTerm Framework (MTEF) budgets. Methodology Previous years expenditure per NN and suggested budgets are expressed in 2013 Rand. The average of the years 2010/11, 2011/12 and 2012/13 was calculated to represent expenditure per year at provincial level, using a combination of facility classification and budget subprogramme to classify the level of care. Benchmarks per NN are set as relative benchmarks, i.e. which may change over time to ensure affordability and sustainability. They were calculated as follows: barring vaccines and ARTrelated laboratory services and medicines which are costed as per protocol, two bottom benchmark levels were modelled: average (scenario 1) and 60 th centile (scenario 2). This approach to benchmarking implies that the benchmarks are likely to not reflect optimum treatment, but in the context of limited resources it aims at increasing resource allocation for the worstoff provinces. Suggested costs per headcount/pde by province were defined by the two benchmarks for provinces with unit cost below that level. For provinces above that level, their unit cost remains unchanged. Utilisation (number headcounts/pdes per level of care per province) is assumed to remain unchanged over the next two years. For childhood vaccines, increasing coverage towards the target 95% was modelled. For ARV medicines, utilisation projections include the National Department of Health (NDoH) projection of an annual additional patients on treatment across the country. Suggested budgets (Budgets 1 & 2) were compared with the 2013/14 budgets for these nonnegotiables. Unit costs for protocolled benchmarks: childhood vaccines, ARTrelated laboratory services and medicines were provided by the NDoH. The selected NNs covered by the project are: Blood Childhood vaccines HIV/AIDS (condoms, HIV test kits, antiretroviral therapy (ART)related medicines and laboratory services) Laboratory services excluding ARTrelated Medical Medicines excluding antiretrovirals (ARVs) 4
5 Apart from populationrelated benchmarks, benchmarks relate to PHC facilities (Clinics and Community Health Centres) and acute hospitals (District Hospitals DH, Regional Hospitals RH, Tertiary Hospitals TH, Central Hospitals CH). This report includes revised protocol costs for ART medicines and ARTrelated laboratory services which have increased significantly. The worksheet is also included for reference; however, it cannot be used directly with the new figures as manual adjustments have had to be made to deal with data issues in some provinces, overwriting formulae in some areas. 5
6 Results Benchmarks: A summary of benchmarks per NN, expressed in 2013 Rand, is presented below. These benchmarks are applied to provinces whose expenditure is below the benchmark; in other provinces current expenditure is maintained. Benchmarks per Headcount/PDE NN: Blood NN: Laboratory services excl. ART related NN: Medical NN: Medicines excl ART related PHC Headcount Average th centile DH Average th centile RH Average th centile TH Average th centile CH Average th centile Vaccines per child <1 HIV (Test kits) Per child < Per pop not on ARV HIV (Male and female condoms) Per pop 15+ Average th centile 1.76 Average th centile 5.03 HIV ARV Drugs Per patient year HIV ARV Labs Per patient year In order to view the benchmarks per PDE in perspective, the 2012/13 expenditure per PDE in bestperforming hospitals was extracted. Bestperforming hospitals were identified through the National Facilities Audit carried out by Health Systems Trust for the NDoH in 2011/12; as such, their selection reflects the criteria used in that study which focuses on inputs and processes. More work is required to include outcome data in selection of bestperforming hospitals. Data from bestperforming hospitals show surprisingly wide ranges within each level of care. Comparison between benchmarks and average/60 th centiles of the displayed hospitals shows that the benchmarks are lower than the bestperforming hospitals in many instances, but are also higher in many other instances. Suggested Budgets: From the combined expected level of utilisation and benchmark per province per level of care, the following budgets are suggested for all levels of care combined (breakdown per level of care is shown in the Annexure). The Suggested Budget1 for the country would amount to R1.6 billion for childhood vaccines, R1.4 billion for blood, R4.2 billion for laboratory services (R759 million for ARVrelated laboratory services and R3.5 billion for other laboratory services), R4.6 billion for medical, R10 billion for medicines (R4.1 billion for ARVs and R6 billion for other medicines), and R274 million for HIV test kits and condoms. If the nonprotocolbased benchmark is set at the 60 th increase by 3% (+ R737.5 million). centile, the total of Suggested Budget1 would 6

7 Suggested Budget1: Benchmark according to Average or Protocol Suggested Budgets in 2013 Rands ('000) Childhood Vaccines NN: Blood NN: Laboratory services excl. ARV related NN: Medical NN: Medicines excl ARV HIV Tests and Condoms ART medicines ART related Labs EC R R R R R R R R FS R R R R R R R R GP R R R R R R R R KZN R R R R R R R R LP R R R R R R R R MP R R R R R R R R NC R R R R R R R R NW R R R R R R R R WC R R R R R R R R Total R R R R R R R R To consider the Suggested Budgets in perspective, these projections are expressed below in expenditure per capita. Demographic structure, HIV prevalence and levels of utilisation largely explain differences between provinces. Comparison with budgets 2013/14: Comparison of NDoH budgets (October 2013) for the NNs studied with the Suggested Budget1 shows an underfunding of all NNs except for laboratory services, but only if this category in the budget excludes ARVrelated laboratory expenditure. Overall, the budgets are lower than Suggested Budget1 (benchmark: Average) by a total amount of R3.5 billion, representing an additional 2.5% on the total budget. The large shortfall in the HIV/AIDS Conditional Grant (R1.5 billion) can be partly explained by a reassessment of the cost of protocols for ART which saw a significant increase. This shortfall should in fact be higher, as some elements of the HIV/AIDS Conditional Grant (staff, equipment, others) are not costed in the Suggested Budget1. Medicines and childhood vaccines are also projected to have large shortfalls. ('000) Childhood Vaccines Difference: Budget with Suggested Budget1 (Benchmark: Average) NN: Blood NN: Laboratory services excl ARV related NN: Medical NN: Medicines excl ARV related HIV & AIDS : Conditional Grant Total Total Positive values Negative values Budget higher than Suggested Budget Budget lower than Suggested Budget 7
8 Conclusion With pressure on budgets, and the large size of fixed expenditure (e.g. on staff), the share of the total budget spent on goods and services has decreased over the years, which constitutes a serious threat to quality of care. Analysis of the past expenditure per NN illustrated significant data quality issues, but overall showed large variations between provinces, with some provinces at worryingly low levels of expenditure. Some variations in expenditure may reflect data quality issues. In some cases, low/high expenditure may be partly due to miscoding of expenditure by item, or inaccurate allocation of expenditure to individual facilities and level of care. For example, the total expenditure on vaccines per province stands at R825 million in 2012/13, whilst according to the NDoH, the figure is R1.2 billion, which indicates coding issues. The same coding issues may affect the breakdown of the budgets. Data from some provinces were much more consistent and comprehensive than in others. Variation in hospital expenditure also partly reflects the issue of mixed levels of care in hospitals, as in combos (KZN) or hospital complexes (EC). Large outliers need to be investigated to assess whether these are justified by different scopes of services due to the local situation or due to other issues, including inefficiencies. Childhood vaccine costs as per protocol appear very high, with the combined impact of wastage factors, largely due the packaging of vaccines in multidose vials, adding 50% to the cost per dose. Cost levels for ARVrelated drugs and laboratory services were revised and increased substantially in the reference model, resulting in high suggested budgets for these NNs. The setting of benchmarks for expenditure per unit of activity per level of care (for nonprotocolled NNs) was aimed at lifting the more underresourced provinces to the average level between provinces and the 60th centile of the provinces, whilst maintaining the level of expenditure in betterresourced provinces. This approach assists in mapping out an incremental frameworkfor benchmarking, with higher benchmark levels being introduced over time whilst reducing disparities between provinces. This approach to benchmarking, despite data limitations, could assist provinces and national departments in moving towards better and more equitable funding as well as better resource allocation within budgets. 8
9 Background South Africa has embarked on reengineering its health system based on a primary health care approach which focuses clear emphasis on promotive and preventive health care, while concomitantly implementing National Health Insurance (NHI) which aims to ensure that everyone has access to appropriate, efficient and goodquality health services. Strengthening the PHC approach and improving service provision will entail major changes in health service delivery structures, administrative processes and management systems, and these efforts are underpinned by the commitment inherent in the National Department of Health (NDoH) Negotiated Service Delivery Agreement (NSDA). This project aims to benchmark budgeting for nonnegotiable health goods and services (NNs) and is part of a range of projects funded by the Belgian Technical Cooperation Agency (BTC) to support National Treasury in costing and budgeting for NHI. The focus on nonnegotiable goods and services is led by the recognition that the share of total expenditure on goods and services has decreased over the past three years. Compensation of employees increased by 12%, whilst spending on goods and services increased by 4%. The Minister of Health seeks to ensure that funds for essential goods and services are protected. The project objectives are, therefore, for each selected set of nonnegotiable goods and services, to: quantify the last three years expenditure per province; define benchmarks for each of the nonnegotiables; quantify per province and per level of care the required budget, according to the benchmarks, for the next two years compare existing Mediumterm Framework (MTEF) budgets with suggested MTEF budgets. Setup of the project A wideranging series of meetings and consultations was convened in order to define the scope, priorities and methodology of the investigation. Methodology This study has been carried out in consultation with Treasury and the NDoH, and the approach and methodology used were agreed with both Ministries. Previous years expenditure per NN is expressed in 2013 Rand. The average of the years 2010/11, 2011/12 and 2012/13 was calculated to represent expenditure per year at provincial level, using DHIS facility classification, followed by the budget subprogramme to classify the level of care. is expressed by headcount for clinics and community health centres, and by PDE for hospitals. Vaccines expenditure is expressed as vaccine expenditure per child under 1: although some vaccination takes place at 18 months, 6 years and 12 years, 88% of the target cost of vaccines is for children under 1 year of age. For HIV and AIDS NNs, expenditure on test kits was calculated as expenditure per capita total population, and expenditure on male and female condoms was calculated as expenditure per capita 15 and over. on antiretrovirals (ARVs) is expressed as ARV medicine cost per patient year. Benchmarks per NonNegotiable. Benchmarks are set as relative benchmarks, i.e. which may change over time to ensure affordability and sustainability. Barring vaccines and ARV medicines, two benchmark levels were modelled: average (scenario 1) and 60 th centile (scenario 2). This approach to benchmarking implies that the benchmarks are likely to not reflect optimum treatment, but in the context of limited resources, the calculation aims at increasing resource allocation for the worstoff provinces. Suggested costs per headcount/pde by province were defined by the two bottom benchmarks for provinces with unit costs below that level. For provinces above that level, their unit costs remain unchanged. A comparison of unit costs was made between modelled unit costs and unit costs of topperforming facilities according to the National Facilities Audit performed in 2011/12. 9
10 Utilisation (number headcounts/pdes per level of care per province) is assumed to remain unchanged over the next two years. For childhood vaccines, the provincial coverage was compared against the target 95%, and an annual increase in the provincial coverage of the projected under 1 population at 2% a year was modelled for provinces under the 95% target. For ARV medicines and laboratory tests, utilisation projections include the NDoH projection of an annual additional patients on treatment across the country, spread between provinces using the current distribution of ARV patients across provinces. Each nonnegotiable thus has an average yearly expenditure per province per unit of analysis as relevant (headcount, PDE, population category). Cost per headcount and per PDE is broken down per level of care, whilst expenditure for HIV and AIDS and vaccines is presented for all levels of care combined, although these costs are essentially carried at PHC level. Suggested provincial budgets (Scenario 1 & 2) per NN per level of care were modelled by applying modelled unit costs to the projected utilisation level. Budget per capita per NN was calculated. Comparison of suggested and existing budgets for the next two years was made and NNs respective share of total budget was calculated. For large outliers, with current unit costs largely over the province below the average level possibly pointing to inefficiency, the suggested budget is modelled using the province below unit cost, and possible savings are quantified. Information was extracted from the following sources: DHIS was the source of data for the categorisation of facilities, number of headcounts, PDEs, number of patient years on ARV treatment, total population, population 15+ and number of children under 1. data were extracted from the national Basic Accounting System (BAS) database provided by Treasury. Existing MTEF budgets for each province were extracted from NDoH data dated 23 August Benchmarks as per protocols: vaccines and ARV medicine and laboratory costs were provided by the NDoH. Existing budgets were provided by the NDoH and National Treasury. Some data problems were encountered in the analysis of provincial expenditure and were dealt with in the following way: data from financial subprogrammes showed that 20% of the expenditure by NN could not be allocated by level of care. Data were thus extracted by facility (referencing financial subprogramme under which these expenditures were coded). not linked to facilities was then allocated to level according to the budget subprogramme. This process drastically reduced the expenditure which could not be allocated by level of care. Some provinces had data missing for some years, and in these instances, the average of the data available for the other years was used. Some provinces have very low or no values for some items; for example, e.g. medicines in Limpopo, are covered under a different subprogramme in the provincial accounts, by all levels of care combined. This Province s data were excluded from the calculation of the benchmark. Given the time limitations of the project, it was agreed with Treasury and the NDoH that a subset of NNs would be covered in the study. 10
 for the past three financial years expressed in 2013 Rand, the average of the yearly")
11 The selected NNs are as follows: Results Blood Childhood vaccines HIV (condoms, tests, ARVs) Laboratory services Medical Medicines The results are presented in two groups: Past expenditure and benchmarks: yearly expenditure per province per unit of analysis as relevant (headcount, PDE, population category) for the past three financial years expressed in 2013 Rand, the average of the yearly values, and the benchmarks as average and 60 th centile of the provincial average values Comparison of suggested and existing budgets 1. and benchmarks per province and benchmarks are presented in the following sections via graphs. Detailed tables are presented in the Annexure. Childhood vaccines Recorded expenditure for South Africa increased over the three years under investigation and reached R825.5 million in 2012/13, or an average of R854 in 2012/13 per child under 1. For the purpose of the study and ease of reference given that the breakdown of actual vaccine expenditure per age is not available, all childhood vaccines are expressed per child under 1. However, R1.2 billion is budgeted for this NN at a national level; this discrepancy may point to the fact that vaccine expenditure may be recorded under other codes. As a consequence, expenditure on vaccines per child under 1 ranges from R108 in Gauteng to R1 441 in KZN. Figure 1. on vaccines per child by province The national benchmark has been set according to protocol regarding the number of doses required for each component. Cost by dose includes the wastage factor. The wastage factor varies with the packaging of the vaccine: for the BCG packaged by 20 doses, the wastage factor is 80%, whilst Rotavirus, packaged by single dose, has a wastage factor of 5%. Overall, wastage factors increase the cost by 50%. The cost of vaccines stands at a total of R per child, 80% of which is for children under 1. The cost per child is high and the NDoH may need to reassess its reference costs and wastage factors. 11


12 Table 1. Childhood vaccines protocols and cost Number Doses per Child Cost per Child Name Price Units Unit cost Wastage Cost <1 18 mths 6 Yrs 12 Yrs <1 18 mths 6 Yrs 12 Yrs BCG % Oral Polio % DaPTIPVHib % HepB % Rotavirus % PCV % Measles % Td % Total 2013 Rds HIV test kits on HIV testing kits decreased by 53% between 2010/11 and 2011/12, and increased again by 23% in 2012/13. Higher expenditure in 2010/11 was linked to the testing campaign, which may be restarted. per capita across provinces ranges from R1.11 in the Free State to R2.28 in the Northern Cape, higher than in KZN (2.13). Figures for Limpopo Province were not available. The average and 60 th centile, which will be used for benchmarks for the provinces with lowest expenditures, stand at R1.67 and R1.76 respectively. Figure 2. per capita total population on HIV testing kits by province HIV: female and male condoms for 2010/11 was available for only a few provinces. The 2011/12 expenditure increased threefold in 2012/13, and is likely to represent increased use of condoms; the benchmark will thus be calculated not from the average of 2011/12 and 2012/13, but from 2012/13 only. The average and 60 th centile stand at R4.38 and R5.03 respectively. Figure 3. per 15+ on condoms by province, 2012/13 only 12
13 ARV medicines and laboratory tests The benchmarks according to protocol and expenditure are presented by patient years on treatment. The number of patient years was calculated from the monthly numbers of patients on treatment (District Health Information System DHIS), in order to reflect use of ARVs by patients who dropped out before the end of the year and by those who started later during the year. In the protocol, the cost of ARV medicine by patient years stands at R1 668 and for ARTrelated laboratory services at R306. Table 2. ARV medicine and laboratory costs per patient year benchmark ARV Drugs Costs 2013/ /13 ARVPatients Year Adults % Children % Average per patient year % ARV Labs/diagnostics Costs 2013/ /13 ARVPatients Year Adults % Children 333 6% Average per patient year % MeyerRath, G National ART Cost Model, South Africa. Health Economics and Epidemiology Research Office, Boston University/ University of the Witwatersrand, Johannesburg. The year 2012/13 is used as reference to reflect recent protocols and costs of ARV medicines and laboratory services. Costs presented here reflect expenditure for these items coded under Conditional Grant (subprogramme 2.6). For ARV medicines, the country average cost per patient year stands at R1 669 in 2012/13, although variations can be observed between provinces, ranging from R1 202 in KZN to R1 744 in the Free State. The Northern Cape Province is a large outlier at R Surprisingly, the country average is identical to the protocol. For ARTrelated laboratory tests, the country average expenditure stood at R700, considerably higher than the protocol level of R306. This may point to other laboratory expenditures being coded under subprogramme 6, affecting in turn the analysis of nonartrelated laboratory expenditure and benchmarks under other programmes. Under subprogramme 2.6, laboratory services expenditure ranged from R215 in the Western Cape to R1 176 in the Northern Cape. 13
14 Figure 4. ARV medicines and laboratory expenditure per patient year by province, 2012/13 14
15 Blood Blood for PHC were recorded in few provinces, and in these provinces the average cost per PHC headcount stood at R0.07 and at R0.07 for the 60 th centile. In hospitals, expenditure per PDE ranged from an average of R18.33 in district hospitals, to R43.00 in regional hospitals, R75.19 in tertiary hospitals and R in central hospitals. Low expenditure in district hospitals is likely to reflect the fact that some hospitals do not perform surgery due to a shortage of doctors. The 60 th centile stands at R20.92 in district hospitals, R46.78 in regional hospitals and R78.68 in tertiary hospitals, and at R in central hospitals. Figure 5. Blood expenditure per PDE acute hospitals by province District Hosps WC Average 60th Centile 23 Regional Hosps WC Average 60th Centile 44 NW 13 NW 47 NC 14 NC 33 MP 25 MP 49 LP 21 LP 34 KZN 15 KZN 49 GP 29 GP 57 FS 17 FS 47 EC 9 EC Tertiary Hosps NC Average 67 60th Centile Central Hosps 60th Centile Average WC 114 MP 96 KZN 207 LP KZN GP 101 EC 61 FS Laboratory services Due to the issue of a backlog in payment for services to the National Health Laboratory Services (NHLS) in KwaZuluNatal Province (KZN), the artificially low cost of this NN in KZN was excluded from calculations at PHC and Acute Hospital level in order to avoid distortions. NonARVrelated laboratory expenditure ranged from R2.04 per PHC headcount in the FreeState to R11.15 in Gauteng. The average of the provinces stands at R5.75 and the 60 th centile at R6.50. However, when all PHC level laboratory expenditure, including that from the HIV/AIDS Conditional Grant, is taken into account, the picture is very different, with Free State, North West, Northern Cape and Mpumalanga having the highest level of expenditure. 15
16 Figure 6. Laboratory services expenditure per PHC headcount by province In Acute Hospitals, laboratory expenditure per PDE ranged from an average of R50.37 in district hospitals, to R76.47 in regional hospitals, R in tertiary hospitals and R in central hospitals. The 60th centile stands at R52.13 in district hospitals, R82.04 in regional hospitals and R in tertiary hospitals, and at R in central hospitals. Gauteng Province has the highest level of expenditure for all levels of hospitals. 16
17 Figure 7. Laboratory services expenditure per PDE acute hospitals by province District Hosps WC Average 60th Centile 70 Regional Hosps WC Average 60th Centile 89 NW 59 NW 99 NC 37 NC 64 MP 48 MP 77 LP 31 LP 56 KZN KZN GP 106 GP 119 FS 22 FS 61 EC 29 EC Tertiary Hosps NC Average 60th Centile 123 Central Hosps WC Average 60th Centile 200 MP 150 KZN LP KZN 66 GP 185 EC 110 FS Medical Due to data problems, expenditure for Limpopo Province could not be included. Medical expenditure ranged from R2.9 per PHC headcount in the Eastern Cape to R6.3 in the Western Cape. The average of the provinces and the 60 th centile were similar at R4.4. Figure 8. Medical expenditure per PHC headcount by province In Acute Hospitals, expenditure per PDE on medical ranged from an average of R60.6 in district hospitals, to R107.5 in regional hospitals, R210.9 in tertiary hospitals and R380.4 in central hospitals. The 60 centile stands at R66.4 in district hospitals, R116 in regional hospitals and R259 in tertiary hospitals, and at R427.9 in central hospitals. The Eastern Cape Province had a low level of expenditure in all hospitals. 17
18 Figure 9. Medical expenditure per PDE acute hospitals by province District Hosps WC Average 60th Centile 89 Regional Hosps WC Average 60th Centile 160 NW 53 NW 115 NC 82 NC 104 MP 56 MP 76 LP LP KZN 53 KZN 108 GP 82 GP 118 FS 37 FS 130 EC 32 EC Tertiary Hosps NC Average 60th Centile 259 Central Hosps WC Average 60th Centile 428 MP 193 KZN 510 LP KZN EC GP FS
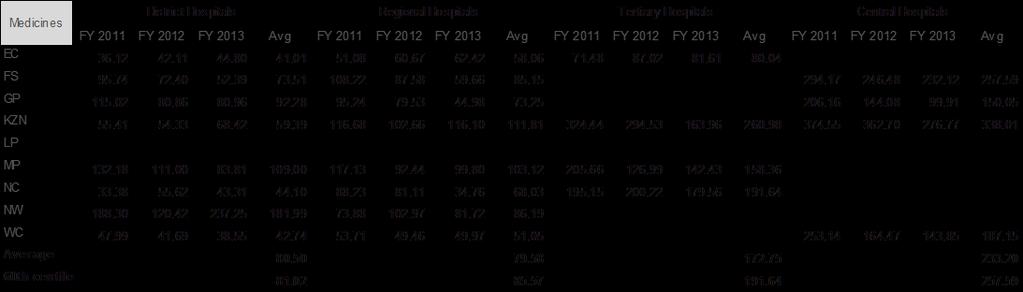
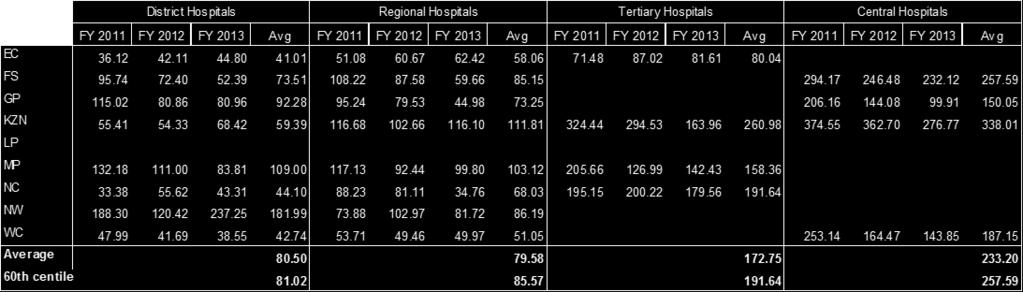
19 Medicines Due to data problems, expenditure for Limpopo Province could not be included. Medicines expenditure (excluding ARVs) ranged from R12 per PHC headcount in KZN to R25.3 in Mpumalanga. The average of the provinces stood at R18.9 and the 60 th centile was similar at R21.2. If expenditure from the HIV/AIDS Conditional Grant is added in All PHC Combined, KZN expenditure per headcount remains surprisingly the lowest at R13, with Gauteng being the highest at R32 per PHC headcount. The Western Cape shows almost no variation, indicating that the Conditional Grant had been allocated to PHC facilities. Figure 10. Medicines expenditure per PHC headcount In acute hospitals, expenditure per PDE on medicines showed wide variations between provinces, as well as lower cost in regional hospitals than in district hospitals in North West, Mpumalanga and Gauteng Provinces. For district hospitals, spending ranged from a threeyear average of R41.01 in the Eastern Cape to R109 in Mpumalanga. The North West is an outlier at R182 per PDE. These high costs in district hospitals may indicate that some medicines expenditure for PHC is in fact reflected in district hospitals. The average across provinces stood at R80.50 and the 60 th centile at R In regional hospitals, the lowest cost is observed in Western Cape at R51.05, rising to R in KZN. The average across provinces stood at R79.58 and the 60 th centile at R In tertiary hospitals, expenditure per PDE ranged from R80.04 in the Eastern Cape to R in KZN. The average across provinces stood at R and the 60 th centile at R In central hospitals, the threeyear average ranged from R in Gauteng to R in KZN. The average across the four provinces stood at R and the 60 th centile at R
20 Figure 11. Medicines expenditure per PDE acute hospitals by province District Hosps WC Average 43 60th Centile Regional Hosps WC Average 51 60th Centile NW 182 NW 86 NC 44 NC 68 MP 109 MP 103 LP LP KZN 59 KZN 112 GP 92 GP 73 FS 74 FS 85 EC 41 EC Tertiary Hosps NC Average 60th Centile 192 Central Hosps WC Average th Centile MP 158 KZN 338 LP KZN EC GP FS
21 Benchmarks summary and comparison with bestperforming hospitals A summary of benchmarks per NN is presented below. These benchmarks are applied to provinces whose expenditure is below the benchmark; in other provinces current expenditure is maintained. Table 3. Benchmarks summary Benchmarks per Headcount/PDE NN: Blood NN: Laboratory services excl. ART related NN: Medical NN: Medicines excl ART related PHC Headcount Average th centile DH Average th centile RH Average th centile TH Average th centile CH Average th centile Vaccines per child <1 HIV (Test kits) Per child < Per pop not on ARV HIV (Male and female condoms) Per pop 15+ Average th centile 1.76 Average th centile 5.03 HIV ARV Drugs Per patient year In order to viewthe benchmarks per PDE in perspective, 2012/13 expenditure per PDE in bestperforming hospitals was extracted. Bestperforming hospitals were identified through the National Facilities Audit carried out by Health Systems Trust (HST) for the NDoH in 2011/12. Data from bestperforming hospitals show surprisingly wide ranges within each level of care. Comparison between benchmarks and average/60 th centiles of the displayed hospitals shows that the benchmarks are lower than the bestperforming hospitals in many instances, but are also higher in many other instances: District hospitals: the benchmarkaverage expenditure per PDE is lower than the bestperforming hospitals average by 7% for blood, lower by 17% for laboratory services, higher by 1% for medical, and higher by 3% for medicines. The benchmark60 th centile is higher than the bestperforming hospitals 60 th centile by 2% for blood, lower by 34% for laboratory services, lower by 24% for medical, and higher by 6% for medicines. Regional hospitals: the benchmarkaverage expenditure per PDE is lower than the bestperforming hospitals average by 18% for blood, lower by 32% for laboratory services, lower by 25% for medical, and lower by 12% for medicines. The benchmark60 th centile is lower than the bestperforming hospitals 60 th centile by 21% for blood, lower by 9% for laboratory services, lower by 4% for medical, and lower by 6% for medicines. Tertiary hospitals: the benchmarkaverage expenditure per PDE is lower than the bestperforming hospitals average by 17% for blood, lower by 89% for laboratory services, lower by 10% for medical, and higher by 3% for medicines. The benchmark60 th centile is lower than the bestperforming hospitals 60 th centile by 32% for blood, lower by 84% for laboratory services, higher by 11% for medical, and higher by 17% for medicines. Central hospitals: the benchmarkaverage expenditure per PDE is higher than the bestperforming hospitals average by 2% for blood, lower by 15% for laboratory services, higher by 11% for medical, and higher by 31% for medicines. The benchmark60 th 21
22 centile is higher than the bestperforming hospitals 60 th centile by 5% for blood, similar for laboratory services, higher by 18% for medical, and higher by 43% for medicines. 2. Suggested Budgets per province per NN Suggested budgets in 2013 Rand were calculated as shown in the following examples, and tables are displayed in the Annexure. As explained in the methodology section, different methods are used for different NNs: Table 4. Vaccines: increasing coverage for provinces under the 95% target, maintaining coverage for those at this level, and the benchmark is as per protocol. Coverage figures are based on DHIS population, currently used by the NDoH. Data from Census 2011 give lower coverage figures. ARVs: the benchmark is as per protocol, and increasing number of patient years to reflect additional a year for South Africa. HIV test kits: the target population excludes those already on ARVs, and the benchmark is based on average cost per capita across provinces and 60 th centile. Blood, laboratory services, medical and medicines: utilisation (headcounts/pdes) remains the same over the next two years. The benchmark is based on average cost per headcount/pde across provinces and 60 th centile. Where actual expenditure is higher than the benchmark, actual expenditure is used as the benchmark. Suggested Budgets calculation per type of NN For NNs with benchmarks as per protocol Actual Suggested Coverage Population <1 (DHIS) Benchmark Vaccines Coverage per < (DHIS) EC R R R FS R R ARV Drugs Patients Years 2013 % Patients Years 2013 Distribution Additional per year for SA Patients Years 2014 Patients Years 2015 Benchmark per Patient Year EC % R R R FS % R R For NNs with budgets calculated from benchmark per unit of activity Laboratory services District Hospitals PDEs per PDE Benchmark per PDE Scenario 1: Average Scenario 2: 60th Centile EC R R R R R R WC R R R R R R Combining the information per NN per level of care, the suggested budget in 2013 Rand is presented by province, using the two benchmark approaches, all levels of care combined to match the format used by the NDoH. Note that these budgets do not reflect expenditure on specialised hospitals. The suggested Budget1 for the country would amount to R1.6 billion for childhood vaccines, R1.4 billion for blood, R4.2 billion for laboratory services (R 759 million for ARVrelated laboratory services and R3.5 billion for other laboratory services), R4.6 billion for medical, R10 billion for medicines (R4.1 billion for ARVs and R6 billion for other medicines) and R274 million for HIV test kits and condoms. If the nonprotocolbased benchmark is set at the 60 th increase by 3% (+ R737.5 million). centile, the total of Suggested Budget1 would 22
23 Table 5. Suggested Budgets by NN all levels of care Suggested Budget1: Benchmark according to Average or Protocol Suggested Budgets in 2013 Rands ('000) Childhood Vaccines NN: Blood NN: Laboratory services excl. ARV related NN: Medical NN: Medicines excl ARV HIV Tests and Condoms ART medicines ART related Labs EC R R R R R R R R FS R R R R R R R R GP R R R R R R R R KZN R R R R R R R R LP R R R R R R R R MP R R R R R R R R NC R R R R R R R R NW R R R R R R R R WC R R R R R R R R Total R R R R R R R R Suggested Budget2: Benchmark according to 60th Centile or Protocol Suggested Budgets in 2013 Rands ('000) NN: Childhood Vaccines NN: Blood NN: Laboratory services excl. ARV related NN: Medical NN: Medicines excl ARV HIV Tests and Condoms ART medicines ART related Labs EC R R R R R R R R FS R R R R R R R R GP R R R R R R R R KZN R R R R R R R R LP R R R R R R R R MP R R R R R R R R NC R R R R R R R R NW R R R R R R R R WC R R R R R R R R Total R R R R R R R R SA Childhood Vaccines NN: Blood Difference Suggested Budget2 and Budget 1 ('000) NN: Laboratory services excl. ARV related NN: Medical NN: Medicines excl ARV HIV Tests and Condoms ART medicines ART related Labs Budget2 Budget1 R R R R R R R R R % Variation 0% 0.2% 4% 8% 4% 6% 0% 0% 3% Total In order to understand the variation in suggested budgets per province, utilisation level and budget per capita are presented in the following table. Suggested budgets are a function of the demographic structure and size of population (childhood vaccines), HIV prevalence, level of utilisation and previous expenditure by headcount or PDE. 23
24 Table 6. Suggested Budgets per capita Suggested Budgets in 2013 Rands Provincial PHC Headcounts/ Capita Total Population Acute Hospitals PDEs/ Capita Childhood Vaccines NN: Blood NN: Laboratory services excl. ARV related Suggested Budget1 per Capita Total Population NN: Medical NN: Medicines excl ARV HIV Tests and Condoms ART medicines ART related Labs EC FS GP KZN LP MP NC NW WC Total Suggested Budgets in 2013 Rands Childhood Vaccines NN: Blood NN: Laboratory services excl. ARV related Suggested Budget2 per Capita Total Population NN: Medical NN: Medicines excl ARV HIV Tests and Condoms ART medicines ART related Labs EC FS GP KZN LP MP NC NW WC Total Comparison of suggested budgets (1&2) with 2013/14 budgets Comparison of suggested budgets with 2013/14 budgets is made difficult by the fact that some categories do not have similar boundaries between the budget from the NDoH (October 2013) and the categories of NNs studied. Some categories are similar: childhood vaccines, blood and medical. Laboratory services in the budget amounts to R3.9 billion; in the Suggested Budget1, laboratory services excluding ARVrelated stands at R3.5 billion, but ARVrelated laboratory services is R759 million, putting laboratory services at R4.2 billion. The same issue arises for medicines. The category Medicines in the budget amounts to R4.8 billion; in the Suggested Budget1, medicines excluding ARVs stands at R6 billion, but ARV drugs is R4.1 billion, putting medicines at R10.2 billion. On the other hand, the budget displays the amount for HIV/AIDS Conditional Grant. The HIV/AIDS Conditional Grant covers the NNs: HIV testing kits, condoms, ARVrelated laboratory services and ARV drugs, but it also covers some staff expenditure, equipment and other spending. So the sum of the NNs, studied in this report, in the suggested Budget1 (R5.1 billion) would be expected to be smaller than the Conditional Grant budget, which in fact stands at R3.85 billion. Overall, the budgets are lower than Suggested Budgets1 by a total amount of R3.5 billion, representing an additional 2.5% on the total budget. This excludes the additional amount for the areas in the Conditional Grant not covered in the NNs analysed in this report. Table 7. Comparison of Budget and Suggested Budgets ('000) Childhood Vaccines Difference: Budget with Suggested Budget1 (Benchmark: Average) NN: Blood NN: Laboratory services excl ARV related NN: Medical NN: Medicines excl ARV related HIV & AIDS : Conditional Grant Total Total Positive values Negative values Budget higher than Suggested Budget Budget lower than Suggested Budget Detailed tables with provincial breakdown are presented in the Annex. The 2013/14 budgets include specialised hospitals, which are not included in the suggested budgets. However, these hospitals represent a very small component of the NNs expenditure. Based on 2012/13 expenditure, PHC and acute hospital care represent 99.7% of blood, 99% of laboratory services, 24
25 98.9% of medical and 95.8% of medicines. Suggested budgets can then be compared with total budgets without creating major distortions. 3. Conclusion With pressures on budgets, and the large size of fixed expenditure (e.g. on staff), the share of the total budget spent on goods and services has decreased over the years, leading to the call by Minister Motsoaledi to protect selected goods and services to improve the quality of health care: the nonnegotiables. This study has defined two sets of bottom benchmarks for selected NNs: one benchmark based on the average of the provincial expenditure over the last three years, and the second one on the 60 th centile of these provinces. Analysis of the past expenditure per NN showed large variations between provinces, with some provinces at a worryingly low level of expenditure. Some variations in expenditure may reflect data quality issues. In some cases, low/high expenditure may be partly due to miscoding of expenditure by item, or inaccurate allocation of expenditure to individual facilities and level of care. For example, the total expenditure on vaccines per province stands at R825 million in 2012/13, while according to the NDoH figures, the amount is R1.2 billion, which suggests that there might be coding issues. The same coding issues may affect the breakdown of the budgets. Data from some provinces were much more consistent and comprehensive than in others. Variation in hospital expenditure also partly reflects the issue of mixed levels of care in hospitals, as in combos (KZN) or hospital complexes (EC). Large outliers need to be investigated to assess whether these are justified by different scopes of services due to the local situation or due to other issues, including inefficiencies. Suggested budgets were calculated for each selected nonnegotiable. Benchmarks were set by protocols for childhood vaccines, ARV drugs and ARVrelated laboratory services. For blood Supplies, laboratory services excluding ARVrelated, medical and medicines excluding ARVs, benchmark levels were set in a way which would allow lifting the leastresourced provinces to the level of the average expenditure per headcount/pde across the past three years and across provinces. Provinces with higher expenditure would keep their previous level of expenditure per unit of activity per level of care. These benchmarks do not include additional expenditures linked to campaigns. A second set of benchmarks was based on protocols for some NNs, and on the 60 th centile of the average three years expenditure per province. The Suggested Budget based on this second set of benchmarks would be 3% higher than that based on the first set of benchmarks. Comparison of budgets for the NNs studied with the Suggested Budget1 shows an underfunding for all NNs except for laboratory services, but only if this category in the budget excludes ARVrelated laboratory expenditure. Overall, the budgets are lower than Suggested Budgets1 (benchmark: Average) by a total amount of R3.5 billion, representing an additional 2.5% on the total budget. The shortfall should in fact be higher, as it does not include the additional budget for the areas in the HIV/AIDS Conditional Grant not covered in the NNs analysed in this report. The large shortfall in the HIV/AIDS Conditional Grant (R1.5 billion) can be partly explained by a reassessment of the cost of protocols for ART, which saw a significant increase. Medicines and childhood vaccines are also projected to have large shortfalls. Improved funding for the selected nonnegotiables may need to use an incremental approach focusing first on lifting poorer provinces to the average level of expenditure for each NN per level of care, with the aim of moving towards a higherlevel set of benchmarks (60 th centile). 25


26 Annexure: Additional Tables Table 8. Vaccines expenditure and expenditure per population under 1 year Table 9. HIV testing kits expenditure and benchmarks 26


27 Table 10. Condoms expenditure and benchmarks Table 11. ARV medicines expenditure per patient year Table 12. ARVrelated laboratory expenditure per patient year Total expenditure on ART labs 2013 Patient Years 2013 Cost / Patient Year Benchmark Prov FY 2011 FY 2012 FY 2013 Total EC FS GP KZN LP MP NC NW WC Average


28 Table 13. Blood in acute hospitals expenditure and benchmark per PDE Table 14. Laboratory services in acute hospitals expenditure and benchmark per PDE Table 15. Medical in acute hospitals expenditure and benchmark per PDE Table 16. Medicines in acute hospitals expenditure and benchmark per PDE 28
Factsheet on the Non-Negotiable Budget Items in the Provision of Public Health and HIV/AIDS Services in South Africa 1
 Factsheet on the Non-Negotiable Budget Items in the Provision of Public Health and HIV/AIDS Services in South Africa 1 Silindile Shezi, Plaxcedes Chiwire, Nhlanhla Ndlovu 12 September 2014 E-mail: nhlanhla@cegaa.org
South African ART policies between 2013/ /15: An analysis of ARV Expenditure
 South African ART policies between 2013/14 2014/15: An analysis of ARV Expenditure Gavin Surgey Teresa Guthrie 31 March 2015 DRAFT [Do not quote without prior permission] Background Over 2.5m people on
Children and South Africa s Budget
 Children and South Africa s Budget Children and South Africa s Budget 1. Macro context 2. Health 3. Education 4. Social Development 1. MACRO CONTEXT South Africa Key message 1 The nearly 20 million children
Programme based budgeting: the health budget programme structure in South Africa
 Programme based budgeting: the health budget programme structure in South Africa WHO symposium on Health Financing Presenter: Mark Blecher National Treasury of South Africa 1 November 2017 1 Presentation
Provincial Budgeting and Financial Management
 Provincial Budgeting and Financial Management Presentation to Select Committee on Appropriations Presenter: Edgar Sishi National Treasury 15 July 2014 INTRODUCTION Provincial functions are assigned by
Focus on Household and Economic Statistics. Insights from Stats SA publications. Nthambeleni Mukwevho Stats SA
 Focus on Household and Economic Statistics Insights from Stats SA publications Nthambeleni Mukwevho Stats SA South African Population Results from CS 2016 Source: CS 2016 EC Household Results from CS 2016
Post subsidies in provincial Departments of Social Development. Report prepared by Debbie Budlender
 Post subsidies in provincial Departments of Social Development Report prepared by Debbie Budlender April 2017 1 About this study: The care work project was initiated in 2016 by the Shukumisa Campaign in
Hands-on. Learning Brief 45. Learning from our implementing partners. University of Cape Town
 EARLY CHILDHOOD DEVELOPMENT Hands-on Learning from our implementing partners University of Cape Town Are children s rights prioritised at a time of budget cuts? Assessing the adequacy of the 2013/14 social
Labour. Labour market dynamics in South Africa, statistics STATS SA STATISTICS SOUTH AFRICA
 Labour statistics Labour market dynamics in South Africa, 2017 STATS SA STATISTICS SOUTH AFRICA Labour Market Dynamics in South Africa 2017 Report No. 02-11-02 (2017) Risenga Maluleke Statistician-General
Quarterly Labour Force Survey Q1:2018
 Quarterly Labour Force Survey Q1:2018 Faizel Mohammed Stats SA discouraged work seekers The labour market Q1:2018 37,7 million People of working age in South Africa (15 64 year olds) Labour force 22,4
BUDGET SOUTH AFRICAN BUDGET: THE MACRO PICTURE. Key messages
 BUDGET CHILDREN AND THE SOUTH AFRICAN BUDGET: THE MACRO PICTURE UNICEF/Pirozzi Key messages The nearly 2 million children in South Africa account for more than a third of the country s population. South
LIMPOPO VHEMBE DISTRICT PROFILE
 LIMPOPO VHEMBE DISTRICT PROFILE 1 2 Table of Contents 1. Demographic Information... 4 2. Social Determinants of Health... 6 3. Health Service Delivery Platform... 7 3.1 Facility type per sub-district...
LABOUR MARKET PROVINCIAL 54.3 % 45.7 % Unemployed Discouraged work-seekers % 71.4 % QUARTERLY DATA SERIES
 QUARTERLY DATA SERIES ISSUE 6 October 2016 PROVINCIAL LABOUR MARKET introduction introduction The Eastern Cape Quarterly Review of Labour Markets is a statistical release compiled by the Eastern Cape Socio
Labour force survey. September Embargoed until: 29 March :30
 Statistical release P0210 Labour force survey September 2006 Embargoed until: 29 March 2007 12:30 Enquiries: Forthcoming issue: Expected release date User Information Services LFS March 2007 September
LABOUR MARKET PROVINCIAL 51.6 % 48.4 % Unemployed Discouraged work-seekers % 71.8 % QUARTERLY DATA SERIES
 QUARTERLY DATA SERIES ISSUE 7 November 2016 PROVINCIAL LABOUR MARKET introduction introduction The Eastern Cape Quarterly Review of Labour Markets is a statistical release compiled by the Eastern Cape
IMPACT OF GOVERNMENT PROGRAMMES USING ADMINISTRATIVE DATA SETS SOCIAL ASSISTANCE GRANTS
 IMPACT OF GOVERNMENT PROGRAMMES USING ADMINISTRATIVE DATA SETS SOCIAL ASSISTANCE GRANTS Project 6.2 of the Ten Year Review Research Programme Second draft, 19 June 2003 Dr Ingrid Woolard 1 Introduction
Salary Survey. The Association of South African Quantity Surveyors (ASAQS) March 2017 (Published in October 2017) South African Construction Industry
 March 2017 (Published in October 2017) South African Construction Industry") The Association of South African Quantity Surveyors (ASAQS) Salary Survey March 2017 (Published in October 2017) South African Construction Industry Business Information Services www.industryinsight.co.za
The Association of South African Quantity Surveyors (ASAQS) Salary Survey March 2017 (Published in October 2017) South African Construction Industry Business Information Services www.industryinsight.co.za
PORTFOLIO COMMITTEE ON RURAL DEVELOPMENT AND LAND REFORM 3 MAY 2017
 2017 ENE ALLOCATION PORTFOLIO COMMITTEE ON RURAL DEVELOPMENT AND LAND REFORM 3 MAY 2017 1 Branches allocation to Total Branches Final ENE allocation % baseline R'000 % Administration 1,721,620 16.9% Ministerial
PROGRESS REPORT ON LAND RESTITUTION CLAIMS
 PROGRESS REPORT ON LAND RESTITUTION CLAIMS db3sqepoi5n3s.cloudfront.net/files/docs/1202 07progress.ppt PRESENTATION TO THE PORTFOLIO COMMITTEE ON RURAL DEVELOPMENT AND LAND REFORM 07 FEBRUARY 2012 MR T.
Mid-year population estimates, South Africa 2005
 Statistical release Mid-year population estimates, South Africa 2005 Embargoed until 31 May 2005 11:00 Private Bag X44 Pretoria 0001 South Africa 170 Andries Street, Pretoria 0002 tel: +27(12) 310 8911
Prepared by cde Khwezi Mabasa ( FES Socio-economic Transformation Programme Manager) JANUARY 2016
 JANUARY 2016") Prepared by cde Khwezi Mabasa ( FES Socio-economic Transformation Programme Manager) JANUARY 2016 Political Context: Social Democratic Values Social policy and the access to basic public goods are the
Prepared by cde Khwezi Mabasa ( FES Socio-economic Transformation Programme Manager) JANUARY 2016 Political Context: Social Democratic Values Social policy and the access to basic public goods are the
1. Medical Research Council on its 2014/15 Annual Report: Department of Health 2014/2015 performance: Auditor-General & FFC briefings
 1. Medical Research Council on its 2014/15 Annual Report: Department of Health 2014/2015 performance: Auditor-General & FFC briefings 2. Chairperson: Ms L Zwane (ANC) 3. Date of Meeting: 13 October 2015
ADDRESSING PUBLIC PRIVATE SECTOR INEQUALITIES PROFESSOR EMERITUS YOSUF VERIAVA
 ADDRESSING PUBLIC PRIVATE SECTOR INEQUALITIES PROFESSOR EMERITUS YOSUF VERIAVA HEALTH INEQUALITY AND INEQUITY Disparity: Is there a difference in the health status rates between population groups? Inequality:
Quarterly Labour Force Survey Q3:2017
 Quarterly Labour Force Survey Q3:2017 Dr Pali Lehohla Statistician-General #StatsSA South African Labour Market: Current state vs NDP target South African Labour Market: Current state vs NDP target Unemployment
The cidb Quarterly Monitor. T h e C o n s t r u c t i o n I n d u s t r y D e v e l o p m e n t B o a r d Development Through Partnership
 THE ECONOMICS OF CONSTRUCTION IN SOUTH AFRICA The cidb Quarterly Monitor T h e C o n s t r u c t i o n I n d u s t r y D e v e l o p m e n t B o a r d Development Through Partnership OCTOBER 2012 Acknowledgements:
NATIONAL SENIOR CERTIFICATE GRADE 12
 NATIONAL SENIOR CERTIFICATE GRADE 12 MATHEMATICAL LITERACY P2 EXEMPLAR PAPER 2008 MARKS: 150 TIME: 3 hours This question paper consists of 14 pages and 3 Annexures 2 INSTRUCTIONS AND INFORMATION 1. This
Booklet A1: Cost and Expenditure Analysis
 Booklet A1: Cost and Expenditure Analysis This booklet explains how cost analysis can be used to improve the planning and management of SRH programmes, and describes six simple analyses. Before discussion
South Africa. UNICEF South Africa
 South Africa UNICEF South Africa Education BUDGET SOUTH AFRICA 2017/2018 1 17% Budget for school children remains at 17% of total government expenditure Preface This budget brief is one of four that explore
Municipal Infrastructure Grant Baseline Study
 Municipal Infrastructure Grant Baseline Study August 2008 Published July 2009 Disclaimer This Research Report for the Municipal Infrastructure Grant (MIG) Baseline Study has been prepared using information
Universe and Sample. Page 26. Universe. Population Table 1 Sub-populations excluded
 Universe and Sample Universe The universe from which the SAARF AMPS 2008 (and previous years) sample was drawn, comprised adults aged 16 years or older resident in private households, or hostels, residential
2015 Division of Revenue Bill Joint meeting of the Standing and Select Committees on Appropriations
 . 2015 Division of Revenue Bill Joint meeting of the Standing and Select Committees on Appropriations Presenters: Malijeng Ngqaleni, Wendy Fanoe, Dumebi Ubogu and Empie van Schoor Intergovernmental Relations
Processes for Financing Public Basic Education in South Africa
 Processes for Financing Public Basic Education in South Africa Final January 2017 Research commissioned by the International Budget Partnership 1 Table of Contents 1 INTRODUCTION... 3 2 RELEVANT LEGISLATION...
Drug Reimbursement - Croatia. Roganovic Jelena
 Drug Reimbursement - Croatia Roganovic Jelena Population: 4,292,095 (July 2017) Area: 56,594 km 2 Density: 75.8/km 2 21 counties http://www.lokalniizbori.com/wp-content/uploads/2013/04/hrvatska-%c5%beupanije.jpg;
New allocations for ARV treatment: An analysis of 2004/5 national budget from an HIV/AIDS perspective
 IDASA - Budget Information Service New allocations for ARV treatment: An analysis of 2004/5 national budget from an HIV/AIDS perspective 31 May 2004 Alison Hickey AIDS Budget Unit http://www.idasa.org.za/bis/
2. CONSIDERATION OF THE ANNUAL PERFORMANCE PLAN AND BUDGET ALLOCATIONS
 REPORT OF THE PORTFOLIO COMMITTEE ON HEALTH ON THE ANNUAL PERFORMANCE PLAN OF THE DEPARTMENT OF HEALTH, ITS ENTITIES (2016/2017-2018/2019) AND BUDGET VOTE 16, DATED 5 MAY 2016 The Portfolio Committee on
South African Baseline Study on Financial Literacy
 Regional Dissemination Conference on Building Financial Capability South African Baseline Study on Financial Literacy Lyndwill Clarke Head: Consumer Education 30-31 January 2013 Nairobi, Kenya Outline
Standing Committee on Appropriations and Portfolio Committee on Health
 Standing Committee on Appropriations and Portfolio Committee on Health National Department of Health 22 March 2017 Content Alignment between the National Health budget processes and Provincial Health budget
National Treasury. Financing NHI. Pharmaceutical Society SA 24 June 2018
 Financing NHI Pharmaceutical Society SA 24 June 2018 1 Principles of National Health Insurance Public purchaser Provision by accredited public and private providers Affordable and sustainable Primary care
Presentation to the Select Committee on Appropriations COMMUNITY LIBRARY SERVICES GRANT. 25 May 2011
 Presentation to the Select Committee on Appropriations COMMUNITY LIBRARY SERVICES GRANT 25 May 2011 Community Library Services Grant 31 December 2010 Table: Community Library Services Grant expenditure
Booklet C.2: Estimating future financial resource needs
 Booklet C.2: Estimating future financial resource needs This booklet describes how managers can use cost information to estimate future financial resource needs. Often health sector budgets are based on
Analysis of the 2009/10 budgets of the nine provincial departments of Social Development: Are the budgets adequate to implement the Children s Act?
 28 May 2009 Analysis of the 2009/10 budgets of the nine provincial departments of Social Development: Are the budgets adequate to implement the Children s Act? Debbie Budlender 1 and Paula Proudlock 2
CONSTRUCTION MONITOR Employment Q3 2017
 CONSTRUCTION MONITOR Employment Q3 2017 CIDB CONSTRUCTION MONITOR - EMPLOYMENT; OCTOBER 2017 CIDB CONSTRUCTION MONITOR - EMPLOYMENT; OCTOBER 2017 1. Introduction 1 2. Employment in the Construction Industry;
SUMMARY OF THE CHILDREN S BILL COSTING
 Centre for Actuarial Research (CARe) SUMMARY OF THE CHILDREN S BILL COSTING Written by Debbie Budlender Children s Institute and Centre for Actuarial Research, University of Cape Town November 2006 Why
KENYA DYNAMIC HEALTH SERVICE COSTING MODEL
 KENYA DYNAMIC HEALTH SERVICE COSTING MODEL USER MANUAL G I Z Contents INTRODUCTION TO THE COSTING MODEL... 1 GETTING STARTED... 1 MODEL ASSUMPTIONS... 6 RESOURCE REQUIREMENTS FOR KEPH CONDITIONS... 14
Table 1 sets out national accounts information from 1994 to 2001 and includes the consumer price index and the population for these years.
 WHAT HAPPENED TO THE DISTRIBUTION OF INCOME IN SOUTH AFRICA BETWEEN 1995 AND 2001? Charles Simkins University of the Witwatersrand 22 November 2004 He read each wound, each weakness clear; And struck his
MATHEMATICAL LITERACY: PAPER II
 NATIONAL SENIOR CERTIFICATE EXAMINATION NOVEMBER 2012 MATHEMATICAL LITERACY: PAPER II Time: 3 hours 150 marks PLEASE READ THE FOLLOWING INSTRUCTIONS CAREFULLY 1. This question paper consists of: A question
South African Human Rights Commission
 South African Human Rights Commission Presentation on Strategic Plan and Annual Performance Plan to the Portfolio Committee on Justice & Constitutional Development 1 OUTLINE OF PRESENTATION PART A: OVERVIEW
STRATEGIC PLAN AND BUDGET 2013 TO 2016 MUNICIPAL DEMARCATION BOARD
 STRATEGIC PLAN AND BUDGET 2013 TO 2016 MUNICIPAL DEMARCATION BOARD BRIEFING TO THE PORTFOLIO COMMITTEE ON COOPERATIVE GOVERNANCE AND TRADITIONAL AFFAIRS 19 MARCH 2013 DELEGATION Mr LJ Mahlangu Chairperson:
BOTSWANA BUDGET BRIEF 2018 Health
 BOTSWANA BUDGET BRIEF 2018 Health Highlights Botswana s National Health Policy and Integrated Health Service Plan for 20102020 (IHSP) are child-sensitive and include specific commitments to reducing infant,
DIVISION OF REVENUE TO PROVINCES AND LOCAL GOVERNMENT
 DIVISION OF REVENUE TO PROVINCES AND LOCAL GOVERNMENT Presentation to Select Committee on Appropriations Presenter: Wendy Fanoe National Treasury 15 July 2014 Outline Outline of the key steps in the national
South African SMME Business Confidence Index Report: 2nd Quarter 2014
 ISSN 1811-5187 AFRICAGROWTH INSTITUTE Tel: (021) 914 6778 Fax: (021) 914 4438 www.africagrowth.com South African SMME Business Confidence Index Report: 2nd Quarter 2014 Compiled by: Africagrowth Institute
South African SMME Business Confidence Index Report: 4th Quarter 2013
 ISSN 1811-5187 AFRICAGROWTH INSTITUTE Tel: (021) 914 6778 Fax: (021) 914 4438 www.africagrowth.com South African SMME Business Confidence Index Report: 4th Quarter 13 Compiled by: Africagrowth Institute
Integrating climate risk assessment/management/drr into national policies, programmes and sectoral planning. G Midgley, South Africa
 Integrating climate risk assessment/management/drr into national policies, programmes and sectoral planning G Midgley, South Africa The national policy framework South Africa s Disaster Management Act,
SECOND QUARTER PERFORMANCE REPORT OF THE NATIONAL HOME BUILDERS REGISTRATION COUNCIL 1 JULY 2014 TO 30 SEPTEMBER 2014
 SECOND QUARTER PERFORMANCE REPORT OF THE NATIONAL HOME BUILDERS REGISTRATION COUNCIL 1 JULY 2014 TO 30 SEPTEMBER 2014 NATIONAL DEPARTMENT OF HUMAN SETTLEMENTS Contact Mr. Mongezi Mnyani Designation Chief
HEALTH BUDGET SWAZILAND 2017/2018 HEADLINE MESSAGES. Swaziland
 Swaziland HEALTH BUDGET SWAZILAND 217/218 Schermbrucker/ UNICEF Swaziland 217 HEADLINE MESSAGES The Ministry of Health was allocated E1.85 billion in the 217/18 Budget, representing 9.1% of the total Budget.
KAKAMEGA SOCIAL SECTOR BUDGET BRIEF
 KAKAMEGA SOCIAL SECTOR BUDGET BRIEF (2013-14 to 2015-16) Highlights In 2015-2016, county spent Ksh 9.9 billion, out of which 36 per cent was spent on social sector. Between 2013-2014 and 2015-2016, along
Initiative of National Department of Health to accelerate Health Infrastructure Service Delivery
 Initiative of National Department of Health to accelerate Health Infrastructure Service Delivery To manage the mentioned challenges, in 2010/11, Financial year, the National Department of Health (NDOH)
Submission on the Function Shift of Further Education and Training (FET)
") Submission on the Function Shift of Further Education and Training (FET) For an Equitable Sharing of National Revenue. 3 DECEMBER 2013 Financial and Fiscal Commission Montrose Place (2 nd Floor), Bekker
Submission on the Function Shift of Further Education and Training (FET) For an Equitable Sharing of National Revenue. 3 DECEMBER 2013 Financial and Fiscal Commission Montrose Place (2 nd Floor), Bekker
South African SMME Business Confidence Index Report: 1st Quarter 2016
 ISSN 1811-5187 AFRICAGROWTH INSTITUTE Tel: (021) 914 6778 Fax: (021) 914 4438 www.africagrowth.com South African SMME Business Confidence Index Report: 1st Quarter 2016 Compiled by: Africagrowth Institute
SECTION 2: OVERVIEW OF AUDIT OUTCOMES. Consolidated general report on national and provincial audit outcomes for
 SECTION 2: OVERVIEW OF AUDIT OUTCOMES 45 Consolidated general report on national and provincial audit outcomes for 204-5 Figure : Slight improvement in audit outcomes (all auditees) 7% (76) 28% (3) 26%
MFMA. Audit outcomes of municipalities
 0- Audit outcomes of municipalities 0- Reputation promise The Auditor-General of South Africa (AGSA) has a constitutional mandate and, as the Supreme Audit Institution (SAI) of South Africa, it exists
Stockouts: The legal framework
 Stockouts: The legal framework Sasha Stevenson 25 July 2013 The legal obligations to ensure the availability of essential medicines Constitution Legislation Regulations Policy 1 + The stockouts seen across
Modimolle Hospital Motivation
 Modimolle Hospital Motivation [1] November 2010 Modimolle Hospital Motivation Urban Econ Development Economists 1088 Pretorius Street, Hatfield, 0028 Tel: 012 342 8686 Fax: 012 342 8688 pta@urban-econ.com
An analysis of training expenditure in the Public Service sector
 March 2018 An analysis of training expenditure in the Public Service sector 1. Background and Introduction The Public Service sector in South Africa, comprised of the national and provincial government
Strategic Planning in District X, South Africa
 2015 Strategic Planning in District X, South Africa Mr. J., the Manager for the District X Health Department, described the current annual strategic planning process for his district: The National Department
Health Sector Strategy. Khyber Pakhtunkhwa
 Health Sector Strategy Khyber Pakhtunkhwa Health Sector Strategy-Khyber Pakhtunkhwa After devolution, Khyber Pakhtunkhwa is the first province to develop a Health Sector Strategy 2010-2017, entailing a
Biannual Economic and Capacity Survey. July December2017
 Biannual Economic and Capacity Survey July December2017 1 Firm distribution based on Annual Turnover (based on responses received) July December 2017 Full survey Category by gross annual income % of firms
The Product offerings differ from each other on the basis of the following criteria:
 blueprint2009 The BESTmed product offering The BESTmed product offering is extensive with seven options that meet the unique and individualistic healthcare needs of our members. We have taken great care
Quarterly medical scheme review
 Quarterly medical scheme review 2014 Quarter 1 The purpose of the quarterly medical scheme review is to give readers an overview of the performance of medical schemes which have been administered by Discovery
Have you appointed a Skills Development Facilitator (SDF)? Yes No N/A Name and Surname of SDF
? Yes No N/A Name and Surname of SDF") DISCRETIONARY GRANT APPLICATION 2017/18 NAME OF MUNICIPALIT/ENTITY SDL NUMBER POSTAL ADDRESS PHYSICAL ADDRESS CONTACT PERSON DESIGNATION TEL NO EMAIL FAX NO Target provinces (give learner breakdown in
DISCRETIONARY GRANT APPLICATION 2017/18 NAME OF MUNICIPALIT/ENTITY SDL NUMBER POSTAL ADDRESS PHYSICAL ADDRESS CONTACT PERSON DESIGNATION TEL NO EMAIL FAX NO Target provinces (give learner breakdown in
Quarterly Labour Force Survey
 Statistical release Quarterly Labour Force Survey Quarter 3, Embargoed until: 28 October 11:30 Enquiries: Forthcoming issue: Expected release date User Information Services Quarter 4 February 2009 Tel
Accountability for government spending: From the plan to the people
 Accountability for government spending: From the plan to the people 1 Plan-Do-Check-Act Cycle, also the Deming cycle, courtesy of the International Organization for Standardization 2 PLAN DO ACT CHECK
B e n e f i t O p t i o n s
 2018 Benefit Options 2018 What determines your decision to join a medical aid? At Selfmed we cut straight to the Is it the add-on s, you know the free gym membership and movie tickets or, is it the reliable
Capital flows in the health sector in South Africa: Implications for equity and access to health care
 Capital flows in the health sector in South Africa: Implications for equity and access to health care Yoswa M Dambisya and Sehlapelo I Modipa Health Systems Research Group, Department of Pharmacy, University
Performance reports. General report on the national and provincial audit outcomes for
 8 Performance reports 83 8. Performance reports Performance reports are a key accountability mechanism. In the performance reports, auditees report on whether they achieved the objectives that had been
REPORT OF THE SELECT COMMITTEE ON FINANCE ON THE PROVINCIAL TREASURIES EXPENDITURE REVIEW FOR THE 2014/15 FINANCIAL YEAR, DATED 14 OCTOBER 2015
 REPORT OF THE SELECT COMMITTEE ON FINANCE ON THE PROVINCIAL TREASURIES EXPENDITURE REVIEW FOR THE 2014/15 FINANCIAL YEAR, DATED 14 OCTOBER 2015 1. Introduction and Background The Select Committee on Finance
Health Economics Workshop: Costing Tools. Monisha Sharma, PhD International Clinical Research Center (ICRC) University of Washington
 University of Washington") Health Economics Workshop: Costing Tools Monisha Sharma, PhD International Clinical Research Center (ICRC) University of Washington Reminder: uses of cost data Priority setting for new interventions or
Health Economics Workshop: Costing Tools Monisha Sharma, PhD International Clinical Research Center (ICRC) University of Washington Reminder: uses of cost data Priority setting for new interventions or
WATERFALL BUSINESS ESTATE (WBE) ECONOMIC IMPACT ASSESSMENT
 ECONOMIC IMPACT ASSESSMENT") WATERFALL BUSINESS ESTATE (WBE) ECONOMIC IMPACT ASSESSMENT DR DIRK A PRINSLOO & DIRK NICO PRINSLOO August 2013 WBE: Economic Impact Assessment Objectives: To understand the Gauteng economic environment;
WATERFALL BUSINESS ESTATE (WBE) ECONOMIC IMPACT ASSESSMENT DR DIRK A PRINSLOO & DIRK NICO PRINSLOO August 2013 WBE: Economic Impact Assessment Objectives: To understand the Gauteng economic environment;
NATIONAL YOUTH DEVELOPMENT AGENCY ANNUAL REPORT PRESENTATION TO THE STANDING COMMITTEE ON APPROPRIATIONS DATE: 16 October 2013
 NATIONAL YOUTH DEVELOPMENT AGENCY ANNUAL REPORT 2012-2013 PRESENTATION TO THE STANDING COMMITTEE ON APPROPRIATIONS DATE: 16 October 2013 PRESENTATION OUTLINE A OVERVIEW OF NYDA 2012/2013 PERFORMANCE B
NATIONAL SENIOR CERTIFICATE GRADE 12
 NATIONAL SENIOR CERTIFICATE GRADE 12 MATHEMATICAL LITERACY P2 FEBRUARY/MARCH 2009 MARKS: 150 TIME: 3 hours This question paper consists of 11 pages and 2 annexures. Mathematical Literacy/P2 2 INSTRUCTIONS
Women in the South African Labour Market
 Women in the South African Labour Market 1995-2005 Carlene van der Westhuizen Sumayya Goga Morné Oosthuizen Carlene.VanDerWesthuizen@uct.ac.za Development Policy Research Unit DPRU Working Paper 07/118
Trends in Medical Schemes Contributions, Membership and Benefits
 COUNCIL FOR MEDICAL SCHEMES Number 2 of 2008 Prepared by the Office of the Registrar of Medical Schemes Trends in Medical Schemes Contributions, Membership and Benefits 2002 2006 May 2008 COUNCIL FOR MEDICAL
I n t r o d u c t i o n
 T he District Health Systems (DHS) across South Africa are the decentralised building blocks of the National Health System. The aim of the DHS is to have decisions made locally about services and resources.
2012 SALARY SURVEY Physio Therapy Salary Survey
 2012 SALARY SURVEY Physio Therapy Salary Survey QUESTIONNAIRE Practice Name: Name and designation of person completing the questionnaire: Practice / Professional Number: Contact Details Telephone Number
ECONOMIC GROWTH PROVINCIAL INTRODUCTION QUARTERLY DATA SERIES
 ISSUE 7 OCTOBER 2016 PROVINCIAL QUARTERLY DATA SERIES ECONOMIC GROWTH INTRODUCTION The Quarterly Economic Review is a statistical release compiled by the Eastern Cape Socio Economic Consultative Council
The status of performance management. Consolidated general report on the national and provincial audit outcomes
 4 The status of performance management 57 4. Annual performance reports Figure 1 provides an overview of audit outcomes on the APRs, the APRs submitted with no material misstatements (red line) and the
ACCESS TO THE HIGHEST QUALITY PRIMARY HEALTHCARE AT AFFORDABLE PRICES
 ACCESS TO THE HIGHEST QUALITY PRIMARY HEALTHCARE AT AFFORDABLE PRICES WELCOME TO ELIXI MEDICAL INSURANCE PURPLE PLAN - PRIMARY AND HOSPITAL CARE Elixi Medical Insurance aims to make private healthcare
MOMBASA SOCIAL SECTOR BUDGET BRIEF
 MOMBASA SOCIAL SECTOR BUDGET BRIEF (213-14 to 215-16) Highlights The Mombasa County spent Ksh 8.5 billion in 215-216, out of which 4 per cent was spent on social sector. The performance of the county in
GARISSA SOCIAL SECTOR BUDGET BRIEF
 GARISSA SOCIAL SECTOR BUDGET BRIEF (2013-14 to 2015-16) Highlights In 2015-2016, county spent Ksh 6.5 billion, out of which 41 per cent was spent on social sector. Efficient administrative practices has
REVIEW OF THE LOCAL GOVERNMENT EQUITABLE SHARE FORMULA
 T In partnership with: REVIEW OF THE LOCAL GOVERNMENT EQUITABLE SHARE FORMULA Parliament 19 February 2013 INTRODUCING THE NEW FORMULA Structure of the presentation 2 Background to the formula and review
Poverty: Analysis of the NIDS Wave 1 Dataset
 Poverty: Analysis of the NIDS Wave 1 Dataset Discussion Paper no. 13 Jonathan Argent Graduate Student, University of Cape Town jtargent@gmail.com Arden Finn Graduate student, University of Cape Town ardenfinn@gmail.com
Using the OneHealth tool for planning and costing a national disease control programme
 HIV TB Malaria Immunization WASH Reproductive Health Nutrition Child Health NCDs Using the OneHealth tool for planning and costing a national disease control programme Inter Agency Working Group on Costing
South Africa. UNICEF/Hearfield
 South Africa UNICEF/Hearfield Social development BUDGET SOUTH AFRICA 217/218 1 .2 % Real average annual rate projected growth of DSD budgets UNICEF/Bart de Ruigh Preface This budget brief is one of four
Presentation to SAMA Conference 2015
 Presentation to SAMA Conference 2015 NHI MODEL, RELATIONSHIP TO FINANCE AND ITS EFFECTS ON PUBLIC AND PRIVATE MEDICAL PRACTITIONERS Date: 19 SEPTEMBER 2015 Venue: Sandton Convention Centre Dr Aquina Thulare
LESOTHO HEALTH BUDGET BRIEF 1 NOVEMBER 2017
 @UNICEF/Lesotho/CLThomas2016 LESOTHO HEALTH BUDGET BRIEF 1 NOVEMBER 2017 This budget brief is one of four that explores the extent to which the national budget addresses the needs of the health of Lesotho
A universal health system for South Africa: a few final words on NHI. Di McIntyre Health Economics Unit University of Cape Town
 A universal health system for South Africa: a few final words on NHI Di McIntyre Health Economics Unit University of Cape Town U-turn to precipice National Advisory Committee on Consolidation of Financing
Summary of Risk Assessment for Blood Supply System Exposure
 Summary of Risk Assessment for Blood Supply System Exposure Background Information: Canadian Blood Services has established two wholly-owned captive insurance corporations, CBS Insurance Company Limited
Business Partners Limited SME Confidence Index
 Business Partners Limited SME Confidence Index Fourth Quarter of 2017: October December Issued February 2018 1 RATIONALE FOR THE BUSINESS PARTNERS LIMITED SME CONFIDENCE INDEX SMEs are often punted as
UNPACKING INFRASTRUCTURE DEVELOPMENT SPENDING IN LOCAL GOVERNMENT
 UNPACKING INFRASTRUCTURE DEVELOPMENT SPENDING IN LOCAL GOVERNMENT MUNICIPAL INFRASTRUCTURE SUMMIT 25 MAY 2015 OUT LINE Municipal Infrastructure Matrix Access to Basic services backlogs Capital Budget Funding
Universal Health Coverage Assessment. Republic of the Fiji Islands. Wayne Irava. Global Network for Health Equity (GNHE)
") Universal Health Coverage Assessment Republic of the Fiji Islands Wayne Irava Global Network for Health Equity (GNHE) July 2015 1 Universal Health Coverage Assessment: Republic of the Fiji Islands Prepared
Universal Health Coverage Assessment Republic of the Fiji Islands Wayne Irava Global Network for Health Equity (GNHE) July 2015 1 Universal Health Coverage Assessment: Republic of the Fiji Islands Prepared