Programme Assessment/Review/Mid-Term Eval.
|
|
|
- Joella Richardson
- 5 years ago
- Views:
Transcription
 Country, Locality(s), Priority")


 Overall Duration (24")
1 UN Joint Programme on Climate Change ANNUAL PROGRAMME NARRATIVE PROGRESS REPORT REPORTING PERIOD: 1 JANUARY 31 DECEMBER 2016 Programme Title & Project Number Programme Title: Support To Low Carbon Climate Resilient Development For Poverty Reduction In Kenya Programme Number : MPTF Office Project Reference Number: Participating Organization(s) Country, Locality(s), Priority Area(s) / Strategic Results 1 Kenya, Africa Priority area/ strategic results UNDAF Outcome 3.2. Outcome 3.2. Enhanced environment management for economic growth with equitable access to energy services and response to climate change. Implementing Partners UNDP, UNEP, UN-HABITAT, UN-ILO and UNESCO. Programme/Project Cost (US$) Total approved budget as per project document: 1,266,000 JP Contribution 3 : DFID = 1,777, USD Agency Contribution UN Agencies = 102, Ministry of Environment, Water and Natural Resources (MEWNR), Ministry of Devolution and Planning, The National Treasury, Ministry of Energy and Petroleum, Ministries of Labour, Social Security and Services; Ministry of Industrialization and Enterprise Development; Ministry of Land, Housing and Urban Development; and the Kenya Renewable Energy Association (KEREA) Overall Duration (24 months) Start Date 4 (1 st March 2014) Programme Duration Original End Date 5 (31 st December 2016) Current End date 6 (31 st March 2017) TOTAL: 1,880, Programme Assessment/Review/Mid-Term Eval. Assessment/Review - if applicable please attach Yes No Date: dd.mm.yyyy Mid-Term Evaluation Report if applicable please attach Yes No Date: dd.mm.yyyy Report Submitted By o Name: Geoffrey OMEDO o Title: Programme Officer o Participating Organization (Lead): UNDP o address: Geoffrey.omedo@undp.org 1 Strategic Results, as formulated in the Strategic UN Planning Framework (e.g. UNDAF) or project document; 2 The MPTF Office Project Reference Number is the same number as the one on the Notification message. It is also referred to as Project ID on the project s factsheet page the MPTF Office GATEWAY 3 The MPTF or JP Contribution, refers to the amount transferred to the Participating UN Organizations, which is available on the MPTF Office GATEWAY 4 The start date is the date of the first transfer of the funds from the MPTF Office as Administrative Agent. Transfer date is available on the MPTF Office GATEWAY 5 As per approval of the original project document by the relevant decision-making body/steering Committee. 6 If there has been an extension, then the revised, approved end date should be reflected here. If there has been no extension approved, then the current end date is the same as the original end date. The end date is the same as the operational closure date which is when all activities for which a Participating Organization is responsible under an approved MPTF / JP have been completed. As per the MOU, agencies are to notify the MPTF Office when a programme completes its operational activities. Page 1 of 33
2 ACRONYMS AND ABBREVIATIONS AWP Annual Work Plan CIDP County Integrated Development Plan CPEBR Climate Public Expenditure and Budget Review DaO Deliver as One DFID UK Department for International Development GoK Government of Kenya ILO International Labour Organization KARA Kenya Alliance of Residents Association KEREA Kenya Renewable Energy Association LPAC Local Project Appraisal Committee MEWNR Ministry of Environment, Water and Natural Resources MoDP Ministry of Devolution and Planning MoF Ministry of Finance MTEF Medium Term Expenditure Framework MTP II Medium term Plan NamSIP Nairobi Metropolitan Services Improvement Project NIMES National Integrated Monitoring and Evaluation Strategy NMT Non-Motorized Transport NuTRIP National Urban Transport Improvement Project OGL Off-Grid Lighting Products SUMP Sustainable Urban Mobility Plan (SUMP) NCCAP National Climate Change Action Plan UNDAF United Nations Development Assistance Framework UNDP United Nations Development Programme UNEP United Nations Environment Programme UNESCO United Nations Educational, Scientific and Cultural Organization UNIDO United Nations Industrial Development Organization Page 2 of 33
3 EXECUTIVE SUMMARY The UNDP Kenya Country Office, in collaboration with UNEP, UN-HABITAT, UN-ILO, UNIDO and UNESCO are working with the Government of Kenya under a Joint Climate Change Project titled Support to Low Carbon Climate Resilient Development for Poverty Reduction in Kenya. This project funded by the UK Department for International Development (DFID). This project was designed in recognition of the impacts of climate change across all the key sectors in Kenya, because of its geography and reliance on rain-fed agriculture, pastoral livestock production systems and tourism which are all heavily dependent on nature. By combining the skills and resources of UN Agencies active across the country and by jointly addressing key development issues alongside others, the UN Agencies are jointly working to complement the efforts of Government, civil society, the private sector and other development partners, using available resources as judiciously as possible and reinforcing the leadership of other actors through technical support and modest financial contributions. The UNDP Multi-Partner Trust Fund Office is the Administrative Agent of the Joint Programme. This report covers the activities across all the five outcome areas for the January December 2016, which is the third year of activities in the project. Key summaries of the main activities are shown below: I. Purpose To support Kenya transition to a low carbon climate resilient development pathway reducing the country's vulnerability to climate risk and improving livelihoods while contributing towards the global efforts to reduce green-house gases emissions. In addition, the Project seeks to actualize the UN s commitment of Delivering as One, aptly captured in the United Nations Development Assistance Framework (UNDAF) for Kenya under Outcome 3.2. Enhanced environment management for economic growth with equitable access to energy services and response to climate change. The Joint Project utilizes the specialized niches of the 5 UN agency partners (UNDP, ILO, UNEP, UNHABITAT, and UNESCO) to achieve the following: 1. Output 1: Pro-poor CC adaptation and mitigation mainstreamed in national and sub-national planning and budgeting processes (UNDP/UNEP) 2. Output 2: Renewables and sustainable biomass production promoted in Arid and semiarid Lands (UNDP/KEREA) 3. Output 3: Green buildings are promoted in the construction sector with associated benefits for employment, environmental improvement, social equity and economic prosperity (ILO) 4. Output 4: Low carbon transport is included in the on-going urban planning processes and national policies are developed to promote importation of cleaner, more fuel-efficient vehicles in Kenya (UNHABITAT/UNEP) 5. Output 5: Governance reforms in the wildlife sector contribute to reducing illegal wildlife trade in Kenya (UNEP/UNESCO) II. Results The UN Joint Programme on Climate Change formally begun activities in November 2014, when the actual funds released by the donor, DFID, were received. The agencies have therefore now had two full years of project implementation, and are now focused on Project Closure. The project was to end on 31 st December 2016, but the final Project Steering Committee (PSC) meeting recommended a no-cost extension of 3 months to allow for closure related activities, such as Terminal Evaluation activities. The Project has also successfully undergone its once-in-a-lifetime Nationally Implemented Project (NIM) Project UNDP Audit, an exercise that was undertaken by Baker Tilly Meralli Audit firm. The Audit Report is provided as Annex 9. Page 3 of 33
4 As we gear up for closure, it is important to note here that all the UN Agencies have delivered good results so far, and the project activities have spurred more developments, and generation of some resources to support the sustainability of the project activities. For a project that only cost a total of 1,100,000 USD in DFID funding, the breadth, scope and transformational nature of the project deliveries is impressive. The work streams have touched many areas of Kenya s National Climate Change Action Plan, ranging from budgeting and planning at national and county levels, monitoring and evaluation systems, sustainable biomass production and use, forestry, renewable energy streams such as solar, green buildings and green jobs, sustainable transport, urban mobility and planning, wildlife crimes and livelihoods among many other areas. With the ascension of the Climate Change Act 2016 into law by Kenya s President in 2016, much of the achievements under this project will inform the future development of the climate change terrain in Kenya. The UN Agencies will continue being at the forefront of supporting the country adapt and mitigate effectively to the impacts of climate change. We capture below some of the key results recorded in the narrative report below. i) Narrative reporting on results: 1 st Outcome 1. UNDP/UNEP: Outcome 1 Pro-Poor Climate Change Adaptation and Mitigation Mainstreamed in National and Sub-National Planning and Budgeting Processes In the 2016 reporting period, activities in this outcome area were geared towards supporting the Ministry of Environment, Water and Natural Resources (MEWNR); the Ministry of Devolution and Planning (MoDP); and the National Treasury (TNT) to integrate climate change finance into the planning, budgeting and monitoring processes. The activities also covered all the 47 Counties and specific pilots in a select number of counties. The new County Governments (that resulted from the radical shift in governance structures from centralized to devolved governance, as encapsulated under the Kenya Constitution 2010) also benefited from capacity building, in the subject of climate change mainstreaming in the County Integrated Development Plans (CIDPs), County Spatial Planning Framework and basic Monitoring and Evaluation. Key areas of intervention, for UNDP/UNEP under this outcome area are to influence the planning, budgeting and monitoring processes of the MDP and National Treasury to be climate change sensitive, and to also evolve new methodologies and means of establishing climate finance in the context of Kenya s budgeting and expenditure cycles. Key activities and achievements during the reporting period include: 1. Finalization of Kenya s 1st Climate Public Expenditure and Budget Review (CPEBR). The report is awaiting launch by the Government, but is currently available on the UNDP website. (Report is Annex 1 but also accessible at ). 2. Finalization of the Budget Coding work, a linkage to the Climate Public Budget Expenditure work, for ease of future tracking of climate related expenditure once the Standard Chart of Accounts (8) is included in the Integrated Financial Management Systems (IFMIS). 3. The CPEBR and Budget Coding studies, as well as the Climate Finance work were specifically mentioned in Kenya s Budget Policy Statement for 2017/2018. It is clear that as a result of this work, Kenya s Ministry in charge of Treasury is now more empowered to support mainstreaming of climate change within the budgeting, sector planning and finance processes (The Budget Policy Statement is provided as Annex 2 but is also accessible at 4. Supporting Kenya s climate change governance instruments (The Climate Change Act 2016, Climate Finance Policy advancements, Intended National Contributions work etc) to inform future planning and climate change management. Page 4 of 33
5 5. Supporting the mainstreaming of critical Mid Term Plan Evaluation instruments (1. The National Handbook of MTP Evaluation Indicators; 2. The County Specific CIDP Indicator Handbooks; 3. Mainstreaming Guidelines; 4. The National Handbook Metadata Guidelines). 6. Leveraging on the Kenya Devolution Support Project, climate change mainstreaming work within the national and county planning and budgeting framework was undertaken within the Quarter (Report available on request). This work will translate in the full mainstreaming of climate change (adaptation and mitigation) within the 3rd Medium Term Plan (starting this year), and within the Guidelines for the 2nd generation CIDP s. A national planning framework climate change sensitization workshop was held in September Sustainability Plans The support to Kenya s climate finance policies and tracking tools has proved useful in enhancing Kenya s readiness to access the Green Climate Finance (GCF) resources in support of adaptation and mitigation activities. The National Treasury has since established a full-fledged GCF Secretariat within its Ministry to upscale the Climate Finance Policy work, and the CPEBR and Budget Coding work. This is a sustainable mechanism of embedding this work in the national institutions. For the mainstreaming work undertaken with the Ministry of Devolution and Planning, UNDP co-financed more resources under the Kenya Devolution Support Project, which will upscale mainstreaming work in government. Two UNV s have since been recruited and placed within the Ministry of Devolution and Planning and at the Council of Governors to continue this work, well beyond the project period. 2 nd Outcome 2 UNDP: Outcome 2 Renewables and sustainable biomass production promoted in Arid and semiarid Lands (UNDP/KEREA) Through the UNDP supported work, collaboration with the Kenya Forestry Research Institute (KEFRI) and the Kenya Renewable Energy Association (KEREA) has resulted in several transformative developments. For solar PV products and technicians, the design, development and running of a mobile phone based platform for good quality solar PV products vendors and accredited technicians enhanced access by customers to these vital services. KEREA s partnership with another StARCK+ partner Kenya Association of Manufacturers (KAM) and the Kenya Climate Innovation Centre (KCIC) availed accredited technicians in sola P for use on the same platform (*860#). Submission of Kenya s NAMA Report on sustainable charcoal to the NAMA facility Board. The NAMA for Kenya is a proposal to the NAMA Facility on how Kenya can manage the challenges around charcoal extraction and use in Kenya (Kenya NAMA Attached as Annex 3). The comprehensive report that reviews the sustainability of charcoal as a NAMA for Kenya is attached as Annex 4. In the sustainable biomass energy arena, continued production of charcoal has been acknowledged as a major driver for deforestation in Kenya. Working with KEFRI, all the Charcoal Producer Associations in Kwale and Taita Taveta Counties were trained on energy efficient charcoal production kilns. This work has also led to the formation of a National Federation of Charcoal Producer Associations, an important national lobby group that will enhance the strengthening of charcoal governance architecture in Kenya (Annex 5 Registration Certificate for the new Federation of Sustainable Charcoal Producers of Kenya). On the regulatory and policy development front, the work in charcoal supported the revision and enactment of the Charcoal Forests (Charcoal Production, Transportation and Marketing) Rules, UNDP also received some co-financing from the AusAID, that was used to support one of the Counties, Narok County to prepare its Environment Bill, which is set to be approved in 2017 (Annex 6 The Draft Narok Environment Bill 2016). ( Page 5 of 33
, and the Kenya Forestry Service), sustainability of this initiatives will be achieved through the capacity building of")

6 Figure 1: News article on Narok Environment Bill 2017 and the Certificate of Registration of Kenya's 1st Charcoal Producers Federation Sustainability Plans Through working with national institutions (The Ministry of Environment, the Kenya Forestry Research Institute (KEFRI), and the Kenya Forestry Service), sustainability of this initiatives will be achieved through the capacity building of government staff through the project. KEFRI and KFS will sustain work on sustainable charcoal, since the regulatory and policy framework is now in place. To ensure sustained actions, the registration of the National Charcoal Producers Federation will provide an alternative voice for the local communities to pressure reforms within the sector, well beyond the project period. Although Kenya s Charcoal NAMA on sustainable charcoal was unsuccessful at the NAMA Facility Board, the elements of the NAMA are being included in a large biomass project to be submitted by UNDP on behalf of the Ministry of Energy to the Green Climate Fund (GCF). 3 rd Outcome 3. ILO (Lead) with UNEP & UNHABITAT: Output 3: Green buildings are promoted in the construction sector with associated benefits for employment, environmental improvement, social equity and economic prosperity (ILO) The initiatives on Green Buildings led by ILO have unlocked the green jobs creation potential of Kenya s building construction industry by enhancing the competitiveness of MSMEs based on principles of sustainable enterprises that balance economic, social and environmental objectives. It has promoted the use of green building materials during construction as well as encouraged energy and water efficiency during the operation and maintenance life cycle phase of the buildings or houses in Kenya. During the reporting period, the key features that have governed this output have been: i. Working on a market driven approach towards renewable energy sources and local green products/services for construction (through agglomeration effects that is achieved very well in the building and construction sector). ii. Devolution has provided local area opportunity and experience to collaborate and impact a wider spatial level. The output has experienced working with intermediate towns & cities during the reporting period i.e. Narok, Kajiado, Nyandarua and Kakamega. iii. Working on climate change actions towards increased appreciation of green building principles and refined industry framework promoting green building material which leads to more and better Jobs in a well-established Page 6 of 33
7 iv. green building sector economic growth through agglomeration effect so far (low cost housing, green schools and green markets). Reduce vulnerability to shocks: Achieve transformational change, resilience and adaptation in the building construction industry, through innovation in the deployment of sustainable and low-carbon construction methods, local value addition, and greater energy efficiency, the promotion of sustainably harvested timber, water conservation and waste minimization, along with local employment creation. Key Results ILO has been successful in achieving several media/publicity campaigns on green building principles, products, technologies and methods and we have successfully managed to reach more than 50,000 persons through these campaigns. Certainly, these media campaigns will not cease even after reaching the required numbers. The output s social media twitter handle is currently with over 1400 followers. The tweets have received numerous retweets and responses by influential leaders, UN agencies, multilateral partners, relevant green building ambassadors, construction institutions and/or organizations as well as regular individuals with personal accounts. In creating market uptake for the eco-manyatta as well as renewable energy products for green building, ILO forged a partnership with Kenya Television Network s (KTN s) Property Show to show case the same to create market demand. The show regularly gives Kenyan s an in-depth overview of the property market, preview of the hot properties available to buy for investments, information from experts, a glimpse into home accessories, tips and trends. This KTN s premier Property Magazine Show airs on Sundays from 5.30pm to 6.30pm. It continues to reach over 200,000 viewers every week both in East Africa and the Diaspora market. The aired shows are available online as below: The engagement with a media partner (Standard Newspaper) Home and Away Wednesday pull-out magazine was secured and stories on green building principles have been running on this segment. The inputs have been organized by UNHABITAT in conjunction with UNEP and ILO. The Standard had an average reach of 2,223,500 people per day. See some of the stories available online as below: The E4i premier business competition (sponsored by Standard Newspaper) held severally in 2015 and 2016 with ILO sponsoring the green economy (specifically green buildings category) massive media attention was given to the event (1-month prior) with TV and newspaper advertisements in KTN and Standard Newspaper respectively. Public awareness campaigns on green building principles have been undertaken by ILO through various opportunities such as validation workshops, partners forums, retrofitting/building ideas and business competitions. The Page 7 of 33
 visit on May 28th - 14mins - https://www.youtube.com/watch?")
8 eco manyatta green building revolution is one business case/awareness materials which has been captured to showcase green building principles within the pastoralist communities and on national television to all Kenyans as well. Eco Manyatta feature Documentary that includes Dr Turner's (British High Commissioner) visit on May 28th - 14mins - Eco Manyatta Launch Event on June 9th - 8mins- Photos of the launch 9 June 2015: hkey=%21ajmcujlmij-1h_g On influencing policies in green building, collaboration with UNEP is playing a lead role in the drafting of national and county policy frameworks on green buildings. It has supported the drafting of recommendations towards the revision of the national policy framework on green buildings in The project has identified opportunities (partnerships with developers) for the development of demonstration units as below: The evolution of the eco manyatta concept ILO has also rolled out several entrepreneurial approaches in the greening (retrofitting) of school building and amenities as well as greening of the marketplace spaces throughout Kenya. The eco manyattas, green schools and green soko s ventures will be promoted by ILO within the various communities who will also receive capacity building with the aim of creating jobs and/or self-employment ventures that contribute to a more sustainable environment (green jobs). The output has collaborated and created synergies with the private sector, county governments and other business support providers to promote skills for green jobs, access to finance, markets, business linkages and BDS targeting various groups. Types of jobs that are created in green building and retrofitting processes including block/brick making, masonry skills, biogas and solar energy units installation and maintenance skills, water tank installation and pipe fitting as well as general construction. These work experiences, among others, will offer a pathway to employment through skills development and on-the-job training and experience. These jobs going forward will be created during the initial construction or investment periods and will be especially beneficial for the targeted counties in addressing the issue of high unemployment. ILO aims at dividing trainees into age and gender cohorts to ensure that gender and youth employment targets are achieved. Page 8 of 33

9 Lessons, and Challenges ILO certainly is grateful and embraces these lessons positively as scaling up of this pilot project is certainly a reality in 2017 and beyond: We have created expectations on the ground without any hope of additional funding to carry out further work. This has been an anti-climax to all our partners on the ground. The project document as pertains this outcome did not define whether this outcome should take a rural or urban approach. The lesson learnt from a pilot project implementation perspective was to obtain clear interpretation of results (rural-urban balance) from the donor or contracted donor evaluator at the very beginning. Through the years, in various piloted projects with this being no exception, there has existed insurmountable precariousness to such interpretations. Often we find that the harsh reality on the ground dictates the course of a project in a major way especially where sustainable green job creation matters are in play. This reality is even more so experienced in pilot projects and prototype creations as per the definition of a pilot ; and a prototype as done as an experiment or test before introducing something more widely and typical or preliminary model of something, from which other forms are developed or copied. Sustainability Plans ILO has also held several local focus groups and interview engagements to establish a mechanism for the local rural pastoralist families to afford these homes. Through several brainstorming sessions ILO has now designed an initiative dubbed Lighting up 100,000 Homes to Create 100,000 Green Jobs in collaboration with the private sector (SUNLITE) which helps the scale-up of the project achieve the affordability of the green manyattas for a basic rural family as well as create livelihoods through innovative financing of off-grid solar lighting solutions. This initiative when funded is targeting women cooperative movements in the pastoralist communities. Page 9 of 33
10 4 th Outcome 1. UNHABITAT/UNEP: Low carbon transport is included in the on-going urban planning processes and national policies are developed to promote importation of cleaner, more fuel-efficient vehicles in Kenya UNEP Component: The National Climate Change Action Plan recognizes Kenya s transport sector as a major climate change contributor. Planning and implementing low-carbon transport strategies will support the country s aspiration to become a low carbon climate economy while also addressing poverty and promoting sustainable development. Non-motorized transport facilities in major urban areas are inadequate despite much of trips being on foot, estimated at 47% in Nairobi. At the same time, the vehicle fleet growth is estimated at 10% annually. Lack of stringent vehicle import standards and fiscal incentives to attract the import of cleaner, more fuel-efficient vehicles has resulted to increasing transport emissions. Through this project, UN Environment could realize two key goals towards promoting low carbon transport solutions. Nairobi County Government through the Kenya Alliance of Residence Associations (KARA) was supported to develop the first ever Non-Motorized Transport (NMT) Policy through a stakeholder-consultative process. The Policy was launched on 17th March 2015, with the County Government committing to allocate 20% of its regular road construction budget to NMT infrastructure. Further, it was confirmed that the County had already set apart 18.2% of the road budget for NMT infrastructure in The Policy will act as a catalyst for the creation of safe, cohesive and comfortable network of footpaths, cycling lanes and tracks, green areas, and other support amenities. It will also spearhead the introduction of laws and regulations to ensure that NMT facilities and areas are prioritized. This is the first time that such as significant and clear percentage of spending has been allocated to improving NMT infrastructure both in Nairobi and in Kenya. The project also supported the Kenyan Government to develop policies to promote the import of cleaner, more fuelefficient vehicles. Through the Energy Regulatory Commission (ERC), a feebate tax system and vehicle labelling scheme for Kenya were developed. Feebates are essentially a fee on inefficient vehicle technology and a rebate on efficient vehicles. Feebates are thus a fiscal policy to encourage car buyers to prefer more efficient, lower emission vehicles. A fee of Kshs. 1,500 was proposed for every additional gram of CO2/km above the threshold gco2/km and gco2/km. The reverse could happen for low carbon vehicles or alternatively the same fee could be imposed to replace the excise duty. Three types of fuel economy labels were also prepared to promote consumer awareness and influence consumer choice towards import of fuel efficient vehicles. A regional workshop was held on 12th May 2016 to disseminate the proposed policies. At the workshop, the government gave its commitment to support cleaner vehicle importation. Parts of the proposals have been implemented (higher duties for vehicles older than 3 years). The full proposal is currently being considered for inclusion in the country s policies. During the reporting period, the key features that have governed this third output have been: The project contributed to the development of a policy framework to stimulate Non-Motorized Transport (NMT) investment in Nairobi and preparation of fiscal and consumer vehicle labelling guidelines to promote importation of cleaner, fuel efficient vehicle in Kenya. The gains realized under each of the components are as follows: Page 10 of 33
11 I. Non-Motorized Transport Policy for Nairobi: Nairobi County Government was supported through the Kenya Alliance of Residence Associations (KARA), to develop a Non-Motorized Transport (NMT) Policy and an investment matrix for NMT prioritization. An initial stakeholder consultative process organized together with the Nairobi County Government was held on 17th December 2014 to initiate the policy development process, and build stakeholder consensus on a framework that would form the basis of the draft policy. This support culminated in the launch and adoption of the NMT Policy for Nairobi on 17th March The launch was hosted by Mr. Mohamed Abdullahi, County Executive - Roads, Public Works & Transport, on behalf of Dr. Evans Kidero, Governor of Nairobi City County. During the Policy launch, the County made a commitment to allocate twenty percent (20%) of all road construction funds from 2015 onwards to NMT infrastructure and facilities. This is the first time that such a significant and clear percentage of spending has been allocated to improving NMT infrastructure both in Nairobi and in Kenya. The NMT policy is expected to result to: increased modal share of walking from 47 to 50 percent for trips up to 5km by 2025 increased modal share of cyclists from 2 to 10 percent for trips up to 15km by 2025 reduced pedestrian fatalities from 500 to 50 or less by 2025 reduced cyclists fatalities from 20 to 5 by 2025 NMT being a mode of choice for diverse incomes groups. The Policy was further disseminated through a series of stakeholder consultation sessions over a four-month period, including a specific workshop for civil society representatives. These stakeholder sessions explored the NMT realities for people walking and cycling in Nairobi and the possible solutions. The sessions were complimented by a social media campaign to take on board views of those not attending the face-to-face sessions. For more information see: II. Cleaner Vehicles: The second component of the project aimed at supporting the Government to improve the average fuel economy of the vehicle fleet in Kenya, also measured through vehicle CO2 emissions. The Energy Regulatory Commission (ERC), mandated to oversee energy efficiency policies and programs in Kenya, was supported to develop a feebate tax structure and vehicle labelling scheme. Prior to this support, UN Environment, through the Global Fuel Economy Initiative (GFEI) project, had supported Kenya to carry out a vehicle inventory study to establish the country s average fuel economy and CO2 emissions trends. The study showed that the fuel economy of vehicles imported into Kenya was getting worse: from an average of 178 g/km in 2010 to 185 g/km in 2012 see table below. At this rate, light duty vehicles (LDVs) were estimated to emit a total of 717 thousand tonnes of CO2 in The projection in total LDVs registration is expected to reach 5 million vehicles in 2030 and 8.7 million vehicles in 2050 from the 2 million vehicles registration in Average CO2 Emission (g/km) and Average Fuel Consumption in L/100km Year Average fuel consumption metric combined (L/100km) Average CO2 emission (g/km) Grand Average The full report is available at: Page 11 of 33
 per gco2/km was proposed above/below the benchmark of 169.00-169.99 gco2/km.")
12 The draft feebate and vehicle labeling proposals were presented to stakeholders on 12th May Based on data analysis, the country s average CO2 emission was gco2/km. A fee/rebate of Kshs. 1,500 (USD 15) per gco2/km was proposed above/below the benchmark of gco2/km. A vehicle labeling system to promote consumer awareness towards choosing more fuel economy vehicles was also proposed. Three types of labels were developed that would assist consumers understand the cost implications of the vehicle over its lifetime. At the workshop, the Government gave its commitment to support importation of cleaner vehicles. Prior to the policy dissemination workshop, UN Environment and the ERC had organized a media breakfast meeting to present the GFEI vehicle inventory findings in April The event was officiated by the Principal Secretary of the Ministry of Energy and Petroleum - Eng. Joseph Njoroge, the former Director General of the ERC -Eng. Joseph Nganga and Rob de Jong of UN Environment. Following the media briefing, the Government revised the excise duty for newly imported vehicles based on the age of the vehicle. The excise duty which was initially at a flat rate of 20% of the value of the car was amended to a differentiated rate of Kshs. 200,000 for vehicles older than 3 years and Kshs. 150,000 for vehicle s less than 3 years of age. For more information see: Challenges Even though Nairobi County Government has formally launched the NMT Policy, the Policy is yet to be enacted by the County Assembly. It has gone through the 1st and 2nd reading and there is likelihood of a delay in its enacted if not passed before elections. It is also difficult to ascertain the actual budget earmarked for NMT investment despite the County Government committing 20% of road infrastructure budget to NMT. On import of cleaner, fuel efficient vehicles, the Kenyan Government had rushed to implement the excise duty amendments based on vehicle age and not fuel economy. Although this amendment was meant to be a disincentive for the purchase of older cars, it solicited public resistance as it was viewed to be imposing a higher tax on older, low-cost and maybe more fuel economy vehicles. The challenge was that newer, less fuel-efficient cars had lower taxation. In the subsequent budget the tax was reviewed. The Government also saw a drop-in government revenues resulting from a decrease in the number of car import because of the changes in the excise duty. Lessons Stakeholder engagement and consultations are critical for policy discussions and change. Clear benefits of the proposed policies need to be demonstrated to the public and policy makers. Media and consumer awareness campaigns help to sensitize and informed consumer choices. It is important that the proposed policies do not impact negatively on government revenue. Thus extensive costbenefits analysis need to be carried out. Policies are not static and need to be regularly reviewed, especially vehicle fuel economy policies, to match market changes. Sustainability Plans In November 2015, the Nairobi County Government announced that it had earmarked 18.2% of its annual road construction budget (Kshs.558 million) for NMT infrastructure and facilities a great step towards their 20% target. Also since the launch of the Policy, Nairobi County Government and the National Ministry of Transport have reaffirmed the mandatory inclusion of NMT facilities for all new road construction and there is a recommendation to upscale the NMT policy to national level. Page 12 of 33
13 The feebate scheme and fuel labeling proposals were later presented to high level meetings for consideration for adoption as national policies. Dissemination of the policy proposals will continue in the coming year. There are good examples in Africa of countries that have implemented similar policies. A country like Mauritius that adopted a feebate tax system and 3-year import age restrictions has seen significant improvement in vehicle fuel economy from 186 g/km in 2005 to 145 g/km in UNHABITAT Component The objective of this output is to move towards low-carbon road transport in Kenya. The project would employ an Avoid- Shift- Improve approach including; a) Avoid: the demand for motorized travel through compact city design; b) Shift: shift to less carbon-intensive modes of transport; and c) Improve: adopt cleaner, more fuel-efficient light and heavy duty vehicles. UN Habitat s component focused on supporting the Kenyan Government address improved policies and plans which support sustainable transport with the resultant outcome of a healthier environment for urban residents which also contributes to reduced greenhouse gas emissions. The project directly relates to the SDGs Goal 11: Make Cities safe, resilient and sustainable and specifically to Target 2 By 2030, provide access to safe, affordable, accessible and sustainable transport systems for all, improving road safety, notably by expanding public transport with special attention the needs of those in vulnerable situations, women, children, persons with disabilities and older persons. SDG 3 good health and wellbeing and SDG 13. UN Habitat assisted the County Government of Kiambu to develop a Sustainable Urban Mobility Plan (SUMP) for Ruiru town one of the small towns in the Metropolitan Area of Nairobi that is facing rapid population growth. The project sought to demonstrate how fast-urbanizing smaller towns near larger cities can benefit from a better planned approach to improve accessibility of people to goods, services, places of employment, amenities and overall urban opportunities. The project illustrates a people-centered approach to transport planning, demonstrating a well-planned mobility solution for a growing city. The methodology has potential to be replicated to other cities in Kenya. Through consultative and participatory planning sessions, the project has created awareness and encouraged adoption of sustainable transport solutions amongst policy makers, stakeholders in transport and the public. The main result has been the final SUMP report which has been endorsed by Cabinet members at the County level. The proposed interventions will be included in the County s fiscal strategy paper for the 2017/2018 fiscal year. With co-funding the process has identified a pilot project that will benefit from additional technical support and will be implemented by the World Bank through the Nairobi Metropolitan Services Improvement Project NaMSIP. High level impacts include incorporation of the sustainable mobility strategy in the national planning process for urban cities through the Nairobi Metropolitan Transport Authority - NAMATA. Another anchor for this initiative is the World Bank Funded Sub-Saharan Africa Transport Policy Programme - SSATP which is supporting urban mobility in selected African countries including Nairobi. The lessons learnt out of the SUMP are being shared with them to illustrate a successful case study which should be disseminated to other African cities and governments. These partnerships together with the County s continued engagement with stakeholders will ensure that the sustainable mobility agenda progresses into more programmatic approaches in the county. Main Results Sections Page 13 of 33

14 The partnership with the University of Nairobi Institute for Development Studies (IDS), benefitted from a multidisciplinary team of experts who supported the entire process. IDS conducted data collection in the project area comprising of travel surveys, traffic counts and key informant interviews. A Situational Analysis report was developed and findings from the surveys presented during a meeting that was held with the Ruiru sub County staff. In collaboration with the Institute for Transportation and Development Policy ITDP, an Urban Street Design workshop was held in March The workshop brought in best practice from both developed and developing countries and provided an opportunity to plan for two sites in Ruiru. Participants analyzed existing conditions and prepared design proposals for two sites: the Ruiru town centre and the area near the Devki Steel Factory. Key proposals from the workshop participants included the development of new social spaces; the provision of dedicated facilities for pedestrians and cyclists; the implementation of traffic calming measures, greening of some public spaces; relocation of the bus park and other public transport priority measures. The designs from the workshop were synthesized by experts and some of the ideas will be used when developing improved streets in central Ruiru. Through consultative and participatory planning sessions, the project created awareness and support the implementation of sustainable transport solutions amongst policy makers, stakeholders and the public. Data collection activities included compilation of background information; assessing the planning framework of existing and future transport situation as well as the institutional setting in Ruiru vis a vis the larger metropolitan area. The study confirmed that walking and cycling paths in Ruiru town are inadequate, limited connectivity and there is absence of parking facilities for bicycles. The drafting of the Sustainable Urban Mobility Plan was finalized and presented at a validation workshop in November Endorsement by Cabinet in January 2017 will ensure that the implementation finds traction in the coming financial year. Proposed measures include the following: Enhance connectivity and integrate transport with land use: This intervention addresses the aspect of missing links and additions to the existing networks to encourage better linkage of activity areas. Measures will consider more rational mobility patterns such as shorter routes, and provide appropriate transport networks for various categories of land uses. Provide dedicated lanes for NMT: This is shown in green on Map 3. Interventions entail provision of separate lanes for the exclusive use by non-motorized transport modes. This will enhance the safety of NMT users and eliminate conflict between motorized and non-motorized transport. Improvement of informal business premises: Informal business lining the pedestrian precincts should be improved in terms of site layout, construction fabric, and site management interventions. The resultant outcome Page 14 of 33

15 will be business activities organized in a cleaner and aesthetically pleasant environment with adequate provision for pedestrian traffic. Redistribute/restrict light industrial activities to dedicated clusters: Unlike informal retail businesses, light industrial activities should be relocated away from pedestrian walkways. Define and secure crossing levels: Crossing levels should be synchronized with the traffic flow and will be clearly marked and accompanied by traffic calming interventions to reduce automobile-related accidents. Improvement of street infrastructure: All worn out infrastructure should be revitalized or replaced in some areas. The layout of this infrastructure should be redesigned to accommodate sitting arrangements that are conducive for socialization. Physical design of key intersections: All key intersections should be redesigned to clearly show the right-ofway and direction of traffic flow. This is meant to eliminate traffic gridlocks and congestion of such junctions. Such junctions will have clear lines of vision to avoid accidents caused by visual obstructions. Enhanced pedestrian safety: Pedestrian safety should be enhanced by providing separate dedicated lanes demarcated by barriers such as bollards. Other measures will include traffic calming at strategic locations as well as human-scale lighting for use at night. Pedestrian network should be designed to ensure safety of pedestrians from criminals especially at night. Provide complementary human-scale lighting: These should be provided to complement the full-height street lights to enhance lighting at the lower ground, where most of the activities happen. Such human-scale lighting can be camouflaged with hedges to filter the light. Provide parking lots at strategic locations: Parking services should be upgraded by opening more parking lots at strategic areas based on traffic distribution and appropriateness of sites. Improve facilities at public service vehicle terminals: Existing terminal facilities should be improved and new ones provided at appropriate locations for motorized and non-motorized transport. New terminals for both commercial and public service vehicles should be located on outlying sites to avoid congestion. Provide variety of integrated signage at strategic locations: Different signage should be designed to enhance communication at different scales. Integrated signage should be explored to avoid clutter emerging from the indiscriminate location of different sizes and designs of signage. This will be implemented at major intersections and vantage points. Revitalize the boulevard for leisure and as a waiting area: The green areas along the main spine (C63) should be revitalized through landscape design interventions to restore them for full public use. This will encompass redesigning street furniture, paving the walking areas, and traffic calming on the adjacent roads. Similar interventions should be executed at the proposed park near the railway station. Revamped construction of pavements in pedestrian zones: All worn out pedestrian walkways should be rehabilitated for continuity and seamless pedestrian movement. Paving should be done whenever new links and connectivity are established. Lessons, and Challenges Main challenges Prior matching of the resource allocation by the County Government to the SUMP would have guaranteed acceleration of the implementation. Reliance on external partners to fund the plan is challenging amidst competing needs and priorities. It is assumed that SUMP approach will be absorbed by the national level through NAMATA. The legislative framework for this institution that will oversee all the public transport in the metropolitan has just been finalized. It will take some time for the replication of the process. The monitoring and evaluation will take an even longer period. Page 15 of 33
16 There is need to enhance communication at County level between the other departments dealing with land use and planning and social development. Counties still work in silos which undermine the speed of tackling interdepartmental issues affecting mobility. Main lessons The SUMP is a strategic document designed to satisfy the mobility needs of people and businesses in Ruiru and its surroundings for a better quality of life. The exercise has supported Ruiru to plan and pro-actively prepare for the upcoming growth in mobility demand. Focus is provided to public transport integrated with safe walking and cycling. The SUMP in Ruiru introduced a new approach of local consultations that are well informed by good practices in other cities. The process initiated training and capacity building for staff in Kiambu County and promoted collaboration between the local and national authorities. The key challenge for a small fast growing town with limited capacity to plan and implement sustainable urban mobility measures requires balancing the different and sometimes conflicting interests of the stakeholders. Budgetary inputs to support safer streets with walking and bicycle integrated with public transport needs to be seen in the broader context of the health and environmental benefits, not just the funds that will be put into the proposed improvements. The institutional analysis and stakeholder consultations brought out the realities and challenges in implementing the SUMP proposals. Most stakeholders desire to have an efficient transport system but have also highlighted challenges such as lack of walking and cycling infrastructure, parking spaces, land, and general congestion in the CBD. Solutions to these challenges are multi-faceted and require support from the different interest groups. An important lesson that emerged from the SUMP process in Ruiru is that counties not only need adequate capacity and expertise in terms of improving conditions for walking and cycling. The new paradigm of SUM with emphasis on accessibility and inclusiveness puts new demand for the county to reduce the need for mobility by reducing the number of trips and the distances travelled. Good, high-capacity, multimodal public transport systems with comfortable access for walking and cycling and modal shift to greener forms of transport. To realize this, Counties must have a greater decision making role in projects financed by the other partners such as NaMSIP which are also linked to the bigger plans by the Nairobi Area Metropolitan Transport Authority, NAMATA. The interrelationships between the transport links to the other 5 counties will need to be mutually understood to facilitate resource sharing and enhance uniformity in the planning standards. The SUMP has given Kiambu County some lead in realizing this objective. Sustainability Plans The process exposed County professionals to critical elements of sustainable mobility which are not always taken care of in conventional engineering road designs and planning regimes. Endorsement of the SUMP by Cabinet gives it ownership and ensures sustainability especially the incorporation of the proposals in the fiscal paper for financial year. This process will stimulate similar participatory sustainable urban mobility plans for urban areas in the broader Nairobi Area Metropolitan. Linkages with the Nairobi Area Metropolitan strategy on public transport will be established through dialogue forums which will be up scaled to the Nairobi Area Metropolitan Transport Authority. This authority has mandate to work with 5 Counties Nairobi, Kajiado, Muranga, Machakos, and Kiambu which will all benefit by receiving the SUMP process for use in their respective towns. With co-financing UN Habitat, will now move to implementing some of the proposed interventions to revitalize public spaces in Ruiru to make them safe and walkable. In addition, the County has requested support to prepare Street Design guidelines and a County-wide transport policy which is informed by the work in Ruiru. UN Habitat has mobilized more financial resources to support further planning in the County. Under the Support to Sustainable Urbanization in Kenya Project there are modest resources which will go towards expanding the detailed designs for selected sites in the county and assist the preparation of a County transport policy. Page 16 of 33
17 5th Outcome 1. UNESCO/UNEP: Building Strategic Partnerships for addressing Illegal Wildlife Trade and promoting Wildlife Conservation in Kenya UNESCO Component As part of a UN Joint Climate Change Project entitled Support to Low Carbon Climate Resilient Development for Poverty Reduction in Kenya, the United Nations Educational, Scientific and Cultural Organization (UNESCO) implemented activities to address illegal wildlife trade and promote wildlife conservation in Kenya. To this end, UNESCO launched an initiative to strengthen the partnership between the public and the private sector entitled Kenya Corporate Conservation Champions (KCCC). KCCC s goal was to bring to light the conservation work done by the corporate sector and to link the sector with the public and international stakeholders operating in Kenya. In addition to the formation of KCCC, UNESCO carried out an alternative livelihoods survey in Tsavo National Park and conservation areas, and awareness-raising campaigns about illegal wildlife trade on radio and social media. The model identified for KCCC, which is now housed under the International Conservation Caucus Foundation (ICCF Kenya), offers opportunities for duplication in other African countries facing poaching and other critical conservation issues. In fact, the strategic links UNESCO created between the public and private companies through KCCC will ensure the sustainability of the campaign against illegal wildlife trade even after the end of the project period. The understanding that climate change affects the availability of natural resources, mainly water and pasture, which are shared between communities and wildlife in and around the national parks, helped in analyzing the causes of humanwildlife conflicts. These causes were addressed through the Livelihood Study carried-out in Tsavo National Park and conservation areas. Moreover, the results of the study s findings provided the basis for the elaboration of a project proposal to further address the needs of communities living in and around affected wildlife areas and ensure the sustainable results of the efforts this project has made in addressing illegal wildlife trade and promoting wildlife conservation in Kenya. The awareness raising campaign on wildlife conservation was built on the UN annual Environment Day celebration s 2016 theme Go Wild for Life and reached out to youth through the Wildlife Clubs of Kenya. Key messages called on the public to identify with wildlife and natural heritage as part of their identity and national heritage, which needs to be safeguarded for future generations. Media campaigns on national radio and social media engaged members of the public in the debate about poaching. The campaign on social media (Facebook and Twitter) will continue even after the end of the project period. Combined, the abovementioned efforts succeeded in reaching a wide array of the Kenyan population ranging from corporate professionals to farmers to children in schools bordering the affected National parks and conservation areas. This increased awareness of the threat and consequences of illicit wildlife trafficking led to increased concern and involvement of Kenyans across the country in fighting illegal wildlife trade and promoting wildlife conservation in Kenya. 1. Creation of strategic partnerships UNESCO brought together stakeholders in both the private and public sectors to discuss the conservation efforts and anti-poaching campaigns in Kenya, which are part of this project. This led to the formation of an initiative called Kenya Corporate Conservation Champions (KCCC) whose objective was to recognize and award conservation efforts by the private sector and improve coordination among them to avoid duplication of initiatives. To ensure sustainability and provide a legal basis for this entity, KCCC was placed under the umbrella of the International Conservation Caucus Page 17 of 33
18 Foundation (ICCF Kenya). ICCF-K works closely with Parliamentary caucus at the policy-making level while KCCC brings together the private sector on matters of conservation. Under this partnership, two meetings have already been held in 2016 bringing together parliamentarians, NGOs, private companies and the State Department of Kenya Wildlife Service (KWS) to discuss the trend of illegal wildlife trade in the region and areas for collaboration. This unique partnership will continue after the end of this DFID project. It also serves as a model for other such partnerships in Kenya, Africa and globally. 2. Alternative livelihood opportunities linked to wildlife trafficking and shared benefits from wildlife. UNESCO commissioned a study on alternative livelihood opportunities available to communities neighboring the Tsavo National Parks and conservation areas. The study s findings were discussed with the community representatives, KWS and NGOs that operate in the area. Findings from the survey indicate that human-wildlife conflict often occurred when animals strayed from the parks in search of water and pasture during the dry seasons. They would then destroy crops and kill livestock in the nearby farms. In some cases, such farms were situated along their migratory routes. It is this sort of destruction caused by wild animals that created animosity among farm owners and the community. Being national parks, revenues from the parks were not directly shared with the local communities but sent to the central government. These two factors discouraged local community members from playing a key role in curbing illegal wildlife trade in the parks. Recommendations in the report were then discussed by a team of representatives from KWS, County Commissioners office, representatives of the community, Department of Culture, National Museums of Kenya and the Kenya National Commission for UNESCO to develop a long-term project proposal to address the issues highlighted in the report. Under this project proposal, community members would be sensitized on their role in conservation of Tsavo National Park, to recognize the role of the Government through KWS, the heritage and economic value of wildlife, how to share the natural resources in the parks with the wild animals and how to protect their farms from invasion by the animals. The Department of Culture, National Museums of Kenya (NMK) and Kenya National Commission for UNESCO (KNATCOM) were further mobilized to design projects that support the communities to set up cultural projects linked to sustainable tourism that would boost their household income. This would include sustainable tourism development projects such as the establishment of cultural centers, home stays, snake parks as well as training area youth in job skills required for the various livelihood opportunities identified in the report. Page 18 of 33

19 Multi-stakeholders meeting discussing the Tsavo Livelihoods Survey Report in Voi town. 3. Communication campaigns: UNESCO launched a multi-faceted awareness-raising campaign to engage Kenyan nationals, and especially youth, in the fight against illegal wildlife trade and to promote wildlife conservation in Kenya. A partnership was initiated with the Wildlife Clubs of Kenya to ensure the involvement of youth in the awareness-raising campaign and to increase the sustainability of the key messages. The communication campaign was carried-out through three separate but mutually reinforcing vectors: national radio broadcasts, social media platforms and posters distributed to various educational institutions around the parks. Key messages were elaborated in line with the UN World Environment Day to encourage members of the public to play an active role in conserving wildlife as part of their national heritage. All communications were carried-out in Kiswahili, the national language, and in English. Key messages for this campaign included: 1. Wildlife is part of the natural heritage of the Kenyan people that the current generation holds in trust on behalf of the generations to come. 2. Wildlife is a key economic resource for Kenya through tourism and if not protected the national economy will be negatively affected. 3. Illegal Wildlife Trade or poaching is not only about foreign trade and is not only confined to elephant tusks and rhino horns. It includes illegal killing of animals for game meat by the local communities. 4. It is the responsibility of all Kenyans including those that do not live near game parks to say no to illegal wildlife trade. Distribution of posters: 50,000 posters were designed to reinforce the key messages of the Anti-Wildlife poaching campaign. UNESCO partnered with the Wildlife Clubs of Kenya for the distribution of the posters and increased awareness-raising among youth of the key messages of the campaign. Page 19 of 33


20 The posters were distributed in schools and colleges around the following National Parks: Maasai Mara, Lake Bogoria, Lake Nakuru, Nairobi, Tsavo, Meru, Mount Kenya, Ruma, Mount Elgon and Amboseli. An example of one of the posters distributed Social Media campaign: To increase engagement with members of the public on wildlife conservation, UNESCO launched social media pages through which messages and discussions were shared. Various hashtags related to the campaign were used to boost the results on Internet searches. These were: #GoWildForLifeKE #ConservingOurHeritage #SayNoToPoaching #AntiPoaching #ZeroPoaching #TembeaKenya #BigFiveFacts #SaveOurBigCats. Based on the 2016 theme of the World Environment Day, Go Wild For Life, the pages were opened as follows: Facebook Page: Go Wild For life Kenya : Twitter Page : Go Wild For Life Ke: Page 20 of 33

21 Below is a summary of the social media statistics as of 31 January 2017: Item Numbers Likes 8000 Likes on Facebook Followers 285 followers on twitter and 21 followers on Google Plus Impressions 53,800 tweet impressions Favorites 250 for twitter and Google + Post likes 1200 shares on Facebook and Google + Page Visits 507 page visits on twitter Post Reach Above 15,000 on Facebook National Radio announcements Through the Citizen National Radio, messages in Kiswahili language were aired for two weeks by the presenters during the morning peak hours when the listenership is highest. The messages were in two forms: 15 seconds recorded adverts that were played 3 times during the day and a presenter mention during the morning (7 9am) talk shows. The presenter mention was preferred because the presenter had an option of passing the message in different ways and had the option of explaining it in a language that listeners easily identify with for up to 2 minutes. The main theme in the message was to emphasize to listeners that wildlife is part of their heritage and must be protected for the sake of the future generations. An audio file with the advert and presenter mentions is available from UNESCO upon request. Partnership with Wildlife Clubs of Kenya UNESCO recognizes the role young people play in the promotion and protection of heritage. Under this project, young people at the primary and secondary school levels were involved in the wildlife conservation campaigns. To this end, UNESCO initiated a partnership with the Wildlife Clubs of Kenya (WCK), a non-governmental organization that coordinates activities of the schools wildlife clubs in Kenya. WCK distributed the posters with anti-poaching messages to schools neighboring national parks. In addition to the distribution of posters, young people from participating schools were invited to write essays entitled, Wildlife is our heritage, let s protect it. The ten best essays will be published in the WCK national quarterly magazine (Komba Magazine) in April Page 21 of 33


22 Muslim Girls Primary School in Chuka as they received their posters WCK Lelel Secondary School Wildlife Club members. WCK The inclusion of the youth in the above-mentioned awareness-raising activities proved to be a more sustainable way of passing the conservation message along to local communities and especially to other youth. This event provided an opportunity for the youth to use their creativity to protect heritage. They presented songs, poems, speeches and art work in both English and Kiswahili language. Adjudicators from Kwale and Kilifi counties presided over the event and the best performances were rewarded with trophies, prizes and certificates. All schools and their patrons received certificates of participation. UNESCO provided digital cameras to the Wildlife Clubs of the 8 participating schools to enable them document their conservation activities and post articles on the social media pages and other web-based platforms. A video documentary on elephant poaching in Kenya was screened by the David Sheldrick Wildlife Trust, a conservation NGO operating in the Tsavo National Park. Based on the success of the event, UNESCO will continue to work with WCK to prepare a project proposal to organize annual Wildlife Rallies at various national parks in Kenya. Page 22 of 33
23 UNEP COMPONENT Under this Output, UNESCO and UNEP are collaborating to the entrenchment of governance reforms in the wildlife sector to deal a blow to illegal poaching by working with the GoK in convening inter-agency meetings to identify and initiate collaboration on implementing agreed priority recommendations of the Inter-Agency Wildlife Security Task Force Report. The main activities under this component include the review of early indications and implementation results of Wildlife Conservation Management Bill (WCMB), after one year into effect; stakeholder consultations with representatives from civil society to support engagement in national coordination efforts; planning and executing joint training workshop sessions including government officials (transport, police, customs) civil society and private sector for sensitization. UNEP collaborated with the Kenya Magistrates and Judges Association (KMJA) in a Training of Trainers (TOT) workshop in September The objective of the TOT was to sensitize Judges, Magistrates and Kadhi s on matters environmental law and sustainable development but also to impact training skills to enable them facilitate subsequent workshops. A curriculum for the training was also developed as a basis for the follow up county trainings. UNEP and KMJA then entered a Small-scale funding agreement in March 2016 which saw the two Organisations convene a series of five (5) workshops which reached a total of 85 judiciary staff in 2016 with the sole agenda of equipping them with needed skills to deal with, as well as, impart knowledge on environmental issues/ disputes that come to Court daily, including wildlife related crimes. The workshops were held as follows: 1. Workshop for Judges, Magistrates and Kadhi s covering the Meru Region on 18th- 21st August (Training covering 18 Magistrates) 2. Workshop for Judges, Magistrates and Kadhi s covering the Nakuru Region on 17th 20th November, (Training covering 16 Magistrates) 3. Workshop for Judges, Magistrates and Kadhi s covering the Embu Region on 27th 30th October, (Training covering 15 Magistrates) 4. Workshop for Judges, Magistrates and Kadhi s covering the Coastal Region on 22nd 25th September, (Training covering 17 Magistrates) 5. Workshop for Judges, Magistrates and Kadhi s covering the Nyanza region on 8th 11th September, (Training covering 19 Magistrates) With technical support from the University of Nairobi's Centre for Advanced Studies in Environmental Law and Policy, UNEP assisted the Kenya Government to revise the draft Wildlife Policy. The process involved extensive consultations with a wide cross-section of stakeholders in public private and civil society sectors. The revised draft policy has been submitted to the Ministry of Environment and Natural Resources for review and final inputs before finalization (Annex 7 is the Draft Wildlife Policy that is being finalized by the University of Nairobi). Describe any delays in implementation, challenges, lessons learned & best practices: The five UN partners, each with its core niche area of specialization, have their own established way of planning, working, reporting and their own stakeholders. Under the new United Nations Development Assistance Framework for Kenya (UNDAF) , the Delivering as One platform offers the agencies ample opportunities to work together, and effectively respond to the developmental challenges affecting the country. Hence, the UN Joint Project on Climate Change as one of the signature pilot initiatives that is now putting the UN Delivering as One into practice has had to contend with the numerous challenges in harmonizing the working of the UN partners. The main opportunities are summarized below: The launch of the UNDAF at the highest level of government (Head of State) and overwhelming support for the DaO by all the key partners is a useful opportunity for project success The individual strengths of the five UN agencies, especially in resource mobilization and technical expertise, if well harnessed, will effectively support Government of Kenya deliver on the outcome areas as encapsulated in the project documents; Page 23 of 33
24 Some delays were recorded occasioned by restructuring of the ministry of environment and prolonged process in appointments of a substantive head at the Kenya Wildlife Service, affecting activities under the Outcome 5 area (UNEP and UNESCO). Qualitative assessment: The UN Agencies have been working to achieve the main objectives of the UN Joint Project, and this can be evidenced by the results highlighted above. On Project Management, the following key points are useful to note: 1. The UN Joint Project on Climate Change is undergoing the first (Nationally Implemented Modality) NIM Audit, to establish that the project has complied with all the UNDP Policies and Procedures. This Audit will verify compliance and enable UNDP improve its processes going forward; 2. The project will also undergo a Terminal Evaluation, as envisaged within the project cycle of UNDP executed projects. This Terminal Evaluation is expected to end in April, 2017, and will be useful to evaluate project performance across the six key criteria for project evaluation (Relevance, Effectiveness, Sustainability, Efficiency, and Impact). 3. The main decision making organ for the project, the Project Steering Committee continues to provide guidance, leadership and strategic advice on how to effectively deliver on project outputs (see attached the 3rd minutes of the PSC meeting as Annex 8). Page 24 of 33
25 ii) Indicator Based Performance Assessment: Outcome 1 7 Achieved Indicator Targets Reasons for Variance with Planned Target (if any) Source of Verification Kenyans benefit from application of pro-poor and cross-sectoral CC adaptation and mitigation initiatives at national and county levels. The 5 outputs will contribute towards achieving the overall intended outcome as follows: Output 1 (UNDP/UNEP) Pro-poor CC adaptation and mitigation mainstreamed in national and sub-national planning and budgeting processes. 1.1 Climate Public Expenditure and Budget Review Study (CPEBR) work on target (3 workshops, with over 60 participants trained) CPEBR Report finalized. The entire CPEBR activities covered over 100 participants from Government of Kenya (National and County level) Final CPEBR Report as Annex 1 Indicator 1.1 CPEBR Reports At least 10 workshops targeting 120 high level national (Treasury, Ministry of Devolution and Planning, MTEF sector working groups and CC Units in sectoral Ministries) and county governments officials trained in application of MTEF Sector/County guidelines/procedures that incorporate pro-poor CC adaptation and mitigation Baseline: Zero Climate Mainstreamed in budget process 1.2 Training of staff in pro-poor CC A&M budgeting and planning (Over 60 GoK staff participated) 1.3 Support to 2 MTEF sector working groups 1.4 Identification and adoption of climate change adaptation and mitigation indicators in MTP II monitoring system (NIMES) finalized Climate Change, Gender and Human Rights Indicators identified in National and County Indicators The Medium-Term Plan II Handbook of National Indicators Publication (accessible on UNDP website) The 47 Draft County Specific Indicator handbooks available on request Planned Target: to influence the national budget Indicator 1.2 (workshops in 3 national government line ministries; 4 county training workshops in 2 counties and 2 workshops (national and county) for cc adaptation and mitigation in MTP II monitoring) Planned Target: 7 Note: Outcomes, outputs, indicators and targets should be as outlined in the Project Document so that you report on your actual achievements against planned targets. Add rows as required for Outcome 2, 3 etc. Page 25 of 33
26 4 counties develop County Integrated Development Plans (CIDPs) that integrate climate change; At least 2 MTEF/Budget Policy statements reflect climate change budgetary allocations (e.g. Agriculture and Rural Development, and Environment, Water and Housing); 2 pilot county teams apply revised MTEF guidelines that support the inclusion of priority CC adaptation and mitigation programmes; At least 2 approved MTEF Sector guidelines/procedures and Budget Chart of Accounts that incorporate pro-poor CC adaptation and mitigation. Output 2 (UNDP) Renewables and sustainable biomass production promoted in Arid and semiarid Lands Indicator NAMA charcoal framework study and outline Baseline: Planned Target: Indicator solar vendors accredited (Current baseline of 600 solar dealers nationally) Indicator At least 6 charcoal producers in three counties, including Taita Taveta, Kwale and Machakos, to apply improved charcoal production technologies, resulting in 25% increase in efficiency i.e. energy efficient kilns as per UNDP SLMW 2.1 Study for development of a NAMA outline - for sustainable charcoal production in Kenya finalized 2.2 Support to solar PV vendors to enable provision of good quality solar PV products and associated services through accreditation (50 vendors sensitized at national level) 2.3 Charcoal producing associations at the county level (Taita Taveta and Machakos Counties) formalize their leadership and governance structures, and apply sustainable charcoal production technologies - including modern energy efficient kilns. (Trainings of charcoal producer associations in Kwale and Taita Taveta counties completed) On target - The recruitment of Eco Act, a French firm, to support Kenya develop an appropriate NAMA Framework for charcoal Finalization of NAMA report for Charcoal and subsequent development of charcoal NAMA for Kenya On Target - *860# campaign currently running (with billboards in 13 towns popularizing number. (Bill Boards are accessible) On target - Procurement of portable metal kilns (9) Horizontal Drum Kilns (47) Vertical Drum Kilns (47) and Cassamance improved earthen ware kilns (47) for use in trainings programs for 3 sub counties in Taita Taveta (Mwatate, Wundanyi and Voi) ; three sub-counties in Kwale (Samburu, Kinango and Msambweni) and 5 sub-counties in Narok Counties. Trainings conducted in Taita Taveta (Mwatate and Voi sub-counties) and Kwale (Samburu sub-county). Trainings conducted in the 3 sub counties of kwale County. Two stakeholder meetings held in two sub-counties of Narok County. Final Report for the Charcoal NAMA by Eco- Act Final Charcoal NAMA for Kenya Page 26 of 33
27 Outline of Training Guideline on Sustainable Charcoal Production developed for KEFRI. Output 3 (UN ILO) Green buildings are promoted in the construction sector with associated benefits for employment, environmental improvement, social equity and economic prosperity Indicator new and / or retrofitted units of green buildings developed At least 3 media/publicity campaigns on green building principles, products, technologies and methods have reached 50,000 persons 3 demonstration units in three counties 3 counties with a draft policy and regulatory framework that stimulates appropriate building materials, skills, products and technologies 1,000 people trained in new/low carbon technologies, and green construction methods Baseline: Level of installed capacity of clean energy = 0 on the buildings targeted Number of public awareness campaigns on green building principles = 0 Limited data exists on number of counties with a draft policy and regulatory framework Limited data exists on the number of people in the MSMEs and stakeholders in building industry trained in new/low carbon technologies People with access to clean green building technologies in the housing units targeted by the project = 0 Achieved Indicator Targets 3.1 Conduct 3 media campaigns reaching at least 50,000 people 3.2 Conduct sector stakeholder awareness campaign on green building principles 3.3 Support drafting of national and county policy framework on green buildings. 3.4 Construction/ retrofitting of three demonstration units, replicated into at least 50 green buildings. 3.5 Build the capacity of 500 MSMEs in green construction value chain. Reasons for Variance with Planned Target (if any) All the 5 indicators are on target and were met and in some instances exceeded Media strategy comprising varied media channels rolled out and have so far exceeded the 50,000-targeted people Several stakeholder awareness exercises and materials on green building principles have been delivered targeting various groups i.e. beneficiaries, MSMEs in green building value chain, building and construction professional bodies, school and communities UNEP is finalizing the drafting of national and county policy frameworks on green buildings Development the Eco Manyatta, Eco Lodges, Green Soko, and Green School concepts are underway with one (1) prototype standing. In 2016, the foreseeable replication exceeded the 50 green buildings being targeted So far ILO has trained just over 100 people in the green construction value chain. The training efforts were scaled up in 2016 to reach the desired targets. Source of Verification All sources of verification attached as online links on the output s narrative found in the previous pages. Planned Target: Page 27 of 33
28 KPI 2: At least 300 people benefit from and have access to clean green building technologies (in the 50 new or retrofitted housing units) KPI 5: 200 green jobs created as a result of ICF support KPI 6: At least 28,700 watts of new clean energy capacity installed (if information is available to accurately measure) Output 4 (UNEP/UNHABITAT) Low carbon transport is included in the on-going urban planning processes and national policies are developed to promote importation of cleaner, more fuel efficient vehicles in Kenya. Indicator Percentage of low-emission vehicles increases by 30% Indirect/low intensity support to create the enabling environment: - 1 policy/legislation on integrated urban transport and import of cleaner vehicles taken up by government. One sample county develops and adopts a Sustainable Urban Mobility Plan (SUMP) that will impact on a target population of 100,000 Achieved Indicator Targets 4.1 Provide technical expertise on urban mobility planning for the selected county/counties under the World Bank NuTRIP and NaMSIP programmes Technical assistance is being provided to develop a SUMP in Ruiru Town, Kiambu County (for more details, refer to narrative report) Reasons for Variance with Planned Target (if any) Stakeholder support towards the project was time-demanding; But strong institutional ownership has been achieved Source of Verification Baseline: 0.02% of imported light duty vehicles were low-emission as at end of 2012 Planned Target: - A framework for assessing sustainable and integrated transport systems at the city level presented to 50 high level policy makers. - Feebate policy (to encourage higher uptake of low emission vehicles) developed. - Report on taxation levels and other incentives to encourage import of cleaner vehicles. Page 28 of 33
29 4.2 Support development of integrated urban transport strategies at national level Nairobi NMT Policy launched on 17 th March % of annual road construction budget for NCCG ring-fenced for NMT infrastructure. Over 30 attendees at launch event. Policy on Nairobi City County Government and UNEP website. 4.3 Develop a tax system for Kenya on cleaner vehicles importation (including a feebate program, labelling system etc) The excise duty for newly imported vehicles became effective end of November The excise duty, initially a flat rate at 20% of the value of the car is now differentiated at Kshs.200,000 for vehicles older than 3 years and Kshs.150,000 for vehicle s less than 3 years of age. A taxation proposal that includes a feebate program, vehicle labelling system and new vehicle purchase scheme for Kenya has been developed and is currently being reviewed by the national task team overseeing the project. Completed Completed Website Here! See attached NMT Policy for Nairobi and workshop reports to initiate the NMT policy development process and launch the finalized policy. See attached fee-bate proposal and the excise duty bill. Check website Here 4.4 Support the dissemination of the recommendations on cleaner vehicles National task team will be meeting on 7-10 December to review the taxation proposal On track Validation-Launch Event Report.docx Page 29 of 33
30 Dissemination of the taxation proposal to stakeholders is planned in February 2016 Output 5 Governance reforms in the wildlife sector contribute to reducing illegal wildlife trade in Kenya Indicator 5.1 Office of the Director of Public Prosecutions adopts a handbook/guide on Standard Operating Procedures for prosecuting wildlife crimes. Baseline: 0 target: 1 All prosecutors and judges/magistrates in courts with jurisdiction over conservation areas are aware of existing and new wildlife laws Baseline: 0 Target: 100% Office of the Chief Justice develops sentencing guidelines for wildlife crimes Baseline: 0 Target: 1 MEWNR develops a memorandum of proposed legislative changes to the Wildlife Conservation and Management Law Baseline: 0 Target:1 Baseline: Number of tools developed and adopted to support intelligence-based national enforcement efforts Baseline: 0 Target: 2 Number of education and awareness programmes initiated and tools developed and disseminated Baseline: 0 Target: 2 Number of strategic partnerships signed to leverage greater coverage Baseline: 0 Target: 4 Achieved Indicator Targets 5.1 Support to implementing priority recommendations from the Inter-Agency Wildlife Security Task Force Report and other coordination efforts at national level to address illegal wildlife trade. 5.2 UNEP and the Kenya Government (Ministry of Environment and Regional Development Authorities) have developed a program for finalizing the National Policy on Wildlife. The lack of policy was identified as a key hindrance for the Government in designing laws relating to county governments, dealing with the international community especially on issues related to trade in and/ or donation of species of wild fauna and flora. 5.3 UNEP and the Kenya Magistrates and Judges Association concluded the development of training material and curricula on environmental law for Judges and Magistrates in Kenya. Over 7 trainings were then conducted covering judges and magistrates in all the counties in Kenya. 5.4 Pursuant to the said agreement, UNEP supported the drafting of a training manual and the holding of a three-day validation workshop to review the draft curriculum. 5.5 Capacity development for prosecutors and judges/magistrates undertaken, through a series of five (5) workshops which reached a total of 85 judiciary staff in 2016 Reasons for Variance with Planned Target (if any) Source of Verification Report on Livelihoods Study Page 30 of 33
31 Number of wildlife conservation stakeholder consultations conducted Baseline: 0 Target: 1 Compendium of alternative livelihood opportunities linked to wildlife trafficking and shared benefits from wildlife developed and disseminated Baseline: 0 Target: Development of overarching campaign and communications products to support national and international efforts ,000 pieces of posters and fliers with messages on campaigns against illegal wildlife trade were printed and delivered. 5.8 Social media campaign undertaken within 2016 with some good results reported (Review narrative report). 5.9 A radio campaign against wildlife crimes undertaken, with a good number of radio advertisements being used. The radio announcements and the social media campaigns run throughout the year. Page 31 of 33
32 III. Other Assessments or Evaluations (if applicable) The UN Joint Project on Climate Change has successfully undergone the first and once-in-a-lifetime (Nationally Implemented Modality) NIM Audit, to verify compliance with all the UNDP Policies and Procedures. This Audit verified compliance of project implementation to UNDP s Policies and Procedures to enable improvement of its processes going forward. The Terminal Evaluation of the project is also set to commence within May 2017 after completion of the procurement of an International Individual Consultant. Page 32 of 33
33 ANNEXES 1. Annex 1: Final CPEBR Report; 2. Annex 2: Charcoal NAMA for Kenya; 3. Annex 3: Report on Charcoal NAMA for Kenya 4. Annex 4: Budget Policy Statement 5. Annex 5: Registration Certificate for the new Charcoal Producers Federation of Kenya; 6. Annex 6: Draft Narok Environment Bill 2016; 7. Annex 7: Feebate Tax Proposal; 8. Annex 8: The 3 rd Minutes of the PSC meeting 9. Annex 9: The NIM Audit Report by Baker-Tilly-Meralli Page 33 of 33


34 KENYA CLIMATE PUBLIC EXPENDITURE AND BUDGET REVIEW Final Report. October

35 Table of contents LIST OF FIGURES LIST OF TABLES LIST OF TEXT BOXES ACKNOWLEDGEMENTS PREFACE ACRONYMS EXECUTIVE SUMMARY iv v vi vii viii ix xii 1 INTRODUCTION Background and Rationale Policy and Institutional Framework for Climate Change 2 2 CPEBR STUDY APPROACH AND METHODOLOGY Literature review and analysis Key respondent interviews using survey instruments Consultative Workshops Data Collection Data analysis Challenges in Data Gathering and Analysis 8 3 DEFINITION OF CLIMATE FINANCE IN THE KENYAN CONTEXT Definitions Kenya Climate Finance Definition and Use of Rio Markers 10 4 NATIONAL LEVEL ANALYSIS Analysis of Sector Climate Relevant Expenditure Agriculture, Rural and Urban Development Sector (ARUD) Energy, Infrastructure and ICT Sector (EII) Environmental Protection, Water and Natural Resources Sector (EPW) National Budget and Development Partner Contribution 21 5 COUNTY LEVEL FINDINGS County Budget Planning and Formulation Process Bungoma County Budget Analysis Laikipia County Budget Analysis Laikipia Actual Expenditure compared to the approved budget 36 ii
36 5.5 Isiolo County Budget Analysis 39 6 TRACKING CLIMATE FINANCE IN THE BUDGETARY PROCESS Mainstreaming Climate change into budgetary process Guidance Notes on Climate Change Mainstreaming in the Budgetary Process Draft GoK Notifications on Climate Finance Stepwise Approach to Capturing Climate Expenditure in IFMIS 48 7 RECOMMENDATIONS ON MONITORING AND EVALUATION MECHANISMS Overview Guidelines to Establishing of a Database of climate related parameters in the budget IFMIS Reporting and Analysis Templates for Climate Related Allocations and Expenditure Recommendations on Short to Medium Term Guidelines on Capturing Allocations and Tracking Expenditure 57 8 CONCLUSIONS 58 9 REFERENCES 61 iii
37 LIST OF FIGURES Figure 1: Sector funding from the Total External Resources (Ksh)... xvii Figure 2: ARUD actual expenditure compared to the approved budget Figure 3: ARUD Planned Budget, Total Expenditure and Climate Relevant Expenditure on Mitigation, Adaptation and Enabling Environment Figure 4: Planned budget, actual expenditure as per literature and reviewed expenditure based on MTEF and programme based budget (PBB) for the EII sector Figure 5: EPW Planned Vs Actual Expenditure Figure 6: EPW Planned Vs Actual Expenditure Figure 7: EPW Actual Expenditure Versus CRE on Adaptation, Mitigation and Enabling Environment Figure 8: Planned National Budget Vs External Resources Figure 9: External Resources (Grants and Loans) Figure 10: Development Expenditure (Bilateral Partners) Figure 11: Development Expenditure (Multilateral Partners) Figure 12: Total External Resources by Sector Figure 13: Loans by Sector Figure 14: Comparison between Total Budget and External Resources Figure 15: Domestic Budget compared to External Contribution in EII sector Expenditure Figure 16: National Budget vs External Resources contribution to EPW Figure 17: SWG funding from External Resources Figure 18: Actual Expenditure compared to the Approved Budget for Bungoma Figure 19: Actual Expenditure compared to the Approved Budget for Bungoma Figure 20: Bungoma Recurrent Vs Development Expenditure Figure 21: Bungoma Climate Relevant Expenditure Figure 22: Bungoma CRE compared to the Total Expenditure Figure 23: Laikipia Sources of Income Figure 24: Laikipia Actual Expenditure compared to the approved budget Figure 25: Laikipia Recurrent and Development Expenditure Figure 26: Laikipia Climate Relevant Expenditure Figure 27: Laikipia CRE compared to the Total Expenditure Figure 28: Isiolo Sources of Income Figure 29: Isiolo County Planned Vs Actual Expenditure Figure 30: Isiolo County Recurrent Vs Actual Expenditure Figure 31: Isiolo Climate Relevant Sector Spending Figure 32: Isiolo County Expenditure Vs Climate Relevant Expenditure Figure 33: Stepwise Guide to Climate Coding on IFMIS Figure 34: Data Capturing on the Standard Chart of Accounts iv
38 LIST OF TABLES Table 1: Total External Resources versus Total CRE and Ratio of CRE to External Resources... xvii Table 2: Total External Resources versus Total CRE and Ratio of CRE to External Resources Table 3: GoK Standard Chart of Accounts Table 4: Segments in Programme Based Budgeting Table 5: Levels in the Programme Based Budget Table 6: Embedding the Climate Change Budget Code Table 7: Elements of a Measuring, Reporting and Verification Framework Table 8: Elements of Reporting on Climate Finance Table 9: Verification of Climate Finance v
39 LIST OF TEXT BOXES Text Box 1: Climate Relevant Spending from the MTEF Text Box 2: Isiolo County Adaptation Fund (ICAF) Text Box 3: Stepwise Approach to Capturing Climate Expenditure in IFMIS vi
40 ACKNOWLEDGEMENTS The Climate Public Expenditure Budget Review (CPEBR) was conducted under the advice and guidance of a Technical Advisory Committee (TAC), composed of officers from the National Treasury (TNT), the Ministry of Environment and Natural Resources (MENR); the Ministry of Devolution and Planning (MoDP); National Environment Management Authority (NEMA); National Drought Management Authority (NDMA); and the Council of County Governors. The CPEBR report is based on outcomes of stakeholder consultations carried out nationally and in select Counties. It therefore captures the aspirations of Kenyans as far as the need for mainstreaming climate change in the budget, is concerned. The document has also benefitted from financial data collected from three MTEF Sector Working Group. The Government would like, therefore, to acknowledge and thank all the officers in the national and county government who participated in this study by providing information and data that was direly needed to make it successful. Special thanks go to the financial and accounts officers who took time out from their busy schedule and to the County Governors of Bungoma, Isiolo and Laikipia Counties, who set aside valuable time to understand how national government is dealing with issues of tracking climate financing in the planning and budget process. The National Treasury is proud to present this report, which serves as an indication of the importance that GoK places on the need to ensure that the budgetary process is climate proofed. It is hoped that the document will be found useful by Ministries, Departments and Agencies (MDAs) especially technical and financial officers involved in the planning and the budget process, who have often grappled with the need how to provide budgets for climate change activities. Development of a document of this kind would be impossible without technical and financial resources. Government s gratitude goes to the United Kingdom Government who provided finance support through the StARCK programme. In addition, the UNDP who managed finances as well as supervised the stakeholder consultation process across the country. Finally, UNEP Poverty and Environment Initiative who provided much needed quality assurance of the report. The study was carried out by an expert team led by Stephen Mutimba of Camco Advisory Services Ltd., Dennis Masinde, an IFMIS TNT Consultant and Peter Odhengo from the Climate Finance Unit of TNT, Stephen Kinguyu of MENR, David Kiboi of MoDP backed by technical, financial and accounts officers drawn from the Ministries and Departments representing the three MTEF Sectors Agriculture, Rural and Urban Development (ARUD); Energy, Infrastructure and ICT (EII); and, Environment Protection, Water and Natural Resources (EPW) vii
41 PREFACE To effectively mainstream climate change in the development process, as required under the Climate Change Act 2016, deliberate efforts need to be taken to ensure that climate change considerations inform the budgeting, planning and finance processes. Mainstreaming of climate change within the development process is expected to bolster the efforts towards achieving low carbon development pathways. It is also expected to enhance climate finance accountability at the local and global levels. The budgeting processes at both the national and county processes provide useful opportunities for integrating climate resilient planning, and need to be aggressively pursued. Kenya s first Climate Public and Budget Review processes has provided some critical lessons, experiences, findings on the budgeting and expenditure frameworks, and where more opportunities for climate mainstreaming exist. The nexus between CPEBR findings and the Budget Coding work, within the Integrated Financial Management Systems (IFMIS) offers Kenya ample opportunities for sustained efforts in this regard. In defining climate finance for Kenya s landscape, the CPEBR has evolved three key climate finance concepts, which are summarized as Climate Relevant Expenditure (CRE) and include: i) Climate Change Adaptation (CCA) ii) Climate Change Mitigation (CCM) and iii) Climate Change Enabling Environment (CCEE) - Between 2011 and 2014, the country spent approximately Billion (USD Million) as Climate Relevant Expenditure in only three MTEF Sectors: Agriculture, Rural and Urban Development (ARUD); Energy, Infrastructure and ICT (EII); and, Environment Protection, Water and Natural Resources (EPW). This is equivalent to about 8% of the total external funds (Ksh 650 Billion) invested in the entire budget during the same period. The CPEBR process has also helped generate a new Segment 8, within the IFMIS SCOA which will be enhanced as a sustainable mechanism to track climate relevant expenditure. The National Treasury will continue improving the IFMIS system, to ensure climate change is effectively mainstreamed. There is also a critical need to ensure that all of government s budgeting resources are released through the IFMIS. This will avoid the current scenario where over 40% of the budgetary allocations to Semi-Autonomous Agencies (SAGAs) and parastatals are released from Treasury as transfers, without being tracked by the IFMIS. Still, we acknowledge the need for continued capacity building of key government staff to ensure that the quality of the data inputs into the system continues to grow. Notwithstanding data availability, it is crucial to acknowledge that the methodology advanced under this CPEBR process, was a significant improvement on the conventional CPEIR methodologies utilised within other jurisdictions. More efforts need to be taken to avail the requisite data, in the required form to improve the findings in future. Most of the other climate finance that is provided by development partners to non-state actors is also unaccounted for, since there is no mechanism currently that enforces reporting on such resources, yet we all are aware that significant funds are provided to Kenya as grants to support various efforts of climate change adaptation and mitigation through these avenues. The system for national accounting for climate related budgets and expenditures needs to be bolstered to effectively account for all such resources. Kenya looks forward to continued engagement in the process of expanding our abilities to effectively track the climate finance flows, from domestic resources and from external support within the economy. Signed Signed Charles Sunkuli, Permanent Secretary Kamau Thuge, Permanent Secretary The National Treasury Ministry of Environment and Natural Resources viii
42 ACRONYMS AFD French Development Agency (Agence Française de Développement) ADB African Development Bank ADF Africa Development Fund AfDB Africa Development Bank A-I-A Appropriation In Aid ARD Agriculture and Rural Development ARUD Agriculture, Rural, and Urban Development BPS Budget Policy Statement BROP Budget Review Outlook Paper CAPC County Adaptation Planning Committee CBD Convention on Biodiversity CBK Central Bank of Kenya CBROP County Budget Review Outlook Paper CCBC Climate Change Budget Code CF Climate Finance CFTC Climate Finance Technical Committee CIDP County Integrated Development Plan CIDP County Integrated Development Plans CoB Controller of Budget CPEBR Climate Public Expenditure and Budget Review CPI Climate Policy Initiative CRE Climate Relevant Expenditure CSO Civil Society Organizations DRR Disaster Risk Reduction EIA Environmental Impact assessment EII Energy, Infrastructure and ICT EPW Environmental Protection and Water FY Financial Year GCF Green Climate Fund GECLA General Economic, Commercial and Labour Affairs GIZ German Cooperation for International Development (Deutsche Gesellschaft für Internationale Zusammenarbeit) GJLOS Governance, Justice, Law & Order GoK Government of Kenya ICAF Isiolo County Adaptation Fund IDA International Development Association IFMIS Integrated Financial Management Information System KCCWG Kenya Climate Change Working Group KEPSA Kenya Private Sector Alliance KFW Kreditanstalt für Wiederaufbau (Reconstruction Credit Institute) KIPPRA Kenya Institute for Public Policy Research and Analysis KMD Kenya Meteorological Department KPI Key Performance Indicator KRA Kenya Revenue Authority MCS Monitoring, Control and Surveillance MDAs Ministries, Departments and Agencies MENR Ministry of Environment and Natural Resources MEWNR Ministry of Environment, Water and Natural resources MoDP Ministry of Devolution and Planning MoLHUD Ministry of Lands, Housing and Urban Development MoTI Ministry of Transport and Infrastructure MRV Monitoring, Reporting and Verification MTEF Medium Term Expenditure Framework MTP Medium Term Plan NAMAs Nationally Appropriate Mitigation Actions NCCAP National Climate Change Action Plan ix
43 NCCRS NCCD NCSA NDA NEMA ODA OECD OPV PAIR PBB PFM REDD SCOA SEA SPCR SWGs TNT UNCCD UNFCCC WAPC National Climate Change Response Strategy National Climate Change Secretariat National Capacity Needs Self-Assessment National Designated Authority National Environment Management Authority Official Development Assistance Organisation for Economic Cooperation and Development Offshore Patrol Vessel Public Administration & International Relations National Security Program Based Budgeting Public Finance Management Reduced Emission from Deforestation and Forest degradation Standard Chart of Accounts Social Economic Assessment Social Protection, Culture and Recreation Sector Working Groups The National Treasury UN Convention to Combat Desertification United Nations Framework Convention on Climate Change Ward Adaptation Planning Committee x
44 xi
45 EXECUTIVE SUMMARY Kenya continues to make significant strides in mainstreaming climate change across its planning, budgeting and finance processes, and in specifically delivering on the National Climate Change Action Plan (NCCAP) On the policy front, the promulgation of the Climate Change Act 2016 heralds a major milestone in this endeavour, since the Act provides the legal basis for mainstreaming climate change within the development processes at both the county and national level. For the country to effectively track climate finance flows, The National Treasury (TNT), in collaboration with the Ministry of Environment and Natural Resources (MENR) through the Climate Change Directorate undertook Kenya s first Climate Public Expenditure and Budget Review (CPEBR). This process was resourced under the UN Joint Project on Climate Change, supported by the UK s DFID through UNDP. The objective of the Climate Public Expenditure and Budget Review (CPEBR) was to conduct an analysis of Kenya s Climate Public Expenditure and Budgeting processes and provide guidance to strengthen efficiency and effectiveness of climate finance in public financial management systems. The goal was to strengthen climate finance in Kenya s public financial management systems and in the Medium-Term Expenditure Framework (MTEF) processes to: 1) maximise budgetary allocation of public sector resources to climate change adaptation and mitigation efforts; 2) enable the tracking of public sector expenditure and its effectiveness against policies and plans; and, 3) contribute to strengthened monitoring and reporting of CC adaptation and mitigation efforts. This report presents an analysis of the country s budgeting and planning processes, as a first step to understanding how to strengthen the efficiency and effectiveness of climate finance in national and county Public Financial Management (PFM) systems. Three core aspects of the national budget cycle related to climate change actions are reviewed and these included: i) the integration of climate change in the budgeting process, as part of budget planning, implementation, expenditure management and financing; ii) National legal framework on financial management and budgeting; and, iii) County legal framework on financial management and process of formulating budgeting including key stakeholders. The methodology employed involved research on the Climate Public Expenditure and Institutional Review (CPEIR) experiences in other countries which have carried out such a study. Using emerging generic CPEIR methodology, the analysis looked at the core aspects of planning and budgeting cycle processes. It examined core aspects of the national budget cycle that relate to climate change, planning, budgeting and the extent to which these strategies and policies are coherent with national development, poverty reduction and low emission inclusive green economic growth strategies. In addition, a review of institutional arrangements for promoting the integration of climate change policy in the budget planning, implementation, expenditure management and financing was carried out. At the national level, financial (budget and expenditure) data was collected from three MTEF Sectors: Agriculture, Rural and Urban Development (ARUD); Energy, Infrastructure and ICT (EII); and, Environment Protection, Water and Natural Resources (EPW) for three financial years: July 2011 to June 2012; July 2012 to June 2013; and July 2013 to June 2014.These sectors contribute significantly to the socio-economic development of the country but are also vulnerable and key drivers to climate change. County level data was collected from Laikipia, Isiolo and Bungoma Counties for the financial year (FY) 2013/ 2014 only as this corresponds to the first year that County Governments were operational for a full financial year. Projected county budgets and plans for the FY 2014/2015 were also included in the analysis. These counties were selected based on three criteria; xii
46 climate change vulnerability index, on-going climate change activities and level of advancement in terms of financial framework development, and representation of Kenya s ecosystems and local economies. The study proposed a definition of Climate Finance (CF) in the Kenya context that enhances a localised understanding of climate activities and the full cost of managing the effects of climate change in the economy. This definition is to be used in future once a climate code is functional in the IFMIS and budgeting process. Once the CF definition is functional, it is recommended that all sources of funds (i.e. domestic and external, public and private) spent be considered in tracking of climate related costs. Based on this study, CF is defined as additional or incremental investment made in activities aimed to climate proof programs and projects against climate change impacts including deliberately reducing greenhouse gas (GHG) emissions. CF is therefore additional costs incurred or additional funds invested in an activity to make it resilient to climate risks otherwise called climate change adaptation (CCA) activities, or costs for causing greenhouse gas (GHG) emissions reduction and/or climate change mitigation (CCM) and costs for or invested in climate change enabling environment (CCEE) activities such as strategy, policy development, international negotiations on climate change and other cross-sectoral issues. Or simply additional or incremental investment made in activities that aim to: i) climate proof programs and projects against climate change impacts, and/or ii) reduce greenhouse gas (GHG) emissions. The criteria for defining climate finance in the context of Kenya s public expenditure have been adopted from the Climate Change Budget Code (CCBC) report and the OECD DAC Rio Markers. The CF definition is specific to additional or incremental amount needed to climate proof projects and can be applied in the future once the climate change budget code is fully functional. Since budget coding was not in place, CF was not used in the study. Instead Climate Relevant Expenditure (CRE) was used to denote costs incurred or invested (capital, labour and related) in programmes and sub-programmes where actual or specific costs of climate change activities may not be specifically shown. For an activity to qualify to be categorized as CRE, funds incurred or invested must: a. address one or all the climate change risk mitigation or proofing category e.g. adaptation, mitigation or enabling environment (climate awareness, training, policy and capacity building) as per the definition given by OECD b. more than 25% of the funding must go to one or all the above climate risk mitigation or proofing category c. Actual incremental or additional financing need not be demonstrated but there must be certainty that funds have been used for a) above. d. Outcome/output must be increased resilience, reduced emissions or more awareness on climate change e. technical and finance officer must agree on the above f. each sector should have some guidelines on how to arrive at CRE and CF The figures provided in the findings are more Climate Relevant Expenditure (CRE) which denote costs invested (capital, labour and related) in programmes and sub-programmes where specific amounts for climate change activities are not clearly shown. This was done in consultation with a technical officer and finance or accounts officer from the relevant ministries representing the MTEF sectors studied. Not included in the study are funds that the National Treasury transfers to Semi-Autonomous Agencies (SAGAs), i.e. parastatals; for instance, during the 2014/2015 financial year an estimated KES 565 billion was transferred to various SAGAs responsible for budget implementation but there is no clear way to track their expenditure, as SAGAs have different budget systems compared to the central Government and are not obliged to use IFMIS. xiii
47 The CF definition is specific to additional or incremental amount needed to climate proof projects, whilst the term Climate Relevant Expenditure (CRE) is used to denote costs invested (capital, labour and related) in programmes and sub-programmes where actual and specific climate change activities are not shown. The criteria for defining climate finance and CRE in the context of Kenya s public expenditure have been adopted from the Climate Change Budget Code (CCBC) report and the OECD DAC Rio Markers. Using this definition and bearing CRE in mind, the study analysed government spending at the national and the county level. The challenges that the CPEBR faced included inconsistent accuracy of official financial information where slight differences between published figures and actual financial records. This was addressed by agreeing to use the actual financial records held by the Integrated Financial Management System (IFMIS) unit of the National Treasury (TNT). Second challenge was that the depth of budget and expenditure breakdown in the IFMIS is currently limited at program and sub-program levels, and does not capture the cost of each separate action/activity under each sub-program. This absence of activity level expenditure and work-plan information made it difficult to get clarity on the actual amount spent on the type of climate activity, making it difficult to assess additionality and incrementality of climate finance, and hence to classify climate relevant expenditure (CRE) as either adaptation, mitigation or enabling environment. To overcome these two challenges, the appropriation accounts for the period under review, were examined and for those sectors such as ARUD and EPW whose programs contained actions that were deemed as significant to adaptation or mitigation or enabling environment in the sub-programme, were categorized as so. It should be noted that whilst there was no adequate information to assess additionality and incrementality, the figures for climate finance include the entire amount allocated to a sub-program and qualify as climate relevant expenditure. KEY FINDINGS EMANATING FROM THE STUDY NATIONAL GOVERNMENT BUDGET AND PLANNING PROCESSES I. AGRICULTURE, RURAL AND URBAN DEVELOPMENT (ARUD) 1. Despite the sector being very vulnerable, CPEBR analysis has shown that little funding has been spent to climate proof the sector. Climate relevant expenditure (CRE) was found to be insignificant in the sector over the three financial periods, compared to the money invested in business as usual. Most of the CRE amount was spent on climate change enabling environment (CCEE) activities such as policy development, training and capacity development. In 2012/13 KSh billion was spent on CCEE activities representing 3.10% of total expenditure; in 2013/2014 KSh billion was also spent on CCEE activities representing 5.10% of the total expenditure and in 2013/14 KSh billion was spent on Climate Change Adaptation (CCA) activities, 285 million on CCEE and 67 million climate mitigation (CCM) activities. Activities that account for climate adaptation related include Food security and management programme njaa marufuku Kenya; crops development and management services as well as livestock development 2. Trend-wise CRE increased a bit significantly from 3.10% of the total in 2011/12 to 5.10% in 2012/13 and 9.21% in 2013/14. xiv
48 3. Total External financial resources contribution to the ARUD Sector was Ksh billion (16%) in 2011/12; billion (19.9%) in 2012/13; and KSh billion (29.6%) in 2013/14 of the total ARUD budget. 4. The table below shows the percentage ratio for each financial year of the CRE amount in relation to the external resource. ARUD spent about 26.65% of the total amount received from external resources on climate related activities during the three financial years. Year 2011/ / /14 Total in Ksh billion External Resources Total CRE Percentage of CRE to External Resources II. ENERGY, INFRASTRUCTURE AND ICT (EII) 5. EII sector budget increased gradually from KSh 182 billion in the 2011/12 financial year to KSh billion in the 2012/13 financial year to KSh 217 billion in the 2013/14 financial year. The gradual increase in the approved budget was due to the financing of the power generation and transmission; the Nairobi - Thika super highway; and the Konza Techno City developments. Most funding has been channeled to the Infrastructure Subsector with an allocation of 56%, 50%, and 46% in the financial years 2011/12, 2012/13 and 2013/14, respectively. This is closely followed by the Energy and Petroleum Subsector at 31%, 38% and 33% over the review period. The Transport Subsector was allocated 10% in 2011/12, 2% in 2012/13 and 16% in 2013/14. The ICT sub sector has had a gradual increase from 2% to 4% and 5% allocation of the total budget in 2011/12, 2012/13 and 2013/14 respectively 6. However, EII Climate Relevant Expenditure was found to be very insignificant compared to ARUD. This is partly because a lot of data was missing from the Ministry of Energy and Petroleum (MOEP), as such no expenditure was shown as being made in climate mitigation (CCM) and enabling environment (CCEE) in the three financial years. In 2011/ 2012, about 890 million was spent on climate change adaptation, in 2012/ million and in 2013/ 2014, 510 million. Records show that the Government has invested in mitigation type activity such as energy investment programs, geothermal development; national grid system; rural electrification; alternative energy technologies. The amounts are not captured since the implementing agencies, mostly parastatals, under the MOEP are not subject to IFMIS. III. ENVIRONMENT PROTECTION, WATER AND NATURAL RESOURCES (EPW) 7. With respect to the EPW sector, thirteen programmes were implemented in the review period 2011 to 2014 which had CRE investment estimated at KSh billion, KSh billion and KSh billion respectively. With most of the money being spent on supporting a strengthened climate change enabling policy and institutional environment. 8. The then State Department of Environment and Natural Resources (now Ministry of Environment and Natural Resources (MENR) spent large amounts of money on CCEE activities, such as, policy/strategy development, awareness-raising, and capacity building. Under the Forests Conservation and Management sub-programme, activities such as the provision of forestry extension services and support to community farming initiatives qualify as enabling environment, while other activities in the sub- program xv
49 such as the restoration of natural water towers and the rehabilitation of natural forests qualify as mitigation activities. 9. Climate Relevant Expenditure in the then Ministry of Environment, Water and Natural Resources (now split into two Ministry of Environment and Natural Resources and Ministry of Water and Irrigation) was largely on mitigation, and on programmes such as the protection of water sources, and catchment areas. The Water Resources Conservation and Protection sub-program includes the Upper Tana Natural Resource Management activities such as increasing forest cover (mitigation) as well as the promotion of water rights (enabling environment). Enabling environment activities include programmes on water ethics, water resource information centres, water resource management activities such as monitoring stations on surface water and the promotion of rain water harvesting technologies. 10. External resources contributed approximately 67%, 56% and 66%, of the total EPW budget for 2011/ 2012, 2012/ 2013 and 2013/ Some of the projects that were directly funded by external resources include: Low emission capacity building project (KSh. 28 million) and the Water security and climate resilience (KSh. 88 million) among others. IV. COUNTY LEVEL FINDINGS 11. In line with the national data collection, at the county level, the three sectors ARUD, EII and EPW were represented by: Agriculture, Livestock/Pastoralism, Fisheries and Water Development; Tourism, Forestry, Environment, Natural Resources; and Energy ICT, Roads, Public Works and Trade and Industrialization. 12. In the arid and semi-arid Counties, migration of people and animals caused by climate variability, particularly drought, to areas with water and pasture was a major cause of concern to the County official, especially for destination Counties such as Isiolo whose budget allocation does not take into consideration such climate migrations. Thus, the quality of service to the population in the county is diluted due to this increased population V. EXTERNAL RESOURCES AND INVESTMENT IN THE THREE SECTOR WORKING GROUPS 13. The three sector working groups (ARUD, EII and EPW) under review received a large proportion of external resources. The allocations by sector and by financial year are shown in the figure below. The combined allocation for the three sectors in 2011/ 2012 amounted to KSh 122 billion out of the total economy-wide external funds allocation of KSh 183 billion. This translates to 67% of the total external funds. In 2012/2013, the allocation increased to 70%, with a combined amount of KSh 158 billion for the three sectors out of a total economy-wide allocation of KSh billion; while in the year 2013/2014, the three sectors received KSh 176 billion out of the allocated KSh 240 billion (73% of the total external resources). xvi
50 Total External Funds Vis Three SWGs Billions / / / 2014 ARUD 7,760,014,639 10,049,342,712 15,530,919,002 EII 87,846,402, ,632,371, ,564,248,176 EPW 26,405,126,476 26,405,126,476 27,665,343,510 Total External Funds 183,082,357, ,966,160, ,646,641,426 Figure 1: Sector funding from the Total External Resources (Ksh) 14. External funds shown above are largely in the form of loans allocated for infrastructure projects in water and transport. It has not been possible to ascertain how much of the external funding constitute climate finance, however, the amount for CRE is inadequate to climate proof investments in Kenya. 15. External resources made up approximately 58%, 73% and 79% of the total EII budget for 2011/ 2012, 2012/ 2013 and 2013/ 2014 financial years. Projects that could be considered climate relevant include: Menengai Geothermal Development Project- Strategic Climate Fund (KSh million); 16. The total contribution by development partners (loans and grants) is significantly higher than the total CRE in the three sectors during the three financial years under review. The ratio of CRE to External Resources received is 8.29% in 2011/12; 7.61% in 2012/13 and 8.48% in 2013/14. EPW has the highest Climate Relevant Expenditure at 6.45% of the total external resources, on the other hand, ARUD CRE was 1.37 % of the total external resources whereas EII s ratio of CRE to total ER was 0.31%. If most CRE is received from external resources, then EPW has received the most CRE and EII the least. Table 1: Total External Resources versus Total CRE and Ratio of CRE to External Resources Year 2011/ / /14 Grand Total % CRE of ER Total Ext Resources (ER) 183, , , ,696 Total ARUD CRE Total EII CRE Total EPW CRE Total CRE in 3 SWGs 15, ,191 20,407 52, % Ratio of CRE to External CPEBR study findings have revealed that Climate Relevant Expenditure in the ARUD, EII and EPW sectors over a three-year period between 2011 and 2014 was Ksh Billion (USD million). This is equivalent to 8.12% of the total external funds invested in the entire budget, which was Ksh Billion over three years. xvii
51 CONCLUSION COUNTY GOVERNMENT BUDGETING AND PLANNING PROCESSES 18. At the County level, there is need to consider vulnerability to climate change as a criterion for revenue allocation. This is because of climate migration from very vulnerable counties caused by drought to well managed pastures such as those in Isiolo and Laikipia, given the traditionally good pasture management by the inhabitants of Isiolo and ranchers in Laikipia. Such migration results in conflicts between humans on one hand and human and wildlife on the other. These resource conflicts tremendously increase costs to County governments. The Commission on Revenue Allocation (CRA) in allocating funding to the Counties only considers the following criteria; population; the poverty gap parameter; land area; basic equal share parameter and; fiscal responsibility. However, it is time to consider vulnerability to climate change and increase budget in accordance to projected climate migration. CLIMATE CHANGE BUDGET CODING AND IFMIS 19. The study has contributed to the finalization of a climate coding and tracking methodology designed for use by financial officers in the National Treasury, and eventually by other government ministries, departments and agencies (MDAs) as it would allow the GoK to record and analyse climate spending in the national budget per three climate finance categories: climate change adaptation (CCA), climate change mitigation (CCM) and climate change enabling environment (CCEE). 20. A step-wise illustration of how climate change flows and expenditure can be coded and tracked in the Integrated Financial Management System (IFMIS) is provided. It is proposed that the configuration of IFMIS should incorporate activity-level coding and tracking for a more enhanced and comprehensive basis of recording, monitoring and reporting on climate change expenditures. Crucial in enabling the integration / tracking of climate change initiatives across all sectors in GoK s planning and budgeting processes is the application of budget coding system for all Government budgets and expenditure under Programme Based Budget (PBB) approach and the IFMIS Standard Chart of Accounts (SCOA) 21. By providing climate definition and coding, the study has elaborated means and measures to efficiently and effectively track funds dedicated to climate change adaptation, mitigation and related activities, with a view to maximizing its mobilization locally and from external sources. It has also demonstrated how monitoring and reporting of climate change adaptation and mitigation expenditure can be carried out. 22. The ability to adopt the IFMIS system of the GoK to report effectively on transactions made against funds designated as climate relevant with minimal customization is useful to both manage the costs of mainstreaming climate change in the GoK PFM practices as well as lessen change management issues associated with the transition to mainstreaming. This guiding principle is strongly recommended in the designing of data flagging and reporting templates on the budget system RECOMMENDATIONS AND WAY FORWARD xviii
52 MAINSTREAMING CLIMATE CHANGE INTO PLANS AND BUDGETS For climate change to be integrated in the planning and budgeting especially for the period 2017/2018 and 2018/2019 going forward, there is need to: 23. Create, as a matter of urgency, enough awareness on the CPEBR study findings and recommendations, so that line ministries and agencies can plan, have the incentives to do so, and have better information on which to base the development and effective implementation of a comprehensive MTEF. 24. In the meantime, climate budget coding needs to be implemented in the IFMIS to aid in the tracking of climate finance. 25. The study has also generated information and guidance to support GoK in achieving the National Climate Change Action Plan (NCCAP), towards strengthening the integration into planning (MTP, annual work-plans and budgets (MTEF), and monitoring and reporting. However, the IFMIS system uses MTEF sectors since they are linked to classification of functions of government as described in the Government Financial Statistics (GFS) manual 2001 for international benchmarking. The MTP sectors that are linked to Vision 2030 and used by the Ministry of Devolution and Planning (MoDP) are different than the 10 MTEF sectors used by Treasury. The National Treasury (TNT) is in the process of developing a mapping between MTP and MTEF sectors on the IFMIs system to provide clear linkages between them. Similarly, the NT is also developing a platform for work-planning on budgeting modules of IFMIS. 26. MTEF process, that is integrated policy, planning and budgeting, is fundamentally about having expenditure programs that are driven by policy priorities and disciplined by budget realities. Defining and implementing a sectoral MTEF involves preparing estimates of overall resource availability, reviewing financing mechanisms, and preparing prioritized government spending plans. This is clearly not a one-off process. Rather it is iterative and must consider, changes in sectoral needs and priorities and changes in the overall resource envelope, on a periodic basis. 27. There is an opportunity for CPEBR findings to be incorporated in the 2017/2018 and 2018/19 budget cycle. As is the tradition, the National Treasury has sent out the MTEF Budget circular to all Cabinet Secretaries and Accounting officers whose purpose is to provide guidance on the processes and procedures to be followed when preparing the Medium-Term Budget for 2016/17. It is therefore late for CPEBR to be implemented during this budget year. It must wait till the next budget year 2017/2018. The guidelines are issued in accordance with Section 36 (2) of the PFM Act, 2012 and apply to all Ministries, Departments, and Agencies(MDAs). The guidelines provide the following information: Key policies guiding the preparation of the Medium-Term Budget; Process of undertaking Programme Performance Reviews (PPRs); Documents, form and content of the Budget Guidance on programmes and projects to be funded; Guidance on public participation in the budget process; and Key timelines and deadlines for activities in the budget process 1. The National Climate Change Directorate (NCCD) through representation in all SWGs could ensure that programmes and projects are climate proofed by giving guidance on some of the climate change activities that can be included in the programmes budget after the MTEF sectors are launched in the coming year. 2. The Budget Review Outlook Paper (BROP) will ensure that climate related issues/activities and budget are well articulated. xix
53 xx 3. Sector Working Groups are normally convened around October of every year. The Climate Change Directorate (CCD) could ensure participation in these working groups to ensure that NCCAP recommendations, and their required financing are well captured in the sectoral budget submissions.
54 1 INTRODUCTION 1.1 Background and Rationale The analysis of Kenya s expenditure on climate was conducted to give deeper insights into Kenya s climate change policy, paying attention to the link between expenditure, national strategies and development plans, sectoral plans and action plans, and county level plans and budgets. The role and responsibilities of institutions involved in managing the response in terms of budget planning and their interaction with the National Treasury is provided as a first step in the quantification of climate change related expenditure. In addition to the national budget, other funding channels such as the external resources provided by development partners, is analysed - providing a baseline for future analysis. The background and rationale of the study is that Kenya is a resource dependent economy and therefore vulnerable to climate change risks, and could lose up to 3% of the annual GDP by 2030 due to climate related risks (SEI 2009) 1. To tackle climate change challenges in a systematic manner, the Kenya National Climate Change Action Plan (NCCAP) was developed in 2013 to operationalize Kenya s National Climate Change Response Strategy (NCCRS), which was published in The NCCAP estimated that operationalising the NCCAP would require an estimated KSh trillion (USD billion) between 2013 and Between 2005 and 2015, the GoK had committed approximately KSh 37 billion while development partners had committed KSh 194 billion to programmes that they classified as having a significant or principal climate change component. The NCCAP is in line with both Vision 2030 as well as the Medium-Term Plan (MTP). Implementation of the Kenya Vision 2030 is being undertaken through using a series of 5-year Medium Term Plans (MTP). Consequently, annual budgets and action plans are based on these MTPs. Additionally, the Government has been making significant investments in infrastructure, energy, water, and agriculture. Recent extreme occurrences like the floods in May- June 2015; the frostbites over the tea zones in central Kenya; and the prolonged droughts experienced in recent years, among others, have demonstrated that these investments could be at risk due to extreme weather events whose frequencies and intensities are likely to increase in the future. This has the potential to undermine the Government s development plans, compromise gains made over the years, and reduce returns on investments. Prioritization of scarce resources is therefore crucial in the budget making process, which is embedded on a Medium-Term Expenditure Frame-work (MTEF) and is coordinated by the National Treasury. The expectation that, the CPEBR will: inform on measures that can be used to increasing allocations for climate financing funds dedicated to climate change adaptation and mitigation enable tracking of public expenditure against national policy priorities and plans contribute to strengthening monitoring and reporting of climate change adaptation and mitigation efforts contribute to Kenya s efforts to position itself to access dedicated climate finance resources such as the Green Climate Fund (GCF), and Enrich future Government-led stakeholder dialogue and learning The objective of the CPEBR is to conduct an analysis of Kenya's Climate Public Expenditure and budgeting processes and provide guidance to strengthen efficiency and effectiveness of 1 SEI 2009: The Economics of Climate Change in Kenya: 1
55 climate finance in public financial management systems. (Full Terms of Reference are in Annex 1) This report presents an analysis of the country s processes for budgeting, tracking and reporting on climate change related public expenditure and provides guidance to strengthen the efficiency and effectiveness of climate finance in national and county Public Financial Management (PFM) systems. Three core aspects of the national budget cycle related to climate change actions were reviewed, viz: The integration of climate change in the budgeting process, as part of budget planning, implementation, expenditure management and financing; Existing policy priorities and strategies relating to climate change, planning, budgeting, and the extent to which the strategies and policies are coherent with national development, poverty reduction and inclusive green economic growth strategies; Institutional arrangements that promote the integration of climate change policy priorities into national budgeting and public expenditure management. The CPEBR has developed procedures and codes for budgetary allocations, tested those procedures by retrofitting the model in the MENR and is ready to pilot these as the budgetary process of 2016/2017 gets underway. The CPEBR has also developed Guidance Notes to inform MTEF sector working groups on planning, budgeting and tracking NCCAP priorities in MTEF process and; a draft GoK notification on the budgetary coding to assist in the adoption of climate expenditure tracking in the upcoming financial year. (Full documents can be found in annex 7 and 8.) 1.2 Policy and Institutional Framework for Climate Change Climate change policy mainstreaming is the integration of priority climate change adaptation and mitigation responses into development, to reduce potential development risks and take advantage of opportunities. The objective is for these measures to be implemented as part of a broader suite of measures within existing development processes and decision cycles (OECD 2009, p. 60). Mainstreaming (or integrating) climate change in planning and decision-making processes is a crucial tool to ensure climate change adaptation and socio-economic development initiatives are implemented together. This approach involves considering at all stages of policy, planning and budget allocation stages, the risks and opportunities while putting in place adaptation measures that are attuned to the long-term vision of development. Although uncertain, climate change risks are real and need to be better understood, planned and mitigation measures properly financed to avoid unwanted consequences. Responding effectively to climate change risks requires the government to consider the potential costs and benefits of various actions as well as inaction. It is even more important to consider the costs and the benefits of climate change policies because all resources human, physical, and natural are scarce. Policymakers must consider the benefits not obtained when resources are devoted to reducing climate change risks, just as they must consider the climate change risks incurred or avoided from different kinds and degrees of policy response. There are several policy instruments that have been put in place to address climate change impacts in Kenya. These include the 2010 National Climate Change Response Strategy (NCCRS) which was developed to further understand the risks and required responses and guide low carbon path. The NCCRS gave rise to the National Climate Change Action Plan (NCCAP ) developed to operationalize the NCCRS and address climate change in 2
56 Kenya. Other policies include the National Environment Policy (2013) and the draft Climate Finance Policy. There is an important intersection between climate change policy and development in that they both aim to address the root causes of vulnerability. Mainstreaming of climate change financing in development activities is one way to engage directly at this intersection. Different sectors have policies relevant to climate change, including; the Agriculture Sector Development Strategy Policy (2004); National Energy Policy (2012, which is under revision); National Policy for the Sustainable Development of Arid and Semi-Arid Lands (2004); Integrated National Transport Policy (2010); Feed in Tariffs (FiTs) policy (revised 2012); National Disaster Management Policy (2012); Renewable Energy Policy (2014) and; the Kenya Forestry Master Plan ( ). The cost of implementing these policies need to be understood as well as budgetary allocations. Benefits and costs matter, for both efficiency and equity reasons, and that benefits and costs must and can be considered in the context of the uncertainties that surround climate change. As already intimated above on scarcity of resources, good climate change policies and plans should therefore reflect the inherent trade-off between the stringency of a target (however defined) and the flexibility to meet this goal. Different policy tools can inflate or attenuate the costs of hitting any given target. Inflexible policies or inefficient plans inflate costs without additional reductions in climate risk, while well-designed policies can facilitate lowering the cost of achieving targets and thereby make more stringent targets affordable. Climate change policies and financing strategies therefore need to be based on evidence based on data on the ground. The NCCAP estimated in 2012 that the cumulative climate change budget commitments provided by the Government of Kenya was US$ 438 million and that of development partners as US$ 2.3 billion over the years Analysing the costs of climate change mitigation requires understanding the budget cycle. The Climate Change Directorate (CCD) 2 under the State Department of Environment, is the Government s lead agency for overall coordination of climate change activities in Kenya (Ministry of Environment and Natural Resources, 2016). The CCD replaced the National Climate Change Secretariat (NCCD). The CCD was established under Section 9 of the Climate Change Act The Act stipulates that the CCD shall be headed by a Climate Change Director who will report to the Cabinet Secretary. The Directorate has the following departments: - Mitigation - Adaptation - Knowledge Management and Capacity Building - Negotiation and Climate Finance The Climate Change Act (2016) proposes establishment of a climate change unit under the CCD. The CCD is also Kenya s focal point for UNFCCC (MENR,2016). In-addition, The CCD is responsible for coordinating implementation of the National Climate Change Action Plan (MENR, 2016)) (Ministry of Environment and Natural Resources, 2016). Currently, MENR has prepared Kenya s Intended Nationally Determined Contributions (INDC) and National Adaptation plan (NAP) (2015/2030) in the run up to the Paris Climate Summit in December The Ministry has also formulated the National Climate Change Act (2016). This Act provides a legal and institutional framework for climate change mitigation and 2 CCD was previously known as The National Climate Change Secretariat (NCCD) 3
57 adaptation efforts in Kenya. Section 9 of this Act establishes the Climate Change Directorate (CCD). The CCD is the Government s lead agency for overall coordination of climate change activities in Kenya. In addition, there is also the National Climate Change Action Plan (NCCAP) (2015/2017). The NCCAP notes that finance, technology and capacity building support can help fill information and capacity gaps and overcome financial, regulatory and policy barriers impeding adaptation and mitigation efforts. Initiatives that can achieve the targeted mitigation potential include: institutional strengthening, improved information systems, and mainstreaming climate change across policies and programmes. Notably, Kenya also has a Draft Climate Finance Policy which provides legal and institutional framework to guide and promote: climate finance flows, tracking of climate finance, private sector participation, technology transfer, and equitable benefit sharing from climate change interventions in the country. It seeks to Enhance the implementation of public finance management in relation to climate financing; Establish mechanisms to mobilise internal and external climate finance (including a National Climate Change Fund); Track, monitor, evaluate and report on sources, applications and impacts of climate finance; Enhance the capacity of the country to mobilize climate change finance to support sustainable development; and Encourage private sector participation in climate relevant financing opportunities. The Draft policy focuses on the agriculture, livestock and fisheries (for example climate smart agriculture); forestry (increasing forest cover to 10%); energy (expansion of renewable energy and energy efficiency); transport (low-emitting clean energy sources such as bio-fuels and mass rapid transit system for Nairobi) and; industry (clean technology, cogeneration of power) sectors of the economy. Kenya has also developed the Green Economy Strategy and Implementation Plan (GESIP). The strategy focuses on four strategic objectives, namely, (i) sustainable infrastructure development, (ii) natural resource management, (iii) building resilience to climate change, and (iv) promoting resource efficiency. Further, several Nationally Appropriate Mitigation Actions (NAMAs) are at different stages of development (Waste NAMA, Charcoal NAMA, Geothermal NAMA the most advanced among them having been submitted to the UNFCCC NAMA Registry in in July 2014 to seek for implementation support. These initiatives and future ones are likely to have an impact on climate finance priorities. Other key Government actors under MENR that are important in addressing climate change are the Kenya Meteorological Department (KMD), which is the custodian of perhaps the most comprehensive national climate database in addition to being the national IPCC focal point; and the National Environment Management Authority (NEMA) that is the National Implementing Entity (NIE) under the Adaptation Fund. NEMA has also been accredited as the NIE for the Green Climate Fund (GCF), and is currently rolling out some projects utilizing GCF funds. Climate change coordinating units have been established in other line Ministries, Departments and Agencies such as the Water, Energy, Agriculture, Livestock and Health ministries, the Kenya Agricultural and Livestock Research Organization (KALRO) and the Kenya Forest Service (KFS), among others. The National Treasury, through the Department of Economic Affairs, which is the National Designated Authority (NDA) for Green Climate Fund (GCF) as well as the proposed Climate Change Fund, currently has a Climate Finance Unit that is in the process of setting up the necessary structures and has already undertaken work on Climate Change Budget Codes (CCBC) for tracking the flows of climate finance into the country aimed at enhancing national planning and budgeting as provided for under the Public Finance Management Act,
58 In addition, the National Treasury has been spearheading the following: Revision of a draft Climate Finance Policy to include all aspects of Climate Finance; Fiscal support to low-carbon-climate resilient development focusing on infrastructure (renewable energy, agriculture, transport, water, etc.) Development of a National Carbon Registry for fast-tracking investments in lowcarbon emission projects in the country Removal of fiscal barriers hindering the shift to green economy With regards to the implementation of climate change actions, almost all sectoral ministries are involved. The key ministries include: Ministry of Agriculture, Livestock and Fisheries as well as the Ministry Land, Housing and Urban Development (clustered in the Agriculture, Rural and Urban Development Sector) Ministry of Information, Communications and Technology, the Ministry of Energy and Petroleum and the Ministry of Transport and Infrastructure (classified as the Energy, Infrastructure and ICT sector) Ministry of Environment and the Ministry of Water (clustered in the Environment and Water Protection sector) Avenues for institutionalizing Climate Change financing in the MTEF Budgetary Process For accurate definition and realization of public expenditure policy, it is necessary to consider program requirements over the medium-term perspective. In the case of climate change financing, however, the need for predictability of expected developments in the macroeconomic environment and the scope of available budgetary resources in the medium and longer term, is important. Improvement of efficiency of the public expenditure management system is the main objective of the Medium Term Public Expenditure Framework (MTEF). The MTEF defines a three-year rolling macroeconomic framework which outlines overall resources and forms the basis for setting of national priorities and expenditure prioritization. The MTEF budget process is preceded by a National Development plan that spells out the broad macroeconomic policies. The Macro Economic Work Group (MWG) prepares a medium term fiscal strategy that sets out (i) the optimal levels of aggregate revenue and expenditures and (ii) Financing deficits. The Treasury then issues budget guidelines to the various accounting officers. These guidelines include: The composition of the SWG s; The MTEF calendar; The fiscal strategy over the medium term; The sectoral resource ceilings; Other budget preparation information; This is meant for the ministries and government agencies to effectively participate in the budget process through their respective sectoral work groups. The SWGs prepare sector reviews and come up with reports outlining: Their overall missions, objectives and strategies in a prioritized format. Then the sectoral ceilings which take to consideration the following factors are issued: The overall available resources: The national objectives (often revolving around): Economic growth; Historical resource allocation On-going project commitments; 5
59 Donor commitments Government contribution to Donor funded projects. Upon receipt of proposals from the SWGs, the MTEF secretariat organizes sectoral hearings whereby the SWGs present their respective sector reports and receive comments from the public. This then enables the Treasury to come up with a Medium-Term Expenditure Framework to facilitate inter-sectoral allocations. The sectoral resource ceilings are then confirmed and are presented to the cabinet for discussion. They are then forwarded to the ministries to prepare itemized budgets which are forwarded to Treasury for consolidation and submission to parliament for approval through the traditional budget process. The likelihood of realizing the objectives of climate change policies and the efficiency of the public expenditure management system in the allocation of resources to the appropriate sectors can be assessed by the following two stages, which can also form the avenues for identification of appropriate intervention stages. Stage 1. Overall fiscal discipline, determined by the cabinet as a policy issue in the Budget Review and Outlook Paper (BROP). The budget resources package as contained in the BOP should be clearly defined and comprehensively formulated to include climate change interventions; it should be formed prior to the allocation of expenditures and substantiated by medium-term macroeconomic forecasts. Allocation of expenditure should be accurately implemented within the framework of agreed budget resources, and their further execution should be carried out within the limits of budgetary allocations envisaged for the programs selected in accordance with the defined expenditure priorities which should prioritize climate related expenditures or mainstream the same within programs but with a level of clarity to allow for distinctions. BROP for financial year 2016 and 2017 is expected to be released by October Stage II: Planning and budgeting to ensure efficiency of allocation Public expenditure towards climate change related initiatives and the wider economy should be consistent with the stated policy priorities, and the system makes it possible the inter-sectoral and intrasectoral redistribution of resources from lower priorities to higher ones and from less efficient programs to highly efficient ones. Technical (productive) efficiency Sectoral ministries (departments) shall ensure the maximum attainable level of efficiency, which should be comparable with the corresponding indexes of the private sector. As a tool for aligning policy, planning and budgeting, the MTEF therefore provides an avenue for mainstreaming climate change financing as well as a solution of the following expenditure allocation problems: (i) Improvement of macroeconomic balance, through formation of a realistic and comprehensive package of resources; (ii) Promotion of efficient inter-sectoral and intra-sectoral redistribution of budget allocations from the state financial resources per prioritized areas; (iii) Reduction of existing uncertainties between policies and their financing at the possible extent to contribute to the improvement of the quality of projects elaboration process; (iv) Establishment of robust budget ceilings by sectors, thus creating conditions and incentives for the line ministries (departments) to carry out targeted and efficient use of available resources; 6
60 2 CPEBR STUDY APPROACH AND METHODOLOGY Building on the experiences in other countries, and using emerging generic Climate Public Expenditure and Institutional Review (CPEIR) methodology, the analysis looked at the core aspects of the planning and budgeting cycle processes outlined above vis-a-vis climate finance. A schematic drawing showing the approach and methodology is in Annex 3. The methodology was designed to examine three core aspects of the national budget cycle that relate to climate change climate change, planning, budgeting and the extent to which these strategies and policies are coherent with national development, poverty reduction and inclusive green economic growth strategies ; a review of institutional arrangements for promoting the integration of climate change policy and; a review of the integration of climate change objectives within the budgeting process, including as part of budget planning, implementation, expenditure management and financing. The study proposed a definition of climate change expenditure based on previous work; developed a guide on how to mainstream climate change in the budgetary process; established a monitoring and evaluation as well as a tracking system with the MoDP proposing a set of climate change finance related indicators that for inclusion at the national, sector and county levels for monitoring and evaluation. The study consisted of a literature review and analysis; key respondent interviews; national and county level stakeholder consultations; case study analysis; retrofitting climate codes at national level ministries and; piloting the CPEBR at county levels. The section below briefly describes steps undertaken. 2.1 Literature review and analysis An analysis of Kenya s existing national policies, strategies, legislations, development reports and standards in relation to the promotion of climate change mainstreaming in budgetary planning, climate resilience and green economic growth in Kenya was carried out at the beginning of the project. The literature review was conducted to give an overview of laws pertinent to Kenya s financial management, devolved government as well as climate change mainstreaming, and informed recommendations of a climate expenditure definition in Kenya proposed in the CPEBR, as well as strategic interventions, policy actions and options for effective climate public expenditure systems. 2.2 Key respondent interviews using survey instruments Key informant interviews were carried out with officers from the National Treasury to advice on Kenya s complex budgetary process; officers from the MoDP on current monitoring and evaluation systems; officers from NCCD of MENR on the status of the NCCAP and; technical and financial officers from the relevant sectors at the national and county levels. 2.3 Consultative Workshops Defining climate expenditure for Kenya required a wide range of stakeholder input as it is still a new concept. Consequently, several national level stakeholder consultations were carried out at each stage of the project inception and mid-term report presentation; SWG consultations; county data collection and; national final report validation. Full workshop reports can be found in the Annexes. 7
61 2.4 Data Collection A guided questionnaire was used at the national and county level to extract the relevant information from three sectors, that is, Agriculture, Rural and Urban Development (ARUD); Energy, Infrastructure and ICT (EII); as well as Environment Protection, Water and Natural Resources (EPW) sectors. Financial data was supplemented with the MTEF and the Programme Based Budget (PBB) for the 2011/12, 2012/13, 2013/14 and the 2014/15 financial years and the 2015 Budget Policy Statement. At the County level, the following documents, where available were collected; the County Budget Review and Outlook Papers (CBROP), the County Programme Based Budgets (CPBB), county budgets, the County Integrated Development Plans (CIDP), the County Budget Outlook Papers (CBOP), and, the County Medium Term Expenditure Framework Budget Estimates. 2.5 Data analysis The following coding and numbering system was used to highlight climate expenditure based on climate change adaptation and mitigation activities as defined by the OECD/ DAC Rio Markers; adaptation (1), with colour code green; mitigation (2), with colour code yellow; capacity building/ enabling environment (3), with colour code blue; None of the above; blank. 2.6 Challenges in Data Gathering and Analysis The following challenges were encountered: Depth of budget breakdown: the national budget captures expenditure at the programme and sub-programme level. It would be more accurate to identify the cost of each separate line of action/activity under each sub-program Definition of climate expenditure: climate finance expenditure definitions remain subjective at the programme and sub-programme level, the decision as to whether costs incurred was climate relevant would have been better informed by the type of project and activity. Additionally, teasing out climate expenditure was a challenge given that the planning and budgeting documents had not been developed with explicit climate change considerations. Inadequate financial information: some documents at the county level were unavailable. For example, Isiolo County did not have a PBB for the 2013/2014 financial year, therefore expenditure information was sourced from Controller of Budget reports. The challenges that the CPEBR faced included accuracy of official financial information where slight differences between published figures and actual financial records were encountered. This was addressed by agreeing to use the actual financial records held by the Integrated Financial Management System (IFMIS) unit of the National Treasury (TNT). In addition, the depth of budget and expenditure breakdown is currently limited at program and sub-program levels, and does not capture the cost of each separate action/activity under each sub-program. This makes it difficult to estimate the amount of money that was spent on climate relevant activity in a sub-programme. Also, the absence of activity level expenditure and work-plan made it difficult to assess additionality and incrementality of climate finance. To overcome these two challenges, the appropriation accounts for the period under review, were examined and for those sectors such as ARUD and EPW whose programs contained actions that were deemed as significant to adaptation or mitigation or enabling environment in the sub-programme, were categorized as so. It should be noted that in some cases where there was no adequate information to assess additionality and incrementality, the figures for climate finance include the entire amount allocated to a sub-program and qualified as climate relevant expenditure. It is for this reason that a thorough study needs to be undertaken focusing on one SWG to come up with actual amount of climate finance. 8
62 3 DEFINITION OF CLIMATE FINANCE IN THE KENYAN CONTEXT 3.1 Definitions What is Climate Finance? Broadly, climate finance (CF) refers to the flow of funds toward activities that reduce greenhouse gas emissions (mitigation) or help society adapt to climate change impacts (adaptation) 13. It refers to all flows channelled by national, regional and international entities for climate change projects and programmes and includes all incremental investments/ commitments beyond business-as-usual activities that are aimed at increasing the community s resilience against climate change effects or limiting GHG emissions. In its Global Landscape of Climate Finance studies, the Climate Policy Initiative (CPI) 4 applies a definition of climate finance which counts public and private investment costs plus public framework expenditures but excludes revenue support. The CPI does not include policyinduced revenues such as those generated by feed-in tariffs and carbon credits. The definition of CF in the Kenyan context presented in section comprises both project and enabling costs such as feed-in tariffs and carbon credits Types of Climate Finance Climate Finance can be tailored for adaptation, mitigation or cross-cutting activities, depending on the nature of its intended use. Mitigation can include renewable energy, energy efficiency and fuel switching, forestry and land use, urban transport and carbon sequestration projects, as well as technical assistance and capacity building to address climate change. Adaptation includes projects that are partly or wholly dedicated to addressing the impacts of climate change, such as water scarcity, agricultural resilience and infrastructure to withstand floods and other extreme weather, and capacity building 2. Climate Finance can also be national/ domestic (domestic funding of climate related programmes) or international financial flows from developed (Annex I) to developing (Non- Annex I) countries for climate change mitigation/adaptation activities if viewed in terms of direction of capital flow. It can be private (where capital to fund climate related projects is provided by the private sector) or public (in cases that the capital is raised through government revenue streams for climate change projects, whether international or domestic). Climate finance perspectives can be narrowed to gross flows and net flows 5 that shed light on the level of mobilized international investments and the net contribution of recipient countries. The gross and net approaches serve different purposes, and there are different perspectives on whether finance should be measured on a gross or net basis, particularly regarding private and non-concessional flows. The on-going controversies make it difficult to recommend a specific choice, but suggest that both ways should be considered depending on the specific finance flow taken into consideration. It will therefore be important to clarify what metrics will be used when tracking climate finance flows in Kenya, to avoid a mixture of both which would lead to inconsistent aggregate results , 4 Buchner B., et al, The Landscape of Climate Finance, (2011). 9
63 Generally, where incremental data is available, the net approach should be adopted since it gives a more accurate estimation of the OECD- DAC Definition of Climate Change Mitigation Mitigation: An activity should be classified as climate change (mitigation) related if it contributes to the objective of stabilization of greenhouse gas (GHG) concentrations in the atmosphere at a level that would prevent dangerous anthropogenic interference with the climate system by promoting efforts to reduce or limit GHG emissions or to enhance GHG sequestration. The activity contributes to: The mitigation of climate change by limiting anthropogenic emissions of GHGs, including gases regulated by the Montreal Protocol; or The protection and/or enhancement of GHG sinks and reservoirs; or The integration of climate change concerns with the recipient countries development objectives through institution building, capacity development, strengthening the regulatory and policy framework, or research; or Developing countries efforts to meet their obligations under the (UNFCCC) Convention. climate costs and the resulting benefit to Kenya. However, comparative analysis between gross and net costs may not be available for some projects and the gross cost will be adopted. Similarly, projects funded by concessional funding agreements may adopt a gross rather than net perspective if the facility is conditional and has a grant element of at least 30%. A net view may be adopted if the focus is on cost of the funding facility only. Climate finance can also be reckoned as the incremental cost or investment capital 4 to apportion a sum against climate specific costs of an investment. An understanding of the incremental cost can help identify where flows come from, while ultimately it is the investment cost that forms the greatest portion of expenditures. Incremental cost refers to financial resources provided to cover the difference or increment between a less costly, more polluting option and a costlier, more environmentally-friendly and/or climateresilient one (GEF, 2010). Incremental costs are like revenues to recipients. Investment capital, on the other hand, refers to tangible investment in mitigation or adaptation projects which needs to be paid back. Incremental costs often make the difference in the final investment decision, and are generally covered by public climate finance resources. 3.2 Kenya Climate Finance Definition and Use of Rio Markers The CPEBR study has proposed a definition of Climate Finance (CF) in the Kenya context that enhances a localised understanding of climate change activities for national planning and budgeting purpose and provides a useful insight for climate finance tracking, mobilization and scale up. The definition also considers the fact that GOK is interested in understanding the full cost of managing the effects of climate change in the economy. This means that all sources of funds (i.e. domestic and external, public and private) used to manage these effects will be considered in tracking of climate related costs. The study proposed a definition of Climate Finance (CF) in the Kenya context that enhances a localised understanding of climate activities and the full cost of managing the effects of climate change in the economy. This definition is to be used in future once a climate code is functional in IFMIS and in the budgeting process. Once the CF definition is functional, it is recommended that all sources of funds (i.e. domestic and external, public and private) spent be considered in 10
64 tracking of climate related costs. Based on this study, CF is defined as additional or incremental investment made in activities aimed to climate proof programs and projects against climate change impacts including deliberately reducing greenhouse gas (GHG) emissions. CF is therefore additional costs incurred or additional funds invested in an activity to make it resilient to climate risks otherwise called climate change adaptation (CCA) activities, or costs for causing greenhouse gas (GHG) emissions reduction and/or climate change mitigation (CCM) and costs for or invested in climate change enabling environment (CCEE) activities such as strategy, policy development, international negotiations on climate change and other cross-sectoral issues. Or simply additional or incremental investment made in activities that aim to: i) climate proof programs and projects against climate change impacts, and/or ii) reduce greenhouse gas (GHG) emissions. The criteria for defining climate finance in the context of Kenya s public expenditure have been adopted from the Climate Change Budget Code (CCBC) report and the OECD DAC Rio Markers. The CF definition is specific to additional or incremental amount needed to climate proof projects and will only to effect once the climate change budget code is fully functional Climate Relevant Expenditure Since budget coding was not in place, Climate Relevant Expenditure (CRE) was used to denote costs invested (capital, labour and related) in programmes and sub-programmes where specific costs of climate change activities may not be specifically shown. For an activity to qualify to be categorized as CRE, funds incurred or invested must: g. address one or all the climate change risk mitigation or proofing category e.g. adaptation, mitigation or enabling environment (climate awareness, training, policy and capacity building) as per the definition given by OECD h. more than 25% of the funding must go to one or all the above climate risk mitigation or proofing category i. Actual incremental or additional financing need not be demonstrated but there must be certainty that funds have been used for a) above. j. Outcome/output must be increased resilience, reduced emissions or more awareness on climate change k. technical and finance officer must agree on the above l. each sector should have some guidelines on how to arrive at CRE and CF In instances where it was not possible to accurately determine climate change activities from the programmes and sub-programmes, the figures provided in the findings are more Climate Relevant Expenditure (CRE)which denote costs invested (capital, labour and related) in programmes and sub-programmes where specific amounts for climate change activities are not clearly shown. This was done in consultation with a technical officer and finance or accounts officer. Not included in the study is money that the National Treasury transfers to Semi- Autonomous Agencies (SAGAs); for instance, during the 2014/2015 financial year an estimated KES 565 billion was transferred to various SAGAs responsible for budget implementation but there is no clear way to track the expenditure, as SAGAs have different budget systems and are not obliged to use IFMIS. Also, it was learned that only Parliament could recommend that direct transfers include activity descriptions of the breakdown of funds being transferred to SAGAs. The CF definition is specific to additional or incremental amount needed to climate proof projects, whilst the term Climate Relevant Expenditure (CRE) is used to denote costs invested (capital, labour and related) in programmes and sub-programmes where actual and specific climate change activities are not shown. The criteria for defining climate finance and CRE in the context of Kenya s public expenditure have been adopted from the Climate Change Budget 11
65 Code (CCBC) report and the OECD DAC Rio Markers. Using this definition and bearing CRE in mind, the study analysed government spending at the national and the county level The document used Rio markers to develop an approach for identifying and tracking climate finances based on interrogation of actual / planned activities of an MDA for relevance to climate change. Relevance was hinged on OECD s definition for principality or significance in relation to the purpose of undertaking the activities/ projects. The flexibility provided for by the approach used in the CCBC report in tagging and subsequent tracking of climate finances allows for all kinds of conventional definitions of climate finance (adaptation, mitigation or cross-cutting issues, which in our definition such activities are now categorized under the Climate change enabling environment (CCEE). These definitions are in line with the NCCAP and provides for revisions or updates where necessary by linking with MTEF sectors and associated programmes, such as the programme-based budget Below are the OECD- DAC Rio Markers on climate change adaptation (which also includes climate change enabling environment) and climate change mitigation. Text Box 1: Climate Relevant Spending from the MTEF 1. Examples of Mitigation activities in Kenya from MTEF EII: Alternative energy technologies: (generating renewable sources of energy) EPW: Water resource management and water storage (Increasing forest cover in the Upper Tana River area) Adaptation Activities (OECD DAC Rio Markers) Adaptation: An activity is classified as adaptation if it intends to reduce the vulnerability of human or natural systems to the impacts of climate change and climaterelated risks, by maintaining or increasing adaptive capacity and resilience. Some adaptation activities include: Supporting the integration of climate change adaptation into national and international policy, plans and programmes. Improving regulations and legislation to provide incentives to adapt. Education, training and public awareness raising related to the causes and impacts of climate change and the role of adaptation. Adaptation-related climate research including meteorological, hydrological observation and forecasting, impact and vulnerability assessments, early warning systems, etc. 2. Examples of Adaptation activities in Kenya from MTEF ARUD: Livestock production and management (water harvesting for pastoral communities) EII: Rehabilitation of roads and bridges EPW: Integrated basin based development (irrigation schemes in rural areas established) 3. Examples of Enabling Environment activities in Kenya from MTEF ARUD: Agricultural planning and financial management (capacity building for farmers) EII: Infrastructure connectivity (migration to analogue to digital TV broadcast) 12
66 4 NATIONAL LEVEL ANALYSIS 4.1 Analysis of Sector Climate Relevant Expenditure Data collected from three sectors, namely, Agriculture, Rural and Urban Development and Housing (ARUD); Energy, Infrastructure and ICT (EII); and, Environment Protection, Water and Natural Resources (EPW), were analysed. These sectors are prioritized in both the first ( ) and the second Medium Term Plans (MTP) ( ) as those with the greatest impact to the socio-economic and environmental development of the country. ARUD is one of the economic pillars with a huge budget to increase investment in irrigation to reduce the country s dependence on rain-fed agriculture, mechanize agriculture, and emphasize on value addition in the production and supply chain. With regards to EII, the two MTPs ( and ) emphasize investment in cheaper and adequate electricity; local and regional rail and road networks that provide safe, efficient and costeffective transport; adequate water for households and industry and affordable quality housing for sustainable environmental management. Results and findings below are based on data collected on the investments that have been made on the sectoral programs in the three sectors. In this section, findings on how much government has spent on projects in three SWGs (ARUD, EII and EPW) is analysed as well as climate relevant expenditure (CRE) in the last three financial years (2011/12; 2012/13 and 2013/14) is shown. The term Climate Relevant Expenditure (CRE) has been coined to refer to costs incurred, funds disbursed and/or investments made to train, capacity build, create awareness on climate change or to put in place measures that would climate-proof or avert climate risks. This definition, also allow for data on projects and programs domestically funded by the GoK and with relevance to climate change adaptation (including enabling environment and capacity building) and mitigation to be included in the analysis. The analysis firstly shows the expenditure against the total approved budget, then goes further to isolate CRE, that is, funds invested or costs incurred in implementing activities that qualify under of the three categories climate change adaptation (CCA), climate change mitigation (CCM) and enabling environment (CCEE). CCEE is a cluster category comprising capacity building, policy and strategy development, and general climate awareness raising. 4.2 Agriculture, Rural and Urban Development Sector (ARUD) The ARUD sector comprises of three sub-sectors, namely; Agriculture, Livestock and Fisheries; Land, Housing and Urban Development; and the National Land Commission. It also includes research organisations, state owned commercial enterprises, regulatory bodies, statutory boards, training institutions and service organisations related to agriculture, housing, rural and urban development. Agriculture is the mainstay of Kenya s economy, and per the 2014 MTEF sector report the agricultural sector directly contributes 25.3% of the GDP valued at KSh 961 billion. Through linkages with the manufacturing, distribution and other service related sectors, agriculture contributes approximately 27% to the GDP. It further accounts for about 65% of Kenya s total exports, and 18% and 60% of the formal and total employment, respectively (Economic Survey 2014). The goal of the sector is to attain food security, sustainable land management, affordable housing and sustainable urban infrastructure development. 13
67 The key policy goals raising agricultural productivity through value addition; increasing market access and adoption of technologies; exploiting irrigation potential; increased commercialization of the sector activities; exploiting the potential of Exclusive Economic Zone (EEZ); creating an enabling policy and legal framework; improving efficiency and effectiveness of sector institutions; effective administration and management of land and land based resources; enhancing urban development; development of decent and affordable housing, and sustainable management of resources in the sector. The Government of Kenya recognizes the importance of agriculture in Kenya, and consequently the ARUD sector has been identified as one of the six sectors aimed at delivering the 10% economic growth rate under the Vision ARUD Actual Expenditure Compared to the Approved Expenditure The ARUD planned budget for the year 2011/2012 was KSh billion. The money spent during the same period was, however, billion, representing 85% of the planned budget. In the 2012/2013 financial year, billion was spent against an allocation of KSh billion, representing an absorption rate of 85%. In the financial year of 2013/2014, the sector s absorptive capacity rate was even lower at 80%, having spent KSh 52 billion of the allocated 65 billion. This could be attributed to the fact that 2013 was an election year and the impending changes from a central government to a devolved system, meant that programme budget is put to a halt. Despite the low expenditure there was a steady rise in allocated funds, from KSh 55,843 billion in 2011/12 to KSh 65 billion in 2013/2014. Figure 2 illustrates the sector s approved budget versus the actual expenditure. ARUD: Planned Vs Actual Expenditure 2013/ / / / / / 14 Planned Expenditure 55,843 59,096 65,391 Actual expenditure 47,589 50,411 52,367 Billions Figure 2: ARUD actual expenditure compared to the approved budget ARUD Climate Relevant Expenditure on Mitigation, Adaptation and Enabling Environment Climate Relevant Expenditure (CRE) refers to costs incurred or investment made in climate change adaptation activities, climate mitigation or greenhouse gas emissions reductions and activities to achieve climate enabling environment. This definition also allows for data on 14
68 projects and programmes domestically funded by the GoK that have relevance to climate change adaptation and mitigation to be included in the analysis. The definition of climate relevant projects is based on the mitigation and adaptation definitions put forth by the OECD DAC. Nonetheless it still relies on human judgement on classification as climate relevant or not as was the case during the collection and analysis of this data. Sectoral reports and related documents attest to the fact that the ARUD sector is vulnerable to climate change as exhibited through the effects of extreme climate and weather events like frequent and prolonged droughts, frost, floods, and sea level rise. There are also indications of the emergence of new pests and diseases which impact negatively on sustainability of ARUD sector activities. Another key issue in this sector is the rapid rate of urbanisation witnessed since independence, leading to land-use changes from agriculture to the built environment and fragmentation of the existing land for Agriculture. Kenya s Vision 2030 projects that 60% of the population will be living in urban centres by 2030, from the estimated 34% captured in the 2009 census. This rapid urbanisation is placing a strain on urban infrastructure, resulting in growing informal settlements, inadequate water, sanitation and electricity supply. Urban planning is also a concern considering extreme climate and weather events, and flooding and heavy rainfall. Recent flooding in some parts of Nairobi attests to this. Climate change may, however, also present opportunities to the sector players in identifying potential programmes for implementation. Figure 3 below illustrates ARUDs Panned Budget, Expenditure and Climate Relevant Expenditure CCA Adaptation, CCM- Mitigation and CCE -Enabling Environment. ARUD Planned Budget, Expenditure and Climate Relevant Expenditure BUDGET EXPENDITURE CCA CCEE CCM TOTAL CRE 2011/ / / 14 Figure 3: ARUD Planned Budget, Total Expenditure and Climate Relevant Expenditure on Mitigation, Adaptation and Enabling Environment The Key to Figure 3 above is provided below 15
69 2011/ / / 14 Grand Total Planned Budget 55, , , , Expenditure 47, , , , CCA , , CCEE 1, , , CCM Total CRE 1, , , , ARUD Climate Relevant Expenditure Despite the sector being vulnerable, CPBER analysis has shown that climate relevant expenditure has been insignificant in the sector over the three financial periods. Activities that count as climate adaptation related projects received KSh 4,473 billion in 2013/14, which went towards Food security and management programme njaa marufuku Kenya; crops development and management services. Similarly, a total of billion was spent on activities under CCEE, that is capacity building, training, awareness creation and climate related policy development. No expenditure was incurred on CCM, that is, mitigation activities. The total amount spent on climate related activities in the sector during the three financial years was as follows 1.47 billion in 2011/12; billion in 2012/13 and billion in 2013/14 bringing to a total of 8.8 billion shillings. Percentage wise this works out as 3.10%; 5.10% and 9.21% of the total expenditure for the respective years and only an average of about 5.91% for the three-year period. However, there is a trend showing that CRE has increased a bit significantly from 3.10% of the total in 2011/12 to 5.10% in 2012/13 and 9.21% in 2013/14. The ARUD climate relevant projects included in the analysis are annexed as a spreadsheet. 4.3 Energy, Infrastructure and ICT Sector (EII) The EII SWG consists of three sub-sectors, namely, Energy and Petroleum; Transport and Infrastructure; and Information, Communications and Technology. Vision 2030 recognises Energy, Petroleum, Infrastructure and Information, Communication and Technology (EII) sector as a key enabler for sustained economic growth, development and poverty reduction. The sector aims at sustaining and expanding physical infrastructure to support the rapidly-growing economy EII Actual Expenditure Compared to the Approved Budget Per the 2014 MTEF report, the approved budget for the EII sector has been increasing gradually as the government invests more in the development of infrastructure and petroleum. The sector budget increased gradually from KSh 182 billion in the 2011/12 financial year to KSh billion in the 2012/13 financial year and up again to KSh 217 billion in the 2013/14 financial year. The gradual increase in the approved budget was due to the financing of the power generation and transmission; the Nairobi - Thika super highway; and the Konza Techno City developments. Most funding has been channelled to the Infrastructure Subsector with an allocation of 56%, 50%, and 46% in the financial years 2011/12, 2012/13 and 2013/14, respectively. This is closely followed by the Energy and Petroleum Subsector at 31%, 38% and 33% over the review period. The Transport Subsector was allocated 10% in 2011/12, 2% in 2012/13 and 16% in 2013/14. The ICT sub sector has had a gradual increase from 2% to 4% and 5% allocation of the total budget in 2011/12, 2012/13 and 2013/14 respectively. 16
70 The trends in expenditure analysis indicate that the absorption rate for development expenditure is low. The sector utilization of approved funds was at 83% in 2011/12, 77% in 2012/13 and 80% in 2013/14. The underutilisation is attributed to procurement challenges, particularly for donor funded projects; inadequate counterpart funding which affects the expenditure on the donor component; and delayed/inadequate exchequer releases and disbursement of funds from development partners EII Climate Relevant Expenditure on Mitigation, Adaptation and Capacity Building EII Climate Relevant Expenditure was found to be very insignificant compared to ARUD. This is partly because a lot of data was missing from the Ministry of Energy and Petroleum (MOEP), as such no expenditure was shown as being made in climate mitigation (CCM) and enabling environment (CCEE) in the three financial years, which is very strange. In 2011/ 2012, about 890 million was spent on climate change adaptation, in 2012/ million and in 2013/ 2014, 510 million. Records shown that the Government has invested in mitigation type activity such as energy investment programs, geothermal development; national grid system; rural electrification; alternative energy technologies. The amount is not captured since the implementing agencies, mostly parastatal, of MOEP are not subject to IFMIS. Fig 4 below shows Planned budget, actual expenditure as per literature and reviewed expenditure based on MTEF and programme based budget (PBB) for the EII sector. EII Planned Budget, Actual Expenditure, Reviewed Exenditure and Climate Relevant Expenditure in Billion Kes 1, / / /14 GrandTotal Budgeted/Planned Actual Expenditure Reviewed Expenditure CC Adaptation CCEE/CCM CRE without MOEP / / /14 Grand Total Budgeted/Planned Actual Expenditure Reviewed Expenditure CC Adaptation CCEE/CCM CRE without MOEP Figure 4: Planned budget, actual expenditure as per literature and reviewed expenditure based on MTEF and programme based budget (PBB) for the EII sector ** Financial data was obtained from MTEF and the Programme Based Budget (PBB) for the 2011/12, 2012/13, 2013/14 and the 2014/15 financial years and the 2015 Budget Policy Statement. 17
71 4.4 Environmental Protection, Water and Natural Resources Sector (EPW) Per the MTP , the overall objective of this sector is to attain clean, secure and sustainable environment by The sector forms critical linkages with the main productive sectors, namely, agriculture, manufacturing and energy, which exploit natural resources. It is also linked to other sectors of the economy such as development planning, population dynamics, finance, public health and sanitation, and trade. The EPW sector comprises three sub-sectors, namely, Environment and Natural Resources; Water and Regional Authorities; and Mining. The sub-sectors are respectively coordinated by the State Department of Environment and Natural Resources, State Department of Water and Regional Authorities and Ministry of Mining. The Sector also includes twenty-eight (24 operational and 4 proposed) Semi- Autonomous Government Agencies (SAGAs) and three (3) other institutions related to environment and water. Per the 2014 Economic Survey, about 42% of the country s Gross Domestic Product (GDP) is derived from natural resources-based sectors. ARUD; EII; General Economic and Commercial Affairs; Health, Social Protection and; Culture and Recreation sectors all heavily depend on the sustainable management of the environment and the prudent exploitation of the natural resources. The sector's vision is "Sustainable development in a secure environment", and the mission is "To promote sustainable utilization and management of the environment and natural resources for socio-economic development". The EPW is the lead sector in environmental protection, and consequently is focused on addressing the following challenges: an inadequate legal and policy framework, given that many laws and policies have not been aligned to the Kenya 2010 Constitution; the link between poaching, terrorism and general insecurity; high poverty levels that result in environmental degradation; climate change, in particular, the effects of flooding and drought on water and natural resources; water supply, housing access, livestock production and general livelihoods support; dependence of rural populations on land resources for livelihoods has led to increased demand for fuel wood, pressure to convert forest land to other uses, wildlife poaching, charcoal burning, forest/wild fires, and livestock incursion into forests; limited value addition and product diversification, resulting in low prices for raw materials; inadequate funding; low youth participation; scarcity of information on the status of natural resources, among others EPW Planned Budget, Actual Expenditure compared to Climate Relevant Expenditure The EPW sector budget increased from KSh 48.2 billion in 2011/ 2012 by 23% to KSh 59.3 billion in 2012/ 2013, and then dropping by 19.3% in 2013/ 2014 to KSh 47.8 billion. Overall, the EPW sector has an absorption rate of about 80%. In 2011/ 2012, the actual expenditure was KSh 39,6 billion (82% of total expenditure), in 2012/ 2013 it was KSh 47,4 billion (80%) and in 2013/ 2014 it was KSh 41,7 billion (87%). Unlike the other two SWGs, EPW spending increased in the 2013/2014 period. The reason for the variation in absorption rates was due to low and slow disbursement of donor funds and lengthy procurement procedures. The sector s expenditure trends are presented in Figure 5 below 18
72 Planned Expenditure vs Actual Expenditure: EPW 2013/ / / Billions: 2011/ / / 14 Actual Expenditure 39,600 47,400 41,700 Total Planned Budget 48,200 59,300 47,800 Figure 5: EPW Planned Vs Actual Expenditure In terms of resource allocation by programme, the State Department of Water and Regional Authorities takes the largest share of the Sector budget, mainly directed towards the construction of multi-purpose dams. For instance, 67%, 68% and 61% was allocated, respectfully, for the three financial years over the review period (2011/ /14) to the State Department of Water. Details of the expenditures are given under each programme as discussed in the following section. The EPW has clear priorities in protecting the environment and water supply. Consequently, the sector aims to take leadership in the review and harmonization of the sector acts, statutes, policies, rules and regulations, increase tree cover, explore the country's minerals, rehabilitate degraded areas, recover illegally acquired forest land, increase access to clean water, reduce poaching incidences and human-wildlife conflict, provide enhanced meteorological information and services, waste management and pollution control, integrated regional development and natural resources mapping. The sector s climate relevant expenditure in comparison with the planned and actual expenditure is illustrated in Figure 6 below EPW Planned Budget, Expenditure and CRE 70,000 60,000 50,000 40,000 30,000 20,000 10, / / /14 Planned budget Actual Expenditure Total CRE NR + Water Figure 6: EPW Planned Vs Actual Expenditure 19
73 EPW (MENR +Water) Year 2011/ / /14 Planned budget 48,200 59,300 47,800 Actual Expenditure 39,600 47,400 41,700 Total CRE NR + Water 12,807 14,008 15, EPW Climate Relevant Expenditure on Mitigation, Adaptation and Capacity Building The Sector implemented thirteen programmes in the review period 2011/12, 2012/ 2013 and 2013/2014. These programmes are: Environment Policy Development and Coordination; Meteorological Services; Forestry Development, Research and Management; Wildlife Conservation and Management; Forestry and Wildlife Policy Regulations and Coordination; Water Policy and Management; Water Supply Services; Water Resources Management and Water Storage; Drainage Infrastructure; Integrated Regional Development; Mineral Resources Management; and Environment Management and Protection which was implemented independently in the 2013/14 Financial Year by both Mining sub-sector and Environment and Natural Resources sub-sector. These programmes are presented in the appendices. The Sector s expenditure is depicted in Figure 7 below shows climate relevant expenditure in the; general administration, mining related expenditure and mineral resource management are some of the activities carried out in the EPW that are not classified as climate relevant. The State Department of Environment and Natural Resources spends large amounts money on climate change enabling activities, such as, policy/strategy development, awarenessraising, and capacity building. For example, under the Forests Conservation and Management sub-programme, activities such as the provision of forestry extension services and support to community farming initiatives qualify as enabling environment, while other activities in the subprogram such as the restoration of natural water towers and the rehabilitation of natural forests qualify as mitigation activities. Climate relevant expenditure in the water sector is largely on mitigation, and on programmes such as the protection of water sources, and catchment areas. For example, the Water Resources Conservation and Protection sub-program includes the Upper Tana Natural Resource Management activities such as increasing forest cover (mitigation) as well as the promotion of water rights (enabling environment). Enabling environment activities include programmes on water ethics, water resource information centres, water resource management activities such as monitoring stations on surface water and the promotion of rain water harvesting technologies. 20
74 EPW Expenditure Versus CRE inn Adaptation, Mitigation and Enabling Environment 50,000 45,000 40,000 35,000 30,000 25,000 20,000 15,000 10,000 5,000 0 Actual Expenditure Total CRE CCEE - NR+W CCA NR+ Water CCM Water 2011/ / /14 Year 2011/ / /14 Actual Expenditure 39,600 47,400 41,700 Total CRE 12,807 14,008 15,067 CCEE - NR+W 3,741 3,431 3,715 CCA NR+ Water 7,564 8,363 9,805 CCM Water 1,502 2,214 1,547 Figure 7: EPW Actual Expenditure Versus CRE on Adaptation, Mitigation and Enabling Environment 4.5 National Budget and Development Partner Contribution The following section compares Kenya s external resources channelled through the National Government to the national domestic budget for the 2011/ 2012, 2012/ 2013 and 2014/ 2014 financial years. The analysis does not include funds channelled into the country through nonstate actors Analysis of the National Budget & External Resources The total funds earmarked for development expenditure in 2011/ 2012 were estimated at KSh billion. Development partners contributed a total of billion (45%) in loans and grants. Out of billion, 54% ( billion) were earmarked to finance capital expenditure and the rest (84.22 billion) were grants. The budget trends for the financial years 2011/2012, 2012/2013, and 2013/2014 are presented in figure 8 21
75 Planned National Budged Vs External Resources 2013/ / / ,000 1,500 2,000 Billions 2011/ / / 14 Total External Resources 183, , ,100 National Planned Budget 1,154,900 1,459,900 1,649,000 Figure 8: Planned National Budget Vs External Resources In 2012/ 2013, the development budget increased to KSh 453 billion, with development partners contributing KSh billion (50%) in loans and grants. About 59% of external funding ( billion) were earmarked for capital projects and the rest ( billion) were grants. In 2013/ 2014, the development expenditure increased to an estimated KSh billion, of which development partners contributed KSh billion (57.5%) in loans and grants. Out of the KSh 257 billion, KSh billion (68.7%) was in the form of loans, while KSh billion was in the form of grants. External financing of development projects in Kenya through bilateral and multilateral loan agreements increased from billion in 2011 to billion in Since these funds were largely infrastructure projects in agriculture, roads, water and energy, they have climate finance implication. Kenya receives significant financing through loans from multilateral and bilateral partners as indicated in Figure 9. In 2011/ 202, loans made up 78% of external funding at 142 billion, while in 2012/ 2013, loans made up 75% of funding at 169 billion and in the 2013/ 2014 financial year, they made up 74%, at 189 billion. China, Japan, France, the International Development Agency (IDA), and the Africa Development Bank (AfDB) are Kenya s largest creditors. The loans shown here include recurrent expenditure. 22
76 External Resources (Grants and Loans) Billions Loans from Develoment Partners Grants from Development Partners 2011/ / / , , ,740 41,100 56,200 67,350 Figure 9: External Resources (Grants and Loans) Sources of Funding As indicated in Figure 10, China, France (AFD) and Japan are the largest bilateral contributors to Kenya s budget. China gave KSh 28 billion worth of loans 2011/ 2012, which increased to KSh 28 billion in 2012/ 2013 and remained steady with another KSh 27 billion in the 2013/2014 financial year. AFD (France) provided KSh 17.7 billion in 2011/ 2012, KSh 11.8 billion in 2012/ 2013 and KSh 9.6 billion in 2013/ Japan s loans rose from KSh 6.8 billion in 201/ 2012, to KSh 8 billion in 2012/ 2013 and KSh14 billion in 2013/ Development Expenditure: Bilateral Partners Billions Denmark Norway Netherlands Sweden Switzerland Finland Belgium Italy Spain Germany KFW Germany GIZ France Kuwait Saudi Arabia Abu Dhabi Japan India South Korea China Canada USA USA USA UK 2011 / / / 2014 Figure 10: Development Expenditure (Bilateral Partners) In 2011/ 2012, Danida, KfW (Germany) and Japan gave the largest grants, at KSh 2.3 billion, KSh 1.9 billion and KSh 2.2 billion, respectively. In 2012/2013, Danida contributed KSh 3.1 billion, KFW KSh 2.5 billion and Japan KSh 3.7 billion. In 2013/ 2014, Danida disbursed KSh 2.6 billion, KfW KSh 3.3 billion and Japan disbursed KSh 734 million. In that year, another large contributor was China, which disbursed grants worth KSh 6 billion. 23
77 The largest multilateral partners were the International Development Agency (IDA), which provided loans worth KSh 53 billion in 2011/ 2012, KSh 62 billion in 2012/ 2013 and KSh 80 billion in 2013/ The African Development Fund (ADF) provided loans worth KSh 45 billion in 2012/ 2013 and KSh 32 billion in 2013/ The Global Fund provided loans worth KSh 6 billion in 2011/ 2012, KSh 11 billion in the next financial year and KSh 15 billion in 2013/ Development Expenditure: Multilateral Partners Billions IDA GEFT GLOBAL FUND EDF/EEC EIB ADB ADF BADEA OPEC UNDP UNFPA UNIDO UNEP UNICEF WFP GAVI FAO IFAD 2011 / / / 2014 Figure 11: Development Expenditure (Multilateral Partners) In the financial year 2011/12, UNDP (KSh 1.9 billion), UNICEF (KSh 1.3 billion), the World Food Programme (KSh1.7 billion), and the European Development Fund (EDF) (KSh 5.7 billion) were the biggest multilateral sources of grants. In the following financial year (2012/13), the Global Fund (11 billion), EDF (8.9 billion), ADB (2.9 billion) and the Global Alliance Vaccine Initiative (5.5 billion) made the largest contribution, while in the 2013/ 2014 financial year, the Global Fund provided KSh 15.9 billion, EDF provided KSh 9.9 billion and UNICEF KSh 3 billion in grants External Resources in Sectors Figure 12 below shows development expenditure from partners and the national government in the ARUD, EPW and EII sectors. Funds from development partners have been on the increase for all three sectors. The EII sector has received the greatest amount of external funding, followed by the EPW sector, with ARUD receiving the smallest amount. In 2011/ 2012, the EPW sector received KSh 26.4 billion, which more than tripled to KSh 87.8 billion in 2013/ 2014, reflective of a growth rate of 232% within the review period. The EII sector received 87.8 billion in the 2011/2012 Financial Year, which increased significantly to billion in the 2013/2014 Financial Year, registering a growth rate of 52.1% during the period under review. The ARUD sector received the lowest amount KSh 7.7 billion in 2011/ 2012, which increased to KSh 26 billion in 2013/ The disbursement to the sector, however, registered a significant growth rate of 242% during the period under review. 24
78 Total External Resources Per Sector 2013/ / / / / / Billions 2014 EPW 26,405,126,476 26,405,126,476 87,846,402,886 EII 87,846,402,886 87,846,402, ,564,248,176 ARUD 7,760,014,639 7,760,014,639 26,405,126,476 Figure 12: Total External Resources by Sector Loans by Sector Figure 13 shows that all the three sectors received significant amounts of loans. The ARUD sector received KSh 4.8 billion in the financial years 2011/2012 and 2012/2013, and KSh 21.3 billion in 2013/2014. These loans were used to finance projects in the year 2013/ 2014 such as: Kenya Coastal Development Project (KSh 20.9 million) Kenya Informal Settlements Improvement Project (KSh2.9 billion) Mwea Irrigation Development Project (KSh 400 million) Regional Pastoral Livelihood Resilience Project (KSh 60 million) Billions Loans by Sector / / / 2014 ARUD 4,808,004,069 4,808,004,069 21,307,809,769 EII 83,594,850,886 83,594,850, ,485,494,762 EPW 21,307,809,769 20,471,813,545 21,353,632,585 Figure 13: Loans by Sector 25
79 The EII sector received KSh 83 billion in 2011/ 2012 and 2012/ 2013, and KSh 124 billion in 2013/ These funds were used in infrastructure and energy projects for the year 2013/ 2014 such as: Ngong Hills Wind Turbines Project (KSh 750 million) KETRACO Transmission Lines (KSh 1.48 billion) Mombasa Port Development Project (KSh 10.8 billion) Energy Sector Recovery Programme (KSh 5 million) The Environment Protection and Water (EPW) Sector received KSh 21 billion in 2011/ 2012, KSh 20 billion in 2012/ 2013 and KSh 21 billion in 2013/ These funds were largely used in water and sanitation infrastructure in 2013/ 2014, such as: Nairobi Rivers Basin Restoration Programme Sewerage Improvement Project (KSh1.89 billion) Ewaso Nyiro North Natural Resources Conservation Project (KSh 180 million) Water and Sanitation Services Improvement Project Coast (KSh 3.2 billion) Water Security and Climate Resilience (KSh 88 million) Comparison between total budget and external resources budget External resources contributed 16%, 19.9% and 29.6% of the total ARUD budget in 2011/ 2012, 2012/ 2013 and 2013/ 2014 respectively. The contributions from the domestic budget and external resources are shown in Figure 14. Projects that could be considered climate relevant in 2013/ 2014 include: ARUD: Domestic Budget vs External Resources Billions / / / 2014 External Budget 7,760,014,639 10,049,342,712 15,530,919,002 SWG National Budget 47,589,000,000 50,411,000,000 52,367,000,000 Figure 14: Comparison between Total Budget and External Resources Risk management strategies to adopt to climate change in the Kenyan highlands (KSh 62.4million) Adaptation to climate change (KSh 246 million) Mainstreaming sustainable land management (SLM) in agro-pastoral production systems (KSh 21.3 million) As shown in figure 15, external resources made up approximately 58%, 73% and 79% of the total EII budget for 2011/ 2012, 2012/ 2013 and 2013/ 2014 financial years. Projects that could be considered climate relevant in the 2013/ 2014 financial year include the Solar Energy- Health Centres and Primary Schools (KSh 800 million) Support for the development of renewable energy (KSh million) 26
80 EII: National Expenditure Vs External Contribution Billions / / / 2014 External Budget 87,846,402, ,632,371, ,564,248,176 SWg National Budget 151,257,000, ,445,000, ,153,000,000 Figure 15: Domestic Budget compared to External Contribution in EII sector Expenditure As illustrated in Figure 16, external resources contributed approximately 67%, 56% and 66%, of the total EPW budget for 2011/ 2012, 2012/ 2013 and 2013/ Projects that could be considered climate relevant in 2013/ 2014 include: Miti Mingi Maisha Bora (KSh 465 million) Support to Community Based Farm Forestry Enterprises in Semi-Arid Areas (KSh 23.5 million) EPW: National Budget vs External Resources Billions / / / 2014 External Budget 26,405,126,476 26,405,126,476 27,665,343,510 SWG National Budget 39,600,000,000 47,400,000,000 41,700,000,000 Figure 16: National Budget vs External Resources contribution to EPW Government Expenditure in ARUD, EII and EPW in Relation to Available External Resources The three climate relevant sectors under review received a large proportion of external resources. The allocations by sector and by financial year are shown in Figure 17 and Table 2 The combined allocation for the three sectors in 2011/ 2012 amounted to KSh 122 billion out of the total economy-wide external funds allocation of KSh 183 billion. This translates to 67% of the total external funds. In 2012/2013, the allocation increased to 70%, with a combined amount of KSh 158 billion for the three sectors out of a total economy-wide allocation of KSh
81 billion; while in the year 2013/2014, the three sectors received KSh 176 billion out of the allocated KSh 240 billion (73% of the total external resources). Total External Funds Vis Three SWGs Billions / / / 2014 ARUD 7,760,014,639 10,049,342,712 15,530,919,002 EII 87,846,402, ,632,371, ,564,248,176 EPW 26,405,126,476 26,405,126,476 27,665,343,510 Total External Funds 183,082,357, ,966,160, ,646,641,426 Figure 17: SWG funding from External Resources It should, however, be noted that these funds are largely in the form of loans allocated for infrastructure projects in water and transport External Resources and Climate Relevant expenditure in Three Sectors The total contribution by development partners (loans and grants) is significantly higher than the total CRE in the three sectors during the three financial years under review. The ratio of CRE to External Resources received is 8.29% in 2011/12; 7.61% in 2012/13 and 8.48% in 2013/14. EPW has the highest Climate Relevant Expenditure at 6.45% of the total external resources, on the other hand, ARUD CRE was 1.37 % of the total external resources whereas EII s ratio of CRE to total ER was 0.31%. If most CRE is received from external resources, then EPW has received the most CRE and EII the least. Table 2: Total External Resources versus Total CRE and Ratio of CRE to External Resources Year 2011/ / /14 Grand Total % CRE of ER Total Ext Resources (ER) 183, , , ,696 Total ARUD CRE Total EII CRE Total EPW CRE Total CRE in 3 SWGs 15, , , , % Ratio of CRE to External
82 5 COUNTY LEVEL FINDINGS 5.1 County Budget Planning and Formulation Process This CPEBR work was piloted in three counties, namely, Bungoma, Laikipia, and Isiolo. County selection was based on a set of criteria agreed with the technical committee, namely; vulnerability index; diversity (i.e., ASAL, highly productive region and the Lake Victoria Basin) and; the presence of robust county financial management framework and on-going projects in climate change adaptation and mitigation. 5.2 Bungoma County Budget Analysis Bungoma County was selected because of, among other reasons, its significant small-scale agricultural farming community which is increasingly becoming vulnerable to climate change. Furthermore, the County is located on the Southern slopes of Mt. Elgon, which also forms the apex of the County and a water tower linking to the lake Basin. Bungoma County Government is divided into twelve sectors, namely; Agriculture, Livestock, Fisheries and Co-operative Development; Tourism, Forestry, Environment, Natural Resources and Water; Education, Science and ICT; Health and Sanitation; Roads, Public Works and Housing; Trade, Energy and Industrialization; Gender, Culture, Youth and Sports; Land, Urban and Physical Planning; County Public Service Board; Governor's Office and; County Administration Bungoma Agriculture Sector Bungoma is in the process of implementing an agriculture strategic plan that focuses on improving the county s agriculture value chain to increase earnings. Eighty per-cent of the county residents rely on agriculture for their incomes, yet there is little value addition done to agricultural products in the county. The agriculture strategy seeks to improve agricultural productivity; enhance access to agricultural markets; enhanced adoption of agricultural technologies; improved access to affordable inputs such as fertiliser and tractors; improved enabling environment for investments and; enhancing the agriculture subsector performance. The agriculture strategy will therefore take the value chain approach as well as factor in land degradation and climate change impacts on agriculture in Bungoma to improve food security and income generation. They include investments in coffee, tea, banana and high value garden vegetable production, as well as dairy and poultry farming. The programs are funded by the County Government, with support from partners in infrastructure development Bungoma Water Sector Bungoma County faces an acute shortage of clean and safe water; hence the sector is working to improve access to water by constructing water treatment plants and constructing water infrastructure in each ward. Up to 450 projects have been implanted and completed in the last financial year. Below are highlights in the Bungoma water sector: The county government seeks to improve access to clean water at the ward level, and thus constructed and protected 10 water springs, (and shallow wells where water springs were not viable) and; 50 m 3 water storage reservoirs in each ward. Five roof catchment water projects in institutions in each ward and capacity building on management of projects handed over to communities in each ward was conducted. At least 2 water projects in each of the 9 sub counties which had a minimum value of KSh 5 million were planned 29
83 The national government contributed KSh 100 million to expand pipework and storage facilities from Cheptais sub county to Malakisi However, Bungoma faces challenges due to encroachment on catchment areas and upstream destruction which causes erosion and turbidity of rivers/water; vandalism of pipelines; poor roads and; inadequate funding. Financial performance 2014/ 2015: Per the Controller of Budget Implementation Review Half Year Report of 2014/ 2015, the Bungoma County Estimates for the financial year of 2014/15 amounted to KSh 8.27 billion comprising of KSh 4.11 billion (49.7 %) for recurrent expenditure and KSh 4.16 billion (50.3 %) for development expenditure. This budget will be financed by the national equitable share of KSh 7.19 billion (70.9 %), local revenue of KSh 475 million (4.7 %), KSh 599 million (5.9 %) from Appropriation-In-Aid (A-I-A) and KSh 1.87 billion (18.5 %) as projected cash balance from 2013/14. The County Government s sources of revenue are shown in Figure 18 Billions Bungoma County sources of Income Total County Budget National Revenue Allocation County Government Funds 2013/ ,703,000,000 5,949,000,000 2,754,000, / ,269,819,488 7,190,000, ,000,000 Figure 18: Actual Expenditure compared to the Approved Budget for Bungoma Bungoma s Actual Expenditure Planned Compared the Approved Budget Figure 19 shows Bungoma s Actual Expenditure compared to the Approved Budget. In 2013/ 2014, Bungoma spent KSh 7.6 billion of the allocated KSh billion budget, representing an 88% absorption rate. The shortfall was attributed to slower disbursements from the exchequer and procurement delays. 30
84 Bungoma: Actual Expenditure compared to the Approved Budget 2014/ / 2014 Billions / / 2015 Actual Expenditure 8,702,780,000 Total County Budget 8,703,000,000 10,399,968,750 Figure 19: Actual Expenditure compared to the Approved Budget for Bungoma Bungoma County Recurrent and Actual Expenditure Bungoma spent 33% of its allocated development expenditure, spending KSh 1.2 billion of the allocated KSh 3.6 billion in 2014/2015. During the 2014/2015 financial year, the county plans to spend KSh 4.1billion on development expenditure, which is approximately 40% of the total budget. Bungoma Recurrent Vs Development Expenditure 2014/ / / / Billions 2015 Recurrent expenditure 3,358,418,331 4,113,360,117 Development expenditure 1,200,338,018 4,156,459,371 Figure 20: Bungoma Recurrent Vs Development Expenditure Bungoma Expenditure on Climate Relevant Sectors In line with the national data collection, Agriculture, Livestock, Fisheries and Co-Operative Development; Tourism, Forestry, Environment, Natural Resources and Water; Education, Science, ICT, and Statistics; Roads, Public Works and Housing; and Trade, Energy and Industrialization; were the main areas of interest as they, at the county level, represented the three sectors ARUD, EII and EPW. 31
85 5.2.6 ARUD Sector Agriculture Strategy Figure 21 illustrates Climate Relevant Expenditure in Bungoma. The Agriculture, Livestock, Fisheries and Cooperative Development sector mirror the national ARUD sector. In 2013/2014, the sector spent KSh 352 million and in the 2014/ 2015 financial year was allocated KSh million. Bungoma Climate Relevant Expenditure Millions 1,200 1, / / 2015 ARUD 352,672, ,935,435 EII 249,511,493 1,022,140,927 EPW 50,801, ,753,052 Figure 21: Bungoma Climate Relevant Expenditure Bungoma is a highly productive agricultural area, and the county seeks to improve agricultural productivity; enhance access to agricultural markets; promote the adoption of agricultural technologies; improve access to inputs such as fertilizer and the purchase of machinery such as tractors; create enabling environment for investments and; enhance agriculture subsector performance and capacity. The County Government has been investing in tea, coffee and horticultural production, as well as the rearing of indigenous poultry, fisheries and the promotion of dairy cattle. Below are some highlights of the agricultural strategy. Improving productivity of tea, bananas, coffee, tomatoes, onions, oil palm, sunflower, rice and sweet potatoes. Improving the availability of planting material for crops such as potatoes, and a nursery to improve banana farming in partnership with Jomo Kenyatta University of Agriculture and Technology (JKUAT) - more than 150 thousand seedlings to date. Introduction of greenhouse farming with youth and women s groups, as well as plans to construct 2 coffee processing mills to improve the value chain of agricultural produce in Bungoma. Promotion of agroforestry: the county will encourage farmers to cultivate trees on boundaries and terraces so that they can benefit more from their land Livestock and fisheries: the strategy identifies dairy production, aquaculture and improved poultry processing to boost productivity and efficiency of the sector. The county is therefore investing in setting up artificial insemination schemes to improve dairy productivity and a poultry processing plant to make poultry rearing more efficient. The county government is also cognizant of the impacts of climate change, and has hence installed 4 weather stations which will enhance the data collection network to improve weather predictions and early warning systems. Improving soil productivity: the county has acquired 3 soil laboratories to help farmers understand their soil resources better, and improve production EII Sector Trade, Energy and Industrialization The Trade, Energy and Industrialization, together with the Roads, Public Works and Housing sectors correspond to the EII sector at the national level. The sector spent a total amount of 32
86 KSh million, with the trade and energy budget being KSh 70 million and the Roads and Public Works budget being KSh million. In 2014/2015, the sector was allocated a total of KSh 1.02 billion, with KSh 829 million going to roads and public works and KSh 193 million to the energy sector. The mission of the Trade, Energy and Industrialization sector is to create an enabling business environment for trade and investment through fair trade practices, consumer protection, and provision of affordable energy for sustainable socio-economic development. The trade aspect is dominant, and the sector is in the process of creating a conducive business environment through the provision of lighting at markets and constructing a county industrial business park. In addition, the County has budgeted KSh 20 million for a rural electrification and development of alternative sources of energy, and KSh 7.7 million for research and development, innovation and technology transfer in 2014/ EPW Sector Tourism and Natural Resource Management The Tourism, Forestry, Environment and Natural Resources sector is responsible for environment protection in Bungoma County, and its mission is to ensure sustainable development through fostering effective, efficient utilization of County resources to promote the tourism industry. It is composed of the forestry, tourism, environment and natural resources sub sectors. In 2013/2014, the sector s expenditure was KSh 50.8 million as opposed to an allocated budget of KSh million. During the same period, the sector undertook programmes that built capacity on afforestation and the benefits of Community Forest Associations in several wards; increased tree cover; improved the collection of solid waste through the purchase of garbage trucks and; and trained enforcement officers on environmental legal frameworks. In the year 2014/2015, the sector plans to undertake the construction of an entry gate at Kaberwa in Mt. Elgon National Park; continue with the planting of trees to increase forest cover; establish tree nurseries in each of the 45 wards, including one major county nursery and; the develop a solid waste management plan through Public Private Partnership (PPP) Climate Relevant Expenditure compared to the Total County Expenditure Figure 22 shows total climate relevant expenditure in Bungoma compared to total expenditure form 2013/2014 and planned expenditure for 2014/2015. Both the total expenditure and climate relevant expenditure registered a growth during the two financial years 2013/2014 and 2014/2015. The proportion of climate relevant expenditure as a fraction of the total expenditure, however, declined from just above 40% in 2013/2014 to about 3% in 2014/
87 Bungoma Climate Relevant Expenditure vs Total Expenditure 2014/ / / / Billions 2015 Expenditure 3,434,899,132 8,269,819,488 Climate Relevant Expenditure 1,402,642,506 2,392,386,985 Figure 22: Bungoma CRE compared to the Total Expenditure 5.3 Laikipia County Budget Analysis In Laikipia County, environmental degradation has contributed to reduced productivity of land, reduced quality and quantity of water sources, high levels of both air and water pollution, constraining of effluent and solid waste disposal facilities especially in the urban areas. Increased farming activities in forests are also a threat to the county s rich biodiversity. Environmental degradation in Laikipia is rampant and is driven by population pressure on limited land resources and the growth of towns like Nanyuki, Nyahururu, Rumuruti, Wiyumiririe and other shopping centres, straining the provision of social amenities. Growing informal settlements around Nyahururu and Nanyuki towns have resulted to high levels of pollution, poor sanitation and unsustainable disposal of waste. In addition, farming in riparian areas, sand harvesting and other quarrying activities in in Laikipia, have exacerbated the process of land degradation - resulting in high instances of poverty within the county. Other factors contributing to environmental degradation include; overgrazing, cutting down of trees for charcoal burning and farming along the river banks. Climate: Agricultural productivity is limited by poor weather conditions characterized by frequent dry spells and poor rainfall distribution. The annual average rainfall varies between 400 mm and 750 mm. Laikipia is prone to extreme climate events, with major droughts recurring after every 4-5 years. This leads to famine where communities are forced to depend entirely on relief food. The County Ministry of Environment has developed a draft Climate Change Bill, which will enable the county to take a systematic approach to climate change mainstreaming and disaster risk reduction, improve synergy with other ministries, set up a climate change adaptation fund, introduce a levy component for the adaptation fund, conduct risk assessments, and establish a climate change unit to guide the climate change mainstreaming in Laikipia. The ensuing Act will also clarify the link between biodiversity and climate change, which is necessary as Laikipia is rich in biodiversity. Laikipia Financial Planning: For the 2013/ 2014 financial year, the county s budget was KSh 3.3 billion of which KSh 2.7 billion (83%) was allocation from the national government and KSh 348 million was county revenue funds. This figure increased to KSh 3.6 billion in 2014/ 2015, 34
88 with KSh 2.9 billion (80%) from the national government and an expected KSh 400 million collected by the county government. The Controller of Budget report on Laikipia identified, among others, the county s challenge in local revenue collection. The report recommends that the County establish adequate measures and controls to ensure planned activities are implemented within the financial year and; enact the Finance and Revenue Bills and; build the capacity of revenue collection officers to optimize revenue collection and reduce revenue leakages to collect higher amounts in the County Laikipia County Sources of Income For the 2013/ 2014 financial year, the county s budget was KSh 3.3 billion, of which KSh 2.7 billion (83%) was allocation from the national government and KSh 348 million was county revenue funds. This figure increased to KSh 3.6 billion in 2014/ 2015, with KSh 2.9 billion (80%) from the national government and an expected KSh 400 million collected by the county government. During the 2014/ 2015 period, other sources of income included a balance brought forward of KSh 351 million from the previous financial year, donor support amounting to KSh 9 million, appropriation in aid worth KSh 13 million as well as KSh 97 million from the rural electrification fund, KSh 211 million in conditional grants and KSh 160 million from the Health Sector Services Fund (HSSF). Billions Laikipia Sources of Income Total County Budget National Revenue Allocation County Government Funds 2013/ ,317,772,184 2,757,598, ,073, / ,632,936,420 2,936,985, ,000,000 Figure 23: Laikipia Sources of Income 5.4 Laikipia Actual Expenditure compared to the approved budget As indicated in Figure 24, Laikipia County spent KSh 2.6 billion out of a total of KSh 3.3 billion in 2013/2014, representing an absorption rate of 79%. Because Laikipia did not spent a large portion of its development expenditure funds. 35
89 Planned Vs Actual Expenditure 2014/ / Billions 2013/ / 2015 Actual Expenditure 2,628,711,609 Total County Budget 3,317,772,184 3,632,936,420 Figure 24: Laikipia Actual Expenditure compared to the approved budget County Recurrent and Actual Expenditure In 2013/ 2014, Laikipia spent 8% of its budget on development expenditure. Out of approximately KSh 1 billion marked for development, the county spent KSh 214 million. Some of the development projects that the County implemented during the period under review included the improvement of education facilities at KSh11.0 million, and purchase of milk coolants at KSh12.0 million. About 92% of the budget (KSh 2.4 billion) went to recurrent expenditure, out of the county s total expenditure of KSh 2.6 billion. In the 2014/ 2015 financial year, the county government plans to spend KSh 1.19 billion on development, bringing the percentage up from 8% to 32%. Sixty-seven per-cent of its budget, or 2.4 billion has been set aside for recurrent expenditure. Recurrent Vs Development Expenditure 2014/ / Recurrent expenditure Billions Development expenditure 2013/ / ,414,413,134 2,439,600, ,298,475 1,193,336,221 Figure 25: Laikipia Recurrent and Development Expenditure Expenditure on Climate Relevant Sectors Laikipia County is organised under several sectors, namely, County Assembly; office of the Governor, County Administration, public service, special programme, security, disaster 36
90 management, cohesion and intergovernmental relations; infrastructure; agriculture, livestock, fisheries and natural resources; finance, planning and county development; education, technology and ICT; gender, social affairs, children and sports development; industrialization and enterprise development, health and sanitation; water and; tourism and trade. Reflecting the national data analysis, sectors dealing with energy, environment, water, agriculture and infrastructure were selected as being climate relevant. Climate Relevant Sector Spending / / 2015 ARUD 91,100, ,234,798 EII 262,000, ,193,800 EPW 34,500, ,924,518 Figure 26: Laikipia Climate Relevant Expenditure ARUD Sector In the case of Laikipia Country, the ARUD sector consisted of the agriculture, livestock, fisheries and natural resources sub-sectors, which spent KSh 91.1 million during financial year 2013/2014 and was allocated KSh 139.2million for the following financial year. The sector is structured into various programmes, namely; agricultural productivity improvement; livestock improvement; fisheries improvement; disease control and prevention; market access improvement; livestock services; human animal conflict mitigation; irrigation infrastructural development, as well as administration, and monitoring and evaluation units. The County 2013/2014 budget shows that funds were spent on the promotion of fish farming; infrastructure such as cattle dips, livestock yards and slaughterhouses; irrigation and greenhouses and; tree planting. For the 2014/2015 financial year, funds have been put aside for investments in conservation agriculture, fish pond farming water reservoirs and drought mitigation development in line with the county s PBB EII Sector The EII sector consists of the infrastructure sub-sector, which spent KSh 262 million in 2013/2014 and is budgeting to spend KSh 301 million in the 2014/ 2015 financial year. The sector consists of physical planning; housing; public works and roads subsectors. In the 2013/ 2014 period, KSh 207 million was spent on grading murram roads and KSh 12 million was spent on rural electrification. In the 2014/2015 financial year, the sector aims to increase the number of tarmacked roads, improve public infrastructure and housing, improve urban planning and develop updated topographical maps of the county. 37
91 5.4.5 EPW Sector Laikipia County does not have an Environment Protection and Water sector, but classifies natural resources with agriculture and places the water sector as a stand-alone sub-sector. Consequently, the water sector spent KSh 34 million in 2013/ 2014 and it is estimated it would need KSh 320 million in 2014/2015 to implement its programmes. The water sector is concerned with water supply management, sanitation and human animal conflict mitigation. In 2013/2014, the sector spent funds on constructing dams and water pans, as well as the development of water projects in Marmanet and Segera. The 2014/2015 PBB outlines the development of water reservoirs and drought mitigation development, laying a pipeline network and improving public sanitation as priorities in the sector Total Climate Relevant Sectors Expenditure compared to the Total County Expenditure for 2014/15 Figure 27 shows that, in 2013/ 2014, Laikipia spent KSh 387 million on sectors considered to be climate relevant, namely in infrastructure; agriculture, livestock, fisheries and natural resources and; water. The CRE budget for the 2014/2015 financial year was KSh 761 million, raising the proportion of CRE in the total budget to 20%. Climate Relevant Sector Spending vs Total County Spending 2014/ / ,000 4, / / Millions 2015 Total 3,317,772,184 3,632,936,418 SWG Totals 387,600, ,353,116 Figure 27: Laikipia CRE compared to the Total Expenditure 5.5 Isiolo County Budget Analysis Economic Activities and Population: Isiolo County is in the lower eastern region of Kenya, covers an area of approximately 25,700 km 2, and is partitioned into three sub-counties. It is considered the gateway to Northern Kenya. Investments in tourism, animal product processing industries, mineral prospecting, infrastructure projects and Isiolo s status as a resort city promise to improve its prospects. The population was 143,294 in the 2009 Census and is projected to rise rapidly in the future, per the CIDP. More than 70% of the population lives in poverty and the main activities are pastoralism and small-scale trading. Population density is low, with 6 people per square kilometre. About 40% is urbanised, concentrated in Isiolo town. Poverty, sanitation, water, literacy, and insecurity are the main challenges. 38
92 Infrastructure: Majority of the roads are gravel and earth surface and are impassable during the wet Text Box 2: Isiolo County Adaptation Fund (ICAF) season. The previous administration began work to upgrade Isiolo to a resort city, launched the construction of the Isiolo international Airport and the LAPSSET (Lamu Port Southern Sudan Ethiopia Transport) Corridor project. The County has 92% mobile phone coverage. In collaboration with the National Drought Management Authority, the UK Department for International Development financed resilience building projects initiated and managed by local communities through a County Adaptation Fund (ICAF) in Isiolo, disbursed 500,000 (KSh 68.5 million) used to build resilience against climate change impacts. ICAF is organised at the ward and county level. At the ward level, a Ward Adaptation Planning Committee (WAPC), consisting of 11 members with representation for women and youth as well as technical officers from the ministry of environment is responsible for prequalifying proposals submitted to the fund. Committee members are selected by community members and are publicly vetted. At the county level, the County Adaptation Planning Committee (CAPC) consisting of representatives from ministries and ward committees approves projects that have been put forward by the WAPC. Selected projects are then contracted to external parties and are managed by the communities through the structures put in place. During the first round of funding, investments were made in improving water availability, pasture management and livestock health. Communities work with technical officers in managing and implementing the projects, and investments were made in improving water availability, pasture management, livestock health, community natural resource management institutions governance and; community radio (in collaboration with Kenya Meteorological Services). ICAF has proven to be successful, and it received a second round of investment of the initial amount. The climate resilience building activities and projects identified by the County and ward adaptation planning committees are being used to inform Isiolo s CIDP and the County Livestock Strategy. The objective for is to fully integrate the ICAF into the county s planning and finance systems to enable the finance system to access climate finance to complement their development budgets. Furthermore, the model is being tested in other ASALs, namely Garissa, Kitui, Kitui, Makueni and Wajir. Environment, Climate and Energy: Isiolo has three ecological zones, namely semi-arid, arid and very arid, with large areas falling under the very arid zone. Rainfall is scarce and unreliable, averaging at mm per year. Temperatures range from 12 C to 28 C. Strong winds blow throughout the year. Isiolo s conditions make it very vulnerable to climate change. Likely impacts will be drought and erratic rainfall, floods, spread of water and vector-borne diseases, deforestation and loss of wetland ecosystems, land degradation, desertification and scarcity of potable water. Flash floods in some areas will result in sediment pollution, loss of fertility, landslides, erosion, and disruption of hydropower systems and destruction of physical infrastructure. Isiolo County has been experiencing increased conflict between farmers and pastoralists, as well as influxes of residents from neighbouring counties seeking to access Isiolo s pasture lands, increasing costs to the Isiolo County Government and causing resource conflicts. More than 70%of the population relies on fire wood for fuel. Only 19% of the population has access to electricity, and majority of trading centres, schools and health facilities are not connected to the power grid. Per the CIDP, the County Government can tackle environmental and economic challenges by exploring alternative source of energy, promoting eco-tourism, forestation and afforestation programs, encouraging community based adaptation and 39
93 environmental management, and developing policy on bio-degradable materials. Other measures include strengthening the early warning system, and community sensitization on Disaster Risk Reduction, Early Recovery and management of livestock (restocking, destocking and vaccination.) Land use: Much of the land (80%) is communally owned and is under the trusteeship of the county government. Most of Isiolo is not suitable for agriculture, and is used for ranching, grazing or as a wildlife conservancy. Majority of pastoralism is nomadic, though dairy farming exists. Agro-pastoralism is practised in some areas. Subsistence agriculture is practiced in areas bordering Meru and Laikipia Counties, while fruit and horticultural crops are produced in small scale, private irrigated farm along rivers. Forests provide poles, dyes, fuel, resin and gum which are traded on a small scale. Water and sanitation: Three perennial rivers, the Ewaso Ngiro, Isiolo, and Bisanadi flow through the county. Domestic water is sourced from boreholes and pans, though only 36% are functional in the dry season. The rural population lacks access to safe, easily available water. As much as 81% of the households in the county have pit latrines although more than half of those are uncovered Isiolo County Sources of Income Isiolo County Sources of Income Billions 2013/ / 2015 Total County Budget 3,000,000,000 3,288,919,085 National Revenue Allocation County Government Funds 2,400,000,000 2,602,395, ,000, ,960,418 Figure 28: Isiolo Sources of Income Isiolo County Performance 2014/ 2015: Per the Controller of Budget Report for 2014/ 2015, Isiolo faces the following challenges in budget planning and implementation: low revenue collection, coupled with unrealistic revenue targets; inadequate staff capacity, which affects execution of budgeted activities and; low absorption of development funds. The report further recommends that Isiolo County should set realistic revenue targets and enhance revenue collection by automation and sealing all revenue leakages; the County Public Service Board should conduct a human resource audit to identify the skills gap in the County, address the issue and where possible seek staff from the National Government and; the County should expedite implementation of development projects. Isiolo s total budget for the year 2013/ 2014 was KSh 3 billion and KSh 3.28 billion in 2014/ However, the budget was revised to KSh 2.7 billion in the supplementary budget. The national government funded KSh 2.4 billion, or 80% of the county s budget in 2013/2014 and the ratio remained the same, with the government funding KSh 2.6 billion in 2014/ County 40
94 government funds were intended to be KSh 360 million, but the Isiolo government collected revenues worth KSh 125 million. This was due to revenue leakages, a ban on land transactions and sand harvesting and low tourism numbers due to insecurity. The County set a more realistic target KSh 360 million in 2014/ During the 2014/ 2015 period, other sources of income included a balance brought forward of KSh 319 million and donor contributions worth KSh 5.5 million Planned Vs Actual Expenditure The initial planned budget for Isiolo in 2013/ 2014 was KSh 3 billion, but this was later revised to KSh 2.8 billion. However, the actual expenditure for that financial year was KSh 2.06 billion, representing an absorption rate of 74%. This was attributed to delays by the National Treasury in releasing funds and lengthy procurement processes that delayed payments. Isiolo County Planned vs Actual Expenditure 2014/ / / / 2015 Actual Expenditure 2,068,049,448 Total County Budget 3,000,000,000 3,288,919,085 Billions Figure 29: Isiolo County Planned Vs Actual Expenditure 41
95 5.5.3 Isiolo County Recurrent Vs Actual Expenditure County Development Vs Recurrent Expenditure Billions County recurrent expenditure 0 County Development expenditure 2013/ / ,526,358,896 1,975,249, ,005,982 1,313,669,907 Figure 30: Isiolo County Recurrent Vs Actual Expenditure In 2013/ 2014, Isiolo spent KSh 1.5 billion on recurrent expenditure, against a target of KSh 1.7 billion. In that year, the county spent KSh 580 million on development expenditure, against a target of KSh 856 million. These shortfalls are explained by the overall underspending of the county budget due to delays in procurement and funds from the National Treasury. Development expenditure in 2013/ 2014 represents 28% of the total county budget. In 2014/ 2015, the development expenditure allocation has been increased to KSh 1.3 billion, or 39.9% of the budget Expenditure on Climate Relevant Sectors For the year 2014/ 2015, Isiolo County is divided into several sectors, namely, County Assembly, Governor s Office, Finance & Economic Planning, Roads, Housing and Public Works, Agriculture, Land and Physical planning, Livestock, Veterinary and Fisheries, County Cohesion, Intergovernmental relations and Enterprise Development, Education, sports, Youth and Culture, Trade, tourism and industry, Public Service Management & ICT, Water, Environment and Natural Resources, and, Health Services. Reflecting on the national data analysis, the Roads, Housing and Public Works, Agriculture, Land & Physical planning, Livestock, Veterinary and Fisheries, and, Water, Environment and Natural Resources were climate relevant. 42
96 Millions Isiolo Climate Relevant Sector Spending / /2015 ARUD 134,774, ,354,020 EII 186,329, ,848,162 EPW 95,129, ,146,642 Figure 31: Isiolo Climate Relevant Sector Spending ARUD Working Group In the case of Isiolo County, the ARUD sector consists of the Agriculture, Land & Physical planning, and, the Livestock, Veterinary and Fisheries sectors. In 2013/ 2014, the sector spent KSh million and was allocated KSh million in the 2014/ 2015 financial year. Of this, Livestock, Veterinary and Fisheries was allocated KSh 128 million, while the agriculture subsector was allocated KSh 82 million. During the 2013/ 2014 financial year, the County government put in place infrastructure to improve livestock management, such as; 2 holding grounds in the county to do reseeding; cattle kraals in 3 wards; one laboratory with two more under construction; 2 livestock markets and; construction of fisheries ponds is underway. While the county economy is biased towards livestock because there is little arable land in Isiolo, the CIDP still makes provisions to improve agriculture, mainly on increasing area under agriculture, mechanization and the subsidization of farmers by providing them with seed and pesticides. Key issues in the land use sector include how Isiolo will prepare for the Lamu Port Southern Sudan-Ethiopia Transport (LAPSSET) Corridor, which will upgrade Lamu to a resort city. Issues that need to be addressed include land use planning and land tenure, given that Kenya has no communal land policy, whereas majority of land in Isiolo is held in trust EII Working Group In Isiolo County the EII sector most closely resembles the Roads, Housing and Public Works sector. ICT is not included and is grouped with the Public Services Management sub-sector. In 2013/ 2014, Isiolo disbursed KSh 186 million towards investments in infrastructure development. In the 2014/ 2015 financial year, there are plans to invest in programs to upgrade urban and rural roads, improve housing and invest in street lighting EPW Working Group The EPW sector consists of the Water, Environment and Natural Resources sector in Isiolo County. In 2013/ 2014, the sector spent KSh 95 million on activities, focusing on the improvement of access to water, tree planting as well as the rehabilitation of gullies and sand harvesting pits. 43
97 In 2013/ 2014, sector invested in promoting green energy, particularly in institutions such as schools, as well as to pump water from community water points. So far, 16 of the 100 water points have been fitted with solar technology to reduce operating costs, and the sector has been allocated KSh 60 million to continue the conversion in the next financial year. The environment sector is focused on improving access to green energy; Wetland protection; Invasive species (mathenge); the protection of river banks, especially in flood prone areas; school greening programs; rehabilitation of degraded areas and; afforestation. The ministry is also spearheading the passing of the climate change fund bill as well as the setting up of the climate change adaptation fund bill. In 2014/ 2015, the sector plans to spend KSh 267 billion, which is the third highest sector allocation after the County Assembly and Health Services. The county will make investments in irrigation programmes, with the aim of increasing land under irrigation from the initial acres to reach as indicated in the CIDP. Currently, the county has added acres under irrigation. This will improve access to water, boost food security and improve overall water infrastructure Total County Expenditure vs. Total Climate Relevant Sectors Expenditure Below is a graph showing overall spending on climate relevant sectors as compared to the total budget. The graph shows that in 2013/ 2014, 12% of the budget KSh 321 million out of KSh 2.7 billion was spent on climate relevant sectors, while in 2014/ 2015, 27% of the budget KSh 889 million out of KSh 3.2 billion was earmarked for climate relevant sectors. Climate Relevant Sector Spending Vs County Budget 2014/ / ,000 4, / / 2015 Total County expenditure Millions 2,784,624,946 3,288,919,085 Total expenditure in Corresponding Sectors 321,103, ,348,824 Figure 32: Isiolo County Expenditure Vs Climate Relevant Expenditure 44
98 6 TRACKING CLIMATE FINANCE IN THE BUDGETARY PROCESS 6.1 Mainstreaming Climate change into budgetary process A key output of the CPEBR was developing a clear and effective set of guidelines on how the GoK could go about mainstreaming climate change into the budgetary process. Sections below outline how climate change can be mainstreamed in the planning and budgetary process. This is in line with experiences of Nepal, Bangladesh and Rwanda that have undertaken such measures, the main difference being that the Kenya process focused on budget not institution review. Kenya s study is also based on the OECD-DAC climate change adaptation and mitigation markers. The CPEBR methodology is designed to assist technical and financial officers in government ministries, departments and agencies (MDAs) to record, track and eventually analyses climate spending in the national budget per three climate finance categories, namely, climate change adaptation (CCA), climate change mitigation (CCM) and climate change enabling environment (CCEE). The total investment in the three categories is termed, in this report, as climate relevant expenditure (CRE). To ensure that the approach and methodology can be followed, a guidance note on climate change mainstreaming in the budgetary process was drafted. Also, as part of the deliverables, the notifications within The National Treasury on climate change mainstreaming occasioned by the project were considered and documented. The sections below elaborate this. 6.2 Guidance Notes on Climate Change Mainstreaming in the Budgetary Process Guidance Notes on defining and tracking climate expenditure builds on the draft report on developing climate change budget codes for national planning and budgeting proposed approach and criteria (Undertaken by TNT, MEWNR and UNDP) 6. This study has contributed enormously to the quest for identification and tracking of climate-related flows and expenditure in national budgetary systems through a clear approach which, will allow Kenya to monitor and evaluate climate-related spending, help determine if national policy targets are being met and if resources are being spent properly. The Guidance Note contains a set of instructions on how mainstreaming can be achieved through the inclusion of climate awareness in designing government programmes and; how budgeting and expenditure tracking will be achieved. Inferences were drawn from previous such works in other countries or multilateral development partners, but adapted to suit realities in the Republic of Kenya. The local challenges advocate for an immediate way of implementing recommendations made in this document through piloting with a small team of technical staff guiding a few MDAs; and a medium to longer term strategy to bring the rest of government on board. Adaptation and mitigation markers adapted from the OECD provide a concise way of determining and explaining the purpose of the funds and thereby enabling tracking climate finance in IFMIS. The OECD markers provide a concise way of determining and explaining the 6 Government of Kenya & UNDP (2014) Development of Climate Change Budget Codes for the National Treasury: National Treasury 45
 template/ framework for generating reports that potential development partners collaborating with the GoK in climate change issues can handily relate with")
99 purpose of funds. The markers are therefore suitable for simplified communication of the tracking approach to planning and budgeting officers. They also provide a quick (system-ready) template/ framework for generating reports that potential development partners collaborating with the GoK in climate change issues can handily relate with without the need for customization. The markers also have the added advantage in that they can be configured in the IFMIS system as a side-table to facilitate climate change reporting. When using them (purpose codes), emphasis is laid on identifying the specific economic or social development areas that the funds seek to foster. Figure 33 shows the recommended steps in identifying climate expenditure. Figure 33: Stepwise Guide to Climate Coding on IFMIS During the initial phase, a review/ interrogation of the activities of MDAs and Counties will be performed by a committee composed of finance/accountants and technical experts who understand the intricacies of climate finance/ expenditure while the government builds capacity of the planning and budgeting officers and makes the necessary modifications on the IFMIS system to be able to effectively track climate related expenses. Once the relevant government officers have been trained, the evaluation of planning priorities for climate relevance will be done by Sector Working Groups (SWG). These groups currently review the planning priorities of MDAs and are better placed to make evaluations on climate relevance since they also determine the funding of MDA activities through budgetary resource allocation. They can therefore interrogate programmes for and inculcate awareness of climate in them by recommending and overseeing the inclusion the climate agenda in their design. It is therefore necessary that they perform the review tasks with a better understanding of climate 46
100 finance concepts. Thus, in the short term, climate budgeting and expenditure tracking will be facilitated by the technical committee recommended in the CCBC document but in the medium to long term, SWGs will provide that input. 6.3 Draft GoK Notifications on Climate Finance GoK notifications are used for internal official communication within the Government, and they communicate officially sanctioned instructions and information on courses of action to be taken. The National Treasury has developed notifications on climate finance definitions climate budget codes useful for tracking climate finance for circulation to relevant departments. These notifications were important because defining what counts as climate expenditure is complex because of the multitude of policies and sectors impacting on climate adaptation and mitigation; and the overlapping nature of the production of environmental goods and services and varying definitions of climate-related sectors. Existing definitional approaches in IFMIS have been designed with differing functions, but no single categorisation can be directly applied to assess climate-related expenditure in national budgetary systems. It is for this reason that in section 3.3 we generally defined climate finance from a Kenyan context but within the confines of Rio-markers. It is important to bear this in mind as part of the approach for integrating climate-related activities in the Government s IFMIS. Some of the challenges include the fact that most climate change funding is integrated into wider national planning sectors such as energy, water or agriculture instead of specific climate related sector and programmes and disaggregation is difficult feasible considering potential cross-sectoral policy conflicts. There are many and different sources of climate change funding in the country involving an ever-growing number of institutions involved in climate related activities. Based on the National Climate Change Action Plan recommendations, the existing budget coding such as gender and HIV for other sectors were reviewed to identify lessons for climate change coding. The study then worked on parameters to define climate change cost based on intended use of funds which would be indicated by the budget head, fund utilization, users, or the intended results or outcomes of the expense incurred. 6.4 Stepwise Approach to Capturing Climate Expenditure in IFMIS As part of guidance notes, the CPEBR was intended, among other objectives, to develop guidelines on how climate finance would be coded and tracked in IFMIS. The Climate Budget Code report (CCBC) 7 laid the groundwork necessary for establishing a framework for tracking climate related expenditure in GoK public finances system. It recommended that Rio Markers be used as flags on all financial entries made considered to be climate relevant and expounded on the conception made in the CCBC document by placing it in a typical budgeting setting of the government. This section builds on these establishments and goes further to describe the nature of data/ information that the system will maintain for purposes of tracking and reviewing allocations and expenditures against climate related activities. A step-wise illustration of how climate change flows and expenditure can be coded and tracked in IFMIS is provided in text box six below. It is proposed that the configuration of IFMIS should incorporate activity-level coding and tracking of spending for a more enhanced and comprehensive basis of recording, monitoring and reporting on climate change expenditures. Crucial in enabling the mainstreaming of climate change initiatives in GOK s planning and budgeting processes are the budget coding system 47
101 applied for all Government expenditure under Programme Based Budget (PBB) approach and the IFMIS SCoA, categorised on the following basis: Sectors involving in climate-related activities; Programmes and Sub-Programmes involving climate-related activities; and Climate-related Activities Standard Chart of Accounts The Standard Chart of Accounts (SCoA) is a tool used in the management of financial information, it defines the way the Government requests for financial information from sectors, then sets out account numbers, names and definitions for the line items on which certain services might be required to report on funding from governments at the international level. The GoK SCoA structure has 7 segments and allows for 48 digits in total as shown in the adjacent table. Table 3: GoK Standard Chart of Accounts Segment Groups/Hierarchy Comments 1. Class (1 digit; one level) X Identifies the categories of budget and below the line items 2.Vote (4 digits; 1 level) XXXX Represents the Votes against which budget is appropriated 3. Administrative (10 digits; 3 levels) XXXX.XXXX.XX Vote Head (Dept/Project) - Sub Head (Cost Centre) 4. Source of Funding 5.Programmes 6. Economic Items 7. Geographical Location (8 digits; 4 levels) X.X.XXX.XXX (10 digits; 4 levels) XX.XX.XX.XXXX (7 digits; 5 levels) X.X.X.XX.XX (8 digits; 3 levels) XXXX.XX.XX Identifies the broad source as well as specific source of funding Sector Programme Sub- Programme - Activities Category Chapter - Sub Chapter Item - Sub Item County - Constituency Ward County - District Sub-District Data is captured as shown below: 48

102 Figure 34: Data Capturing on the Standard Chart of Accounts What to track To facilitate budgeting and subsequent tracking of funds channelled to fund a climate-related initiative (a cause), it is important to have additional information on the objectives and outputs/ outcomes of the activities enabled by the budget. Objectives provide information on whether the activity was intended for climate mitigation or adaptation and can give a hint on whether there may exist climate co-benefits. Outputs/ outcomes, on the other hand, will confirm the existence of those co-benefits and will become useful in determining their estimate costs. How to Track Rio markers were proposed to flag the relevance of expenditure in relation to climate to facilitate budgeting and tracking of funds channelled to fund a climate-related initiative viz: 0 Not applicable. Used by default to indicate expenses not related to climate or any specific analytical cause. 1 Principle. The principle marker (and flag 1) is used to indicate the deliberate relevance of the expenditure initiative to climate change. 2 Significant. This marker (and flag 2) identifies the presence of climate co-benefits in an expenditure initiative even though its objective may not be climate-relevant. Facilitating tracking in the budget The principle/ basic segments in programme-based budget preparation are highlighted below. Table 4: Segments in Programme Based Budgeting Segmen t 1 Segmen t 2 Segment 3 Segmen t 4 Source of Funding Segment 5 Programme s Segment 6 Economi c Items Segment 7 Geographica l Location (new) Class Vote Administrativ e 1 digit 4 digits 10 digits 8 digits 10 digits 7 digits 8 digits 49
103 Any of the highlighted segments can be flagged to indicate their relevance to climate. The rest of the segments are analytical and provide tracking of funds against the relevant dimension Actual tracking is done by segment shown below which enables payments to be tracked to the benefiting causes. The reporting hierarchy comprises of 3 levels and 4 digits: Level 1 Shows the main cause/ subject of tracking e.g. Climate Change Level 2 Shows the major divisions in the cause e.g. Adaptation Level 3 Defines specific areas under the divisions e.g. Principle Table 5: Levels in the Programme Based Budget Level 1 Level 2 Level 3 Full Code Description Cause Division Area 2 digits 1 digit 1 digit 4 digits Segment 8: Climate Change Budget (CCBC) for GoK will be coded 01 in the tracking segment. Principal descriptors will award 100% of the tagged data intersection. Significant descriptors will award 50%. Room is provided in the system to capture the actual amount or other percentage deemed more accurate. Table 6.4 helps to explain Illustration of Actual Tracking. The climate change budget code which is 1 in segment 8, and has an eight-digit number as shown in the blue shaded section as , in table 1 above. Table 6: Embedding the Climate Change Budget Code Level 1 Level 2 Level 3 Full Code Description Division/ Cause Area Focus 2 digits 1 digits 1 digits 4 digits No Cause Tracked No Cause Tracked Climate Change Adaptation Principle Adaptation Significant Adaptation Mitigation Principle Mitigation Significant Mitigation Cause Division Area Area Area 3 50
104 Text Box 3: Stepwise Approach to Capturing Climate Expenditure in IFMIS Step 1: MDAs to formulate a list of climate relevant projects during SWGs and forward to NCCD for review and classification using agreed climate finance benchmarks. NCCD to summarize the eligible projects in a list (refer to chapter three on definition on Step 2: Use prescribed NCCD list to determine whether a project/programme has mitigation or adaptation co-benefits. {Where is the prescribe} Step 3: a) Determine if each project subcomponent is on the list of activities that provide mitigation, adaptation, capacity building or cross cutting co-benefits and the proportion of that activity that would qualify (applicable when a subcomponent falls under multiple sector codes) For determining proportions that qualify, note that: Programme with adaptation/ mitigation marker 2 ("principal objective") should cover adaptation dimension explicitly in the objective or should have most of the activities (and the budget) as adaptation/ mitigation-related. Programme with adaptation/ mitigation marker 1 ("significant objective") should specify adaptation/ mitigation dimension as a secondary objective (of a programme module) or at least one indicator on activity or outcome level. b) Total scores for the climate markers awarded for a project may not exceed 2 to rule out double counting of the project under climate finance: a project that has mitigation of greenhouse gases as its principal objective (score of 2) cannot have adaptation to climate change" as a secondary objective (score of 1). c) Programme/ project sub-components that qualify as: Principle (2) should be given 100% of the allocation, Significant (1) 50% of the allocation No CRE (0) - not allocated any climate finance/ expenditure. d) Percentages may be varied to follow real values if the information is available Step 4: By sector code, sum up the cost of subcomponents that qualify under mitigation, adaptation or capacity building co-benefits. By sector code, determine mitigation, adaptation or capacity building co-benefits as the percentage share of the total costs in the respective sector Record as mitigation, adaptation or capacity building co-benefits. The main challenge in the implementation of the climate budget code lies in linking budgets to activities contained in work plans. There are efforts by parliament to put more emphasis on PBBs. For instance, PFM Act 2012 requires that the PBB is submitted to parliament rather the itemized budget. This implies that auditing will be based on the PBB. This will strengthen PBBs and work planning. Furthermore, the National Treasury is also developing a platform for planning in the budgeting module of IFMIS to link budgets with work plans and cash flow and procurement plans. Once endorsed, the code will be adopted in the IFMIS to facilitate analytical reporting and M&E. 51
105 7 RECOMMENDATIONS ON MONITORING AND EVALUATION MECHANISMS 7.1 Overview This section contains the guiding documents that were developed during the CPEBR, namely; recommendations on the GoK Monitoring and Evaluation for thematic budgets; Guidelines on Adapting climate change related efforts to models; system reporting and analysis templates for climate change related budgets and expenditure; recommendations on the need for a database of climate related parameters in the budget or annual work plans. The CPEBR study analysed the country s processes for budgeting, tracking and reporting on climate change related public expenditure with the intention of providing guidance to strengthen the efficiency and effectiveness of climate finance in national and county Public Financial Management (PFM) systems. Through providing definition and coding, it has elaborated means and measures to efficiently and effectively track funds dedicated to climate change adaptation, mitigation and related activities, with a view to maximizing its mobilization locally and from external sources. It has also contributed to tracking of public expenditure against national policy priorities and plans, thus strengthening monitoring and reporting of climate change adaptation and mitigation efforts and enriched future Government-led stakeholder dialogue and learning Monitoring, Reporting and Verification Framework Per the SEI Policy report 8, climate finance is complex, flows through multiple channels and gets delivered to developing countries in multiple forms. These flows include both new instruments to address climate change and shifts in core development aid towards mitigation and adaptation in developing countries. Therefore, ensuring transparency and accountability is very crucial, but challenging. The accountability system envisioned by Parties to the United Nations Framework Convention on Climate Change (UNFCCC) involves three elements: Measurement defining the scope of financial flows to be tracked and data to collect; starts with defining climate finance : what kinds of projects and activities are covered, and what portion of a project with multiple objectives targets climate objectives. This is a political process; a technical process then follows, identifying the specific data to be collected. Reporting by both donors and recipients; Reporting refers to the ways in which data from finance providers (and optimally, also recipients) are made available to external parties, ideally the public; and Verification has two main components, the first is evaluating the reported data to ensure accuracy and avoid errors such as double-counting. The second is evaluating how the funds were used, to ensure the original plan was followed and gauge whether the stated objectives were met. A Government MRV framework should collect and process the necessary data and present it in a manner that is understood by all stakeholders - donors as well as aid planners in assessing the effectiveness of the flows and interventions they finance in meeting climate change objectives. The measurement, reporting and verification of climate finance even though linked are separate processes. Each element can be developed individually to maximize efforts. Each element of the framework involves different stakeholders though some degree of coordination and communication between the three elements is necessary. 8 Source: SEI Policy Brief (2012) Monitoring, Reporting and Verifying Climate Finance 52
106 Tables 7.1 and 7.2 summarise the crucial components of an MRV framework that are critical for objective assessment of Climate Finance. These components are distilled from the review of international practices and form the baseline of information gathering from stakeholders during consultation with them. MEASUREMENT OF CLIMATE FINANCE Table 7: Elements of a Measuring, Reporting and Verification Framework Three discrete components 1. Decisions about eligibility and accounting of finance. Required concrete actions by NCCD Clarity on the following areas is necessary: What contributions should be counted as climate finance? What is new and additional? When a project has multiple objectives, how much of the total finance is accounted as climate finance? How should the distinction between gross and net finance be made? Attempts have been made to address these in chapter three where the Climate Finance Definition is given but requires more consultation to arrive at acceptable definition by the government 2. Defining what data to collect. Different types of data and metrics are available: Monetary i.e. quantified financial support, disaggregated by use/purpose. Non-monetary some description of the delivery of in-kind support, technical advice or expertise, and other non-monetary forms of support. Measurement should also include the number of projects and programs induced through climate finance, disaggregated by objectives/purpose. 3. Processes for collecting the relevant data. Private climate finance Definition of flows of that may be eligible to be counted as private climate finance. Develop a data collection system for public finance to fit GoK's domestic needs (IFMIS?). Data collection may also involve multilateral institutions, since these are responsible for directing a significant portion of climate finance. The process for collecting data on private finance is unclear at present, and some or all the data might conceivably be collected by international institutions. Required actions To develop components of private climate finance including clarity on the following areas: Carbon market flows, possibly including CDM and/or voluntary markets though these are declining; NAMAs and New Market Mechanism? Foreign direct investment (FDI) flows, for instance investments in clean energy or activities that have a clear adaptation benefit; Philanthropic contributions; Risk guarantee and insurance services. Such private flows might be privately initiated or publicly leveraged. 53
107 REPORTING ON CLIMATE FINANCE Table 8: Elements of Reporting on Climate Finance Basic requirements Standardised reporting format to suit local planning and review analyses and enable comparison among UNFCCC Parties. Consistent methodologies to collect and analyse data. Reporting elements Key questions include: 1. Who needs to report (i.e. county and national governments, international institutions)? 2. Where do they report (i.e. through which channels or fora)? 3. How often do they report? 4. What forms of finance are covered (e.g. grants, concessional lending, nonconcessional lending, equity)? 5. What data are reported? Purpose: mitigation (including or excluding REDD+), adaptation, etc. Specific sectors and/or activities supported. Geographic distribution Disbursed funds only, or also pledged funds? Private financing leveraged by public funds. Capacity needs Concerted effort and dialogue among technical government departments and finance institutions within GoK and between GoK and Development Partners and international agencies General notes on required actions and capacity needs Public flows should be reported at the national level, rather than by individual MDAs and SAGAs. This may require boosting institutional capacity, and creates a need for concerted dialogue among government departments and finance institutions within GoK and between GoK and international agencies. In some cases, it may require new expertise, as well as new arrangements for institutional cooperation. UNFCCC National Communications are an appropriate venue for reporting on financial support. However, it is necessary to ensure greater consistency between GoK and Development Partners. The OECD CRS database provides a detailed platform for disaggregating finance data (ODA, bilateral climate finance tracked through Rio Markers). However, it would need to be expanded to include non-oda flows, improve the reporting categories and provide clear guidance on the interpretation of the markers locally to form a basis for MRV for the GoK. Table 9: Verification of Climate Finance Validating reported data to ensure transparency and facilitate independent review and analysis Verify scale of support (i.e. of financial flows themselves) by comparing data from contributors and the GoK. Verify effectiveness of support the actual achievement of climate-related outcomes (e.g. GHG emission reductions) and consistency with national priorities. Verify cost-benefit of adaptation activities, or the wider benefits of low-carbon development. Required actions and capacity needs Introduce process for review by independent, nonpolitical technical finance experts - e.g. from the National Treasury and NCCD. Consider scope for ex-ante quantitative assessment of social, economic and environmental impacts (e.g. through use of carbon footprint tools). Assess supported actions against expressed domestic priorities in recipient countries, such as priorities identified in National/ County Development plans and the Millennium Development Goals. 54
108 7.2 Guidelines to Establishing of a Database of climate related parameters in the budget In summary, the proposed database will comprise of: 1. Typical budget allocations and expenditure by programmes across MTEF years. These includes: a. all delivery units/ heads/ cost centres involved in the execution of the activities/ programmes and b. all associated line items (economic items). These can also be filtered to just reflect what is guided by the NCCD as the relevant input items. c. All PBB Key Performance Indicators (KPIs), Targets, Outputs and Outcomes associated with the allocated programmes/ sub-programmes as the performance metrics for evaluating the allocated programmes. 2. Footnotes or other guidance notes that the NCCD forwards to the National Treasury on each project, activity or programme across all sectors featured in the budget. With these elements of data, and along with the actual flagging of allocations captured in the general budget to delineate climate related ones, outputs described in the section below (on designing and developing system reporting and analysis templates for climate related budgets) can be derived without much rework of the IFMIS system. 7.3 IFMIS Reporting and Analysis Templates for Climate Related Allocations and Expenditure As stated above, the ability to adopt the IFMIS system of the GoK to report effectively on transactions made against funds designated as climate related with minimal customization is useful to both manage the costs of mainstreaming climate change in the GoK PFM practices as well as lessen change management issues associated with the transition to mainstreaming. This guiding principle is strongly recommended in the designing of data flagging and reporting templates on the budget system. The following sample GoK budget and expenditure reports are proposed for the exercise: 1. Summary of Climate Related Funds by Entity (i.e. administrative units). Ideally, with the system capability, the report can be designed to drill up and down to report at both the global GoK as well as drill down to the cost centre. Its variants would include: a. Summary by entity and Climate Change Type (i.e. Adaptation, Mitigation, etc.) b. Summary by programme and entity c. Summary by programme and Climate Change type d. Summary by programme, entity and climate change type. 2. Reports by programme, entity and climate change type in any of combination of the three or their drill ups/downs detailed by economic items. 3. Allocation/ Expenditure by climate-related activity*, project or programme against the budgeted KPIs, targets or outputs. A variant of this report would include one with the specific notes /footnotes from NCCD 4. Summary of Climate related allocations compared year on year or against total allocations. 5. Summary or details of the reports in 1 to 4 by definition i.e. climate related or climate finance. 6. Comparative views in 4 above on bar or pie graphs. 55
109 7.4 Recommendations on Short to Medium Term Guidelines on Capturing Allocations and Tracking Expenditure NCCD should send representatives to relevant SWGS to work with officers as each sector formulates their programmes, projects and activities as usual through the MTEF Sector Working Groups (SWGs). This interaction should introduce the climate change budget codes and what would be considered as climate relevant expenditure in the budget. MDAs will submit their final list of activities or projects to the NCCD for further review and documentation during the SWGs. This provides the NCCD with a clear view of the nature and anticipated value of the projects the Government will be rolling out within the next financial year. NCCD will then assist MDAs and Sectors in formulating PROGRAMMES and PROJECTS that deal with Climate Related Issues. Review Climate Related projects/ proposals for alignment with climate finance objectives. Review funding sources in conjunction with the National Treasury for Climate Funding. Generate final lists of Climate financed projects/ activities to be tracked in the budget. Review actual expenditure for alignment with Climate Change objectives The National Treasury will effect / assist MDAs effect the flagging of allocations/ expenditure on the IFMIS system and generate reports on Climate Change. 56
110 8 CONCLUSIONS This report has elaborated means and measures to efficiently and effectively track funds dedicated to climate change adaptation, mitigation and related activities, with a view to maximizing its mobilization locally and from external sources. It has recommended guidelines that will strengthen monitoring and reporting of investments made on the same, and hopefully by doing so, enriched future Government-led stakeholder dialogue and learning. The country s budgeting and planning processes, as a first step to understanding how to strengthen the efficiency and effectiveness of climate finance in national and county Public Financial Management (PFM) systems, has been outlined. Three core aspects of the national financial planning which are: i) the integration of climate change in the budgeting process, as part of budget planning, implementation, expenditure management and financing ii) National legal framework on financial management and budgeting iii) County legal framework on financial management and process of formulating budgeting including key stakeholders, have been highlighted. Operationalization of the climate finance definition and budget coding will go a long way in ensuring efficiency and effectiveness in planning, spending and tracking climate finance. The above is in line and validates the NCCAP which recommended that in the context of the MTP , the MTEF and the 2013/2014 budget, GOK could create a specific code within the IFMIS to allow climate change budgets to be tracked and reported. At present, the absence of such a code inhibits monitoring of climate change related expenditures, which is important both for effective internal government processes as well as for the reporting to the UNFCC CPEBR study has also generated information and guidance to support GoK in achieving objectives of the NCCAP towards strengthening the integration of planning (MTP and annual work plans), budgeting (MTEF), monitoring and reporting. However, the IFMIS system uses MTEF sectors since they are linked to classification of functions of government as described in the Government Financial Statistics (GFS) manual 2001 for international benchmarking. The MTP sectors are linked to Vision The NT is in the process of developing a mapping between MTP and MTEF sectors on the IFMIs system to provide clear linkages between them. Similarly, the NT is also developing a platform for work-planning on budgeting modules of IFMIS. MTEF process, that is integrated policy, planning and budgeting, is fundamentally about having expenditure programs that are driven by policy priorities and disciplined by budget realities. Defining and implementing a sectoral MTEF involves preparing estimates of overall resource availability, reviewing financing mechanisms, and preparing prioritized government spending plans. This is clearly not a one-off process. Rather it is iterative and must consider, on a periodic basis, changes in sectoral needs and priorities and changes in the overall resource envelope. The three sectors (ARUD, EII and EPW) under review received a large proportion of external resources. The combined allocation for the three sectors in 2011/ 2012 amounted to KSh 122 billion out of the total economy-wide external funds allocation of KSh 183 billion, which translates to 67% of the total external funds. In 2012/2013, the allocation increased to 70%, with a combined amount of KSh 158 billion for the three sectors out of a total economy-wide allocation of KSh billion; while in the year 2013/2014, the three sectors received KSh 176 billion out of the allocated KSh 240 billion (73% of the total external resources). 57
111 The total contribution by development partners (loans and grants) is significantly higher than the total CRE in the three sectors during the three financial years under review. The ratio of CRE to External Resources received is 8.29% in 2011/12; 7.61% in 2012/13 and 8.48% in 2013/14. EPW has the highest Climate Relevant Expenditure at 6.45% of the total external resources, on the other hand, ARUD CRE was 1.37 % of the total external resources whereas EII s ratio of CRE to total ER was 0.31%. If most CRE is received from external resources, then EPW has received the most CRE and EII the least. CPEBR study findings have revealed that Climate Relevant Expenditure in the ARUD, EII and EPW sectors over a three-year period between 2011 and 2014 was Ksh Billion (USD Million). For climate change to be integrated in the planning and budgeting going forward, and especially for the period 2017/2018 and 2018/2019 going forward, the requirement, is to create, as a matter of urgency, enough awareness on the CPEBR study findings and recommendations, so that line ministries and agencies can plan, have the incentives to do so, and have better information on which to base the development and effective implementation of a comprehensive MTEF. In terms of the next steps for carrying forward the proposed work plan for institutionalizing and implementing CPEBR deliverables for the forthcoming budget cycle. The following activities have taken place: 1. The NT has sent out the MTEF Budget circular (15/2015) to all Cabinet Secretaries and Accounting officers. To quote the circular, which is a public document, the purpose of this Circular is to provide guidance on the processes and procedures to be followed when preparing the Medium-Term Budget for 2016/ /19. The guidelines are issued in accordance with Section 36 (2) of the Public Finance Management Act, 2012 and apply to all Ministries, Departments, and Agencies(MDAs). The guidelines provide the following information: a) Key policies guiding the preparation of the Medium-Term Budget; b) Process of undertaking Programme Performance Reviews (PPRs); c) Documents, form and content of the Budget d) Guidance on programmes and projects to be funded; e) Guidance on public participation in the budget process; and f) Key timelines and deadlines for activities in the budget process 2. The MTEF sectors have been launched and as recommended above, the NCCD should grab this opportunity to ensure that they are represented in all SWGs to give guidance on climate change budget. 3. The Program performance reviews for the last financial year are being finalized and are due anytime this month 4. The Budget Review Outlook Paper (BROP) need to ensure climate related issues and budget are well articulated. 5. Sector Working Groups are good avenues for supporting climate proofing of Annual Budgets as part of the MTEF cycles, NCCD should participate in this to ensure that Climate issues and need for budgets are well captured. How to Strengthen CPBER findings to ensure their mainstreaming in the 2017/2018 and 2018/2019 financial years. Given that by the end of the CPEBR study, climate finance flows and sources were not adequately assessed due to difficulties in obtaining data on time, this should be 58
112 prioritized in the next phase by ensuring that NCCD works closely with the relevant financial and accounting officers and TNT to categorize these flows. Related to the above, there is need for a comprehensive study on the incremental climate change costs, analysis of SAGAs budget and expenditure to identify concessional loans and how these relates to climate finance. Given that the financial year has already begun, NCCD should initiate a discussion with MDAs on climate relevant project so that by the time the SWG process is underway, the idea of climate relevant expenditure and projects has been introduced as an entry point. NCCD can also draft a circular, which will be sent out through the National Treasury that requests SWGs to be conscious of the climate finance initiatives that will be embedded in the budget process 59
113 9 REFERENCES 1. Angela Falconer & Martin Stadelmann 2014: What is climate finance? Definitions to improve tracking and scale up climate finance. A Climate Public Initiative (CPI) Report 2. Duarte, M. (2013) Climate Finance Tracking. Energy, Environment and Climate Change Department (African Development Bank) 3. Falzon, J. Pols, D, King uyu, S & Wang ombe,e (2014) Inside stories on Climate Compatible Development (CDKN) 4. Government of Kenya & UNDP (2014) Development of Climate Change Budget Codes for the National Treasury: National Treasury 5. Government of Kenya (1999) Environmental Management and Coordination Act (EMCA): Ministry of Environment, Water and Natural Resources 6. Government of Kenya (2003) Constituencies Development Fund Act 7. Government of Kenya (2013) Comprehensive Public Expenditure Review: Eye On Budget: Spending For Results 8. Government of Kenya (2007) Kenya Vision 2030: National Council for Law Reporting with the Authority of the Attorney-General 9. Government of Kenya (2010) National Climate Change Response Strategy: Ministry of Environment, Water and Natural Resources 10. Government of Kenya (2010) The Constitution of Kenya: National Council for Law Reporting with the Authority of the Attorney-General 11. Government of Kenya (2012) County Governments Act: Ministry of Planning and Devolution 12. Government of Kenya (2012) Draft National Environmental Policy: Ministry of Environment, Water and Natural Resources 13. Government of Kenya (2013) Budget Review and Outlook Paper: The National Treasury 14. Government of Kenya (2013) County Governments Public Finance Management Transition Act: The National Treasury 15. Government of Kenya (2013) Kenya Vision 2030, Medium Term Plan ( ) 16. Government of Kenya (2013) National Climate Change Action Plan: Ministry of Environment, Water and Natural Resources 17. Government of Kenya (2013) Public financial Management Act: The National Treasury 18. Government of Kenya (2013/2014) County Integrated Development Plans (CIDP): County Government 19. Government of Kenya (2014) Draft Climate Change Bill: Ministry of Environment, Water and Natural Resources 20. Government of Kenya (2014) Draft National Climate Change Framework Policy: Ministry of Environment, Water and Natural Resources 21. Government of Kenya (2015) Budget Policy Statement: Enhancing economic transformation for a shared prosperity in Kenya 22. Government of Kenya (2014) County Governments: Annual Budget Implementation Review Report Fy 2013/ Government of Kenya (2014) Medium Term Expenditure Framework 2015/ /18: Agriculture, Rural and Urban Development Sector: Republic of Kenya 24. Government of Kenya (2014) Medium Term Expenditure Framework 2015/ /18: Energy, Infrastructure and Information Communication Technology Sector: Republic of Kenya 60
114 Government of Kenya (2014) Environment Protection, Water and Natural Resources Sector Report Medium Term Expenditure Framework (MTEF) Budget for the Period 2015/ /18: Government of Kenya 26. Government of Kenya (2014) Programme Based Budget of the National Government of Kenya for the Year Ending 30th June, 2015: Republic of Kenya 27. Institute of Economic Affairs (2014) Handbook on County Planning, County Budgeting and Social Accountability 28. County Government of Bungoma (2014) County Government of Bungoma: Ministry Of Finance Budget Outlook Paper 2014/ /2017: Republic of Kenya 29. County Government of Bungoma (2014) Bungoma County Integrated Development Plan : Republic of Kenya 30. County Government of Bungoma (2014) Programme Based Budget for Bungoma County Government for the Year Ending 30th June, 2015: Republic of Kenya 31. County Government of Bungoma (2014) Ministry Of Finance and Economic Planning: County Budget Review and Outlook Paper 2014: Republic of Kenya 32. Kenya National Drought Management Authority (2014) Isiolo County Adaptation Fund: Activities, Costs and Impacts After The1st Investment Round, Project Report, June 2014: Newsletter Bible Society of Kenya 33. County Government of Isiolo: Revised County Integrated Development Plan: : Republic of Kenya 34. County Government of Isiolo: County Treasury Supplementary Budget Estimates 2014 Medium Term Expenditure Framework 2014/ /17: Republic of Kenya 35. County Government of Isiolo (2014) Isiolo County Budget Review and Outlook Paper 2014: Ministry of Finance and Economic Planning: Republic of Kenya 36. County Government of Laikipia (2014): Department Of Finance And Economic Planning County Budget Review Outlook Paper: Republic of Kenya 37. County Government of Laikipia (2014) First County Integrated Development Plan: : Republic of Kenya 38. County Government of Laikipia (2014) Supplementary Budget Estimates of Recurrent and Development Expenditure for The Year Ending 30th June, 2015: Republic of Kenya 39. Hongo, T. Definition and reporting system of Climate Finance (Second Meeting of Experts on Long-term Finance August, Bonn) Institute of Economic Affairs (2011) The Citizen s Handbook on the Budget: A Guide to the Budget Process in Kenya: Nairobi, Kenya 42. Miller, M. (2012) Climate Public Expenditure and Institutional Reviews (CPEIRs) in the Asia-Pacific Region: What have We Learnt? (UNDP &CDDE) 43. Mutimba, S & Wanyoike, R. (2013) Towards A Coherent And Cost-Effective Policy Response To Climate Change In Kenya: Country Report : Heinrich Böll Stiftung, East and Horn of Africa 44. OECD& DAC (2011) Handbook on the OECD-DAC Climate Markers 45. Touchette, J (2012) Tracking Climate Finance: The OECD DAC Reporting Framework: Statistics and Monitoring Division Development Co operation Directorate (OECD) 46. World Bank (2014) Climate Change Public Expenditure Review Sourcebook 47.
 for the Charcoal Sector in Kenya United Nations Development Programme The following documents and annexes are enclosed:")
115 On behalf of NAMA Support Project Outline 4 th Call To the Members of the NAMA Facility Board NAMA Facility - Technical Support Unit (TSU) E: contact@nama-facility.org Project Title: Applicant: Nationally Appropriate Mitigation Actions (NAMA) for the Charcoal Sector in Kenya United Nations Development Programme The following documents and annexes are enclosed: General and Specific Information on the NAMA Support Project Annex 1: Letters of Endorsement of National Government and National Implementing Partners Annex 2: Logframe Annex 3: Information and references of the (non-governmental) applicant Annex 4: Detailed Project Preparation (DPP) concept Annex 5: Information and references of the NSO if different from applicant Version4 th Call(4July2016) Submission Deadline: 31 October 2016, 12 pm (CEST/GMT+2) All documents must be provided in English language. If necessary, please provide a translation.
116 List of abbreviations BAU: BMUB: COG: DECC: DPP: EC EFKM: FC: GHG: GID: GIZ: MCEB: MENR: MFA KfW: KEFRI: KFS: M&E: NDC: NSO NSP: ODA: TC: ToC: TSU: VAT: Business As Usual German Federal Ministry for the Environment, Nature Conservation, Building and Nuclear Safety Council of Governors UK Department of Energy and Climate Change Detailed Preparation Phase European Commission Danish Ministry of Energy, Utilities and Climate Financial Cooperation Greenhouse gas General Information Document Deutsche Gesellschaft für Internationale Zusammenarbeit GmbH Danish Ministry of Climate, Energy and Building Ministry of Environment and Natural Resources Danish Ministry of Foreign Affairs KfW Development Bank Kenya Forestry Research Institute Kenya Forestry Services Monitoring and Evaluation Intended Nationally Determined Contributions Nama Support Organisation NAMA Support Project Official Development Assistance Technical Cooperation Theory of Change Technical Support Unit Value Added Tax 2
117 1. General Information on the NAMA Support Project 1.1 Project data Project title Nationally Appropriate Mitigation Actions (NAMA) for the Charcoal Sector in Kenya Country of implementation Kenya Sector focus Agriculture Forestry Land use Transport Energy Efficiency Renewable energy Waste/waste water Other Duration of project 60 months implementation Duration of detailed 15 months preparation (DPP) NSP volume Preparation (DPP): 201,000 EUR (EUR) Implementation: 13,400,000 EUR Total: 13,601,000 EUR Publication Are you willing to have your submission (country, sector) listed on the NAMA Facility website? Yes No 1.2National Ministry 1 Emission reduction credits 1.3 National Ministry 2 Name of responsible national ministry NAMA Facility Funding is used directly for greenhouse gas mitigation and/or carbon sinks, which will contribute to generating emission allowances, emission credits, or any other type of CO2 compensation certificates: Yes No If yes, will the credits be permanently cancelled in an approved register: Yes No Name of responsible The Ministry of Environment and Natural Resources (MENR) national ministry Department The Climate Change Directorate Postal Address Country Kenya Contact Person Dr. Charles Mutai Telephone Telefax drcmutai@gmail.com; Website Letter of Support Please provide a letter of support for the NSP in annex 7. The letter should state the specific project title and include a reference to the entity submitting the application Official support letter attached Department Postal Address Country Contact Person Telephone Telefax Website 3
118 Letter of Support 1 Please provide a letter of support for the NSP in annex 1. The letter should state the specific project title and include a reference to the qualified DOs selected to implement the project. Official support letter attached 1.4(Co-)Applicant Name of institution United Nations Development Programme. 1.5 Main Implementing Partners 1.6 NAMA Support Organisation (NSo) Type of institution Legal form International Organization UN Entity Non-profit status yes no Department Energy Environment and Climate Change Unit Postal Address P.O. Box Country Contact Person Kenya Mr. David Githaiga Telephone Website Role in the project David.githaiga@undp.org Team Leader, Energy Environment and Climate Change Unit Please name national implementing partner(s) (governmental or non-governmental), who will be responsible for the implementation of the NSP Name of organisation Type of institution Country Contact Role Commitment Name of organisation Type of institution Country Contact Role Commitment Kenya Forestry Research Institute Research Institution/State Corporation Kenya Dr. Ben Chikamai Implementing Partner Official support letter attached Council of Governors State (Devolved Governments) Kenya Ms. Jacqueline Mogeni, ceo@cog.go.ke; Facilitation Role Official support letter attached For information - Please propose a NSO for the implementation of the NSP Name of organisation Type of institution County Contact United Nations Development Programme International Organization Kenya For contact details, please refer to 1.4 above. 4
119 2. Project Concept 2.1. Executive summary [max. 400words] Kenya, with a population of about 45 million, relies on wood fuel for 70% of its energy supply. Charcoal is an important source of cooking energy, providing all or part of cooking heat for about 82% of urban and 34% of rural households in Kenya. About 2.4 million tons of charcoal was consumed in 2000 and its demand is increasing with population growth and urbanization. Identification of viable efficiency options for the charcoal sector is desperately needed, as the combination of unsustainable harvesting of trees for charcoal production, increased charcoal consumption and the use of inefficient traditional kilns, form the key threats to forest resources in Kenya. The need for sector transformation is reflected in its INDC by including enhancement of energy and resource efficiency across the different sectors and make progress towards achieving a tree cover of at least 10% of the land area of Kenya as part of its priorities. In addition, Kenya has put in place policies and regulations that would have resulted in conservation and sustainability of its forests. However, the lack of enforcement, along with the lack of incentives for efficient production of charcoal, impedes the country s transition to low carbon development. The overarching goal of this NAMA Support Project (NSP) is to trigger Kenya s lowcarbon development by minimizing the impact of the current charcoal value chain, while targeting the causes of deforestation and improving the energy security. The NSP will target areas around the two main cities of Nairobi and Mombasa, but will have far reaching impacts in all major charcoal producing counties in Kenya. These goals will be achieved through three parallel activities, Activity 1: Establishment of an interest rate subsidy fund to support the sustainable supply of biomass for charcoal production and the implementation of efficient charcoal production technologies; Activity 2: Establishment of a charcoal certification and labelling scheme; and Activity 3: Capacity Building. 2.2 Project rationale [max. 300 words] The funding support for the implementation of the NSP will allow the market for sustainably sourced and efficiently produced charcoal to develop and mature. Once established, the market can continue to operate on a low carbon path even after the end of the support from the NAMA Facility. The greenhouse gas (GHG) mitigation potential of the NSP amounts to a total of MtCO2e for the first 5 years of its implementation with support. After which, the project is expected to continue reducing 4.98 MtCO2e emissions per year. Charcoal is a key bioenergy resource in Kenya. It forms a major source of household energy -for both - urban and rural people, providing 82% and 34% of household energy respectively. It is a relatively cheap source of cooking energy produced nationally. The sector provides employment and income to almost one million Kenyans. The charcoal industry is growing, thus creating opportunities and a source of income generation to many people, especially local women. However, because demand outstrips supply, increased charcoal consumption leads to unsustainable harvesting of trees and deforestation that has led to destruction and depletion of forest resources, and inefficient production using traditional kilns. This is particularly devastating to indigenous tree forests, straddling most of the community trust lands, gazetted forest reserves in a majority of rural counties that supply urban centres with charcoal. These form a major threat to the environment and contribute to the increase of GHG emissions. The NSP aims to address these issues by ensuring sustainable biomass supply for charcoal production and implementing efficient technologies for its production. This is done through intervention measures that involve policy and regulation, incentives, and capacity building and awareness creation, which will ultimately result in the transformative change of the sector to a low carbon development path. The NSP will involve a vast range of stakeholders including government entities responsible for regulation development and enforcement, various stakeholders 5
120 2.3 Project concept [max words] involved in charcoal research and development, stakeholders directly involved in the charcoal value chain, as well as end users. The project will also target counties that are important as emerging institutions that are involved in policy formulation and project implementation. The civil society will play a crucial role throughout the implementation of the NAMA, being the charcoal as its main cooking energy in the country. The proposed NSP will implement a set of measures for sustainable forest management and biomass production and the transition to energy efficient technologies for charcoal production. Additionally, sustainability of the system and the transition to a low carbon value chain will be assured by the introduction of certification and labelling system. The NSP will cover areas that supply Kenya s major cities (Nairobi and Mombasa) with charcoal. Through the support by the NAMA Facility of an interest rate subsidy fund under Activity 1 below, the NSP will allow sustainable biomass supply and efficient charcoal production. This scale will further allow for the continuous operation and replenishment of the interest rate subsidy fund even after the end of the NAMA Facility support and assist the financing of nationwide sustainable charcoal value chain in Kenya. INTERVENTIONS TO BE FINANCED The NSP will finance the following activities: Establishment of an interest rate subsidy fund to support the financing of the activities under the NSP and the NAMA Design and implementation of a charcoal certification and labelling system Capacity development for government entities and other stakeholders Activity 1: Establishment of an interest rate subsidy fund to support the financing of the activities under the NSP and the NAMA Despite the fact that there are successful pilots producing sustainable charcoal in Kenya, there have been no mechanisms to allow their replication and spread across the country beyond the occasional donor support or initiatives by local NGOs. The proposed mechanism allows addressing the existing financial barriers by creating, through the NAMA Facility support, an interest rate subsidy fund within the Kenya Commercial Bank, which already has experience with innovative projects and working with donor entities. The interest rate subsidy fund will have the size of 7 million EUR and will target the elements of the value chain that are not the common financing assets and face higher risk premiums by commercial banks, i.e. sustainable forest management and purchase of energy efficient kilns. Each loan application will be screened against a set of criteria, such as experience with forest management, experience with charcoal production or existing long-term contracts with charcoal producers (for forest management projects) and charcoals buyers (for charcoal producers). The amount of interest rate subsidy will be determined on a case by case basis, but as a rule of the thumb it will be used only to cover the interest rate spread, but not the bank funding costs. It is expected that at an average interest subsidy rate of 50% over five years, the proposed interest subsidy fund can mobilize approximately 30 million EUR equivalent in loans. Additionally, in order to minimize the risks on the side of the Kenya Commercial Bank associated with financing of new types of assets (i.e. forestry management and purchase of new kilns), a loan guarantee scheme will be set up with additional funding from the NAMA Facility amounting to 4 million EUR. The fund will be used to guarantee the loans extended during the first three years of the operation of the interest rate subsidy fund. It is considered that this period will be sufficient for the 6
 with one year")


121 bank to gain experience with this new type of assets and develop internal risk management mechanisms. The subsidized loans will be extended for a period of not more than five years (in line with the current lending practice of commercial banks in Kenya) with one year grace period. In order to guarantee compliance with the sustainability principles for charcoal production, all borrowers will be subject to sustainability compliance monitoring, i.e. they have to prove that they efficiently produce sustainable biomass and use sustainable biomass for charcoal production. Non-compliance will result into repayment of the entire interest rate subsidy after the repayment of the loan principal and the subsidized interest rate. Details of the monitoring and compliance system will be designed during the DPP stage. Figure 1: Loan Repayment Schedule (Example) Additionally, once the repayment of the loans covered by the loan guarantee facility is over, the remaining loan guarantee funds may be used for providing new interest rate subsidies. In this way, project developers in Kenya will have a financing scheme that can continue operating after the end of the NAMA Facility support and will allow the existing model to spread throughout Kenya. The details of the financing mechanisms will be developed during the DPP stage. Figure 2: Financing Mechanisms Concept 7
122 Outline of a Typical Forest Management Project The typical forest management project will involve the establishment of a forest management system that will allow sustainable production, harvesting and sale of biomass. All forest management companies/cooperatives will agree to follow a predetermined set of sustainable forest management rules. The loans under the NAMA facility will finance the initial investment for the establishment of the forest managements system in case of existing forest or the costs for establishing a plantation of fast growing plants, as well as their initial operational costs. The business models for forest management are described later in this section. Outline of a Typical Energy Efficient Kiln Producing charcoal technically consists of carbonization of wood and other woody biomass by pyrolysis, i.e. combustion with reduced access to oxygen. During pyrolysis, biomass undergoes a sequence of changes and normally yields a black carbonaceous solid, called charcoal, along with a mixture of gases and vapours. Generally, charcoal production through pyrolysis is maximized in a process of low temperatures and slow heating rates, so-called carbonization. The need for heat to support the process can be reduced if the hot gases are recycled to heat the carbonizing material. The interest fund under the NSP will finance kilns that meet a certain minimum efficiency benchmark, 30 %. This will allow more advance charcoal production technologies to be disseminated in Kenya. Activity 2: Design and implementation of a certification and labelling system As part of this activity, a robust Kenyan nationwide certification and labelling scheme for all charcoal sourced from local biomass and produced (carbonized), transported, traded, and consumed in Kenya. Its theory of change is based on the assumption that if the final consumer is able to easily identify and only purchase sustainably sourced and efficiently produced charcoal, the objectives of Activity 1 (sustainable biomass supply and efficient charcoal production) will to a large extent have been achieved. For corporate consumers that heavily rely on charcoal including hotels, factories, schools, hospitals and such, a national sensitization campaign will see immediate shift to sustainably produced certified and labelled charcoal. Activity 3: Capacity development for government entities and other stakeholders This activity will involve information dissemination to relevant stakeholders regarding the NAMA and the NSP approaches and enable transformation by building relevant capabilities with each stakeholder, development of policy (both incentives and enforcement) which addresses the goals and present shortcomings, and finally enable the policy packages (incentives and regulation for woodlots). This will also involve tracking of biomass sourcing and restoration plans for each site to promote sustainable sourcing of biomass. EXPERIENCE WITH PILOTS The NSP will build upon the experience of successful pilots that have been implemented. In the African continent, there have been several pilots that have been funded and conducted to study and demonstrate solutions on how to make charcoal sourcing and production sustainable. In Kenya, in line with the recently introduced energy and forestry laws to regulate charcoal production and drive more sustainable 8
123 production, the UN s Food and Agriculture Organisation (FAO) carried out a study into the methods of charcoal production in two regions of Kenya and to pilot more efficient production methods. The pilots were successful and communities in target areas expressed their strong wish to continue with the technology introduced in the pilot. With funding support for the NSP will allow reproducing the successful pilots on a nationwide scale which will result in the development and maturity of the market for sustainably sourced and efficiently produced charcoal that can continue operating on a low-carbon path even after the end of the support. BUSINESS MODELS Business Models in Forest Management The following business models are considered for forest management. Model 1: Community based forest management Duly registered community forest associations (CFAs) may be licensed to produce charcoal as per the relevant sections of the Forest Act (2006) and Forests (Charcoal Production, Transportation and Marketing) Rules, 2016 woodlots will be encouraged to sustainably produce and supply fuelwood for their own commercial charcoal production or to sell to other interested CFAs or independent licensed charcoal producers. Model 2: Private sector based forest management Private sectors such as smallholder farmers, land owners, and entrepreneurs renting land will be encouraged to establish woodlots. The Forest Act (2005) requirement that all private landowners set aside at least 10% of their land for forests will be enforced to encourage more sustainable supply of biomass for charcoal production. The private land owners will be encouraged to join or form CFAs or CPAs if they want to sell their timber or commercially produced charcoal. Model 3: Public sector forest management Public forest can be utilized through the establishment of demonstration woodlots to showcase various tree species, agro-forestry techniques, and so on to CFAs, individual landowners, and the general public. Business Models in Charcoal Production Production of charcoal for commercial purposes will only be done by landowners and charcoal producers such as CPAs legally licensed to do so. The transition will be enabled by capacity building, incentives and regulation. This will make it easy to target such charcoal producers with technical and financial support to acquire and operate efficient kilns. Model 1: Efficiently producing charcoal using sustainable biomass from entrepreneurs providing sustainable biomass. The entrepreneur profits from the cost difference between the sustainably sourced biomass and the charcoal sold to brokers or transporters. Model 2: Supplying charcoal production technology. Thousands of efficient kilns sanctioned by the Kenya Forestry Research Institute (KEFRI) will be commissioned 9
124 around Kenya including small scale and larger units, mobile (truck), modular, and stationary units. THE FINANCIAL SUPPORT MECHANISM The financial support mechanism is described under Activity 1. It is built upon the replication of an already existing pilot which is successful and profitable, but lacks the access to initial funding (kick-start finance) for replication and expansion. The financial support mechanisms will allow for replication of similar projects under the existing business model across Kenya. REGULATORY FRAMEWORK TO MAKE THE NSP SUCCESSFUL Strict enforcement and compliance with relevant policies and regulations is a key to the success of the NSP. Kenya s policies and regulations for conservation and sustainable management of forests are extensive and robust, but with insufficient enforcement. Therefore, the NSP is expected to provide further support on the enforcement of legislation. Technical framework for the production and use of efficient kilns: A technical advisory committee on the production, efficiency and quality assessment as well as the development of proper guidelines for the use of different types of efficient kilns is established and work with the Kenya Bureau of Standards to ensure that the certification of efficient kilns is carried out. Regulate use of efficient kilns: Section 7(4)f of the revised (2012) charcoal regulations states that for one to be issued with a license to produce charcoal, the licensing subcommittee shall consider the type of technology. It is proposed that all commercial charcoal production in Kenya must be done using kilns with a thermal efficiency of at least 30%. Training on efficient kiln design, construction, and use: To ensure that high quality efficient kilns are readily available and at an affordable price, targeted training will be provided to Jua Kali (informal sector) artisans throughout the country in the design and construction of such kilns. 2.4 Barrier analysis [max. 600 words] Currently, Kenya has no charcoal certification and labelling scheme. This NSP will introduce a third party certification and labelling scheme. In addition, the following will be implemented: Establishment of a system of environmental standards and fiscal reform; Review of specific policies and regulations; Guidelines on labels and packaging technology; and Inter-county and international cooperation. The following barriers hinder the charcoal sector in its fight against unsustainable charcoal production and use. Regulatory Barrier Kenya s existing policies and regulations concerning conservation and sustainability of forests include but are not limited to the Forests Act (2005), Forests (Charcoal Production, Transportation and Marketing) Rules, 2016, Wildlife Conservation and 10
125 Management Act (2013), Agriculture Act (revised 2012), and (GoK, 2015b), the Environmental Management and Coordination Act (1999). While these are in place, the challenge has been the chronic inability to its enforcement and compliance resulting in unregulated commercial activities and deforestation. The interventions proposed under this NSP will address the existing regulatory barrier by supporting the capacity of relevant institutions mandated to implement these policies and regulation. The support will be extended to the county governments where most of the charcoal is produced. In addition, the establishment of a certification and labelling scheme would allow stakeholders of the entire CVC to supply, produce, and use sustainably sourced products, and more importantly, enhance and facilitate enforcement and compliance with the various legislations intended to regulate the charcoal sector. It will also create more business opportunities as more people get into the regulated and streamlined charcoal sector. Technical Barrier Charcoal in Kenya is predominantly produced in traditional earth mound kilns that have very low recovery rates (estimated at 16% but can be as low as 10%). Local producers often lack the skills, raw material and investment capacities to switch towards more efficient technologies. Since production is often intermittent and the firewood used often is freely or very cheaply available, there is little incentive for the producer to aim for efficient production. The NSP will address this barrier by implementing efficient charcoal production technologies enabled by capacity building, incentives, and regulation. It is also proposed that the charcoal regulations and Energy Act be revised to explicitly state that all commercial charcoal production in Kenya is done using kilns with an efficiency of at least 30%. Financial Barrier Unregulated commercial activities in the CVC results in reduced fiscal revenues. This in turn limits the capacity and ability of relevant agencies in regulating and enforcing despite the presence of extensive and robust policies and regulations intended to conserve and sustain forests. The proposed NSP will allow overcoming this barrier through the establishment of an interest rate subsidy fund and provision of loan guarantees. Furthermore, through the repayment of the interest rate subsidy, the fund will be replenished and will provide a long-term solution for overcoming the financial barriers. It is expected that after a period of two three years, commercial banks in Kenya will gain better understanding of recycling and composting projects and they will not be considered risky assets, thus leading to the natural phase out of the interest rate subsidy fund. 2.5 Embedding [max. 700 words] Kenya submitted its INDC to the UNFCCC secretariat in July 2015, ahead of the COP21 in Paris. The INDC commits the country to reduce its GHG emissions by 30% by 2030 relative to the national BAU scenario of 143 MtCO2e, or by 42.9 MtCO2e by
126 The NSP will contribute towards this target which is expected to reduce 4.98 MtCO2e per year by Moreover, the INDC states that emissions of carbon dioxide from combustion of biomass are assessed but not counted towards the contribution. This means that the GHG emissions from biomass combustion, including charcoal production, is included in the BAU emission scenario of 143 MtCO2e but their reduction or abatement is not part of the 30% emission reduction target. Therefore, if GHG emission reductions from non-sustainable biomass sourcing and combustion as proposed in this NSP were included, Kenya s emission reduction target could be higher than the 30% (42.9 MtCO2e by 2030) stated in the INDC. In addition, the NSP is aligned with the INDC in achieving its target through the implementation of mitigation activities, namely, the enhancement of energy and resource efficiency across the different sectors, and make progress towards achieving a tree cover of at least 10% of the land area of Kenya. Prior to enactment of Forest Act 2005 (FA2005) now under revision, Kenya forest sector did not recognize charcoal as a legal forest product in spite of the high utilization by the citizens. This constrained any development of the sector and encouraged thriving of illegal production. The FA2005 provided for development of charcoal rules 2009 (legal notice 186 of 2009) and revised 2012, which provided for the start of organized sourcing of charcoal production biomass and licensing of the dealers. The rules had good provisions for regulation and penalties, although one major weakness was that they were formulated for fulltime charcoal producer, which is not the case in most producers. At the same time, enforcement of these rules has remained weak. Along with the Forest Act 2005 are the Forests (Charcoal Production, Transportation and Marketing) Rules, 2016, Wildlife Conservation and Management Act (2013), Agriculture Act (revised 2012), and the Environmental Management and Coordination Act (1999) among others. Again, the chronic inability to enforce and ensure compliance remains a challenge. In line with Kenya s national and sectoral strategies and policies, the implementation of the NSP will trigger the transformation of the sector into a low carbon development pathway, minimize the impact of the current CVC, act on the causes of deforestation, improve the livelihoods of the communities relying on charcoal and improve the energy dependence of the country. In addition to GHG mitigation, the NSP is designed to produce sustainable development co-benefits. The SD impacts identified that can be monitored include access to clean and sustainable energy, capacity building, job creation, policy and planning, and law and regulation. There are also impacts attributable to the NSP which are difficult to incorporate in its MRV system, and therefore, not measured. These include air pollution/air quality, biodiversity and ecosystem balance, livelihood of poor, poverty alleviation, peace, health, time savings/availability, education, empowerment of women, access to sustainable technology, and energy security. Without the support of the NAMA Facility, the transformation of the charcoal value chain in Kenya will be very difficult due to the existing barriers of the sector. Therefore, the NSP is additional. 12
127 3 Project Ambition 3.1 Potential for transformational change [max. 600 words] The NSP will result in significant transformational change to the charcoal value chain in Kenya. Catalytic Effect The NSP will change public perception of charcoal as a nationally produced good, which can be produced legally and sustainably with the cooperation of the regulator, law enforcement and the consuming public. In addition to the development of a large number of projects under the NSP, the capacity building and the improvements in the law enforcement will support the irreversible transformation to sustainably sourced and efficiently produced charcoal with carbon emissions equivalent to a small fraction of the present, while maintaining and increasing production. Along with this, the NSP will create jobs, providing rural employment. Consumers can move away from practices resulting in high GHG emissions, indoor air pollution which damages health and deforestation Sustainability The NSP is sustainable as it provides a clear business model with clearly defined costs and revenues. After its implementation period, it is expected that the interventions and measures proposed will have become established and thus able to sustain themselves through the various exit strategies put in place. Replicability/Scalability The scope of the NSP covers counties in the vicinity of Nairobi. The NSP can be replicated throughout Kenya and in neighbouring Sub Saharan African countries which rely heavily on charcoal for cooking and heating. In particular, there have been several NAMA studies conducted for charcoal such as in Uganda, Côte d Ivoire, and Ghana, that could benefit by replicating this NSP. 3.2 Financial ambition [max. 500 words] The total cost of the NSP is estimated to be approximately 51 million EUR. The NSP will request investment support from the NAMA Facility in the amount of 13.4 million EUR which will be used for financing of Activities 1-3 described above. Under Activity 1, the NAMA Facility will contribute 9 million EUR for the establishment of the interest subsidy fund, 2 million EUR of which will be for the loan guarantee system. The funds from the NAMA Facility will be provided for an interest subsidy to support loans for improved forest management and purchase of highly efficient charcoal kilns. This is expected to leverage approximately 30 million EUR equivalent from the participating private bank Kenya Commercial Bank. The creation of the interest rate subsidy fund will allow the mobilization of approximately 30 million EUR of private capital in GHG emission reduction activities over a period of 5 years, thus providing a trigger for the replication of the sustainable charcoal production value chain across Kenya. 13


128 Figure 3: Financial Ambition The NAMA Facility will also provide 3 million EUR for the establishment of the national certification and labelling system in Kenya which will be matched with 7 million EUR equivalent from the National budget of Kenya in terms of the establishment of certification centres and employment of the staff. Finally, the NAMA Facility will provide 1.2 million EUR for consulting, capacity building and knowledge dissemination activities, both for working with stakeholders, as well as for strengthening the regulatory framework. 3.3 Mitigation ambition [max. 400 words] The GHG mitigation potential of the NSP amounts to 4.98 MtCO2e of GHG emissions reduced during the NSP. As a result of the NSP implementation, the emissions from deforestation linked to charcoal production are projected to reduce by up to 75% (3.9 MtCO2e) per year by The BAU emissions for the forestry sector attributed to charcoal production were estimated as 7.6 MtCO2e in 2010, declining to 5.2 MtCO2e in The BAU emissions for the forestry sector were obtained from the National Climate Change Action Plan (NCCAP). While no data is available on the emissions contribution of charcoal production alone, it was estimated using proxy data from a Tanzanian study. Emission reduction target from the introduction of efficient kilns are estimated to reach 0.12 MtCO2e per year during the NSP, which amounts to1.08 MtCO2e per year by The BAU figures for charcoal production in Kenya in 2010 was 0.8 MtCO2e and is projected to rise to 1.2 MtCO2e in 2030 if no mitigation actions are undertaken. Emission reduction achieved by improving efficiencies in charcoal production is calculated using a CDM approved methodology AMS-III.BG: Emission reduction through sustainable charcoal production and consumption. 14
129 4 Expected Budget and Financing Structure (in EUR) 4.1 NSP Implementation: Overall cost and financing contributions (Estimate) NSP - Implementation Total cost Nama Facility 1. Financial mechanism(s) National budget private sector other donors total finance 1.1 Activity 1 39,000,000 9,000,000 30,000,000 39,000, Activity 2 10,000,000 3,000,000 7,000,000 10,000, Activity 3 2,000,000 1,200, ,000 2,000, TA (Expert services / consulting) 3. Other direct and indirect costs 200,000 Total <gross> 51,000,000 13,400,000 7,800,000 30,000,000-51,000,000 Please be aware that 1% of the overall NF budget need to be reserved for M&E (mid-term and final evaluations) 4.2 NSP Detailed Preparation Phase (DPP): Funding requirements from the NAMA Facility NSP - Preparation Total 1. Personnel 182,000 2.Travel and allowances 15, Procurement of materials and equipment - 4. Other direct and indirect costs 4,000 Total <gross> 201,000 15
130

131
132
133
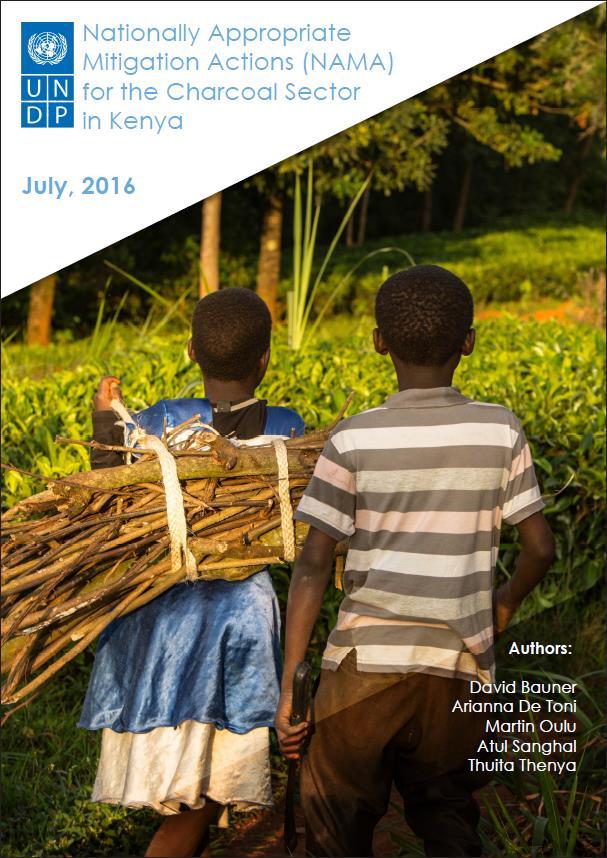
134 1
135 2
136 Nationally Appropriate Mitigation Actions (NAMA) for the Charcoal Sector in Kenya 29 July 2016 Final Report Authors (alphabetical order): David Bauner Arianna De Toni Martin Oulu Atul Sanghal Thuita Thenya 3
137 Acronyms: CC : Charcoal COMESA : Common Market for Eastern and Southern Africa CPA : Charcoal Producers Association CVC : Charcoal Value Chain EAC : East African Community fnrb : fraction of Non-renewable Biomass GHG : Greenhouse Gases ICS : Improved Cook Stove KEFRI : Kenya Forestry Research Institute KFS : Kenya Forest Service KIRDI Kenya Industrial Research and Development Institute KCIC Kenya Climate Innovation Centre NAMA : Nationally Appropriate Mitigation Action NCA : NAMA Coordinating Authority NCCAP : National Climate Change Action Plan NDA : National Designated Authority NEE : NAMA Executing Entity NIE : NAMA Implementing Entity RWE : Round wood equivalent SNC : Second National Communication SSA : Sub-Saharan Africa 4
138 Executive Summary This sectoral NAMA Report was commissioned by UNDP Kenya with funding from the Joint UN-DFID support to low carbon climate resilient development for poverty reduction in Kenya. Its development followed a broad-based and inclusive process bringing together key stakeholders in the charcoal sector. The consultants two Kenyan and one international, provided a draft which was subjected to two national stakeholder reviews, first in a workshop held in January 2016, and a second validation workshop held in June The report integrates their inputs. The authors acknowledge the importance of these consultations and the constructive feedback from the workshop participants. The participatory process is not only a constitutional requirement, it ensured that the NAMA has broad stakeholder support. Charcoal is a key bioenergy resource and source of energy in Kenya. It forms a major source of household energy that is cheap and affordable both to urban and rural people, providing 82% and 34% of household energy respectively. A relatively cheap source of cooking energy produced nationally, charcoal provides employment and income to almost one million Kenyans. Because demand outstrips supply, the charcoal industry is growing, thus creating opportunities and a source of income generation to many people. However, increased charcoal consumption and production using inefficient traditional kilns form a major threat to the environment through deforestation that has led to destruction and depletion of forest resources. This in turn contributes to greenhouses gases (GHGs) emissions that results in climate change in the long run. The true value of Kenya s biomass is not captured in the national economic statistics, yet the demand for charcoal is drastically increasing as a result of population growth, urbanization and industrialization. This poses a great challenge to the forest sector even though the Forest Act (2005) and Charcoal Regulations (2009) has legalized sustainable charcoal production due to low or non-compliance. Thus, immediate mitigation actions as proposed in this charcoal NAMA are very critical. The aim of developing a NAMA on Kenya s charcoal value chain (CVC) is to trigger a low-carbon development, to minimize the impact of the current charcoal value chain, while acting on causes of deforestation and improve the energy independence of the country. Other sustainable development cobenefits from the NAMA-related interventions are highlighted. The scope of the NAMA is the national level but require a very strong involvement of the County government, forestry and charcoal management being devolved functions, and since implementation of the NAMA will have important impacts at the county or local level. The NAMA is focused on two main objectives: Objective 1: To ensure sustainable sourcing of biomass for charcoal production Objective 2: To implement efficient production of charcoal The two objectives are linked to three distinct interventions. Intervention 1 and 2 will help in achieving Objective 1 and 2 respectively, while Intervention 3 will ensure achievement of both, Objective 1 & 2. Intervention-1: Ensure sustainable supply of biomass for charcoal production: if Intervention-1 of this NAMA is fully implemented, the emissions from deforestation linked to charcoal production are projected to reduce by up to 75% (3.9 MtCO2eq) per year by 2030; Intervention-2: Implement efficient charcoal production technologies: the emission reduction target for this intervention is to reduce the BAU emissions by 90% (1.08 MtCO2eq) per year by 2030; Intervention-3: Establish a charcoal certification and labelling scheme. The financial resources for the NAMA implementation are estimated at 77,327,592 US Dollars. The financial requirements for each of the three interventions are also determined. These include international grants for 5
139 developing policy, resources for enforcement (Int1 and Int3), implementation of a revolving loan fund (Int1 and Int2), and support for development or enabling regulations, enforcement, and other activities linked to national fiscal reform (Int3). An MRV framework for assessing the progress and impacts of the NAMA is developed together with a plan for funding of the measures. The NAMA implementation will involve a vast range of stakeholders including those responsible for regulation and enforcement, those involved in research and development, those directly involved in the CVC as well as end users. Counties are important as emerging institutions that are involved in policy formulation and project implementation. The civil society will play a crucial role throughout the implementation of the NAMA, being the charcoal the main cooking energy in the country. The NAMA implementation will run for a 14-year period from 2017 to The NAMA duration is divided into two phases - the preparatory phase which will run for initial 6-years from 2017 to 2022 and the transformation phase will scale up from 2023 onwards. 6
140 Contents Executive Summary... 5 List of Tables... 9 List of Figures Introduction NAMA an Opportunity for Kenya Purpose and Objective of the NAMA Background of the Sector Current Situation and Trends of the Sector Charcoal in Kenya: an introduction The charcoal value chain and economic analysis Sourcing of biomass for charcoal production Production technologies Domestic use of charcoal Industrial and commercial use of charcoal Environmental and health impact sourcing and production Environmental and health impact trade and consumption Key barriers faced by the sector Relevant Stakeholders Ministries and governmental agencies Research and academic institutions Multilateral institutions and funding agencies Private sector Members of civil society and NGOs Other Sources of Energy Policy Analysis Policy Overview National Policies: Observations and Gaps NAMA Alignment with National and Sectoral Strategies and Policies Baseline Scenario and Targets Baseline Summary Forest Management Charcoal Production (Carbonization) Charcoal Transportation and Retail Charcoal Consumption Baseline Data Gap Analysis GHG Mitigation Targets Intervention-1: Ensure sustainable biomass supply for charcoal production Intervention-2: Implement efficient charcoal production technologies Sustainable Development Baseline and Targets Interventions and Measures NAMA Objectives Intervention-1: Ensure sustainable biomass supply for charcoal production Business models for Intervention Measures for Intervention Intervention-2: Implement efficient charcoal production technologies Business model for Intervention Measures for Intervention Intervention-3: Establish a charcoal certification and labelling scheme Measures for Intervention Common measures Capacity Building Intervention-1: Ensure sustainable biomass supply for charcoal production Training of smallholders on sustainable biomass supply (forestry) Training for medium and large scale supply (forestry)
141 6.2 Intervention-2: Implement efficient charcoal production technologies Training for efficient kiln design, construction and use Intervention 3: Establish a charcoal certification and labelling scheme Formation of Certification and Labelling Working Group (CLWG) Capacity building for implementing agencies and charcoal stakeholders on the certification scheme Training for producers of the ecolabels and packaging NAMA Financial Requirements and Mechanisms Introduction NAMA Financing Overview Financial Requirement for Intervention-1 & Intervention NAMA finance for investment in sustainable woodlots and efficient kilns Financial Requirement for Intervention Certification Capacity building Common measures Operating costs - National Implementing Entity Operating cost of financing facility National Finance Sources NAMA revenue International Finance Sources National and International Finance Financial Requirements for the Interventions NAMA finance for the development of sustainable woodlots and efficient kilns NAMA Implementation Structure Key operation bodies and implementing partners NAMA operational and management system Phased Implementation Plan Implementation schedule Measuring, Reporting & Verification Measurement Emission reductions Sustainable development Support Transformative change Reporting Process and plan for reporting Reporting forms Verification and Evaluation References
142 List of Tables Table 2-1: Annual charcoal potential supply (m3 RWE) in Kenya Table 2-2: Annual charcoal consumption (m 3 RWE) in Kenya Table 2-3: Kenyan cities and the supply of charcoal by adjacent regions Table 2-4: Examples of suitable species for wood fuel in Kenya Table 2-5: Charcoal kiln types and their efficiency Table 2-6: National urban and rural household energy mix (%) in Kenya Table 2-7: Firewood and charcoal consumptions by type of activity in the framework of agricultural industries and cottage industry Table 2-8: Emission factors for wood and charcoal life cycles Table 2-9: Fuel consumption estimates in the household sector for Table 3-1: National policy analysis Table 3-2: NAMA alignment with national and sectoral strategies and policies Table 4-1: Baseline (BAU) scenario summary (MtCO2e) Table 4-2: Kenya s forest tenure categories Table 4-3: BAU emissions from forestry and other land use (MtCO2e) Table 4-4: Total emissions by source (MtCO2e) Table 4-5: Indicators for the SD baseline Table 4-6: Unmonitored SD Indicators Table 4-7: The SD Indicators: Baseline and Targeted Impacts Table 6-1: In house training Trainers of Trainers (TOT) Table 6-2: In house training- biomass producers Table 7-1: Overview of NAMA finance Table 7-2: Criteria for funding under GCF Table 7-3: Sources of finance for NAMA measures Table 7-4: Revolving Loan Fund flow for Woodlots Table 7-5: Revolving Loan Fund flow for Kilns Table 8-1: Gantt scheme of the different phases of the transformation ( ) Table 8-2: NAMA Implementation Schedule List of Figures Figure 2-1: Value chains for charcoal in Kenya Figure 2-2: Example of distribution of benefits from charcoal, produced in Narok and sold in Nairobi Figure 2-3: Regions supplying charcoal to Nairobi Figure 2-4: Stakeholders in the charcoal value chain Figure 4-1: Low-carbon development wedges in the forestry sector (MtCO2e) Figure 4-2: Industrial process emissions in Figure 5-1: Potential areas in which certification criteria and indicators can be applied Figure 8-1: Proposed Charcoal NAMA Implementation Framework Figure 9-1: Components of the MRV Data Management and Reporting System Figure 9-2: The Reporting Process a
143 10
144 1 Introduction This report describes Nationally Appropriate Mitigation Actions for the charcoal sector in Kenya. 1.1 NAMA an Opportunity for Kenya As part of the UNFCCC s Bali Action Plan negotiations which were concluded at CoP 18 in Doha, developing country Parties committed to take Nationally Appropriate Mitigation Actions (NAMAs) in the context of sustainable development. Aimed at reducing greenhouse gas (GHG) emissions relative to business as usual (BAU) emissions at a designated end year, NAMAs can take the form of policies directed at transformational change within a particular economic sector or actions across several sectors. They can either be national level formal submissions and/or individual detailed actions or groups of actions declaring GHG mitigation intention aligned with sustainable national development goals. Kenya has not proposed or submitted any national level NAMA to the UNFCCC but a geothermal NAMA seeking implementation support was submitted in 2014,cf. (UNFCCC, 2015), (Falzon, o.a., 2014). The NAMA largely differs from traditional funding mechanisms because of three key components. Alignment with national development objectives: The interventions under a NAMA framework must be compatible with the host country s policy and development objectives. Focus on sustainable development: The NAMA is designed with sustainable development benefits in mind. The design includes a focus on interventions which allow for income generating activities which can create business opportunities for individuals, households and communities. Facilitate transformative change: The NAMA will spur the development of an environment which facilitates a transformative change in the sector. An enticing regulatory and policy environment which incentivizes the private sector will be created. Initial interventions will catalyze private sector development and the creation of local jobs. The business models associated with the NAMA interventions will be easily replicable across the country. 1.2 Purpose and Objective of the NAMA This sectoral NAMA Report is commissioned by UNDP Kenya with funding from the Joint UN-DFID support to low carbon climate resilient development for poverty reduction in Kenya. The purpose with developing a NAMA on Kenya s charcoal value chain (CVC) is to trigger a low-carbon development, to minimize the impact of the current charcoal value chain, while acting on causes of deforestation and improve the energy independence of the country. At the inception workshop, held at the Sentrim Elementaita Lodge in January 27-30, 2016, it was decided that the NAMA should focus on the two main issues in the value chain: achieving sustainable sourcing of wood for charcoal production, and also achieve efficient production of charcoal. The scope of the NAMA covers both National and County level. The purpose will thus be met with two main specific objectives with the NAMA Objective 1: To develop sustainable sourcing of biomass for charcoal production Objective 2: To establish efficient production of charcoal The objectives of NAMA will be met using two different methods - sustainable smaller and larger scale biomass sourcing and production will be supported by capacity building, incentives and regulation which will enable county level enforcement. In particular, larger scale production and subsequent trade to urban areas will be addressed by introducing a certification scheme, completed with mandatory labelling and packaging for charcoal sold in urban areas. The NAMA is intended to support the transition to a low-carbon development pathway envisaged in Kenya s National Climate Change Strategy (2010) and Action Plan ( ). It will also contribute towards 11
145 realization of the 30% emission reduction target by 2030 outlined in the country s intended nationally determined contribution (INDC). In summary, the scope of the NAMA covers key characteristics of the Kenyan charcoal sector and its current outlook, including linkages with development priorities and relevant policy and planning processes both at National and County level with complementarity. The BAU scenario for the charcoal sector is determined as well as the mitigation measures. The sustainable development co-benefits from the NAMA-related mitigation measures are also provided by nuancing and exploiting the synergies between mitigation, adaptation and general development. An MRV framework for assessing the progress and impacts of the NAMA is developed together with a plan for funding of the measures, including consumer finance. 12
146 2 Background of the Sector 2.1 Current Situation and Trends of the Sector Charcoal in Kenya: an introduction Kenya, with a population of about 45 million, and land area of km², divided in 47 counties under the 2010 constitution, relies on wood fuel for 70% of its energy supply. Charcoal is a relatively cheap source of cooking energy, providing all or part of cooking heat for about 82% of urban and 34% of rural households in Kenya. It is also used in small-scale businesses such as poultry keeping, bakeries, and restaurants. About 2.4 million tons of charcoal was consumed in 2000 and its demand is increasing with population growth and urbanization (CAMCO, 2013). Alternatives such as LPG, kerosene and electricity are used to some extent, while ethanol and methane/biogas are less popular, limitations based on cost and availability. While charcoal has been produced as a fuel for cooking and heat in Kenya for many years, it has been subject to various restrictions and even bans in production and often not captured as part of country economic survey. An analysis of the developing of policy and enforcement is carried out in section 3. Often considered as an industry of the poor, one of the challenges that exists with regards to introducing new technologies into the sector is the need for these to be both affordable as well as offering optimal recovery of the wood fuel that is used (KFS, undated). Given its role in sustaining perhaps the most basic need of mankind, changes in policy which affect the availability of charcoal must be carried out in a way that guarantees continued supply on a national level. The charcoal value chain (CVC) in Kenya starts where the tree grows and the wood is cut and ends with its consumption, and includes all economic activities undertaken between these stages. Many different stakeholders participate in the value chain; starting with forestry and logging, carbonization of the wood, packaging and transportation of the charcoal, retailing and distribution, and consumption. Challenges to the production and use of charcoal include: Deforestation the national wood cover is about 6% (3.47 million ha) of the total land area (FAO, 2010) and deforestation continues at an alarming rate, in part due to charcoal production. Charcoal is estimated (Gichuki, 2015) to be produced in an unsustainable manner. Sustainable charcoal can instead be a driver for sustainable (regulated and enforced) forestry and sustainable (regulated and enforced) production; Unregulated commercial activities reduces fiscal revenue and provides resources for (other) criminal activities; and Burning of charcoal for indoors cooking without proper ventilation is a health risk that is responsible for about 2 million deaths globally. Advantages of charcoal production and use as cooking fuel in Kenya include: Most of the charcoal is produced nationally (apart from regulated and unregulated imports from e.g. Tanzania (Standing & Gachanja, 2014), providing employment and income to hundreds of thousands of Kenyans, and constitutes a very important component of the national economy; Given the (future) emergence of sustainable forestry and efficient production, an important and sustainable national industry is possible. According to the Kenya Forestry Research Institute (KEFRI, 2014), identification of viable efficiency options for the charcoal sector is desperately needed, as the combination of unsustainable harvesting of trees for charcoal production, increased charcoal consumption and the use of inefficient traditional kilns, form key threats to tree resources in Kenya The charcoal value chain and economic analysis Charcoal business is executed through different channels which we can call value chains. Different value chains have emerged, e.g. depending on the amount of charcoal involved and the distance between 13

147 production and consumption. (CAMCO, 2013) describes five different value chains from production to consumption. These are presented graphically as the first five chains in the figure beow. 1. Wood producer to charcoal producer to transporter to retailer to consumer; 2. Wood Producer to charcoal producer to transporter to wholesaler to retailer to consumer; 3. Wood Producer to charcoal producer to broker to transporter to broker to wholesaler to retailer to consumer; 4. Producer to consumer: Usually a small-scale producer takes the charcoal directly to the consumer; and 5. Wood producer to charcoal producer to retailer to consumer: wood producer sells trees to charcoal producer. The third value chain highlights the role of the local broker, who knows where there are landowners which want to clear an area of trees, suitable for charcoal production. The second broker in the chain buys the charcoal transported to the urban area and distributes it to a number of retail vendors. For the fourth value chain listed, and for other options as outlined in the final chain illustrated in the table below, the wood is not sourced from a wood producer but by illegal logging. This may reduce the cost of production but increases the risk of deforestation, reduces fiscal revenue and hampers innovation. Figure 2-1: Value chains for charcoal in Kenya Source: adapted from (CAMCO, 2013) and Adkins 1 Charcoal production in Kenya is mainly performed in informal modalities and very little involvement of registered entrepreneurs. In addition, it is diversified in various areas of the country, depending on the vegetation, agricultural, social, and economic context. Engagement in smaller scale charcoal making is often intermittent both from a sourcing and a production perspective, e.g. a landowner who wants to clear his land or people seeking employment in rural areas. The Forest (charcoal) Regulations 2009 mandates the formation of Charcoal Producer Associations (CPAs) to facilitate sustainable charcoal production by its members after being licensed to do so by the Kenya Forest Service (KFS). The CPAs are also charged with ensuring that members implement reforestation conservation plans, develop and implement a Code of Practice for the purposes of self-regulation, and assist KFS in enforcing provisions of the Forest Act 2005 relating to sustainable charcoal production, 1 Personal communication from Bryan Adkins 14
148 transportation and marketing. However, few of all producers are registered, and even the majority of the registered CPAs have yet to receive permits for charcoal production. The industry is largely informal (60%) i.e. outside the Charcoal Producers Associations (CPAs) (CAMCO, 2013). While this is changing since legalization and implementation of the 2009 Charcoal Rules, the rate of change is low due to complications associated with the implementation (CAMCO, 2013). Unregulated sourcing of biomass for charcoal production may cause deforestation and may also contribute to global warming. The trust lands under the control of the local authorities have witnessed massive destruction of forest resources through charcoal burning and other illegal forest activities (GoK, 2013a). Further, in both public and community forests, as well as on private land, trees are cut down and used for both non-commercial and commercial purposes, including charcoal production. This illegal logging is characterized predominantly by small-scale operations like other countries with low forest cover, rather than on an industrial scale as is the case in African countries with large forest like along the equatorial region. The industry creates employment for many people and would provide revenue to the government through issuance of licenses and business permits. Vendors and transporters benefit the most and producers and consumers the least, due to lack of structures, ineffective implementation of laws and policies, and corruption. Revenue sharing is highly skewed toward vendors who control 64%, with producers taking only 24% (CAMCO, 2013). Further, production is mostly through traditional inefficient technologies, wasting 85-91% of the biomass used (CAMCO, 2013). The different scales indicated above suggest that successful mitigation actions must be tailored to fit each type of value chain. For example, initiatives in afforestation projects combined with charcoal making do exist, e.g. in Rarieda District in Siaya County, aiming to supply Kisumu and other urban areas with more sustainable charcoal (Practical Action, 2012) In some group ranches e.g. in Laikipia County, Kilifi County and the Central Rift Valley, charcoal production is part of integrated land use pasture management and effectively works well. While demand can be moderated by adopting more efficient charcoal-burning technologies since several charcoal production technologies exists in the country, the entire CVC needs to be understood and addressed in a holistic manner. Source: (GoK, 2013a) The movement of charcoal requires a Charcoal Movement Permit and is subject to payment of fees to the County government where it originates. The fee is determined independently by each County. A common fee at present (early 2016) is KSh 20 per bag, translated to a flat fee of KSh 1,000 or 2,000 per load. Finally, the transportation of charcoal is subject to significant extra-legal payments (bribes) to police officers at road blocks, regardless of whether the transporter is in possession of a movement permit, certificate of origin provided by CPA, producer s receipt and cess receipt. Cess collection point by County should link with CPA for certificate of origin to remove non-compliance by transporters. Depending on the type of value chain as discussed above, transporters may buy a bag of charcoal from the farmer/producer at KSh depending on the area and species. Prices offered depend on the season. The vendors in Nairobi buy the charcoal from the transporters at a cost of between KSh 750 and 850 in the dry season and KSh 900 and 1,000 in the wet season. They in turn sell the charcoal at a price between KSh 900 and 1,000 in the dry season and KSh 1,000 and 1,200 in the wet season. The price depends on current availability of charcoal and the location of the estate. Bailis (Bailis R., 2005) recorded payments totalling KSh 30,000-34,000 at 15 checkpoints between Narok and Nairobi, representing 26% of the final charcoal retail price. CAMCO (CAMCO, 2013) refers to payments of at least KSh 24,000 per lorry at 16 checkpoints between Bissel and Nairobi s Ngara market. Owen (Owen, 2013) reported bribes totalling KSh 11,000 to transport a load of charcoal to Nairobi in 2012, which added almost KSh 50 to the cost of each bag. An overview of a typical distribution of profits is given in Figure
 From a national economics point of view, the charcoal sector generates an annual market value of over 32 billion KSh (CAMCO, 2013).")
149 Figure 2-2: Example of distribution of benefits from charcoal, produced in Narok and sold in Nairobi Source: (Bailis R., 2011) From a national economics point of view, the charcoal sector generates an annual market value of over 32 billion KSh (CAMCO, 2013). From a fiscal point of view the generated revenue is quite low due to the low compliance of law provisions, but has a major potential if the system could be streamlined and standardized (KFS NRCO, 2013). The sales tax in Kenya is at present 16%. If sales were taxed, the charcoal supply chain would play a very important role in the fiscal economy of the country. New technology, especially larger scale production and more expensive and stationary equipment require finance which is difficult to find for an industry which to a large extent operates illegally, in small scale and in a mobile manner. There is however a large potential in promoting a shift to more efficient links in the value chain. In addition to its importance for cooking, the charcoal value chain has fundamental socio-economic impact in that it provides income and/or employment for a large number of people in the country. The supply chain involves about 2.5 million people in transportation and marketing (SalvaTerra and FoTea, 2015). About 700 thousand charcoal producers are also involved with their respective families. This means that in terms of contribution to livelihood, charcoal has a huge support, which is higher during the dry period when sources of livelihood are limited especially in arid and semi-arid ecosystems Sourcing of biomass for charcoal production Most charcoal in Kenya is produced from fuelwood. Since most charcoal today is produced at around 10-20% efficiency, the amount of fuelwood per ton of charcoal is in the range of 5 to 10 times the final product. In humid productive areas, it is made from by-products accounting for secondary revenue (described below) as well as from whole tree. While in drier ecosystems (ASAL areas) the whole tree is harvested for charcoal production. A very low resolution estimate of the annual potential supply of charcoal from forests and farmlands in Kenya is 7.4 million m 3 RWE whereas current demand is estimated at 16.0 million m 3 RWE in 2014, again using 16
150 very basic arithmetic. This suggests a large accounting gap of circa 8.7 million m 3 RWE per year. This means that with fully supply of 16.0 million m 3 RWE, the total value of charcoal would be over 64 billion, much larger than tea sector. However, this would only be achieved from a highly organized supply chain. It is assumed that the gap in accounting comes mostly from non-renewable wood harvesting in forests and farmlands, plus smaller imported volumes (SalvaTerra and FoTea, 2015) As presented in Table 2-1, trees on farms account for 76% of the potential charcoal supply. Forest plantations be public, community-owned or private, except of course agroforests on farmlands account only for 6% of the potential charcoal supply, whereas natural forests account for 18%. The present situation is subject to constant change and thus a challenge to monitor and describe. Table 2-1: Annual charcoal potential supply (m3 RWE) in Kenya Forest ownership Forest type Charcoal potential Public forests Natural forests 285, Plantations 174,071 Community and private forests Natural forests 1,040,935 Plantations 280,116 % share Trees on farms n/a 5,578,407 76% Total 7,358, % Source: (MEWNR, 2013) Table 2-2: Annual charcoal consumption (m 3 RWE) in Kenya Parameter Value Unit Charcoal consumption per capita m 3 RWE/year Population (2014), divided into 45,545,980 Rural population 34,159,485 Urban population 11,386,495 Rural population using charcoal 34 percent Urban population using charcoal 82 percent Total annual demand 820,237,554 m 3 RWE/year Source: (MEWNR, 2013) Earlier estimates have suggested that 40% of the charcoal produced in Kenya comes from dry forests (GoK, 2002). More recently, it has been estimated that about 75% of the hardwood used for charcoal production is sourced from the drylands (ICRAF/SEI, 2014); of the total charcoal consumption of around two million ton per year, 1.5 million ton are thus produced in dry forests. Sustainable production is estimated at 0.28 m 3 /ha/year in dry forests. The total sustainable production from these forests may therefore be estimated at 745,660 m 3 per year, leading to a fnrb (fraction of non-renewable biomass) equal to 88% (SalvaTerra and FoTea, 2015) The potential for woodlands for the sustainable sourcing of charcoal mainly hinges on the ability of the woody species present to regenerate and grow. Generally, woodland cut for charcoal production would regenerate by coppicing though not all species. Regeneration in areas previously cut usually revert to woodland if there are no other disturbances in the area, therefore the cut area could continue to supply charcoal over a very long time period. A few producers have invested in sustainable plantations for charcoal production, but the quantity of charcoal produced from these sustainable sources is not yet significant. Charcoal is also imported 6% 18%
151 (illegally) from e.g. Tanzania (Standing & Gachanja, 2014) and Somalia, which supplements the deficit. It can be assumed that imported charcoal is not sustainable. Nairobi is the major charcoal market but production for this market mainly takes place in the ASAL areas of Kitui, Kajiado, Narok, Baringo and as far as Lamu and Kwale counties among other arid ecosystems. As an example, the regions supplying Nairobi are demonstrated in Figure 2-3. Figure 2-3: Regions supplying charcoal to Nairobi Source: (Bailis R., 2005) In a similar way, other regions supply charcoal to nearby cities as indicated in Figure 2-3. Table 2-3: Kenyan cities and the supply of charcoal by adjacent regions City/Town Major sourcing regions Nairobi Kitui, Makueni, Tana River, Kwale, Narok, Baringo, Kajiado, Garissa Mombasa Kwale, Tana River, Kilifi Kisumu Elgeyo Marakwet, Turkana, Narok Nakuru Narok, Baringo Eldoret Elgeyo Marakwet, Turkana Kakamega Kakamega, Turkana Bungoma Mt. Elgon, Turkana Nyeri Laikipia, Nyandarua Garissa Garissa environs Embu Tharaka, Kitui Meru Tharaka Source: (CAMCO, 2013) There are initiatives in Kenya for large scale charcoal production. One of them is based at the Kakuzi Ltd in Muranga County, Kenya. Kakuzi for many years had been associated with agricultural products and cattle farming. In 1992, the Company expanded into tree farming to mark boundaries on its large farm, to put areas with poor soils to good use, and to diversify its product line. The company has a total of 3,068 acreage covered by Eucalyptus grandis, Eucalyptus saligna and Eucalyptus camaldulensis. This initiative gained momentum in 1995/96 when much larger areas of forestry were planted. Currently 50 to 75 acres are planted per year on commercially high yielding sites. 18
152 Kakuzi Ltd has developed a wood-processing yard where timber and poles are treated. Timber is milled, pallets manufactured, eco-friendly charcoal produced efficiently using half orange brick kilns from waste off-cuts and smaller gauge logs left over from the forestry s division s main line of business production of industrial timber and poles. Source: (Practical Action, 2012) Generally, all species of wood can be carbonized to produce charcoal. However, the quality of charcoal depends on the species and also depends on the method of carbonization. These species should: Grow quickly; Yield a high volume of wood quickly; Require minimum management time; Coppice or sprout well from shoots; Have dense wood with a low moisture content; Produce little and nontoxic smoke; Produce wood that splits easily and can easily be transported; Yield other products or services that are demanded by the household; and Produce wood that does not spit or spark when burning. Species that have been reported to produce high quality charcoal include Casuarina equisetifolia, Acacia mearnsii, Acacia polyacantha, and Acacia xanthophloea, and other acacia and combretum species (Mugo, F. and C. Ong, 2006). These species are preferred mostly because of their high densities; the charcoal produced is heavy in weight, burns for a long time in the cook stoves and thus is economical to the user. Other tree species that have been cultivated for charcoal in short rotations are Eucalyptus camaldulensis, Leuceana leucocephala, Tectona grandis, Acacia spectabilis and Sesbania sesban (Mugo, F. and C. Ong, 2006). Studies in India, for example have shown that Eucalyptus species and Acacia nilotica can be cultivated in short rotations for charcoal (Mugo, F. and C. Ong, 2006). Some of the suitable species in Kenya are indicated in the table below. Table 2-4: Examples of suitable species for wood fuel in Kenya 1. Acacia brevispica 2. Afzelia quanzensis 3. Commiphora schimperi 4. Acacia bussei 5. Albizia amara 6. Croton dichogamus 7. Acacia drepanolobium 8. Albizia anthelmintica 9. Dalbergia melanoxylon 10. Acacia gerardii 11. Balanites aegyptiaca 12. Euclea divinorum 13. Acacia hockii 14. Barleria spinisepala 15. Grewia bicolor 16. Acacia lahai 17. Bauhinia taitensis 18. Grewia plagiophylla 19. Acacia mellifera 20. Boscia angustifolia 21. Grewia similis 22. Acacia nilotica 23. Combretum apiculata 24. Grewia vilosa 25. Acacia nubica 26. Combretum brownie 27. Maytenus spp 28. Acacia reficiens 29. Combretum constrictum 30. Olea europaeavar. africana 31. Acacia Senegal 32. Combretum hereroensii 33. Tarchonanthus camphoratus 34. Acacia seyal 35. Combretum molle 36. Terminalia brownii 37. Acacia tortilis 38. Commiphora africana 39. Acacia xanthophloea 40. Terminalia spinosa Source: (Practical Action, 2012) 19
153 In addition to this list of predominantly dryland species, the use of invasive species Prosopis spp are now being promoted by the Kenya Forest Service as a source of charcoal and wood fuel in order to manage their spread in Areas like Baringo County, where it is a problem degrading rangelands 2. In addition to wood, Kenya has seen successful implementation of coffee husks as source for charcoal making. An example is the Dandora Charcoal Plant which was established by the Kenya Planters Co-operative Union to produce charcoal briquettes from coffee husks. Batch carbonisation of coffee husk is carried out in pit kilns to obtain charcoal dust. Maize starch is used as binder of briquetting the charcoal dust. The mass conversion efficiency of the kiln was 33%. The charcoal produced had a fixed carbon content of about 70% and a volatile matter content of about 10%. Other biomass, also with lower calorific value, is possible to use, both neat and in blends With collapse of coffee sector the production has been seriously reduced and now operates with very low capacity. Source: (Mugo & Gathui, 2010) Production technologies Producing charcoal technically consists of carbonization of wood and other woody biomass by pyrolysis, i.e. combustion with reduced access to oxygen. During pyrolysis, biomass undergoes a sequence of changes and normally yields a black carbonaceous solid, called charcoal, along with a mixture of gases and vapours. Generally, charcoal production through pyrolysis is maximized in a process of low temperatures and slow heating rates, so-called carbonization. The need for heat to support the process can be reduced if the hot gases are recycled to heat the carbonizing material Charcoal production methods generally fall into three broad categories: Earth kilns, Masonry kilns, and Metal kilns. Artisanal charcoal production dominates and employs traditional earth kilns. Those traditional kilns have a very low recovery rate (estimated at 16% according to (MEWNR, 2013) but can be as low as 10% (SalvaTerra, 2015). This is due to the fact that to fuel the process some of the timber meant for charcoal is also burnt to ashes. Local producers often lack the skills, raw material and investment capacities to switch towards more efficient technologies. There are several factors which affects the choice of kiln for a producer: Production cost; Transportability; Flexibility in production size; Operational cost; and Efficiency. The Kenya Forestry Research Institute (KEFRI) has tested a number of kilns for efficiency and facility of construction and operation. Their report lists the following: 20
154 Table 2-5: Charcoal kiln types and their efficiency Technology Brief description Investment cost Efficiency [%] (est.) Traditional Wood is stacked and greens and then soil covers the wood pile. Improved Same as above, but with a wire mesh traditional over the fire and chimneys Casamance Same as above, but with more elaborate sorting of wood KEFRI Drum An oil drum with a welded stove box, a chimney and a grill for wood. Domestic production Kinyanjui Drum with combined lighting and type chimney in lid. Small twigs used no felling of trees. Meko retort Drum kiln where volatile gases are recycled to heat wood. Elaborate design and operation. Less methane emissions Portable Imported, transportable metal tin with metal kiln frame Ring kiln Larger round metal kiln with chimneys with controllable air flow. Half orange 4-5 bags of charcoal for small model brick kiln not easily reparable Dome brick, square brick Source: (KFS, undated) Larger dome or square design for bags, only square type reparable Very low low low Medium requires welding and metal Medium requires welding and metal High precision welding (less heat wood needed) Expensive imported as Around 30 finished product Very expensive (75000) >30 Low to medium Around 50 Expensive but cheap per sack High As presented in the table, 100 kg of firewood will result in between 10 and 50 kg of charcoal depending on kiln design. Since production is often intermittent and the firewood used often is freely or very cheaply available, there is little incentive for the producer to aim for efficient production. From a conservation perspective as well as for mitigation of GHG emissions, efficient production is however essential. From the list above, and again drawing from the intermittent nature of sourcing of biomass for charcoal production, the intersection between transportability of the kiln and efficiency suggest that metal retort kilns would be preferable. All regulation and incentives should however be based on efficiency and not on choice of technology. The reason a given kiln design is chosen may be based on kiln production cost, simplicity of operation, transportability, and affordability of the kiln Domestic use of charcoal Charcoal plays an important part in the Kenyan household. According to Nyang (1999), charcoal is part of most households, but is complemented by other energy carriers as described in the table below 3. Data in the table is at least 15 years old, but the categories likely prevail with different weight to the different combinations. 21
155 Table 2-6: National urban and rural household energy mix (%) in Kenya 4 Fuel type % in energy mix Kerosene + firewood 35.1 Kerosene + firewood + charcoal 30.6 Kerosene + charcoal 9.9 Electricity + Kerosene + Charcoal 8.2 Electricity + kerosene + Charcoal + LPG 3.4 Firewood only 2.4 (Source: Nyang, 1999) Combustion of charcoal in urban areas at household level is highly inefficient, despite important efforts to disseminate improved cook stoves since the 1980s (SalvaTerra and FoTea, 2015). The use of these ICS is often low since their design does not necessarily meet the sociological needs at home such as warming in rural areas and socializing around the fire. Less used alternatives include LPG, kerosene and electricity. The main reasons for the popularity of charcoal versus the alternatives are the low cost of the fuel, and the low investment for use. The price of LPG in Kenya is among the highest in the world (Dalberg, 2013). Accelerated adoption of LPG is one of the six national strategies for reduced carbon emissions in the NCCAP. Biomass fuels are used alongside modern fuels without displacing them, which suggests fuel stacking as opposed to fuel switching, in both rural and urban households. Any reduction in urban demand for charcoal would thus require an upturn for one of the alternative sources of cooking heat, given that the demand is strongly related to population. Among other fuels or energy carriers, ethanol is one option, which according to Project Gaia has the potential to supply 156, 000 households with fuel from national production 5. Ethanol is at present not a viable alternative since all alcohol sold in the country is taxed as beverage alcohol. According to (SalvaTerra and FoTea, 2015) the key technology available for improving the efficiency of consumption of firewood and charcoal are improved cookstoves (ICS), which are stoves that have been modified to use less fuel, cook faster and reduce smoke. For example, a traditional metal charcoal stove can be improved by adding clay as insulating material which helps conserve heat and save fuel while cooking. ICS have been developed for use with either firewood or charcoal, or even biomass briquettes. According to sources, modern stoves can save up to 70% of fuelwood in comparison to open fires. This is further discussed in NAMAs dealing with household energy use Industrial and commercial use of charcoal The largest non-consumer use of charcoal is at the small commercial level, implying that consumption is mainly in small units by a large number of users. Table 2-7 presents the consumptions in agricultural industries and in the so-called cottage industries split between firewood and charcoal. Brick making is not included in this listing. 4 The table omits 12 additional combinations each used by less than 2% of the population. 5 Projectgaia.com/projects/kenya 22
156 Table 2-7: Firewood and charcoal consumptions by type of activity in the framework of agricultural industries and cottage industry Biomass Demand Qty of fuelwood in ton/year Qty of charcoal in ton/year Qty of charcoal in (RWE ton/year) Total biomass consumption (RWE ton/year) Tobacco farmers 140, ,000 Tea industry 800, ,000 Restaurant/Kiosks 1,276, ,025 1,945,568 3,221,568 Bakeries 20, ,827 22,827 Agri-food industries (jaggary, milk, fish, etc.) 223,000 2, ,455 Total agroindustry and cottage industry Source: (SalvaTerra and FoTea, 2015) 2,459, ,647 1,950,850 4,409,850 Energy supply and demand vary by region, district, village, and by household classes within a village or city. For the customer, charcoal has a number of advantages which has fostered its success especially for cooking in urban areas (Practical Action, 2012) and it has high consumption in restaurants and food kiosks as indicated in the table above, due to the following aspects: Charcoal has a higher calorific value per unit weight than firewood (about 31.8 MJ/kg of completely carbonized charcoal with about 5% moisture content as compared to about 16 MJ/ kg of firewood with about 15% moisture content on dry basis). It is therefore more economical to transport charcoal over longer distances as compared to firewood. Storage of charcoal also takes less room as compared to firewood; Charcoal is not liable to deterioration by insects and fungi which attack firewood; Charcoal is almost smokeless and sulphur free, as such it is ideal fuel for towns and cities; In most cities charcoal is cheaper than kerosene, LPG or electricity for use in homes, restaurants and kiosks; and The current prices of wood and charcoal favour the use of charcoal by urban consumers. In fact, in terms of useful energy, the charcoal calorie is cheaper than wood calorie Environmental and health impact sourcing and production The environmental consequences of charcoal sourcing production include deforestation, forest degradation, GHG emissions and local emissions from kilns. Deforestation and forest degradation have vast impact on the environment. If selective cutting is practiced, the forest is degraded but not lost, whereas clear-cut forests will take longer time to regenerate, but typically yield faster economic profits for the exploiter. The amount of years for a forest to regenerate after partial or total clearing varies between forest types and climate. The clearing of forests also affects the use of timber for other uses, as well as the production and use of non-wood products such as bush meat, honey, bees wax, fruits, tubers and other secondary products that contribute to well-being and economic growth. Negative impact may be reduced if harvesting of branches is encouraged as opposed to felling the whole tree. Charcoal production also affects climate change through emissions of greenhouse gases such as carbon dioxide, carbon monoxide and methane. Table 2-8 shows the emission factors for Tarchonanthus camphoratus in a life cycle perspective (from sourcing to consumption), expressed in ton C per ton fuel. 23
157 The lifecycle GHG emissions as defined are thus high if the land where the trees for charcoal making are felled is cleared (and then used) for agriculture, and low (in some cases negative) if trees are produced through sustainable forestry for regrowth or coppice. Instruments to promote sustainable charcoal (e.g. incentives and certification procedure) should thus take land use change into account. Table 2-8: Emission factors for wood and charcoal life cycles Source: (Bailis R., 2005) By the same token, and somewhat counter-intuitively, efficient charcoal production using non-renewable wood would entail higher GHG emissions according to definitions since the combustion of non-renewable based charcoal is designated with a fixed emission per ton of charcoal regardless of production efficiency (UNFCCC, 2006). Most charcoal production in Kenya is at present carried out informally, in traditional earth kilns with only between 10-20% efficiency. This leads to wastage of wood and higher GHG emissions (Njenga M. K., 2013a) and means there is a high potential for GHG emission reduction from promotion and use of improved kilns Environmental and health impact trade and consumption The environmental impact from trade is limited to emissions from trucks and inhalation of charcoal dust by transporters and retailers. Household air pollution (HAP) from charcoal use affects health where charcoal is the dominant cooking fuel and flue gases are not properly vented out. The toxic content of smoke from charcoal for urban use has overlap with the known toxicity of traffic, industrial, and tobacco smoke. In most cultures, women have a leading role in domestic cooking, with men cooking when at work or away from home. In the typical domestic context, therefore, women have several periods of intense cooking smoke exposure per day. Young children and infants, typically carried on the back or placed near their mother to sleep, are also exposed to these acute very high levels, exposures to smoke. Sub-Saharan Africa, Kenya included, has among the highest mortality rates in the world ( per million) from indoor air pollution (Gordon et al., 2014). Young children exposed to charcoal smoke ran significantly higher risk of acquiring 24
158 acute lower respiratory infection (ALRI) (Bautista et al., 2009). Combustion of charcoal from non-renewable biomass also entails GHG emissions which affects climate change Key barriers faced by the sector The fight against unsustainable charcoal production and use has a number of barriers such as lack of costeffective alternatives to charcoal for cooking and inadequate enforcement for forestry regulation (Owen, 2013). Other barriers include: Land tenure, which makes it difficult to create sustainable forestry for charcoal making especially in communal land; which encourages exploitation without conservation; Challenges in regeneration and re-vegetation of dry lands/woodlands; Overlapping responsibilities among ministries across the charcoal value chain complicates its management and regulation; Lack of awareness and protection of rights afforded by charcoal production and trade; this includes local administrators who have inadequate knowledge on new charcoal regulation Permits give leeway for corruption, particularly in transportation; Cross border influence - Kenya should work with government of Tanzania Inter-county conflict need for harmonization labelling, transportation, use of county codes Inadequate water harvesting structures for seedlings promotion necessary in afforestation Presence of cultural aspect of lack of cultural for tree planting for charcoal especially in arid and semi-arid ecosystem CPA have major leadership and governance issue that need to be addressed in transformation of charcoal sector Inevitably cases where movement permits are abuse and transporters knowingly move charcoal illegally, having determined that the cost of corruption is lower than the cost of compliance; Weak CPA and low awareness of charcoal regulation, need for county support Compliance is effectively impossible at present due to the overlapping EMCA and KFS rules and the bureaucracy around acquiring movement permits; Most charcoal producers use inefficient traditional earth kilns, wasting 85-91% biomass; Farmers do not prioritize sustainable production of wood for charcoal due to low economic profits and non-compatible technologies in the absence of an enabling policy environment; Uncertainty over the rules and confusion over what is expected of private landowners wishing to produce and transport charcoal. Few know of the regulations and those who do are discouraged from applying due to a lack of clarity and the burdensome nature of compliance; Landowners produce charcoal as a peripheral enterprise thus the costs of compliance are disproportionate. The 2009 regulations were designed for full-time producers of charcoal and are a poor match for occasional producers, shift to other alternative land use in wet season. Landowners cannot justify the time-consuming acquisition of licences for a marginal activity that takes place irregularly. The complexity of the regulations is also at odds with the strong vested interest that landowners have in managing their resources sustainably. They are unlikely to behave irresponsibly and need not be loosely controlled through such a demanding set of rules. Law enforcement by police and ward administrators remain a big loophole that need to be filled Charcoal production associated with people who are uneducated, does not require skill One possible means of mitigating deforestation from charcoal production is the development of sustainable tree production, including development of new species, which withstand climate change and water shortages. Such efforts are affected by various barriers and constraints. Land tenure for private land, trust land or state owned land may affect the production system if any conflicts in land ownership occur during the tree growing cycle. The Forests Act of 2005 prescribes proper management plans requiring every forest to have a management plan, but lack of proper planning or implementation of the plan can affect sustainable feedstock management. The arid and semi-arid areas of Kenya where the majority of charcoal is produced are water deficient environments that experience challenges in vegetation growth and tree regeneration, which may hamper improvement although better management would be in place. 25
, traders/middle mean and vendors across the value chain (Figure 2-4).")
.")
159 2.2 Relevant Stakeholders It is estimated that the charcoal sector supports the livelihoods of million Kenyans directly and indirectly, creating employment for million as producers (farmers and burners), traders/middle mean and vendors across the value chain (Figure 2-4). Other stakeholders include those responsible for regulation and enforcement (KFS, Police), those involved in research and development (R&D) (KeFRI and Universities) and those responsible for policy (Ministry of Health, Agriculture, Livestock and fisheries and Environment, Water and Natural resources as well as county authorities). Counties are important as emerging institutions that are involved in policy formulation and project implementation. Figure 2-4: Stakeholders in the charcoal value chain Source: adapted from (ICRAF/SEI, 2014) Functionally, the CVC involves forest management, charcoal production (carbonization), transportation, retail (vending), consumption and all intervening economic activities (GoK, 2012) (Basu, Blodgett, Müller, & Soezer, 2013). Regulatory and law enforcement agencies, financial service providers, communication enterprises, and research institutions are also integral stakeholders along the value chain. The CVC can thus be distinguished into a supply side (forest management and charcoal production), intermediate (transport and retail), and demand side (consumers/end-users). The following key stakeholders are explicitly identified in the Forest (Charcoal) Rules 2009: i) Kenya Forest Service (KFS) charged with enforcing provisions of the Forest Act. 2005, ii) Charcoal Producers Associations (CPAs) who facilitate sustainable charcoal production by its members, iii) charcoal transporters who must have valid charcoal movement permits, iv) charcoal traders who should keep a record of charcoal sources and movement and/or have import/export permits, and v) end-users or consumers (households, small businesses, institutions etc.). Some specific details are analysed below Ministries and governmental agencies Relevant public organizations fall into two categories; the legal framework developers (Ministry of Environment, water and natural resources, Ministry of Agriculture, livestock and fisheries, Ministry of Mining), that formulate legal framework for the environment/energy sector and the national agencies (Kenya Forest Service, Kenya Wildlife Service) which are involved in implementation of legislations and enforcement of regulations including charcoal rules. The Kenya Forest Service is specifically mandated to issue permits and inspect transportation and records along the value chain. 26
160 2.2.2 Research and academic institutions Research and Academic institutions with a focus on charcoal, forestry, energy and related areas exist both in Kenya and internationally. Charcoal sector issues cut across academic institutions like universities which undertake broad research themes including energy issues, and have activities that contribute to legal framework development like Centre for Advanced Studies in Environmental Law & Policy (CASELAP) at the University of Nairobi and Wangari Maathai Institute. In addition, there are research institutions with very specific mandate like Kenya Forest Research Institute (KeFRI) that undertakes forest related research, agricultural and livestock - Kenya Agricultural and Livestock Research Organisation (Karlo). These institutions are mainly involved in research, information generation and dissemination Multilateral institutions and funding agencies Multilateral institutions and funding agencies working in the charcoal sector include a wide range of organization from specifically donor ones like the World Bank, various national embassies to research institutions like the World Agroforestry Centre (ICRAF), the World conservation Union (IUCN), to UN ones like UNDP, FAO, UNEP, UNESCO that have activities that are either in energy sector or overlap with energy sector. The Global LPG Partnership 6 was set up as a High Impact Initiative (HII) under the SE4All High Impact Opportunity (HIO) Universal Adoption of Clean Cooking Solutions. Its main role is to accelerate a transition to LPG for cooking by engaging public and private sectors in holistic policy, investment and end-user engagement. A total of 750 million USD would be made available for implementation of GLPGP in Ghana, Cameroon, Kenya, Uganda and Tanzania which would ultimately lead to 70 million people gaining access to LPG for cooking and that 2% of Africa's biomass will be offset Private sector Charcoal is in Kenya produced, traded and transported by the private sector. Producers have been required to form Charcoal Production Associations since the introduction of the Charcoal (Forest) Rules of A large number of private landowners producing charcoal in Kenya have a common desire for light regulation and business-friendly policy (Owen, 2013). However, many are not dedicated charcoal producers. For smaller scale production, charcoal biomass is sourced and charcoal produced as a subsidiary output of other core businesses that include arable farming, livestock rearing, forestry or a combination. Therefore, apart from the fact that charcoal may be produced from time to time as a by-product of tree felling or pruning for other purposes, a coherent shared interest around charcoal with common advocacy objectives is lacking. For some, the issue of charcoal is simply not significant enough to justify the effort and expense of forming and sustaining a stand-alone charcoal industry association. Similar observations were experienced by the Kenya Forests Working Group, which tried to start a charcoal association in 2000s and failed due to lack of interest before the charcoal rules 2009 were crafted Members of civil society and NGOs Several Kenyan environmental NGOs such as the Green Belt Movement, Green Africa Foundation, the Kenya Forest Working Group, the Forest Action Network, the East African Wildlife Society, the International Union for the Conservation of Nature (IUCN) and the World Wide Fund For Nature (WWF), exist at both local and international levels with energy related activities including the charcoal value chain. These organizations are concerned with either policy formulation through advocacy and facilitating the process, reaching out to other stakeholders including community. NGOs, unlike some government institutions, have flexibility in terms of running their programmes and can easily adapt to demands such as responding to gathering information of charcoal production in forested ecosystems, or highlighting new technologies. For example, Kenya Forest Working Group monitors forest activities and responds quickly to gathering 6 For more information, see: 27
161 information on issues like charcoal production and linking information to the media. In the country they have been influential in championing the charcoal agenda in the country. 2.3 Other Sources of Energy There are five main sources of energy in Kenya. These are wood fuel, petroleum, geothermal power and hydropower electricity, of which biomass accounting for 70 per cent, (GVEP, 2010) Renewable energy is also becoming important although it remains insignificant in the country s overall energy mix. This section provides an overview of household energy usage in Kenya. Table 2-9 presents estimates of consumption of various fuels in Kenya during Table 2-9: Fuel consumption estimates in the household sector for 2004 Fuel type Quantity Firewood 14,600,000 ton Agricultural Residues 4,940,000 ton Charcoal Consumption 1,600,000 ton Kerosene 305,825,000 litre LPG 41,884 ton Based on information available there are several alternatives to charcoal in terms of energy. One of these and closely related is the charcoal briquettes, which are made by mixing charcoal dust with water and a binding agent such as soil, paper or starch. In spite of the briquettes being made from charcoal cost, they are cheaper almost nine times than charcoal, with a small amount being adequate for cooking and 15 times cheaper than cooking with kerosene in terms of cost (Njenga, o.a., 2013b). In terms of calorific value briquettes compare well with charcoal varying from those using printing paper as a binder producing kilojoules of energy per gram (KJ/g), soil as a binder produced 25 KJ/g, later compares well with charcoal s 25 KJ/g (Njenga, o.a., 2013b). It also contributes highly to livelihood as it is made by low income earners in the society especially urban poor. However, there are no statistics for briquette use in Kenya, however the percentage of the population using briquettes is thought to be very low (GVEP, 2010) Other alternative to charcoal is fuelwood, which in 2002 had an estimated demand in the country of 35 million tons per year against a supply of 15 million tons per year, representing a deficit of 20 million tons. The massive deficit in fuelwood supply has led to high rates of deforestation in both exotic and indigenous vegetation resulting to adverse environmental effects such as desertification, land degradation, droughts and famine among others. According to ( Practical Action, 2010) fuelwood supplied 89% of rural energy with a per capita annual consumption of 741 kg and 7% urban household energy with a per capita annual consumption of 691 kg. Compared to charcoal 82% of urban household use charcoal with a per capita annual consumption of 152 kg, while for rural households, it contributed 34% with a per capita consumption of 156 kg. Farm residues comprise a broad range of vegetative materials generated from diverse agricultural operations and processes, which are used by 21% of household ( Practical Action, 2010). Dung and crop residue are the dominant by-products from primary agricultural production, which are occasionally used as domestic fuel. They consist of non-woody residues and woody residues. Non-woody residues comprise leaves, stalks, cobs etc. which are lighter, burn fast and have low heat content while wood residues are normally derived from mature prunings, thinnings, woody weeds, etc. which burn slowly and have a comparably high heat energy content to ordinary fuelwood. The overall per capita annual crop residue consumption in the rural areas is 435 kg (1,998 kg per household). For urban households, consumption is about 351 kg/person per year which is approximately 1,373 kg. Electricity from crop residue among corporate players is proving to be popular feedstock to fire steam boilers within sugar and rice milling installations. The already successful carbonization and packaging of coffee husks into commercial charcoal and generation of grid-scale electricity from bagasse shows that farm 28
162 residues have commercial value especially where economies of scale are possible. Nationally, about 2% of households use animal dung for energy along with other energy sources. Animal dung particularly cow dung are used only in cases of very acute fuelwood scarcity since their value as farm manure for soil fertility improvement is highly appreciated by farmers. The Ministry of Energy in collaboration with interested investors should facilitate development of appropriate technology to tap energy from other available wastes including organic garbage and sewerage from urban areas. Wood waste includes timber off-cuts and wood rejects, wood shavings and saw dust from wood used in construction and other industrial purposes. The wood by-product is often used at the factory for steam generation and where it is not used on site, households may collect it free or purchase it at a small fee. The national percentage of households using wood waste is low at 2.5% with higher use being in urban areas at 3.7% as compared to rural areas at 2.1%. This indicates a drop in use of wood wastes from 5.1% in This is because wood waste has become scarcer and considerably more expensive for most people. Major uses for wood waste are cooking (96%), water heating (60%), lighting (8%), home business (6%) and other industrial purposes with the most common type of wood waste being off-cuts (64%) and sawdust/shavings (34%). Across agro-ecological zones, consumption is highest in the medium zone (3%) followed by the high zone (2.7%) while the low agro-ecological potential zone has the least (0.2%). This is possibly a reflection of availability i.e. more tree plantations and sawmills occur in the environments with higher production potential. Biogas is a clean-burning methane-rich gas produced through anaerobic digestion (bacterial action in the absence of air) of organic feed stocks (crop residues, animal dung). In countries where suitable feed stocks are available and abundant, small family-sized biogas digesters have been introduced. In India, for example, by 1998, 2.8 million units had been installed. The Kenya Domestic Biogas has constructed over 1,100 plants in Kenya (KENDBIP, 2016). Most of the units were constructed under the Ministry of Energy s Special Energy Programme sponsored by GTZ. Most biogas systems found in Kenya are between 4-16 cubic metres. Three cubic metres of gas is considered sufficient to meet the cooking and lighting needs of a family of 5 persons in Kenya. The per capita daily consumption of biogas is 0.6 cubic metres, which translates to an annual per capita consumption of 219 cubic metres of biogas. Uptake of biogas technology in Kenya has remained very low due to high capital costs for not only the plant, but also for the modified burners and lighting units. Inadequate Kerosene as a cooking and lighting fuel is important in rural and urban areas and in some cases serves as a complete substitute for biomass fuel. The government has used either a reduction or non-increase in tax for kerosene to increase its uptake, primarily as a poverty mitigation measure. The growing use of kerosene is in part attributable to convenience and competitive pricing especially as charcoal prices rise. The price of kerosene during the study was observed to vary between KES 54 (US$ 0.71) per litre and KES 68 (US$ 0.89) depending on location. Dealers include filling stations, independent pumps and kiosks LPG The use of LPG for cooking continues has grown steadily in both rural and urban markets. Kenya had fewer than 50,000 household LPG cylinders in use in 1995, confined to a few key urban areas. By 2002, over 700,000 cylinders were in use, particularly in urban areas of the country. Studies in India have shown that there is a shift from biomass fuel to kerosene and liquid petroleum gas (LPG) by mid income urban households, and to LPG and electricity by higher income urban households. LPG remains out of reach of most of the Kenyan population due to tariffs and duties and the high up-front cost of filling a bottle (which can last over a month). There is 18 per cent VAT and import duty on LPG, and 18 per cent VAT on cylinders and appliances Much more recently starting around 2011, bio-ethanol gel has increasingly been used as an alternative biofuel developed by Consumer's Choice Limited to reduce Kenya s reliance on imported petroleum (Business Daily Africa, 2011). The bio-ethanol gel is made from molasses derived from sugarcane as a byproduct. The molasses is used to develop technical alcohol, which is the chief ingredient of the bio-ethanol gel. The gel is used with jiko known as Jiko Poa and is fast picking in urban area especially in low income areas. The technology is said to reduce carbon dioxide emissions by up to 50 per cent when compared to firewood and charcoal. 29
163 30
164 3 Policy Analysis 3.1 Policy Overview Prior to enactment of Forest Act 2005 (FA2005) now under revision, Kenya forest sector did not recognize charcoal as a legal forest product in spite of the high utilization by the citizens, this constrained any development of the sector and encouraged thriving of illegal production. Again, there was no provision of stakeholders involvement in forest matters including charcoal production. The FA2005 provided for development of charcoal rules 2009 (legal notice 186 of 2009) and revised 2012, which provided for the start of organized sourcing of charcoal production biomass and licensing of the dealers. The rules had good provisions for regulation and penalties, although one major weakness was that they were formulated for fulltime charcoal producer, which is not the case in most producers. At the same time, enforcement of these rules has remained weak. Some of the gaps that have been identified (relevant to biomass supply) with the current rules and which are being addressed through the review process include: Application from private landowners that were not explicitly catered for; Responsibilities of charcoal producer association not well defined; Need to continuously update species that are endangered and threatened and expected from charcoal production; Lack of clear direction of Environmental Impact Assessment (EIA) for charcoal production; and No clear provision for harvesting techniques for commercial charcoal production Production of adequate biomass and in a sustainable way would be greatly assisted by effective forestry extension service characterized by the mode of travel and visit (TV) as opposed to demand driven service so that the potential biomass suppliers can be supported. The current constitution that provides for 10% tree cover along with recently enacted legislations like Kenya constitution, Land act 2012, National Energy Policy and Energy Act 2006, National Climate Change Action Plan (NCCAP), and Agricultural 2012 and Land policy 2009 provide good provision for increased biomass supply. The production and movement of charcoal in Kenya is subject to the 2009 Forest (Charcoal) Regulations also under review. While the regulations are a significant improvement on the unrealistic charcoal bans that have been periodically imposed, the regulations have yet to yield sustainable production and no production permits have yet been issued (Owen, 2013). The regulations lack an application track for individual land owners, they contain a number of unclear provisions and are built around a highly centralized application approval process. Few producers have applied for permits and there is uncertainty how applications should be handled within KFS. In the meantime, the Environmental Management and Coordination Act (GoK, 2015b) under review is providing a workable legal framework for charcoal production on private land and empowers County Environment Committees (CECs) to process applications from landowners to make charcoal. It is a de-centralized and relatively efficient system that draws on the technical expertise and local knowledge of a cross-section of government departments to some extent. There is nevertheless a need for greater clarity on the preferred format for applications via CECs and the scale or nature of charcoal production for which a stipulated requirement for an Environmental Impact Assessment may be waived. Absence of clarity provide greater driver for illegal and underground production and trade of charcoal. While the movement of produced charcoal since 2009 requires a permit, often the traders circumvent this by transporting in small quantities but with a fleet of bicycles or donkeys, which is construed to mean domestic consumption, which is permitted. Recent changes in legal framework particularly Energy and Forestry Policies and Acts have moved to regulate sustainable charcoal production, and trade, with implementation under way with KFS having pilots in Kitui area. Charcoal production and transportation is subject to law authorizations since Marketing of charcoal and transportation of more than five bags of charcoal require a permit license to be acquired from KFS. The Traffic Act outlines the laws that need to be observed during transportation of charcoal and verification of charcoal movement permits. 31
165 Charcoal retailers are required by the county Governments to apply for business permits that allow them to sell charcoal to the far end consumers, which are obtained from the local authority like any other business. Under the Charcoal Rules (2009) a person engaged in wholesale or retail trade in charcoal is expected to keep a record of the sources of charcoal, and copies of relevant certificates. For charcoal imports and exports, the customs authorities provide import/export permits. At the moment apart from Kitui that has County charcoal legislation, the other counties are in the process of developing charcoal legislation in accordance with the 2009 charcoal rules. However, excessively complicated procedures, different interpretations of procedures, competences overlapping and lack of mandate, together with historical and cultural motivations have an impact on the poor enforcement of law provisions (Owen, 2013). Today only few producers are compliant with the law, while only part of the goods is transported with a regular permit (MEWNR, 2013). After introduction of the Charcoal rules (2009) many producers association have been formed and today they control 40% of this type of production, however the remaining 60% is managed according to traditional methods and without any control. Despite being few in number, some associations operate in full compliance with the law despite bureaucratic difficulties. However, in some cases, they hide illegal productions or productions resulting from illegal imports. At the same time, it is believed that increased promotion of this form of charcoal associations is key to improvement of new measures in the sector. Several forests or biomass certification schemes such as the Forest Stewardship Council (FSC), Rainforest Alliance, and Sustainable Forest Initiative (SFI) can be adopted. They differ in degree of optionality from voluntary to mandatory, and range in operation from local, national, to international use (cf. (Dam et al, 2008). The voluntary Good Woods project at the Kenyan coast uses the FSC certification to encourage the conservation of threatened indigenous hardwoods particularly Mpingo (Dalbergia melanoxylon) and Muhuhu (Brachylaena huillensis) by encouraging wood carvers to shift to alternative abundant fast-growing and relatively soft woods such as Mango (Mangiferaindica L.), Jacaranda (Jacaranda mimosifolia) and particularly Neem (Azadirachtaindica) wood (FSC, undated).(fsc, undated). The Good Wood aims at conserving the environment while promoting good business as it is a potential marketing tool that can allow development of a niche market for certified wood carvings. Such forest or biomass certification schemes could target individual landowners as well as groups such as charcoal producers association or community forest associations (CFAs). In addition, in terms of charcoal production/carbonization, efficient charcoal kilns meeting appropriate ISO and/or Kenya Bureau of Standards (KEBS) standards could be made mandatory for licensed charcoal producers. The European Biochar Certificate can provide useful guide National Policies: Observations and Gaps This section provides an overview of observations/gaps in the policies described in earlier sections which are relevant to the sector. The gaps, if addressed, will facilitate the development of a supportive framework for the sector. Table 3-1: National policy analysis Policy Observation Gaps Charcoal (Forest) rules, 2009 Provides framework for organized and regulated charcoal industry The regulations lack an application track for individual landowners; they contain a number of unclear provisions and are built around a highly centralized application approval process. Few producers have applied for permits and there is uncertainty on how applications should be handled within KFS. 7 See 32
166 Policy Observation Gaps Charcoal movement Land act 2012 National Energy Policy Energy Act 2006, National Climate Change Action Plan The transportation of charcoal requires a movement permit under the 2009 regulations. Permits are also time-limited and vehicle-specific. Provide options for improved land management. It provides for development of guidelines on the management of public land and also provides for security of investments on landscapes such as forestry that needs long term engagement. Has guidance on different energy sources development and provides for regulation of energy pricing in petroleum The Energy Act 2006 provides the framework on energy in Kenya and hopes to ensures that the relevant ministries, Non-Government Organizations (NGOs) and other organizations address environmental problems associated with the supply and use of energy (charcoal and fuel wood). It acknowledges that biomass is the largest form of primary energy consumed. it provides guidelines to address environmental problems associated with increased demand of wood fuel. It is noted that under Section 2.4.2, the National Climate Change Action Plan (NCCAP) analysis suggests that Green House Gas (GHG) emissions Lack of standards to measure the efficiency of charcoal kilns Lack of incentives for efficient kilns Lack of disincentives for traditional kilns Lack of institutions for training charcoal production entrepreneurs No provision for supportive system such as extension It is not clear, which staff in KFS may issue these permits and the decision is frequently passed to Ecosystem (County) level, making the application process cumbersome. This makes it particularly difficult for charcoal to be moved in small volumes or redistributed from storage depots. The regulations are also vague on the carriage of fewer than four bags and unofficial interpretations result in fleets of bicycles, motorbikes and donkeys ferrying charcoal unimpeded to urban markets. Although it provides for control on land conversion, the land act does not devolve into direct biomass management such as harvesting No specific provision of charcoal production, biomass sourcing or pricing. Charcoal is treated with other biomass thus no specific provision The provision of this Act is useful in management of charcoal as energy source in the country especially production of biomass. However, it does not address the production technology that leads to waste of huge amount of biomass in the process of charcoal production. At the same time it does not address the labelling if the charcoal product which is an important activity in the charcoal value chain. The energy regulatory authority will need to address charcoal by regulation packing and pricing as well. While this is the forest sector analysis scenario, rising in demand of charcoal will lead to increased forest clearing as population rise and demand increases. To 33
167 34 Policy Observation Gaps (NCCAP), Climate Change Act 2016 EMCA 1999 Land policy 2009 Forest policy 2014 Forest 2005 Act in Kenya will increase up until 2030 in all sectors except forestry where emissions are likely to decline after 2020 due to the reduced clearing of forests and increases in the number and size of trees. Emissions in other sectors will grow significantly up to 2030, with transport emissions increasing by a factor of three and those from waste sector doubling. This emphasizes the need to restore landscapes to capture the carbon emission as result of development activities. Introduces several institutions relevant to the regulations of GHG emissions from the charcoal sector, e.g. the NCCC and CCD. EMCA 1999 provides for improved environmental management and has specific provisions for better environmental management. One of the requirements for EMCA 1999 is undertaking of Environmental Audit (EA) and Environmental Impact Assessments (EIA). However, the link with charcoal rules 2009 in terms of EIA is not clear The policy provides for planning including participatory planning, which would be ideal at County level. It also provides for protection of sensitive ecological area. Provision relevant to charcoal in terms of environmental management are contained in section (131a): and : Notes that forestry contributes to 3.6% of Kenya's GDP, excluding charcoal and Direct Subsistence Uses. Acknowledges technology used is obsolete. Dryland has potential to supply charcoal sector and improved livelihood depend on streamlined charcoal sector. Policy focus promotes sustainable production of charcoal. Section recognizes climate change dynamics. Encourages stakeholders participation and formation of community forest groups safe guard this scenario investment in charcoal biomass sourcing and production technology will be important. Thus, these is need to put in place systems that encourage organized biomass sourcing and improved technology through enactment of supporting legislation. Many of the newly introduced institutions are yet to be established, e.g. the NCCC. While the Act has very good provision for environment and land management, it lacks very clear provision on charcoal production which has huge impact on environment both in private and public land. Although the policy explores great management of environment that could be used in production of charcoal particularly sourcing of biomass. It does not provide specific provision of charcoal in spite of the likely impact on the environment The policy captures the spirit of woodlots establishment even as investments, which can be used to establish legislation and institution to deal with charcoal production. These could be done both at national and county levels, such legislation could include these that may support provision of financial support by county government. For clear provision of improvement of charcoal industry, the Act needs to provide for establishment support to development of charcoal industry considering that is has
168 Policy Observation Gaps Forest Management bill 2015 Forest policy 2014 Recognizes charcoal as forest products Forbids making charcoal without license bills also propose two important provisions, the community Forestry programme and National reforestation programme to provide both grants and technical assistance that would directly improve forest cover in the county. Make provision for development of charcoal rules. (Revised ): Under Section 2.9.1, the policy recognizes the climate change dynamics. In terms of landscape investments, Section 8.2 notes the need to (g) Support communities, commercial tree growers and land owners to invest in forestry as a viable land use option. (h) Promote partnerships in afforestation and reforestation programmes on public, private and community lands. (i) Provide incentives to communities, commercial tree growers and landowners for forest management and conservation, and encourage voluntary conservation easements. These provisions will encourage stakeholders to invest in woodlots on their farms. Vision 2030 Provides for environmental management, which has implication on charcoal production. Section 5.4 aims -, secure and sustainable environment by (i) to increase forest cover from less than 3% to 4% and (ii) to lessen by half a of environmental related diseases. greater potential that tea sector in terms of economic development. The two provisions will need to be operationalized at the county level to provide for these facilities that could be used to establish or encourage biomass production. Although it does not provide specifics for charcoal production it has clear provision of biomass production that could be used for charcoal production. Does not have specific provision for biomass energy strategy for this sector like charcoal production and sourcing. 35
169 3.3 NAMA Alignment with National and Sectoral Strategies and Policies This section describes the relationship between the NAMA's objectives and the national strategies and polices as set out in Section 3.2. Table 3-2: NAMA alignment with national and sectoral strategies and policies NAMA objectives National strategies and policies Trigger a low-carbon development Forest act 2005, Land act, Land policy, Vision 2030, Agricultural act 2012 Minimize the impact of the current charcoal value chain Charcoal rules 2009, Traffic act, Trade act Acting on causes of deforestation Forest act 2005, Land act, Land policy, Vision 2030, Agricultural act 2012 Improve the energy independence of the country Energy act, Forest act
170 4 Baseline Scenario and Targets This section describes the key characteristics of the GHG emission baseline or business-as-usual (BAU) scenario of Kenya s Charcoal Value Chain (CVC), the baseline emission data, the methodology used in gathering the baseline data and the emission reduction logic. To give a clearer picture of the entire CVC, the information is organized in terms of the key aspects of the CVC, namely biomass sourcing (forest management), charcoal production (carbonization), transport and retail, and final consumption. The baseline scenario describes the current BAU status, i.e. in the absence of any NAMA interventions and measures. The base year is 2010 similar to the National Climate Change Action Plan (NCCAP) data which was used in this NAMA. The NCCAP data is the most recent and comprehensive GHG inventory available for Kenya and is the basis of its Intended Nationally Determined Contributions (INDC) submission to the UNFCCC Secretariat in July The NCCAP operationalizes the 2010 National Climate Change Response Strategy (NCCRS), Kenya s low-carbon emission development strategy and plan (LEDS). The BAU and NAMA implementation timeframe is 2030, i.e. when the projected emissions and other low-carbon interventions and measures are expected to achieve the set targets. It coincides with the implementation framework of INDC as well as Vision 2030, Kenya s long-term socio-economic development strategy. This is due to the fact that NAMAs should be aligned with and should support the achievement of a country s own sustainable development pathway (UNDP, 2013). LEDS such as the NCCRS and NCCAP establish a framework that provides a direction and prepares the ground for concrete NAMAs even though NAMAs can also be developed in the context of general development plans such as Vision Kenya s INDC commits the country to reduce its GHG emissions by 30% by 2030 relative to the national BAU scenario of 143 MtCO2eq (GoK, 2015a). In other words, the Government intends to reduce its overall national GHG emissions by 42.9 MtCO2eq by However, BAU scenario excludes future emissions in the extractive (mainly coal, oil and gas) sector. Moreover, the INDC states that emissions of carbon dioxide from combustion of biomass are assessed but not counted towards the contribution (pg. 3). This means that the GHG emissions from biomass combustion, including charcoal production, is included in the BAU emission scenario of 143 MtCO2eq but their reduction or abatement is not part of the 30% emission reduction target. Therefore, if GHG emission reductions from non-sustainable biomass sourcing and combustion as proposed in this charcoal NAMA were included, Kenya s emission reduction target could be higher than the 30% (42.9 MtCO2eq by 2030) stated in the INDC. Carbon dioxide (CO2), methane (CH4), and Nitrous Oxide (N2O) are the GHGs prioritized in the INDC. All the six sectors under the IPCC Revised 1996 Guidelines for National Greenhouse Gas Inventories (IPCC, 1996) of Energy, Transportation, Industrial Processes, Agriculture, Forestry and Other Land Use (AFOLU), and Waste sector were considered. Land sector emissions (emissions from land use, land-use change, and forestry - LULUCF) were estimated based on relevant national policy documents and FAO's 2010 Global Forest Resource Assessment for Kenya. However, the INDC admits that there is significant uncertainty in the BAU emission and mitigation potential estimates for the LULUCF sector and work is underway to update and improve these estimates. Such efforts include the ongoing System for Land-based Emissions Estimation in Kenya (SLEEK) project (SLEEK, 2016). More information on data collection and monitoring systems is provided in the MRV section. The BAU projection methodology used in the INDC and NCCAP, including key assumptions, drivers and methodologies for each sector, are detailed in the NCCAP. The methodology - PATH Kenya model-is a state and transition modelling tool (GoK, 2013a) This NAMA used the data generated by this methodology as outlined in the NCCAP. 37
171 PATH Kenya Model PATH is a state-and-transition model that accounts for land use/land cover (LULC) change. There are no built-in relationships in PATH. It is designed to be flexible, permitting the input of any land states and transition types that the user defines. This is an asset because it allows the modeller to work meaningfully with limited data sets. It can be used spatially, so that each point on a map corresponds to a given land type; or non-spatially, where the land and its distribution among types remain in the abstract. This abstract type of specification is useful in contexts (such as Kenya) where the specific type of each unit of land as represented on a map is not known with a high degree of accuracy. The Kenyan PATH model uses 500,000 land units corresponding to area parcels of around 12 hectares. The model tracks the age of each state since its last transition. In the case of forests, this age represents the relative amount of above ground and below ground biomass that has accumulated. An age zero forest for example would have all above ground biomass removed, where-as an age twenty-year forest would have an accumulate biomass over twenty years as represented by specific biomass curves for different forest types. PATH tracks the state that each unit of land is in and its age. However, by also tracking in the model the amount of carbon held in a unit of a given land type, it is possible for it to model 11 the amount of carbon being held in different land classes and the total carbon stock. Changes in this stock can then be used to determine the carbon emissions resulting from LULC change. For each land state it is possible to define and track separately above-ground carbon, below-ground carbon, soil carbon, and total carbon stocks. The Kenya customization of the PATH model relies on FAO data as well as various GoK sources. Source: (GoK, 2013a) 4.1 Baseline Summary Table 4-1 gives a summary of the BAU emission scenarios for different aspects of the CVC. The sources of the data used are explained in the subsequent sections. Table 4-1: Baseline (BAU) scenario summary (MtCO2e) Year Charcoal production Charcoal production (carbonization) Charcoal transportation negligible Charcoal consumption Total Forest Management Seventy-five percent (75%) of Kenya s total GHG emissions of 73 Mt CO2eq. in 2010 was from land use, land-use change and forestry (LULUCF) and agriculture sectors (GoK, 2015a) (GoK, 2015b). This is due to the heavy reliance on wood fuel by a large proportion of the population, increasing demand for agricultural land, and urban sprawl. The NCCAP consider GHG emissions from forestry as including the conversion of non-agricultural land to agriculture and the management of forest plantations. That is, all carbon releases and sinks that are a result of a land conversion from one type to another are included in the forestry sector. However, the management of soils on agricultural lands through cultivation and tillage are assessed in the agricultural sector. The forestry sector excludes energy emissions from fuel combustion related to forest industry activities as these emissions are included in the transportation and household, commercial and industrial energy sectors (GoK 2013a) 8. The overall annual demand for wood products is estimated at 37 million cubic meter (m 3 ), while total sustainable supply only stands at 30 million m 3 a year, creating an annual demand shortfall of 7 million m 3 (GoK 2013a). 8 See the detailed background analysis of the NCCAP, Mitigation chapter, Chapter 4: Forestry. 38
172 There has been a long-term trend in the reduction of Kenya s forest cover from 11% in 1963 to about 6% in This suggests that Kenya s forest sector is a net carbon emitter rather than a carbon sink (GoK, 2013a) (FAO, 2010). In the base year 2010, community ownership constituted the largest forest tenure system in Kenya, encompassing approximately 58% of the country s forest area (. 2). Public forests accounted for 39% while privately owned forests accounted for the remaining 2.6% (FAO, 2010). Table 4-2: Kenya s forest tenure categories FRA 2010 Categories Forest area ( 000 hectares) Public ownership Private ownership of which owned by individuals of which owned by private entities and institutions of which owned by local communities TOTAL Source: (FAO, 2010) The GHG emissions baseline based on the PATH Kenya model used by the NCCAP is shown in Table 4-3 below. This is the conservative historical trends-based BAU scenario that include the Vision 2030 flagship projects, but without any emission-reduction due to the NAMA interventions and measures. This baseline BAU does not take into consideration the Forest Act (2005), Charcoal Regulations (2009), or any other recent (post-2010) improved forest governance actions. The baseline emissions of 19.6 MtCO 2e in 2010 from forestry and other land-use related emissions accounted for about 32% of national emissions. The emissions are projected to decline to 13 MtCO 2e in 2030 if no interventions are undertaken (GoK, 2013a). These emissions are primarily from deforestation linked to i) demand for energy (fuelwood and charcoal production), and ii) to create agricultural land. No information is available on how much of this baseline emission is attributed to demand for energy alone, and the data is also not disaggregated in terms of the contribution of fuelwood and charcoal production to the baseline emission. Based on a Tanzanian study (Lusambo et al. 2007) where charcoal use is almost similar to Kenya, deforestation in Tanzania allocates 50% to agriculture and 37.5% to charcoal. If emissions from forestry and other land-use related emissions accounted for 19.6 MtCO2e in 2010, and we assume that the charcoal portion is roughly 40%, then deforestation emissions attributable to charcoal production was roughly 7.6 MtC02e in Figure 4-1 summarizes the main sources of the projected emission reductions. Table 4-3: BAU emissions from forestry and other land use (MtCO2e) Source Above Ground Below Ground Soil Carbon TOTAL Source: (GoK, 2013a) The Government of Kenya has set certain low-carbon development actions or targets which, if implemented, are expected to cumulatively reduce an additional 40 MtCO 2e per year in 2030 (GoK, 2013a) Three key interventions are projected to contribute to this reduction. They exclude agroforestry which is considered under agriculture in the NCCAP: Restoration of forests on degraded lands (32.6 MtCO2e) Conservation and sustainable forest management (6.1 MtCO2e) Reducing deforestation and forest degradation - REDD+ (1.6 MtCO2e) 39
 Ninety-five percent (95%) of industrial process emissions in Kenya came from cement manufacturing (1.7 MtCO2e) and charcoal manufacturing (0.")

173 Figure 4-1: Low-carbon development wedges in the forestry sector (MtCO2e) Source: Adapted from (GoK, 2013a) 4.3 Charcoal Production (Carbonization) Ninety-five percent (95%) of industrial process emissions in Kenya came from cement manufacturing (1.7 MtCO2e) and charcoal manufacturing (0.8 MtCO2e) in 2010 (GoK, 2013a). The charcoal production emissions assume that the feedstock used are carbon neutral, but rise to 4.3 MtCO2e if 35% unsustainable biomass use is assumed. Compared to other sectors, the level of GHG emissions from industrial processes in Kenya is low, about 4% of total GHG emissions in 2010 and are expected to slightly increase to approximately 6% in 2030 (GoK, 2013a). 9 The baseline (BAU) figures for charcoal production (carbonization and briquetting) of 0.8 MtCO 2e is projected to rise to 1.2 MtCO 2e in 2030 without any NAMA interventions (GoK, 2013a). This BAU scenario assumed that all the charcoal was produced using traditional earth mound kilns which generally have a low efficiency of 10-22%. Charcoal production emits CO2 and methane (CH4) from incomplete combustion of biomass. More efficient carbonization technologies or kilns reuse these gasses in the carbonization process hence have lower emissions. 9 See Chapter 8 (Industrial Processes) of the detailed Mitigation Report of the NCCAP 40
.")

174 Figure 4-2: Industrial process emissions in 2010 Source: Adapted from (GoK, 2013a) The most significant low carbon opportunity in industrial process emissions in Kenya is the introduction of more efficient kilns for charcoal production, with an abatement potential of 1.6 MtCO 2e per year in 2030 (GoK, 2013a). This projected emission reduction assumes that the BAU emissions can be reduced by 75% through the use of more efficient charcoal kilns compared to the traditional earth mound charcoal kilns. The adoption rate of the improved kiln was assumed to be 50% in 2030 because of policy interventions promoting the use of efficient kilns. 4.4 Charcoal Transportation and Retail Road transport is the main mode of transporting charcoal in Kenya and is projected to remain so in 2030 as no significant shift from road to rail is expected (GoK, 2013a). No information on the exact number, type of vehicles, and the frequency of their use specifically in the transport of charcoal is available. Nevertheless, we considered potential emission reduction from charcoal transportation as negligible. The emission reduction potential of wholesale and retail was similarly considered negligible. It is estimated that between 10% to 15% of charcoal end up as waste, with Nairobi county alone producing several tons of charcoal dust daily from wholesale and retail stalls (Njenga M. K., 2013a). Although reducing such waste through actions such as briquette making can reduce pressure on forests and will be encouraged as part of the NAMA interventions and measures, the waste itself does not produce any additional emissions as the emissions are already considered under forest management and charcoal production. 4.5 Charcoal Consumption Table 4-4 shows the emissions from charcoal consumption between 2000 and The 2010 BAU emission figure of 0.12 MtCO 2e is projected to decline to 0.06 MtCO 2e in 2030 if no interventions are undertaken. The decline attributed to planned or ongoing energy efficiency programs such as promotion of energy saving cook stoves (jikos). 41
175 Table 4-4: Total emissions by source (MtCO 2e) Source Charcoal consumption Fuelwood Agricultural residues Source: (GoK, 2013a) Improved cook stoves offer the largest potential for GHG emission reductions at 5.6 Mt CO2e a year in 2030 (GoK, 2013a). The Energy Sessional Paper No. 4 of 2004 (GoK, 2004)envisaged a 100% adoption of improved cook stoves in urban areas by The low-carbon scenario for improved cook stoves assumes a 100% penetration by 2030, with the cook stoves having a 50% efficiency improvement compared to 2012 standards (GoK, 2013a). This is admittedly an optimistic assumption because a 100% penetration of improved stoves may not be achieved by 2030 let alone by the year However, the NCCAP contend that a jiko stove currently achieves up to 50% efficiency improvements at relatively low costs (Grieshop, Marshall, & Kandlikar, 2011) Therefore, by 2030, stoves with more than 50% efficiency improvements versus 2012 BAU may compensate for even less than 10% penetration. The low-carbon scenario assumes a linear increase in the penetration of improved stoves until Baseline Data Gap Analysis The baseline data and scenario for this NAMA study was sourced from data obtained in the process of developing Kenya s National Climate Change Action Plan (NCCAP) Because the data was collected and compiled based on the six sectors under the Revised 1996 IPCC Guidelines for National Greenhouse Gas Inventories of energy; transportation; industrial processes; agriculture; forestry and other land use (AFOLU); and waste sectors (IPCC, 1996), they are in some cases (e.g. forestry) not disaggregated in terms of or in sync with the charcoal value chain. Moreover, most GHG emissions (and reduction projections) data are collected and availed at an aggregate national level. But with the coming into force of the 2010 constitution with devolved counties who are now responsible for forest and charcoal management, such data needs to be disaggregated or scaled down to counties and other sub-national administrative scales. Availability of recent and accurate GHG emissions data remains a challenge. A major cause for this is that there is no consistent system and consistent national program to continuously collect and collate data and/or monitor various indicators on a regular basis. While on-going data collection programs such as SLEEK are expected to contribute towards filling such gaps, such programs should be integrated into the work programs of relevant implementing institutions and adequate and regular budgets provided for them. 4.7 GHG Mitigation Targets Intervention-1: Ensure sustainable biomass supply for charcoal production Kenya s forest sector is a net carbon emitter rather than a carbon sink (FAO, 2010) (GoK, 2013a). According to the National Climate Change Action Plan (NCCAP), emissions from forestry and other land-use related emissions accounted for 19.6 MtCO 2e in 2010 and is projected to decline to 13 MtCO 2e in 2030 (GoK, 2013a). This BAU emission for the forestry sector combines above ground, below ground, and soil carbon and is primarily from deforestation linked to i) demand for energy (fuelwood and charcoal production), and ii) to create agricultural land. No data is available on the emissions contribution of charcoal production alone, but using proxy data from a Tanzanian study, the emissions attributed to charcoal production were estimated as 7.6 MtCO 2e in 2010, declining to 5.2 MtCO 2e in The BAU emissions from the forest sector include the Vision 2030 flagship development projects but without any potential emission-reduction interventions such as the Forest Act (2005) or Charcoal Regulations (2009). According to projections in the NCCAP, if the following three NAMA interventions are implemented, emissions from deforestation can be reduced by up to 40 MtCO2e per year by 2030: restoration of forests 42
176 on degraded lands (32.6 MtCO2e), conservation and sustainable forest management (6.1 MtCO2e), and REDD+ (1.6 MtCO2e). All the three interventions are also applicable to deforestation linked to charcoal production (the figure calculated above). If Intervention-1 of this NAMA is fully implemented, the emissions from deforestation linked to charcoal production are projected to reduce by up to 75% (3.9 MtCO2e) per year by Intervention-2: Implement efficient charcoal production technologies The baseline (BAU) figures for charcoal production in Kenya in 2010 was 0.8 MtCO 2e and is projected to rise to 1.2 MtCO 2e in 2030 if no mitigation actions are undertaken (GoK, 2013a) This BAU emission assumed that all the charcoal is produced using traditional earth mound kilns which generally have a low efficiency of 10-22%. The emission reduction target for this intervention is to reduce the BAU emissions by 90% by 2030 to 0.12 MtCO 2e. This emission reduction target of 1.08 MtCO 2e per year in 2030 is slightly lower than the abatement potential of 1.6 MtCO 2e per year in 2030 projected in the NCCAP. It assumes a 100 % adoption rate for efficient kilns by 2030 but is conditional on the effective implementation of and compliance with the relevant policy and legal framework, availability of financial support and other economic incentives, and effective implementation of Intervention-3. GHG emission reduction achieved by improving efficiencies in charcoal production in a given year y (ERSSB,i,y) is calculated by comparing emissions from actual number of efficient (efficient kilns replacing traditional kilns with the emissions under the baseline scenario (BETRK,i,y). A CDM approved methodology can be used to estimate emission reduction from charcoal production. According to the CDM methodology AMS-III.BG: Emission reduction through sustainable charcoal production and consumption, for sector charcoal production units not equipped with capture and destruction of the pyrolysis gases, emission reductions are calculated as follows: Equation (1) ER y = Q CCP,iy i [(CF NCV wood NCV charcoal,i NCV charcoal,default f NRB,BL,wood EF projectedfossilfuel )] CE FF,y CE El,y CE BC,y Project activities using cultivated biomass shall calculate CE BC,y according to the methodological tool Project emissions from cultivation of biomass. 4.8 Sustainable Development Baseline and Targets This NAMA is designed to produce sustainable development (SD) benefits in addition to GHG mitigation. SD benefits are a central element for climate finance and for encouraging country ownership, as well as having an important impact on the long-term sustainability of a NAMA. For this NAMA, a number of SD indicators have been selected based on the Sustainable Development Evaluation Tool (SD Tool) of UNDP 43
177 (UNDP, 2014). 10 The SD Tool defines the following five SD domains. Each of the domains has a set of indicators against which the impact of the NAMA intervention can be measured. 1. Environment 2. Social 3. Growth and Development 4. Economic 5. Institutional Monitoring the SD impacts on all the indicators of the respective five domains will be challenging and resource intensive and in some cases not feasible. Therefore, just five SD indicators have been selected, which will be part of the MRV system (Table 4-5). Table 4-5: Indicators for the SD baseline SD Domain SD Indicator Growth and development Economic Institutional 1. Access to clean and sustainable energy 2. Capacity-building 3. Job creation 4. Policy and planning 5. Law and regulation GHG emissions could be included as an indicator under the Environment domain. However, instead, it will be monitored through the MRV system and will be covered there. Similarly, the quantity of fuel saved under the NAMA could be included in the Economy domain under the indicator Energy Security but will be monitored as part of the MRV process under GHG emission reductions. There are several impacts which are attributable to the interventions under this NAMA which are difficult to incorporate into the MRV system and have therefore not been included there. For ready reference these impacts are listed in Table 4-6 below. Table 4-6: Unmonitored SD Indicators SD Domain SD Indicator Environment Social Growth and development Economic 1. Air pollution/ air quality 2. Biodiversity and ecosystem balance 3. Livelihood of poor, poverty alleviation, peace 4. Health 5. Time savings/time availability due to NAMA 6. Education 7. Empowerment of women 8. Access to sustainable technology 9. Energy security 10. Income generation/expenditure reduction/balance of payments Table 4-7 below provides the baseline and targets for the identified indicators. 10 The tool requires that for each of the interventions a decision should be made whether an indicator (such as air pollution, biodiversity, health, etc.) is selected. The impact of the intervention on the chosen indicator can then be identified and explained, and the effects (positive, negative, both) pinpointed. Whether monitoring has been undertaken is also indicated. 44
178 Table 4-7: The SD Indicators: Baseline and Targeted Impacts Parameters Baseline Value Target Value (estimated ex ante) Number of woodlot and efficient charcoal producing units Number of people trained from private sector for woodlots and charcoal production Number of technical staff and workers trained in skill development in manufacturing, service and support for woodlots and efficient charcoal production Number of jobs and business opportunities created men and 477 women Number of households offered sustainable charcoal 0 1,050,000 Number of households using sustainable charcoal 0 1,250,000 NCA organizational structure 0 1 Capacity development programme for the NCA, the NIE and the MRV cell Marketing and awareness-raising campaigns, including demonstration activities Overall operation management system of NCA 0 1 NIE operations management system 0 1 NEE operations management system
179 46
180 5 Interventions and Measures 5.1 NAMA Objectives The overarching goal of this NAMA is to contribute to Kenya s low-carbon development pathway by minimizing the emissions of the current charcoal value chain, while acting on the causes of deforestation and improving the energy security and independence of the country. This goal will be met through the following objectives: Objective-1 (Sustainable biomass supply): Ensure sustainable supply of biomass for charcoal production to meet the demand in Kenya Objective-2 (Efficient charcoal production): Ensure efficient charcoal production in order to reduce the amount of sustainable biomass needed to meet the demand The two objectives are linked to three distinct interventions. Intervention 1 and 2 will help in achieving Objective 1 and 2 respectively, while Intervention 3 will assist achievement of both, Objective 1 & 2. Intervention-1: Ensure sustainable supply of biomass for charcoal production Intervention-2: Implement efficient charcoal production technologies Intervention-3: Establish a charcoal certification and labelling scheme The NAMA implementation period will run for a 14-year period from 2017 to After this initial implementation period, it is hoped that the interventions and measures proposed will have become established and thus able to sustain themselves through the various exit strategies put in place. The NAMA implementation is divided into two phases - the preparatory or demonstration phase in various NAMA enabling policies, regulations and institutional frameworks are being established, reorganized, or their capacities enhanced which will run for a six-year period from 2017 to After this, the transformation phase in which most of the actual envisaged transformational actions of the NAMA are being implemented will run from 2023 upto 2030 and beyond. County governments will play a critical role and significantly contribute to the realization of these objectives by formulating policies and legislations to support the charcoal industry reforms, forest management being one of the developed functions. The county-level legislations will be harmonized with those of the national government, a situation which will require highlevel political support and close working relationship between the counties, the national government and its agencies such as the KFS, and the private sector for successful implementation. 5.2 Intervention-1: Ensure sustainable biomass supply for charcoal production The purpose of this intervention is to ensure that all biomass used for charcoal production in Kenya is sustainably produced. Specifically, the measures under Intervention 1 are tailored to inform all stakeholders of the coming changes and enable transformation by first demonstrating the new technologies and systems, building relevant capabilities with each stakeholder, develop policy (both incentives and enforcement) which addresses the goals and present shortcomings, and finally enable the policy packages (incentives and regulation for woodlots in the case of Intervention 1). This will also involve tracking of biomass sourcing and restoration plans for each site so as promote sustainable sourcing of biomass. Thus, there is need for clear guidelines on forest management and charcoal production which should be formulated by County in consultation with Kenya Forest Service. This should also be incorporated with research aspects, which could be undertaking 47
181 by Universities and organizations like KeFRI. To facilitate this process of sustainable biomass production there is need for a national CPA network, which needs to be facilitated through financing at the national level. Such network could be covered by the existing legislations or through adjustment, especially to capture financing aspects Business models for Intervention-1 Model-1: Community based forest management Local communities own the largest amount of forest land in Kenya (FAO, 2010). Under this model, duly registered community forest associations (CFAs) may be licensed to produce charcoal as per the relevant sections of the Forest Act (2006) and Charcoal Regulations (2009) woodlots will be encouraged to sustainably produce and supply fuelwood for their own commercial charcoal production or to sell to other interested CFAs or independent licensed charcoal producers. The CFAs will develop sustainable management protocols (e.g. tree species to grow, harvesting areas, standards, quotas, etc.) within the forests or woodlots under their jurisdiction as per the relevant sections of the Land Act (2012). Interested community members prepared to comply with those protocols may create user groups through which to harvest and sell forest products to outside parties. The user groups pay taxes to the community from their sale proceeds. These taxes are typically split three ways between investments in social infrastructure (e.g., schools, water points, health centers), fees to the village forest committee to pay for management and enforcement operations, and payments to the KFS or KeFIR. The details of such arrangements will be worked out with the assistance of the KFS, KeFIR, universities, donor agencies, etc. in order to define the rights and obligations of the respective parties, and restrictions against free access by illegal wood fuel harvesters and traders. Model-2: Private sector based forest management Under this model, private sectors such as smallholder farmers, land owners, and entrepreneurs renting land will be encouraged to establish woodlots. Establishment of private woodlots will help balance government concerns of deforestation and natural resource management with farmer concerns of income generation and security. The Forest Act (2005) requirement that all private landowners set aside at least 10% of their land for forests will be enforced to encourage more sustainable supply of biomass for charcoal production. The private land owners will be encouraged to join or form CFAs or CPAs if they want to sell their timber or commercially produced charcoal. Model-3: Public sector forest management Publicly owned forest land is the second largest in terms of acreage after community forests (FAO, 2010). This means that they are or can be a significant source of sustainable biomass for charcoal production if properly utilized. One way in which such public forest can be utilized is through the establishment of demonstration woodlots to showcase various tree species, agro-forestry techniques, and so on to CFAs, individual landowners, and the general public Measures for Intervention-1 To ensure sustainable biomass supply for charcoal production, the following measures need to be undertaken Policy and regulatory measures Strict enforcement and compliance with relevant policies and regulations: Kenya s policies and regulations that are intended to conserve and sustainably manage both public and private forests are quite 48
182 extensive and robust. These include but are not limited to the Forests Act (2005), Charcoal Regulations (2009), Wildlife Conservation and Management Act (2013), Agriculture Act (revised 2012), and (GoK, 2015b).the Environmental Management and Coordination Act (1999). The challenge, rather, has been chronic inability to enforce or ensure compliance with them. This intervention will support the capacity of the relevant institutions mandated to implement these policies and regulations. Such support will include identification and plugging of any loopholes in the regulations which allow for sourcing of unsustainable biomass, harmonization of conflicting mandates (e.g. between KFS and KWS), as well as financial and other administrative capacity building support. Future legislations should also provide stronger support for sustainable supply of biomass. For example, the Public Procurement and Disposal Act (2015) should be revised to include a requirement that forest products must be sustainably sourced if they are to be legally traded within Kenya. The development of sustainable and adequate biomass production/sourcing should be supported by effective extension service by County government and legislation. The most effective, although expensive, extension is travel and visit which, allows technological transfers including kilns, species to plant, harvesting among other aspects. As a result of the introduction of the devolved county governments, whose responsibility is to manage forests under their jurisdiction, more resources will be directed towards supporting counties, especially those where most charcoal is produced, to formulate county policies and regulations best suited to conserve forests and ensure sustainable supply of biomass to charcoal producers and other users of biomass. Such policies should be harmonized with and complement the national policies and regulation for maximum impact. This means that issues including CPA formation, gazetting of sites, and woodlots operations must be regulated and enforcement established on a county level Financial measures Revolving loan fund (RLF): Investment support is needed for the proliferation of new sustainable forest management. Investment support will be offered to the wood producers by means of a revolving loan fund which will receive an initial grant to permit lending operations. Loans will be offered on the back of business plans developed by the applicant wood producer Capacity building and awareness creation measures Capacity building and support for institutions: National institutions (KFS, KWS, KEFRI, Police, etc.), counties (especially those where the bulk of wood fuel and charcoal come from), community groups (e.g. CFAs and other community groups which own forests or woodlots), and individual landowners. Awareness campaigns: This measure will create awareness among the key stakeholders such as land owners, smallholder farmers, local administration, village committee about the business models and opportunities for developing sustainable woodlots under the NAMA. Target group/stakeholders include County officers, KFS, KEFRI, NEMA, Ministry of trade and The Ministry of Interior and Coordination of National Government where police officers and local National administrators are placed, forestry owners plus charcoal traders. Training for smallholders on sustainable biomass supply: o Phase 1: training of 50 instructors, Phase 2: training of 3000 smallholder/entrepreneurs 49
183 Training for medium and large scale biomass supply: o Phase 1: training of 20 instructors, Phase 2: training of 1800 landowners/entrepreneurs 5.3 Intervention-2: Implement efficient charcoal production technologies Charcoal in Kenya is predominantly produced in traditional earth mound kilns. The aim of Intervention 2 is to reduce the emissions from such traditional kilns through the implementation of efficient charcoal production technologies (kilns) for all commercial charcoal producers in Kenya. Specifically, the goal is to ensure that 90% of large scale charcoal production is performed with efficient kilns. Large scale production is defined as at least a quarter ton (250 kg) to be carried out per day. This would typically be done with at least one unit of a stationary kiln of at least 3 m 3 and a production cycle time of around 24 hours including cooling and in excess of 30% efficiency. At least 50% of small scale production should be carried out in stationary kilns. The remainder of small scale production is expected to be carried out using mobile retort kilns, which should be no less than 70 kg per day in production capacity, and in excess of 25% efficiency. To improve chances of adoption of the most efficient technology and financially affordable centralization of the charcoal carbonization at the CPG level would be important. Modalities of centralized carbonization units could be done by the CPG and CPA with assistance of KFS Business model for Intervention-2 Production of charcoal for commercial purposes (sale to the public, directly or indirectly) will only be done by landowners and charcoal producers such as CPAs legally licensed to do so. The transition will be enabled bv capacity building, incentives and regulation. This will make it easy to target such charcoal producers with technical and financial support to acquire and operate efficient kilns. During the demonstration phase of the NAMA implementation, a total of demonstration sites will be set up across the country, particularly in charcoal producing counties, to showcase different types of efficient kilns and highlight various financial support systems and investment opportunities available to potential charcoal producers. The demonstrations will be carried out by private investors such as the Kenya National Federation of Jua Kali Associations in collaboration with government agencies such as Kenya Industrial Research and Development Institute (KIRDI) and Kenya Climate Innovation Centre (KCIC). The demonstrations will be a business in its own right, somewhat supported with incentives given the risk of new technologies and a new business environment. Model-1: Efficiently producing charcoal using sustainable biomass from entrepreneurs providing sustainable biomass. The entrepreneur profits from the cost difference between the sustainably sourced biomass and the charcoal sold to brokers or transporters. Model-2: Supplying charcoal production technology Under the NAMA, thousands of efficient kilns will be commissioned around Kenya. There is a large opportunity to engage to supply both small scale and larger units, mobile (truck), possible to dismantle as well as stationary units Measures for Intervention-2 To achieve the emission reduction targets under this intervention, the following measures will be undertaken Policy and regulatory measures Technical framework for the production and use of efficient kilns: To achieve the transition to efficient kilns in Kenya, knowledge on the production and use of efficient kilns must be established throughout the 50
184 country. In order to develop conducive policy and means for regulation, a technical advisory committee on the production, efficiency and quality assessment as well as the development of proper guidelines for the use of different types of efficient kilns is established. The initial task is to set up a testing facility in collaboration with the Kenya Bureau of Standards (refer to section ), and the task during the later part of the NAMA period is to ensure that the certification of efficient kilns is carried out in the best way possible, including raising the bar of efficiency and innovation using a dynamic grading system as a base for incentives, etc. Regulate use of efficient kilns: Section 7(4)f of the revised (2012) charcoal regulations states that for one to be issued with a license to produce charcoal, the licensing sub-committee shall consider the type of technology. Such a technology, it notes, may be prescribed under the charcoal regulations or any other written law, in particular, the Energy Act. However, such technology has not been explicitly prescribed either in the charcoal regulations or the 2012 revised Energy Act (2006). This intervention proposes that the charcoal regulations and Energy Act be revised to explicitly state that all commercial charcoal production in Kenya must be done using kilns with an efficiency of at least 30%. The effect, by 2023 (end of the demonstration phase of the NAMA), is a ban on commercial production of charcoal using any kiln other than the efficient kilns prescribed in the revised Energy Act and charcoal regulations. This means that issues including identification of collection centres, legislation on kilns (including the use of inferior quality and wet feedstock etc) and movement must be regulated and enforcement established on county level Financial measures Revolving Loan Fund: To entice private sector investment in implementation of efficient kilns, it is essential to make the finance available at below market rates to the private sector entities. This will be done by establishing a revolving loan facility, where money paid back over a two-year cycle by the producers, will be used to replenish the fund. This model will allow the establishment of a loan facility with a relatively small capital base, making it attractive to international finance. Such a financial facility and/or incentive is within the powers of the Minister responsible for energy as per the Energy Act (2006). The fund may be administered on a county level to serve both to provide loans and contiguous development support Capacity building and awareness creation measures Training on efficient kiln design, construction, and use: To ensure that high quality efficient kilns are readily available and at an affordable price, targeted training will be provided to Jua Kali artisans throughout the country in the design and construction of such kilns. This will be done in collaboration with the Kenya National Federation of Jua Kali Associations, the Kenya Association of Manufacturers (KAM), and the Kenya Private Sector Alliance (KEPSA). Once produced and tested by KIRDI and ascertained by the Kenya Bureau of Standard (KEBS) as meeting the requisite efficiency standards, charcoal producers who procure them will also be trained on how to use them in order to achieve the best pyrolysis standards. 5.4 Intervention-3: Establish a charcoal certification and labelling scheme This NAMA intervention will develop a simple yet robust nationwide certification and labelling scheme for all charcoal sourced from local biomass and produced (carbonized), transported, traded, and consumed in Kenya. It is intended to support the achievement of the emission reduction targets set out in Interventions 1 and 2. Its theory of change is based on the assumption that if the final consumer is able to easily identify and only purchase sustainably sourced and efficiently produced charcoal, the objectives of Intervention 1 (sustainable biomass supply) and Intervention 2 (efficient charcoal production) will to a large extent have been achieved. 51
185 The International Standards Organization (ISO) of which Kenya is a member categorizes environmental labels and declarations into Type I, Type II, and Type III based on the criteria applied, verification process, and who is doing the reporting (ISO 2012). Type I are voluntary, multiple-criteria-based third party (can be operated by public or private agencies) programme that awards a licence which authorizes the use of environmental labels on products indicating overall environmental preference of a product within a particular product category based on life cycle considerations. Guided by ISO Standard, they comprise the traditional eco-labelling schemes which award a mark or a logo on a product based on the fulfilment of a set of criteria. Type II are claims made or self-declared by manufacturers and businesses. Their operation is guided by the international standard ISO guided by ISO 14025, Type III (environmental declarations) present quantified environmental information on the life cycle of a product to enable comparisons between products fulfilling the same function. They are primarily intended for use in businessto-business communication, are provided by one or more organizations, are based on independently verified life cycle assessment (LCA) data, are developed using predetermined parameters, and are subject to the administration of a programme operator (e.g. a company or group of companies, industrial sector or trade association, public authorities or agencies, or an independent scientific body).. The above categories of environmental certification and labels will be used as a guide in deciding what certification schemes are best suited for different sections of the charcoal value chain and the sustainability criteria and indicators to be applied. Additional sustainability criteria and indicators will be agreed upon in consultation with key charcoal stakeholders. Some of the charcoal certification and labelling criteria suggested by stakeholders at the NAMA validation workshop include; Source and weight of the biomass Species used to make the charcoal Location: country and country of biomass and charcoal origin The charcoal producer (CPA) The technology employed in producing the charcoal Calorific value Key focal points for certification in the charcoal value chain A charcoal certification and labelling scheme can cover all aspects of the charcoal value chain, i.e. from biomass sourcing, charcoal production, transport and storage, and retail (See Fig. 5-1). This NAMA considers two parts of the charcoal value chain as very important targets for the proposed certification and labelling scheme if the envisaged transformation of the charcoal sector is to be realized. These are 1) Sustainable biomass sourcing (forest management and other biomass supply) and 2) Efficient charcoal production or carbonization, corresponding to Interventions 1 and 2 respectively. Figure 5-1: Potential areas in which certification criteria and indicators can be applied Source: (Dam et al, 2008) 52
186 Biomass certification: A key objective of this charcoal NAMA is to reduce deforestation in Kenya and related GHG emissions, most of which is linked to demand for charcoal and fuelwood. The certification and labelling scheme will therefore target the sources of biomass and other feedstock used to produce charcoal by ensuring that they are sustainably produced. There exist several forest or biomass certification schemes, such as the Forest Stewardship Council (FSC), Rainforest Alliance, and Sustainable Forest Initiative (SFI). They differ in degree of optionality apply different sustainability criteria and verification procedures, and range in operation from local, national, to international application. This NAMA will adopt any of these biomass certification schemes to certify biomass used to produce charcoal in Kenya as sustainably produced. The choice of the scheme to follow will depend on a variety of factors, including ease of application of their procedures, knowledge and implementation capacity of the biomass producers (CFAs and private landowners), availability of qualified certifiers and inspectors, and the cost implications. The voluntary Good Woods project at the Kenyan coast uses the FSC certification to encourage the conservation of threatened indigenous hardwoods particularly Mpingo (Dalbergia melanoxylon) and Muhuhu (Brachylaena huillensis) by encouraging wood carvers to shift to alternative abundant fast-growing and relatively soft woods such as Mango (Mangifera indica L.), Jacaranda (Jacaranda mimosifolia) and Neem (Azadirachta indica). (FSC, undated). The program aims at conserving the environment while promoting good business as it is a potential marketing tool that can allow development of a niche market for certified wood carvings. The experiences of such schemes demonstrate that biomass certification can work even at small scale levels, and will be tapped into while designing the charcoal certification scheme. Kenya, through its national standards body the Kenya Bureau of Standards (KEBS), has adopted ISO Sustainability criteria for bioenergy (KS ISO 13065: 2015). It specifies principles, criteria and indicators for the bioenergy supply chain to facilitate assessment of environmental, social and economic aspects of sustainability. It is applicable to the whole, parts, or a single process in the supply chain and applies to all forms of bioenergy irrespective of raw material, geographical location, technology or end use. It facilitates the evaluation and comparability of bioenergy production and products, supply chains and applications. The principles reflect aspirational goals while the criteria and indicators address sustainability aspects and the information that is to be provided. The environmental principles, criteria, and indicators include GHG, biodiversity, and energy efficiency. The principle behind the biodiversity criteria is to promote positive and reduce negative impacts on biodiversity within the areas of operation of an economic activity as well as within protected areas. Although the indicators under this Standard might not comprehensively capture all sustainability aspects for all bioenergy processes, once adopted by Kenya through KEBS, they immediately gain full backing of the law. This NAMA will strengthen the capacity of KEBS together with other stakeholders such as KFS and Ministry of Energy to effectively implement the ISO 13065, particularly those related to biodiversity/forest conservation and energy efficiency. This NAMA considers implementation of the ISO as complementing rather than conflicting with existing biomass certification schemes such as the FSC. They will therefore be implemented concurrently to bring out the envisaged deep reduction in deforestation caused by charcoal production and the related GHG emissions. Another alternative is for KEBS, KFS, the biomass certification schemes (e.g. FSC), and stakeholders in the charcoal industry to domesticate the ISO by modifying it to incorporate more robust aspects of forest management and assessment found in the biomass certification schemes. Certification of charcoal production (carbonization and briquetting): Currently, it is not possible for the consumer to know the type or efficiency of the technology or process through which the charcoal (and briquettes) sold in the Kenyan market have been produced. KEBS, through KS ISO : 2014, has adopted ISO (Solid biofuels fuel specifications and classes) which provides classification 53
187 principles for solid biofuels. Apart from enabling efficient trading of biofuels, it is also a tool for communicating with equipment manufacturers, hence can guide production and adoption of efficient kilns and cooking stoves. Part 3 of the Standard deals with graded wood briquettes. It supports the use of briquettes in residential, small commercial and public building applications, noting that they require higher quality fuel because small equipments usually lack advanced controls or flue gas cleaning, appliances are not manned by professional heating engineers, and are often located in residential districts. More importantly, Kenya has adopted ISO (Sustainability criteria for bioenergy). KEBS, as part of the process of domesticating ISO 13065, is developing standards for Wood Charcoal and Charcoal Briquettes (CD EITL XX: 205). A representative of KEBS presented the ongoing work at the validation workshop of this NAMA, while several members of the Committee developing the Standard were also present at the validation workshop. This NAMA will feed into and inform the ongoing process of developing these charcoal and briquette standards. Among key issues that needs to be considered include setting the minimum efficiency standards for kilns used to produce charcoal sold in the Kenyan market, moisture contents and calorific values of both feedstock (biomass) and the final charcoal and briquette, as well as the curing and other recommended production processes to be followed in the production of charcoal. These minimum requirements, once gazetted as Kenyan Standards by KEBS will become mandatory for charcoal producers intending to produce commercially sell their charcoal in Kenya. Co-benefits of the certification and labelling scheme As a result of the establishment and implementation of the charcoal certification and labelling scheme, the price of charcoal is expected to stabilize. This will be an advantage to consumers who have been paying hugely varying prices for the same quantity of charcoal but whose quality or sustainability is unknown. For transporters, certification and labelling will make their business smoother and more profitable since by transporting only duly certified and labelled charcoal, there will be no need to bribe law enforcement officers (e.g. police and county officers) as hitherto has been the case. For charcoal traders and retailers, the certification and labelling scheme might have a slight negative impact on their profit margins in the short-term. This is due to the enhanced transparency and consumer awareness in the charcoal sector as well as increased competition as more traders get involved in the now regulated business. Such potential reductions in profits for charcoal traders will, however, be counterbalanced by a redistribution of profits to others along the charcoal value chain, particularly charcoal producers (CPAs) and landowners (CFAs and private owners) who supply wood fuel. Despite their crucial role in the charcoal value chain, charcoal producers and biomass suppliers have benefitted the least in the current businessas-usual (BAU) charcoal governance framework which this NAMA intends to transform. By making biomass supply and charcoal production more profitable, the charcoal certification and labelling scheme will act as an incentive for landowners to supply and charcoal producers to use sustainably produced wood as a longterm business strategy. Certification and labelling will also enhance and facilitate enforcement and compliance with the various legislations intended to regulate the charcoal sector. It will make it easier for various law-enforcement or implementation institutions such as the KFS, police, KEBS, Anti-counterfeit Authority (ACA), county officers, local administration etc. to monitor and ensure compliance as it is easy to recognize a certified and labelled charcoal which is packaged in the appropriate packaging material. The labelling will integrate several authentication and tracking technologies through which the law enforcement agencies could easily satisfy themselves of the legality and compliance status of the particular batch of charcoal. The certification and labelling scheme will allow: Various environmental taxes, subsidies, and other economic instruments (EIs) intended to bring about environmental behavior change through operationalization of payment for ecosystem services (PES) to be 54
188 implemented. 11 The charcoal certification and labelling scheme provides a framework through which to internalize the environmental externalities of the charcoal sector by reflecting such externalities into the final price of charcoal in addition to bringing about the much needed environmental behavior change and attendant GHG emission reductions, such EIs can generate revenues to both the national and county governments. Certification will also create more business opportunities as more people get into the regulated and streamlined charcoal sector. For example, large supermarkets will be more willing to stock certified, labelled, and properly packed charcoal, while finance institutions and SMEs will be encouraged to lend to and tailor financial products to those involved in the streamlined charcoal sector Measures for Intervention-3 To establish and operationalize the charcoal certification and labelling scheme in Kenya, the following measures will be undertaken by this NAMA Policy and regulatory measures Currently, Kenya has no charcoal certification and labelling scheme. Although, the Government is currently revising the Charcoal (2009) regulations and a labelling (not certification) scheme is proposed this NAMA intervention will go further and introduce a third party certification and labelling scheme as outlined above. The draft Forests (Charcoal Industry Management) Regulations 2016, under Part III (Weight, Packaging and Labelling of Charcoal) states that charcoal shall be measured in kilograms, packaged in 50 kg or less, and bear a clearly legible written label which shall specify species of the raw material, calorific value of the raw material, date of production, technology used in production, origin of the charcoal, and name and address of the producer or producer association. These measures, though necessary, fall short of the deep transformation of the charcoal sector envisaged under the proposed charcoal certification and labelling scheme under this NAMA. The ongoing revision of the Charcoal regulations, nevertheless, offers a window of opportunity to establish the certification and labelling scheme and should be fully utilized. In addition, the following will be implemented. Establish a system of environmental standards and fiscal reform: The need to establish a robust system of environmental standards and labels, and environmental fiscal reform (EFR) through creation of a system of targeted subsidies and taxes intended to incentivize internalization of externalities or payment for ecosystem services (PES) are some of the proposals in Kenya s Green Economy Assessment Report (UNEP, 2014) Similar proposals are contained in Kenya s environment policy (GoK, 2013b) as well as the amended (2015) Environmental Management and Coordination Act EMCA (GoK, 2015b). However, their operationalization in the charcoal sector as in many other sectors is either not strategic or non-existent. The draft Kenya Green Economy Strategy and Implementation Plan (GESIP) 2015 identifies environmental standards for various sectors as lacking even though they are necessary if Kenya is to improve its environment on which its long-term development is dependent, achieve low-carbon development, enhance the ability of small and medium sized enterprises (SMEs) to create jobs and make profits, as well as enhance its ability to trade internationally (GoK, 2015c). The charcoal certification and labelling scheme will contribute to the achievement of these objectives. Such a scheme is however dependent on developing the above enabling policy and regulatory framework. While this NAMA proposes a certification and labelling scheme for the charcoal sector, such a certification scheme will have to be aligned with those of other 11 See for example Payments for Ecosystem Services. Getting Started: A Primer, The Katoomba Group, Forest Trends, and UNEP. UNON, Nairobi. 55
189 sectors through a national environmental standards, certification and labelling scheme for ease of implementation, efficiency, and for maximum impact. Such a national scheme requires development of an overarching policy and regulatory framework on environmental standards and labels, and environmental fiscal reform (EFR) covering the, design and use of economic instruments (EIs) in environmental management. While the use of EIs for environmental management is provided for in EMCA (GoK, 2015b), their application has been haphazard due to lack of regulations for their application (UNEP, 2005) Review of specific policies and regulations: To operationalize the charcoal certification and labelling scheme, certain specific policies, laws, or regulations will need to be enacted and/or amended. The full extent of such changes can only be known once the nature and scope of the certification and labelling scheme has been worked out and agreed upon by the key stakeholders. Some of the laws which might need to be revised include the Forest (2005) Act and Charcoal (2009) rules to integrate the certification and labelling scheme. While the amended EMCA (GoK, 2015b) identifies forestry related activities such as timber harvesting, clearing of forests, and re/afforestation with alien species, and plants for the manufacture of coal briquettes are supposed to undergo environmental impact assessment (EIA), the 2013 EIA regulations do not specify how this is to be done. Another is the Public Procurement and Asset Disposal Act (2015), which currently lack robust green procurement principles and criteria. Under Section 60 of the Act, the procurement officer has the discretion to consider in the technical specifications the life of the item, its environment-friendliness, and the cost of disposing the item. Not only should they be mandatory, these requirements should be expanded to better capture and integrate the principles and practice of green procurement. Guidelines on labels and packaging technology: Labelling involves marking the charcoal product with a distinctive label so that consumers can easily and quickly recognize that they conform to certain (sustainability) criteria set by the relevant certification authority or scheme adopted. Many Type I certification schemes such as the Forest Stewardship Council (FSC), come with their own easily identifiable labels. Others (mainly Type II and Type III) are often self-declarations which are done by the manufacturers (e.g. CPAs) with or without independent third-party verification. For such, if adopted, guidelines will be developed to regulate what and how biomass or charcoal producers should make such declarations and labels. Alternatively, an independent firm could be competitively sourced to provide the labels based on the set guidelines. The 2012 revised (GoK, 2012) and draft (to be published in 2016) charcoal regulations contain certain sustainability criteria which could be integrated into the certification and labelling scheme, e.g. protection of endangered and threatened plant species; reporting of tree species, number, volume, and type of technology to be used in charcoal production; requirement of biomass suppliers to have reforestation or conservation plan; and approval from local environment committees (GoK, 2012). Other existing criteria could be elaborated upon, e.g. Section 5(3)a of the charcoal rules states that CPA s are to facilitate sustainable production of charcoal by its members but what constitutes sustainable charcoal is not clearly defined in the charcoal rules. The charcoal ecolabels and packaging will be made tamper proof and difficult to counterfeit. Secure, authentication, anti-counterfeit sealing technology and systems exist and will be used. Tracking technology will also be integrated into the labels and packaging to enable tracking the charcoal products from the point of production to sale, either physically, virtually, or both. Such technologies include barcodes, internetlinked QR codes, cellular and GPS enabled tracking systems etc. Knowledge of such labels, packaging, and product tracking technologies already exist in the private sector and no major piloting is envisaged. Inter-county and international cooperation: The transformational change of the charcoal sector will depend on the success and acceptance of the certified and labelled charcoal, particularly among consumers in urban areas. Due to the very real challenge of carbon leakage, it is absolutely necessary that 56
190 the certification scheme is implemented across the entire country. Piecemeal roll out in specific counties might not be effective because traders might source charcoal from other counties which are not part of the scheme, beating the logic of the scheme. The same is true for biomass sourcing. Counties will have to assist biomass and charcoal producers (CFAs & CPAs) and other stakeholders in enforcement of the various rules necessary to operationalize the scheme. Such a national scheme will require that CFAs and CPAs have an umbrella national body to ensure their interests and views are considered at the national level. Such a national umbrella body reportedly exists for CFAs and a similar one should be established by the CPAs. On the international front, On the international front, it is important to introduce safeguards against importation of charcoal from unsustainably sourced and carbonized charcoal. This will require harmonization of relevant laws and regulations with those of other countries from where Kenya imports charcoal, particularly the East Africa Community (EAC) and some Common Market for Eastern and Southern Africa (COMESA) countries. Such harmonization will have to take into account existing bilateral and international trade and environmental agreements to which Kenya is party. This measure will be carried out as (part of) a Conference of the Counties where strategies, enforcement methods, timing of and other issues are aligned. The financing of this measure also includes funding of a national CFA network Financial measures The cost of implementing the certification and labelling scheme must be affordable to the small-scale entrepreneur if it is to succeed. Therefore, in addition to the above policy and regulatory reforms, the following financial measures will be put up to support the scheme. The two funds proposed below could, based on advice from the Treasury and input from key stakeholders, be linked to the Climate Change Fund created by the Climate Change Act 2016 (GoK, 2016). Private Sector Ecolabelling Fund: During the preparatory phase ( ), various stakeholders (landowners, wood suppliers, and charcoal producers) will be encouraged to come together, with financial and technical assistance from the private sector and donor community, to develop a voluntary certification and labelling schemes for biomass supply and charcoal production. Such an initial self-regulation has the advantage of tapping into the skills and resources of the private sector, builds the confidence of charcoal stakeholders as to the intention of the Government, provides an opportunity to identify potential or teething challenges of rolling out such a scheme on a national scale, and buys the government the time it needs to develop and put in place the building blocks of a mandatory scheme in the event that the voluntary scheme does not achieve the intended objectives. To facilitate the operationalization of the voluntary certification and labelling scheme, a Private Sector Ecolabelling Fund will be established to source for and pool financial resources from the private sector, donors, and other climate funds such as the Green Climate Fund. After the grace period ( ), the voluntary scheme will be reviewed and either continued with certain modifications if found effective or abandoned and a mandatory scheme introduced, taking into account the lessons learned. Public-Private Partnership Ecolabelling Fund: From 2023 onwards, the voluntary certification and labelling scheme might be transformed into a compulsory one. Alternatively, some aspects of the scheme could remain voluntary (e.g. certification of sourcing of biomass) and others mandatory (e.g. certification and labelling of charcoal as sustainably sourced and carbonized). Whatever scheme is adopted will require a steady and stable stream of finances to operate. The above Private Sector Ecolabelling Fund could be transformed into a Public-Private Partnership Ecolabelling Fund or such a new fund established. Its sources 57
191 of funds could include the Government, private sector, donor community, CDM and other carbon trading platforms, and international climate finance such as the Green Climate Fund. Summary of the key activities under Intervention 3: Develop the specific objectives, principles, criteria, scope, outline, content, and operationalization process for the charcoal certification and labelling scheme. This will be done through establishment of a Certification and Labelling Working Group (CLWG) to spearhead the development of the scheme in a consultative and participatory manner as per the public participation clause of Kenya s 2010 constitution Assess existing policies and legislations in order to identify particular policies and/or laws that need to be amended or developed afresh to bring into effect the proposed certification and labelling scheme Identify specific implementing institutions, their roles, and capacity needs assessment; Perform massive and targeted information and educational campaign aimed at sensitizing specific stakeholders and the general public about the certification scheme. This is particularly important because the success of the scheme depends on high consumer awareness and acceptance. 5.5 Common measures Public information campaign: A national- and county-level public campaign encompassing the measures and expected impact of NAMA interventions will be launched. The campaign will go public at the end of the Demonstration Phase and continue hand in hand with the process of developing the certification and labelling scheme. The aim is to ensure a general understanding among all stakeholders, including charcoal consumers, of the three elements of sustainable charcoal: better forestry, more efficient use of the sustainable biomass, and certification and labelling. The information campaign will include: Radio and television campaign (awareness information will be broadcasted on radio and television); Promotion in the print media (awareness information will be published in national newspapers); The design of NAMA pamphlets and billboards; and Development of a website. Implementation of information workshops Capacity building: A thorough needs assessment will be carried out in all the parts of the charcoal value chain to identify the gaps in capacity that should be addressed if the emission reductions and sustainable development co-benefits of the interventions and measures are to be realized. Such capacity building could range from building the capacity of county governments and the public to effectively participate in developing charcoal-relevant policies and regulations, to equipping various implementing agencies with the skills and resources to carry out their mandate under this charcoal NAMA. Establishment of committees at county level: Committees consisting of local stakeholders and county/national government representatives are established for quarterly meetings to ensure CFA and CPA functions including implementation of forestry restoration plans, kiln use, loading at collection centre and marketing. Curbing illegal import of unsustainable biomass and charcoal: It is important to introduce safeguards against importation of charcoal from unsustainably sourced charcoal from neighbouring countries. This will necessitate harmonization of the laws and regulations with those where Kenya imports charcoal, particularly EAC and some COMESA countries. Such harmonization will have to respect relevant trade and other international agreements to which Kenya is party. This measure is the responsibility of the relevant ministries of GoK and would not entail separate funding, but can be seen as National government 58
192 responsibility. The Ministry of Interior and Coordination of National Government and Ministry of Trade will be crucial in ensuring blockage or streamlined importation of charcoal from neighbouring countries. 59
193 60
194 6 Capacity Building 6.1 Intervention-1: Ensure sustainable biomass supply for charcoal production Training of smallholders on sustainable biomass supply (forestry) The majority of charcoal biomass comes from arid and semi-arid ecosystems (75% of the country), where the land is not adjudicated and tree planting is low. Production is mainly by individual farmers or outsiders with link with local people. Again in those areas where land is adjudicated, almost all charcoal is made by small scale farmers who also plant trees that are used for charcoal production. Thus, training on biomass supply in these two scenarios should consider the nature of land tenure and how secure it is for long term investments. Afforestation in these areas is a challenge due to water limitation. Again, weeding of large area of seedlings is challenging. Thus, encouraging natural regeneration is important. In the arid and semiarid ecosystems, charcoal production is encouraged to clear land for livestock while in other areas it causes conflict with biodiversity conservation. Thus, County land use plans or group/ranch plans could help in management and balancing of these interests. In the border areas, cross-border issues complicate management of biomass since other forces from across the border making management fluid. It is also important to consider the adoption of water harvesting structures for seedlings production and growing that is necessary in afforestation. The training will be arranged in two parts 1) NAMA experts train local forestry and climate change expert on NAMA focus and important areas of training including contribution of NAMA to NDC. This creates a large pool of experts that will be used by county government. About four training sessions could be held at intervals of 2 months. These training could be held in centralized places with about 20 people per session. Selection of experts which should focus on practicing experts like NRM experts and forestry from KFS, KeFRI, Universities and NGOs should pay attention to regional sourcing to avoid clustering all TOTs from one area. These trainings should be intensive within the first year of NAMA so as to pass the benefits. Table 6-1: In house training Trainers of Trainers (TOT) Topic of training NAMA, objective scope targets and content Biomass production Ideal species per ecological zone Measuring NAMA targets Dealing with potential biomass producers- important information Trainer NAMA expert local/international NAMA expert local/international NAMA expert local/international NAMA expert local/international NAMA expert local/international The trained TOT trains local charcoal biomass producers, which could be done at the county level with focus on local community members who are willing to be charcoal biomass producers. About participants can be trained together at County level. These trainings should be continuous throughout the NAMA period apart from the last 3 years to minimize loss of acquired information. Table 6-2: In house training- biomass producers Topic of training-biomass producer Trainer NAMA, objective scope targets and content Local experts drawn from NRM experts and forestry from KFS, KeFRI, Universities and NGOs Biomass production Local experts drawn from NRM experts and forestry from KFS, KeFRI, Universities and NGOs Ideal species per ecological zone Local experts drawn from NRM experts and forestry from KFS, KeFRI, Universities and NGOs 61
195 Topic of training-biomass producer Assessing maturing tree and harvesting material for charcoal- sustainable harvesting Biomass markets Tree care and pests Climate change and charcoal production sources of planting material and propagation Tree farming and agroforestry Trainer Local experts drawn from NRM experts and forestry from KFS, KeFRI, Universities and NGOs Local experts drawn from NRM experts and forestry from KFS, KeFRI, Universities and NGOs Local experts drawn from NRM experts and forestry from KFS, KeFRI, Universities and NGOs Local experts drawn from NRM experts and forestry from KFS, KeFRI, Universities and NGOs Local experts drawn from NRM experts and forestry from KFS, KeFRI, Universities and NGOs Local experts drawn from NRM experts and forestry from KFS, KeFRI, Universities and NGOs Farmer field schools would be the third form of training where public venues or on farm training will take place in an open meeting. This training should involve relevant stakeholders like forestry (KFS, KeFRI) and agriculture and water to select species, planting skills, location of planting so as to be compatible with other land uses like crop farming. In appropriate areas, farmers will be trained on regeneration. It is notable that regeneration is likely to encourage local species contributing to ecological balance. In arid and semi-arid areas planting and growing trees is much more difficulty due to water limitations, but regeneration works very well Goal Increase the capacity for biomass production from private farms through increased tree planting and sustainable harvesting; Target group/stakeholders: farmers and land owners including those hiring land for long period such as lease Training for medium and large scale supply (forestry) For both medium and large scale stakeholders, the training will involve people with space for woodlot establishment. There is need to set a threshold of minimum individual area that would qualify one to a medium or large scale supplier. This computation should be based on charcoal production potential. Based on the market needs, there is need to set criteria of medium or large scale which could take into consideration the size of the land among other factors. Focus of the training should be geared toward supply of large quantity of biomass for charcoal production without necessary dependent on outside supply for large scale. While medium biomass producers should have provision to purchase material from small scale producers as way of encouraging biomass production. It will take the same format as above, however, training will take place in centralized place as logistics cost catered for Goal To increase capacity for biomass source from medium and large scale land; To provide sufficient knowledge with sufficient land owners and entrepreneurs to sustain larger scale charcoal production from woodlots; Target group/stakeholders: farmers and land owners including those hiring land for long period such as lease with over 10 ha available for tree planting. Also, administrators and inspectors. 6.2 Intervention-2: Implement efficient charcoal production technologies Training for efficient kiln design, construction and use This activity is primarily aimed at training for charcoal producers for the procurement and operation of efficient kilns compliant with coming regulation. Further it will support kiln producers to develop efficient models for offer in different parts of the country as well as providing information to investors, informing how to structure investment and establishing a company for either kiln production or charcoal production. 62
196 Areas included in the training sessions include Business models, technology, feedstock quality, product quality Goal Knowledge among charcoal producers, regulators, police and forestry inspectors as well as investors in the designated charcoal counties around the country; Target group/stakeholders: as above, including investors. 6.3 Intervention 3: Establish a charcoal certification and labelling scheme Formation of Certification and Labelling Working Group (CLWG) As per the public participation clause of Kenya s 2010 constitution, the formulation and development of the charcoal certification and labelling scheme has to be a broad-based process with adequate public participation. This is the best way to address many of the potential concerns, misgivings, and potential conflicts by various stakeholders which could jeopardize the smooth implementation of the programme. The CLWG will include key stakeholders in the charcoal industry, including the civil society and academia, and will be charged with developing the modalities and fine tuning the establishment and implementation of the charcoal certification and labelling scheme. The CLWG will require capacity building not only in terms of administrative and financial support, but more importantly, specific guidance and training on how to develop sustainability criteria and design an effective certification and labelling system. Capacity building in certification and labelling of charcoal will take various forms and will continue throughout the implementation period Capacity building for implementing agencies and charcoal stakeholders on the certification scheme Once approved and enacted, the various institutions and stakeholders charged with implementing various aspects of the scheme, from forest/wood suppliers (e.g. landowners and CFAs), inspectors (e.g. KFS, FSC, or county inspectors), charcoal producers (e.g. CPAs), manufacturers of the labels and packaging materials (private or public-private partnership), enforcers (e.g. police, county officials, judges), to retailors and the general public will be sensitized on the nature of the scheme, the relevant regulations bringing it into effect, and the consequences for non-compliance. County governments, CPAs, and the police, for example, will require training on various technologies and systems to manage and track the certified and labelled charcoal batches, certificates of origin, and movement permits. Based on a capacity needs assessment (CAN), the specific type of capacity gaps and needs will be identified for specific stakeholders and remedial efforts, whether training, financial, and/or administrative provided Training for producers of the ecolabels and packaging Producers of the ecolabels and charcoal packaging will require initial training on how to produce the approved labels and packaging with the necessary tamper proof seals and tracking technology. Generally, such competency exists within the country, but training might still be necessary given the unique aspects of the certification and labelling scheme. Moreover, being a new area of entrepreneurship, it is important to train specific enterprises with the capacity to supply them while opening up the space for new entrants so that there is no shortage of the seals and packaging as the program will be launched countrywide. 63
197 64
198 7 NAMA Financial Requirements and Mechanisms This chapter provides details about the financial requirements for the NAMA and the financial mechanisms which will be used to meet those requirements. It must be noted, that the financing of this NAMA, and particularly the financial mechanisms, are indicative and based on the assumptions made in Chapter 5 on Interventions and Measures (e.g. number of woodlots and kilns receiving support etc.) and Chapter 6. The purpose of this chapter is to provide an indication of the costs by intervention, the financial requirements, the potential sources of finance (e.g. national vs. international) and a model of how financing the NAMA could be made attractive to donors. 7.1 Introduction Sustainable production of charcoal may offer other economic benefits such as access or increased security of energy supply and reduced deforestation. Access to energy services is critical in achieving the Millennium Development Goals. On a national level, increased availability of foreign reserves and export earnings may follow. With a focus on sustainable forestry, a sustainable value chain for charcoal need not alter the traditional smallholder structure of a region, but could instead provide additional income to subsistence farmers. It should be noted that there are major differences between NAMA financial mechanisms and carbon credits. While carbon credits are project specific, NAMA financial mechanisms are program based and made available to an entire sector or industry. Activities that would fall under financial support are those that need direct financial flows. These activities include direct project support for institutional set up (e.g. staff, office space, strategy to design new institutional framework), infrastructure (e.g. collection centres, chimneys, training centres, charcoal bags) and indirect costs (e.g. transportation costs for producers to attend trainings). 7.2 NAMA Financing Overview This section provides an overview of the financing required from national and international sources for implementing the NAMA. Given the nature of the overall NAMA design, a significant equity contribution for the longer term is possible through fiscal revenue increases, which is discussed in Section Table 7-1: Overview of NAMA finance SN Intervention/Measures Description NAMA budget (US$) Finance required (US$) F1-I1 Financing of regulatory support and enforcement - forestry F2-I1 Financing for woodlots - Business model 1 Grant for (international) consultants assistance for developing policy, and resources for research and enforcement Revolving loan fund (two year rotation, initial capitalization repaid at end of NAMA period F3-I2 Financing for efficient kilns - business model 2 Revolving loan fund (two year rotation, initial capitalization repaid at end of NAMA period
199 SN Intervention/Measures Description NAMA budget (US$) Finance required (US$) F4-I2 Support for efficient kilns - regulation and enforcement Grant for technical committee, (international) consultants assistance for developing policy, and resources for enforcement Total A: Intervention 1 and F5-I3 Fiscal reform and enforcement - certification Support for regulatory development, enforcement officers and procedures F6-I3 F7-I3 Review of specific policies and regulations Guidelines on labels and packaging technology Grant for the establishment of certification reference group, and planning Grant for general campaigns three times during NAMA period F8-I3 Inter-county cooperation Aligning and enforcing national policy through county commitment F9-I3 F10-I3 F11-I3 Private Sector Ecolabelling Fund for demonstration Public-Private Partnership Ecolabelling Fund - implement Formation of Certification and Labelling Working Group Capitalization of fund Capitalization of fund Grant to fund meetings and regulatory preamble development (CLWG) F12-CM County level committees Ensuring CFA and CPA functions in each county F13-CM Public information campaigns Campaigns to engage final consumers and entrepreneurs F14-CB Capacity building Cost for assessment and training programs; biomass supply, efficient kilns, certification inspectors and packaging entrepreneurs F15-NC F16-NC Operating Costs - National Implementing Entity Operating Cost of Financing Facility Staff cost plus MRV system software and hardware Ten percent of expected grant finance Total B: I3 + CM + CB Total (A+B)
200 7.3 Financial Requirement for Intervention-1 & Intervention-2 This NAMA Financing will directly contribute to the three interventions and their supporting measures. Both interventions will be executed under a long-term multilateral agreement including the appropriate governing authority of the NAMA (e.g. the Implementing Entity). The common measures are supporting activities that will enable the interventions to take place NAMA finance for investment in sustainable woodlots and efficient kilns To allow for a transition towards sustainable sourcing of wood fuel for charcoal production, and efficient production of charcoal, investment is needed. Finance support for the development of sustainable woodlots and efficient charcoal kilns is the main cost of the NAMA and expected to be funded through the establishment of a revolving loan fund. Resources for research on relevant topics is also requested ( USD per year during the NAMA period). Today s production of almost 2 million tons of charcoal in traditional kilns requires in excess of 15 million ton of wood. To create sustainable supply for efficient production would require, around 7 million ton of wood fuel (including branches, etc.) should be sourced each year, with a projection to produce 2.1 million ton of charcoal in However, there is a need to ensure the low enforcement of seedlings planting by group members is adjusted to increase planting and growing of trees. The transition under the NAMA will be gradual. Disincentives for non-sustainable practices would have to come in only when there is a fair amount of certified woodlots in operation, not to disturb supply of the main cooking fuel and keep prices reasonable, This is a considerable, while not unachievable, task. To produce 7 million ton of fuelwood 13 would require 1 million ha under sustainable cultivation 14. Since the current forest resource base occupies an area of 4.39 million hectare (MEWNR, 2013), the land tenure, and land use reform required under the NAMA would be considerable. To facilitate the transition, support for investment in forestry (equipment, roads, staff, vehicles, etc.) is assumed at 30% for small scale and 20% for large scale woodlots, assuming a total investment requirement of 50 USD per hectare. Further, assuming 60% small scale (10ha) woodlots would require 60,000 such woodlots, while 40% cultivation in larger scale woodlots of 100 ha (average) would require 4,000 units. Distributed across 30 charcoal counties, this represents 2,000 small scale units and 130 large scale units per county. The finance requirement for sustainable woodlots is thus 16 million USD for the national level, assuming 30% investment support for small scale woodlots and 20% for larger woodlots. This requires an initial capitalization (loan) of 3,302,804 USD. The loan will be repaid at the end of the NAMA period. The transition of production from traditional kilns to efficient kilns is also of large proportions. Two million tons of charcoal divided over small scale units of production would imply a total of 16,800 large scale units and 40,000 smaller scale (typically mobile) units nationally, or 560 large scale and 1,300 smaller scale units per charcoal county (assumed to be 30 counties out of the 47 in the country today). The finance requirement for investment support for efficient kilns is thus roughly one million USD per charcoal county. If a revolving loan fund is established with a two-year turnaround, this can be assumed to need 15% initial loan, which would then amount to 4,933,931 USD. The loan will be repaid at the end of the NAMA period. 12 However a considerable share of the area will be additional plantation and that this additional planting is done towards the end of the NAMA period. Adding a 30-year cycle for forest growth before clear fell, which produces most of the wood volume, the full sustainable wood volume will not be available for more than a decade after the NAMA project end. 13 At an assumed (efficient) rate of 10 m 3 per ha per year and 700 kg fuelwood /m The amount of agricultural land in Germany assigned to producing biomass for biogas production is of a similar magnitude, suggesting at least a theoretical feasibility given the range of co-benefits for Kenya. 67
201 7.4 Financial Requirement for Intervention Certification The certification of thousands of woodlots (and often adjacent charcoal production kilns) per county will require resources to manage a large number of inspection visits. Assuming one visit per site every two years, plus ad-hoc visits to ensure compliance and two visits per working day, each county on average would need five inspectors. It is proposed that financing is sought for these inspectors from 2020 to After the NAMA period it is assumed that fiscal revenue will be sufficient to fund the staff cost. A system for administration of certificates must also be developed, including development cost, staff cost and operations, amounting to 130,000 USD plus training at a total cost of 30,000 USD to county level administrators Capacity building Training of staff for the woodlots and production kilns as discussed above is essential. The capacity building period of will entail a cost of 4,120,000 USD for training of both public and private sector stakeholders; biomass supply, efficient kilns, certification inspectors and packaging entrepreneurs. Climate grant finance will be sought for these measures, which constitute the actual backbone of the NAMA as it enables the transition in technical terms Common measures Common measures include the dissemination of public information regarding the details of the transition. It also includes costs for establishment of county level committees and an assessment of the required capacity building for the NAMA. The cost for these common measures is estimated to 1,700,000 USD for the NAMA period Operating costs - National Implementing Entity The operating cost for the National Implementing Entity is estimated at 2,567,200 USD. This covers the salaries and operating costs of personnel employed by National Implementing Entity (NIE) for the entire duration of the NAMA. As these personnel are expected to be government employees, the entire item is expected to be funded by a national contribution, based on the future revenues from charcoal tax, amounting to 2,567,200 USD. This assumes that the NIE employs one director (annual salary 24,000 USD), two managers (annual salaries 18,000 USD), four senior level clerks (annual salaries 12,000 USD) and eight junior level clerks located in eight MRV points (annual salaries 7,200 USD). In addition to salaries, the operating costs also include costs related to hardware (e.g. computers and IT facilities for the NAMA MRV system), averaging 50,000 USD annually Operating cost of financing facility The cost of operating the grant component of the NAMA financing facility is calculated as a percentage (10 per cent) of the total value of the grants distributed, amounting to 1,600,000 USD. As most of the grants are intended to be extended in the first four years of the NAMA, most of this amount will be required during the initial build-up phase. Based on the assumptions made about the amount of grant finance expected under the NAMA, the operating cost is estimated at approximately 1,600,000 USD over the lifespan of the NAMA. 7.5 National Finance Sources Fiscal revenue from tax from sales of charcoal is one of the most important implications of the NAMA, even if the importance for financing the NAMA is limited since this revenue would depend on the execution of the NAMA and thus become a reality only once the NAMA measures have been implemented. This is briefly discussed below. 68
202 Possible sources also include private funds. Today s trading businesses are likely to have a place in the new charcoal regime. It would be an option, and indeed in many cases a requirement, for these organizations and individuals to invest their resources into sustainable sourcing of biomass, efficient charcoal production as well as packaging and labelling systems for certified charcoal product. Beyond what is explicitly discussed in this NAMA as to financing, the transition to a new regime may create several opportunities for national finance. As an example, we see a case of a local entrepreneur who develops the project planning phase of e.g. a charcoal production project, which is a difficult and time consuming task that needs institutional support in the form of feasibility/ technical assistance grants. If the source of FDI can act in concert with a local entrepreneur who is well anchored in the local community, it can provide a framework for sustainable entrepreneurship. Issues complicating the participation of foreign investors in developing activities in the CVC in state- or traditionally-owned lands often can be dealt with by involving domestic investors NAMA revenue Public funding includes revenues from subjecting charcoal sales to sales tax. Subjecting all sales of 1, 6 million tons (conservative estimate) of charcoal to Kenya state tax would create in excess of 5 billion KSh in fiscal revenue. Given the informal character of the industry today, and the elusive character of wood fuels sales of wood fuel often eludes taxation also in many western countries a major transformation will extend the revenue above a small fraction of the potential. Further, this is a complex subject because of the large differences in income in the country, together with the absolute necessity to offer affordable cooking energy to low income groups, require a balance of the need for fiscal revenue as well as socioeconomic factors. At present, the grey character of the sector has resulted in affordable energy but at the price of the environment. Further, corruption implies that funds are accumulating outside the fiscal system which could fund other illegal activities. The lack of sustainable forest resource is gradually causing deforestation as well as increasing prices. This is not sustainable and it can be expected that an understanding from all sectors is growing as to the need to reform the sector and include it in the fiscal regime. The transition to a taxed good must be sensitive to the socioeconomic consequences. In the case of fiscal revenue from Kenyan charcoal retail, it is assumed that a sales tax system will be in place only when the disincentive measures for traditional charcoal has become operational towards the end of the NAMA period, and increased the cost for unsustainable charcoal at the same time as the availability of sustainable charcoal is acceptable in all urban areas. Repayment of the initial capitalization of NAMA revolving loan funds through fiscal revenue thus should only be programmed for 2030 and on, if possible. 7.6 International Finance Sources A sustainable charcoal value chain requires sustainable investment. Sustainable investments are those that combine the investors financial needs with societal and environmental impacts. This investment segment has grown to a non-negligible size during the last decade and has found many advocates within as well as outside the investment community, including academics, analysts, commercial investors, NGOs and fund trustees (Cerin & Dobers, 2008) Currently, the UN initiative for responsible investments, the Principles for Responsible Investments (PRI), established in 2006, has already gathered signatories with a total of USD 19 trillion under asset management, involving some 210 asset owners and 437 investment managers. 69
203 One of the main sources of funding for NAMAs is the Green Climate Fund. The Green Climate Fund (GCF) was established15 to support developing country efforts to limit or reduce their emissions and adapt to the impacts of climate change. In May 2014, eight design elements were declared by the GCF board as necessary to support fund operations. Drawing from these, the Board has agreed to offer financial support on a competitive basis to developing countries based on six criteria (Table 7-2). Table 7-2: Criteria for funding under GCF Criteria Note Impact potential Paradigm shift potential Sustainable development potential Needs of the recipient Country ownership Efficiency and effectiveness Mitigation and adaptation impact Impact beyond a one-off project/program investment Wider benefits and priorities (economic, social and environmental) Vulnerability and financing needs of beneficiary country and population Beneficiary country ownership of and capacity to implement a funded project or program Economic and financial soundness of program or project The potential to connect the financing need of the Kenya charcoal NAMA with the resources discussed above is part of the initial agenda for the entity managing the finance of the NAMA. Another option is Carbon finance. Kenya have been successful in this field - The Climate Investment Funds (CIF) have during 2011 approved SREP (Scaling up Renewable Energy Program) funding of 25 MUSD for the Menengai Geothermal project. Further, a concessional finance program of 30 MUSD from the Clean Technology Fund (CTF) was approved in 2016 for Geothermal generation. The CTF resources will help fill financial gaps for geothermal power development. Yet one concessional loan for geothermal development was secured earlier this year from CIF-CTF. A national project like the NAMA could accumulate carbon savings to a level where this type of funds could be made available. 7.7 National and International Finance Section 7.5 and 7.6 provided an indication of potential sources of finance for the interventions and measures. As the financing for NAMA is subject to negotiation with various parties, the sources of national and international finance that we have outline are only indicative at this point of time. Table 7-3 below summarizes the proposed sources of finance by the various line items under the NAMA 15 Intended to serve as a financial mechanism of the UNFCCC, the GCF is a legally independent institution with an appointed secretariat and a 24-member board that oversees funding decisions, operating under the guidance of and accountable to the COP. 70
204 Table 7-3: Sources of finance for NAMA measures SN Intervention/Measures Finance required (US$) F1 -I1 Financing of regulatory support and enforcement - forestry F2 - I1 Financing for woodlots - Business model 1 F3 -I2 Financing for efficient kilns - business model 2 Financing source (indicative) International grant finance International loan finance for initial capitalization of revolving loan fund International loan finance for initial capitalization of revolving loan fund F4 - I2 Support for efficient kilns - regulation and enforcement International grant finance Total A: Intervention 1 and F5-I3 Fiscal reform and enforcement - certification F6-I3 F7-I3 Review of specific policies and regulations Guidelines on labels and packaging technology International grant finance in combination with national contribution International grant finance International grant finance F8-I3 Inter-county cooperation International grant finance F9-I3 F10-I3 F11-I3 F12- CM F13- CM F14- CB F15- NC F16- NC Private Sector Ecolabelling Fund for demonstration Public-Private Partnership Ecolabelling Fund - implement International grant finance International loan finance Formation of Certification and Labelling Working Group (CLWG) International grant finance County level committees International grant finance Public information campaigns International grant finance Capacity building International grant finance Operating Costs - National Implementing Entity Operating Cost of Financing Facility Total-B: I3 + common + CB Total (A+B) National contribution National contribution 71
205 The source wise breakup of finance is summarized below: Source Value in USD International Grant Finance 19,616,000 International Loan Finance 8,722,500 National Contribution 7,387,200 Total cost of NAMA 35,725,700 Revolving loan additional 49,704,392 Total NAMA budget ,092 There are several risks regarding financing more sustainable activities in the CVC given the local character, small scale and competition with fossil (unsustainable) fuels and unregulated actors. This must be addressed in the development of policy and financial safeguards. Cess from charcoal production (county level) may be used to provide further resources for the RLFs, e.g. on a county level. International Grant finance is thus required for 16,856,000 USD. 7.8 Financial Requirements for the Interventions This NAMA Financing will directly contribute to the three interventions as well as the capacity building activities. The interventions will be executed under a long-term agreement between a private party and the appropriate governing authority of the NAMA (e.g. the Implementing Entity or the Financial Trustee). It is assumed that the private party of the Public-Private-Partnerships will be chosen through an appropriate selection process (e.g. using the point-based eligibility criteria described in Chapter 5). The measures are supporting activities that will enable the interventions to take place NAMA finance for the development of sustainable woodlots and efficient kilns Finance is needed for the development of sustainable woodlots and efficient charcoal production in the charcoal counties. The funding should be made available under administration on a county level. To fund the two revolving Loan Funds required for the transformation, international Loan Finance of a total of USD is required. This sum can be paid back at the end of the NAMA period. Table 7-4: Revolving Loan Fund flow for Woodlots Year NAMA Finance (A) Loans Repaid Yr 1 (B) Loans Repaid Yr 2 (C) Funds Available D=B+C Finance Required E=A-D , , , , , , ,435, , , , , ,382, , ,110 1,102, , ,642, , ,705 1,409, , ,512, , ,448 1,512, ,577, , ,276 1,577, ,545, , ,362 1,545,181 72
206 Year NAMA Finance (A) Loans Repaid Yr 1 (B) Loans Repaid Yr 2 (C) Funds Available D=B+C ,561, , ,819 1,561, ,553, , ,590 1,553, ,557, , ,705 1,557,352 Finance Required E=A-D ,555, , ,648 1,555, , ,676 1,556,338-1,556, , , ,662 TOTAL 16,514,121 Nil* The other Revolving Loan Fund supplies finance for investment in efficient kilns. Table 7-5: Revolving Loan Fund flow indicates the finance available for each year of the NAMA period. Table 7-5: Revolving Loan Fund flow for Kilns Year NAMA Finance (A) Loans Repaid Yr 1 (B) Loans Re-paid Yr 2 (C) Funds Available D=B+C Finance Required E=A-D , , ,534, , ,115, ,858, , , ,673, ,754,236 1,429, , , ,271,382 1,377,118 1,429, , ,012,809 1,635,691 1,377, ,142,095 1,506,405 1,635, ,077,452 1,571,048 1,506, ,109,774 1,538,726 1,571, ,093,613 1,554,887 1,538, ,101,693 1,546,807 1,554, ,097,653 1,550,847 1,546, ,548,827 1,550, ,099, ,548, ,548,827 TOTAL 32,890,271 Nil* 73
207 74
208 8 NAMA Implementation Structure The implementation structure of this NAMA envisages a framework in which the NAMA is implemented largely through already existing institutional frameworks. 8.1 Key operation bodies and implementing partners The NAMA implementation structure will be integrated into the climate change institutional framework(s) outlined in the 2016 Climate Change Act (GoK 2016). The Act crystalizes and gives legal teeth to institutional proposals outlined in the 2010 National Climate Change Response Strategy (NCCRS) and updated in the 2012 National Climate Change Action Plan (NCCAP). This is informed by the fact that the charcoal NAMA is a climate change mitigation action (NAMA) and must therefore be aligned with the broader national climate change governance and institutional framework. It will also be aligned and fit within the forests, REDD+, and charcoal management institutional frameworks since Intervention 1 of the NAMA involves sustainable biomass supply. Kenya s REDD+ Readiness Preparation Proposal (R-RP) notes that the policy, legal and institutional arrangements for REDD+ will fall under the institutional framework proposed by the 2010 National Climate Change Response Strategy (Gichu and Chapman 2014). Based on this, a four tiered REDD+ implementation structure made up of a National REDD+ Steering Committee, a Technical Working Group, a National REDD+ Coordination Office, and REDD+ Component Task Forces and County Level Contact Officers was proposed. Because intervention 1 has a lot in common with the REDD+ strategy not only in terms of mitigation objectives but also many shared implementing partners, it is important for issues of coherence, harmony and cost-effectiveness to closely align the charcoal NAMA implementation structure with that of the REDD+ while ensuring that they all accord with other relevant institutions necessary for implementing Interventions 2 and 3. Intervention 2 will be implemented largely through institutions linked to the energy sector such as the Ministry of Energy and Petroleum, Energy Regulatory Commission (ERC), etc. Intervention 3 involve aspects under the ambit of the Ministry for Industrialization (e.g. KEBS and KIRDI), Ministry of Environment, Water and Natural Resources, Ministry of trade on products regulation, The Ministry of Interior and Coordination of National Government for enforcement as well as the Ministry of Finance which handles finance-related aspects. Other stakeholders in the charcoal value chain (CVC) such as county governments, CFAs and CPAs, and the private sector among others are key in the implementation of the NAMA. To facilitate their effective representation and participation in the implementation of the NAMA, particularly in Intervention 3, CFAs and CPAs will be encouraged and supported to form national umbrella organization. CPAs will form a national umbrella organization similar to the National Association of Community Forest Associations (NACOFA). Such umbrella organizations will be recognized and included under the ongoing revision of the Charcoal Regulations. County governments are very crucial to the implementation of the NAMA. This NAMA considers their representation in the National Climate Change Council (NCCC) through the chairperson of the Council of Governors (CoG) as well as being executing entities at the county levels as allowing them effective participation at all levels, national and local. The following implementing agencies, using NAMA terminology, will be derived from the above proposed NAMA implementation framework. 75
209 Table 8-1: NAMA Implementing Agencies Role Institution National Designated Authority (NDA) National Climate Change Council (NCCC) National Implementing Entity (NIE) Kenya Forest Service (KFS), County Executive Committees (CEC) National Coordinating Authority (NCA) Climate Change Directorate (CCD) and KFS Financial Implementing Entity (FIE) Ministry of Finance/Treasury National Executing Entities (NEE) Ministry of Trade, The Ministry of Interior and Coordination of National Government -National Police Service, NEMA among several, depending on Intervention/Measure County Executing Entities (CEE) CEC and others decided by respective counties 8.2 NAMA operational and management system The NAMA implementation framework can be visualized as in Figure 8-1. Being a NAMA, the National Climate Change Council (NCCC) will be the NDA in charge of broad level policy guidance and strategic direction. The KFS, together with the CCD, will be the National Coordinating Authorities (NCA) responsible for ensuring that the various interventions and measures of the NAMA are implemented through the relevant implementing agencies. The advantage of this institutional arrangement is that KFS, a key player in the charcoal NAMA, is already under the Ministry responsible for climate change (Ministry of Environment, Water and Natural Resources, which is also a key member of the inter-ministerial NCCC and REDD+ National Steering Committee. The REDD+ NSC is chaired by the Principal Secretary in the Ministry responsible for forestry and its membership comprises Principal Secretaries from the Ministries in charge of Environment; Energy; Devolution and Planning; and Finance, as well as the Directors of KFS, KEFRI and NEMA. Others are international and local civil society organizations representative from Universities and research institution, UNDP/UNEP and the Donor Coordination Group; and the National Association of Community Forest Associations which represent biomass producers. On the other hand, the Climate Change Act (2016) establishes the Climate Change Directorate (CCD) under the Ministry responsible for climate affairs. The CCD shall be the lead agency of the government on national climate change plans and actions to deliver operational coordination. 76

210 Figure 8-1: Proposed Charcoal NAMA Implementation Framework 8.3 Phased Implementation Plan The three interventions under this charcoal NAMA will be implemented concurrently. However, to ensure effective and harmonized implementation, the policy and regulatory measures of all three interventions will first be reviewed and a concerted and integrated plan developed on which and how to develop any new policies and regulations or revise existing ones. Recognizing that such a review and possible development of new policies and regulations will most likely take some time to complete, a capacity needs assessment (CNA) will be undertaken concurrently, particularly for the key institutions and agencies identified in the NAMA implementation structure outlined above. Such a CNA will form the basis of the capacity building and awareness creation measures to be undertaken under this charcoal NAMA. The policy and regulatory measures, and the capacity building and awareness creation measures will have financial and other resource implications. Other activities within each of the three interventions will also have cost implications which are outlined in Section Implementation schedule The NAMA implementation will run for a 14-year period from 2017 to The NAMA duration is divided into two phases Preparation phase will run for six-years from 2017 to 2022 and the Transition phase will run from 2023 onwards. Overlaps regarding capacity building and regulation exist for practical reasons. Revision of regulations and enforcement strategies may also be necessary later in the Transition phase. Table 8-1 highlights the preliminary implementation schedule. Stakeholders at the validation workshop proposed a national workshop bringing together all key stakeholders to kick start the implementation of the NAMA. More detailed planning and roadmap for each of the interventions will be done by the respective institutions in charge. 77
211 The measures in each Intervention are divided under two phases, Preparation and Transition (see Table 8-1: Gantt scheme of the different phases of the transformation ( )). This first phase consists of sublevels Information and Demonstration. The second, Transition phase, marks the end of the Regulation measures, but includes the last years of Capacity building measures to allow for updates following early evaluations from the Transition period. The Information measures ( ) has a goal to make the general public aware of and able to react to the NAMA, and understand the potential of GoK means and plans, in order to achieve the goals of the NAMA. This means to create and reach out with adequate information regarding what is and will be regulated and promoted during each phase of the NAMA. This is important since the availability, price and possibly also the quality of charcoal may shift during different phases of the establishment of the new regime. The Demonstration measures ( ) have as a goal to enable the transition to a sustainable charcoal regime by demonstrating the virtues of the different methods and technologies included in the NAMA: sustainable biomass supply, efficient charcoal production as well as transparent methods for certification and labelling. The Capacity building measures ( ) serve to bring adequate knowledge to stakeholders in the face of change. This training is different for each of the interventions and will for the later years be adapted to experience gained during the first years. It is possible that training will be necessary for a longer time than planned for here. The Regulation measures ( ) serve to coordinate regulatory development across the ministries, to ensure incentives for an efficient and transparent CVC and disincentives for unsustainable and illegal practices. The Transition measures ( ) serve to further coordinate, adapt and add to what is already in place, to make sure that transformation (large scale change on a national level) will be completed during the second half of the NAMA. Table 8-1: Gantt scheme of the different phases of the transformation ( ) Year 20xx Preparation Information Demonstration Capacity building Regulation Transition The interventions and the respective measures, named according to phase, are described in chapter 5. 78
212 Table 8-2: NAMA Implementation Schedule Intervention and Measures Period (Preparation) (Transition) 1. Sustainable Policy and biomass regulatory measures supply 2. Efficient charcoal production 3. Certification and labelling scheme Capacity building and awareness creation Financial measures Policy and regulatory measures Capacity building and awareness creation Financial measures Policy and regulatory measures Capacity building and awareness creation Financial measures + Review and strengthening of various policies and regulations + Establishment of public demonstration woodlots +Research on various aspects including biomass, charcoal emissions and kiln technology +Setting up equipping implementing institutions +Set up of financial management institutions +Source for and access requisite funds + Regulate use of efficient kilns + Policy and fiscal measures to increase affordability of kilns + training manual developed + scheduled training with certification schemes for experts like inspectors +charcoal funds in annual budgets +fiscal measures to generate funds for charcoal +Establish a system of environmental standards and fiscal reform +Review specific policies and regulations +Develop guidelines on labels and packaging + Gazette the various Standards by KEBS Set up and equip implementing institutions +Set up of financial management institutions +Source for and access requisite funds +Strict enforcement and compliance with relevant policies and regulations +availability of data gaps for effective transformation shift The institutions implement their mandates The institutions implement their mandates Implement strategies for adoption of efficient kilns + Professionalism in charcoal sector including inspection + streamlined funding of charcoal sector/activities Implement the certification and labelling scheme The institutions implement their mandates The institutions implement their mandates 79
213 80
214 9 Measuring, Reporting & Verification A comprehensive MRV system is a crucial component of NAMA. As NAMA is an instrument of result based support, the results of implemented NAMA needs to be measurable, reportable and verifiable (MRV) to guarantee the sustainable success of the interventions introduced. The system for MRV for the NAMA is linked to REDD+ and will contribute to measurement of GHG related to charcoal production. It is also aligned with the National Performance and Benefit Measurement Framework (NPBMF) outlined in the National Climate Change Action Plan (NCCAP) and draws on ongoing initiatives such as the System for Land-Based Emission Estimation in Kenya (SLEEK). A suite of policy, legal and institutional reform necessary to effectively implement the NAMA policy framework and a budgeted action plan are recommended. Baselines will be established to facilitate monitoring, verification and reporting (MRV). 9.1 Measurement The methodology for measuring the impacts of this NAMA follows the general principles of transparency, reliability, and conservativeness. Hence, measurement of the following components is carried out as part of MRV system: GHG emissions reduction; Sustainable Development impacts; and Finance (support). However, measurement of these three components will be approached differently and with distinct sets of parameters and indicators. In addition to measuring the impacts of the NAMA, it will also monitor progress of implementation of the activities under the NAMA Emission reductions This charcoal NAMA has as one of its key objectives the reduction of GHG emissions from the charcoal sector. As such, all the three NAMA Interventions and related measures are all geared towards reducing GHG emissions in addition to realizing several sustainable development co-benefits. Intervention 1 of the NAMA is to educate, mandate and incentivize the development of sustainable biomass for charcoal production at different scales, which will reduce the amount of non-renewable biomass used and thus reduce deforestation, illegal logging and related GHG emissions. The shift in reduction of the amount of unsustainable biomass will be monitored through proxy data of policy initiatives, governance instruments, and institutions. Land cover and quantity of biomass will be measured through REDD+ MRV systems. Further, the second intervention aims at reducing the amount of GHG emitted during production, while securing the national demand for charcoal using a minimum of biomass (mainly fuelwood). The principal emission reductions from the Kenya charcoal NAMA thus depends on a transition to sustainable forestry for the sourcing of wood fuel for charcoal production. The combustion of renewable biomass has no net emissions of GHG to the atmosphere. Efficient kilns reduce GHG emissions in two ways. First, the more efficient pyrolysis process reduces the need for firewood to heat the process. Second, the release of GHG is lower since efficient kilns do not leak methane and unburnt gases, as these are recycled into the heat source (fire). 81
215 After establishing the baseline (number, type, and efficiency levels of kilns as at 2010), we will be able to measure the shift in GHG emissions as higher efficiency kilns are adopted. Emission reductions from the shift from traditional to efficient kilns will for the time up to the existence of a national certification scheme be monitored by proxy data from the annual county survey on charcoal production. The methodology for measuring the GHG emissions from biomass sourcing and charcoal production is described in chapter Data and parameters monitored In addition, the monitoring provisions in the tools and methodologies referred to in this methodology apply. Data / Parameter: Data unit: Description: Source of data: Measurement procedures (if any): Q CCP,i,y tonnes Produced quantity of charcoal product i in year y Measurement from project activity production The parameter can be monitored according to one of the following options: Option1: Direct measurement (e.g. use of a scale) of the weight of charcoal products supplied; Option 2: Calculation of the total weight of charcoal supplied; based on the total number of bags supplied and the average weight of charcoal product per bag. The weight of charcoal products per bag is determined on sample basis in accordance with the sampling standard (e.g. using systematic sampling method). 82 Option 2 can only be used if Option 1 is not available. Charcoal generated from only woody biomass is eligible for the case of micro-gasifier Monitoring frequency: in batches QA/QC procedures: - Any comment: - Data / Parameter: NCV charcoal,i Data unit: TJ/t Description: Net calorific value of the charcoal i produced Source of data: - Measurement The value can be determined according to one of the following options: procedures (if any): Option 1: monitored once during the first year of the crediting period. Measurement is undertaken in laboratories according to relevant national/international standards. Measure quarterly, taking at least three samples for each measurement. The average value can be used for the rest of the crediting period provided that there is no change in the biomass types used for charcoal i production. For the purpose of ex ante calculation, IPCC default value can be used. Option 2: using one of the options provided in appendix 1.
216 Monitoring frequency: QA/QC procedures: Any comment: - Data / Parameter: Data unit: Description: Source of data: Measurement procedures (if any): In case of charcoal generated from micro gasifier, Option 1 above or option 2 in appendix 1. Determination of net calorific value of charcoal shall be used Frequency depends on the option chosen above If option 1 is chosen, check the consistency of the measurements by comparing the measurement results with, relevant data sources (e.g. values in the literature, values used in the national GHG inventory) and default values by the IPCC. (If the measurement results differ significantly from previous measurements or other relevant data sources, conduct additional measurements or provide justification) Policy Management plan Number of management plans developed by CPAs County and KFS registry The parameter can be monitored according to one of the following options: Option1: Minutes of meetings of development plans Option 2: Sources of funding for developing the management plans Option 3. Approval process and documentation for the management plans Monitoring frequency: Biannual QA/QC procedures: -Relevant policies and regulations, minutes of meetings for participatory involvement of stakeholders Any comment: - Data / Parameter: Data unit: Description: Governance Establishment of institutions Institutions put in place to assist the implementation of NAMA including data collection as per the legal framework Source of data: Measurement procedures (if any): County registry, relevant Acts establishing the institutions, The parameter can be monitored according to one of the following options: Option1: Records of engagement with the CPGs and CPAs. Option 2: Annual society returns Option 3. County records Monitoring frequency: in batches QA/QC procedures: - Any comment: - Data / Parameter: Data unit: Description: Source of data: Measurement procedures (if any): Incentives Type or form of incentives established for all the three Interventions The different types or forms of incentives, how they are offered or made available, how they are designed, who is offering them Project activities, institutions involved, civil society, academia and other research institutions, beneficiaries The parameter can be monitored according to one of the following options: Option1: Interrogate relevant county and national government institutions 83
217 Option 2: Adoption or uptake of the incentives at different levels Option 3. Interrogate the capacity levels Monitoring frequency: Quarterly, bi-annually, or annually depending on the particular incentive QA/QC procedures: - Any comment: - Data / Parameter: Data unit: Description: Certification and labelling The systems established Different forms of certification and labelling established for sustainable biomass and efficient charcoal production technologies Source of data: Measurement procedures (if any): Records of relevant institutions, relevant Act(s) establishing the certification scheme, private sector and other third party stakeholders such as the FSC The parameter can be monitored according to one of the following options: Option1: Direct observation through market surveys to confirm existence of the certification, labels and packaging Option 2: Records of those issuing the certificates (FSC, KEBS, etc Option 3. Records of county governments, CPAs and CPGs. Option 4. Presence of a working system for monitoring and tracking the certified and labelled and charcoal Monitoring frequency: On a daily basis (by different enforcers e.g. police checking charcoal batches on transit using barcode readers), with weekly or monthly reviews of the system QA/QC procedures: -Sustainability and operational procedures of the certification and labelling system adopted -Relevant ISO certifications Any comment: Data and parameters not monitored In addition to the parameters listed in the tables below, the provisions on data and parameters not monitored in the tools and methodologies referred to in this methodology apply. Data / Parameter: CF Data unit: - Description: Default wood to charcoal conversion factor Source of data: - Measurement procedures (if any): A factor of six kg of firewood (wet basis) per kg of charcoal (dry basis). Alternatively, local conversion factors determined from a field study or literature may be applied Any comment: Refer to : The term wet basis assumes that the wood is air-dried as is specified in the IPCC default table Data / Parameter: NCVwood,default Data unit: TJ/t Description: Net calorific value of wood Source of data: - 84
218 Measurement Use a default value of TJ/t based on the gross weight of the procedures (if any): wood that is air-dried Any comment: - Data / Parameter: NCV charcoal,default Data unit: TJ/t Description: Default net calorific value of charcoal Source of data: - Measurement Use a default value provided in section 1 in appendix 1 procedures (if any): Any comment: - Data / Parameter: EF projected_fossilfuel Data unit: t CO2/TJ Description: Emission factor for the substitution of non-renewable woody biomass by similar consumers Source of data: - Measurement Use a default value of 81.6 procedures (if any): Any comment: - Data / Parameter: GWP CH4,y Data unit: t CO2e/t CH4 Description: Global warming potential of methane applicable to the crediting period Source of data: - Measurement - procedures (if any): Any comment: - Data / Parameter: Data unit: Description: M d tonne of CH4/tonne of raw material Factor to account for any legal requirement for capture and destruction of methane in the charcoal production facility. This parameters is equal to zero for the case of charcoal produced from micro-gasifier Source of data: - Measurement - procedures (if any): Any comment: Sustainable development A number of indicators will be used to represent the development during the period of the NAMA. Monitoring and surveys conducted to assess the situation in each county and/or nationally regarding the impact of the certification scheme on sustainable biomass sourcing and efficient charcoal production is crucial to the NAMA. Successes and challenges in implementation of the certification scheme, and remedial measures proposed by the relevant institutions and stakeholders, will be documented. The reporting will feed into the later stages of the NAMA implementation. In addition to GHG emissions, the MRV system will monitor the impacts of the NAMA interventions on the identified SD indicators. The indicators are listed in annex 6 and 7. The measurement process for these indicators is described below: 85
219 Data/Parameter: Data Unit: Description: Measurement and QC procedures (if any): Monitoring frequency: Data/Parameter: Data Unit: Description: Measurement and QC procedures (if any): Monitoring frequency: N WL Number of sustainable forestry woodlots for sourcing charcoal biomass Registered woodlots where production would conform to The MRV Cell will keep records of the number of woodlots The MRV Cell will prepare a record on an annual basis. N CBP,PS Number of people trained Number of people trained from the private sector. The MRV Cell will keep records on progress. Supporting documents such as minutes of discussions, programme reports and attendees lists will be kept for future verification. The MRV Cell will prepare a record on annual basis. Data/Parameter: Data Unit: Description: Measurement and QC procedures (if any): Monitoring frequency: N CBP,INST Number of people trained Number of technical staff and instructors trained in skills development for sustainable woodlots, efficient charcoal production and certification, labelling and packaging The MRV Cell will keep records on progress. Supporting documents such as minutes of discussions, programme reports and attendees lists will be kept for future verification. The MRV Cell will prepare a record on an annual basis. Data/Parameter: Data Unit: Description: Measurement and QC procedures (if any): Monitoring frequency: N CBP,RE Number of people trained Number of public sector staff trained as inspectors and for regulatory enforcement The MRV Cell will keep records. Supporting documents such as attendee lists will be kept for future verification. The MRV Cell will prepare a record on an annual basis. Data/Parameter: Data Unit: Description: Measurement and QC procedures (if any): Monitoring frequency: N jobs,all Number of jobs Number of jobs and business opportunities created for all The Kenya National Bureau of Statistics (KNBS) will carry out an annual assessment to find out the number of jobs (gender disaggregated) created by the NAMA interventions. KNBS will report these data to the MRV Cell annually. The MRV Cell will prepare a record on an annual basis. Data/Parameter: Data Unit: Description: N jobs,women Number of jobs Number of jobs and business opportunities created for women 86
220 Measurement and QC procedures (if any): Monitoring frequency: Data/Parameter: Data Unit: Description: Measurement and QC procedures (if any): Monitoring frequency: Data/Parameter: Data Unit: Description: Measurement and QC procedures (if any): Monitoring frequency: KNBS will carry out an annual assessment to find out the number of jobs for women created by the NAMA interventions. The KNBS will report these data to the MRV Cell annually. The MRV Cell will prepare a record on an annual basis. N OS,NAMA Organizational structure NAMA organizational structure NIE along with other key stakeholders including NCA and NAMA TWG will prepare documentation on the overall NAMA organizational structure. The MRV cell will prepare a record on an annual basis. N CBP,OS Number of capacity development programmes Capacity development programme for the NCA, the NIE and the MRV Cell The MRV Cell will keep records on it. Supporting documents such as minutes of discussions, programme reports and attendees lists will be kept for future verification. The MRV Cell will prepare a record on an annual basis. Data/Parameter: N MAC,WL, Data Unit: Number of woodlot demonstration sites Description: Marketing and awareness raising campaigns including demonstration activities Measurement and QC procedures (if any): The MRV Cell will keep records. Supporting documents such as minutes of discussions, programme reports and attendee lists will be kept for future verification. Monitoring frequency: MRV cell will prepare record on annual basis. Data/Parameter: N MAC,ECCP, Data Unit: Number of efficient charcoal production demonstration sites Description: Marketing and awareness raising campaigns including demonstration activities Measurement and QC procedures (if any): The MRV Cell will keep records on it. Supporting documents such as minutes of discussions, programme reports and attendee lists will be kept for future verification. Monitoring frequency: MRV cell will prepare record on annual basis. Data/Parameter: N MAC,AR, Data Unit: Number of awareness and information campaigns Description: Public and stakeholder awareness raising campaigns Measurement and QC procedures (if any): The MRV Cell will keep records Supporting documents such as programme reports and attendee lists will be kept for future verification. Monitoring frequency: MRV cell will prepare record on annual basis. 87
221 Data/Parameter: Data Unit: Description: Measurement and QC procedures (if any): Monitoring frequency: Data/Parameter: Data Unit: Description: Measurement and QC procedures (if any): Monitoring frequency: Data/Parameter: Data Unit: Description: Measurement and QC procedures (if any): Monitoring frequency: N MS,NCA Management system Overall operational management system of the NCA The NIE along with other key stakeholders including the NCA and the NAMA TWG will prepare documentation on the NCA operational management system. The MRV Cell will prepare a record on an annual basis. N MS,NIE Management system NIE overall operational management system The NIE along with other key stakeholders including The NCA and The NAMA TWG will prepare documentation on the NIE operational management system. The MRV Cell will prepare a record on an annual basis. N MS,NEE Management system NEE overall operational management system The NIE along with other key stakeholders including the NCA and the NAMA TWG will prepare documentation on the NEE operational management system. The MRV Cell will prepare a record on an annual basis Support Under the NAMA, financial support is considered as key and this can be monitored. Financial monitoring is to track the resources required and support received from national contribution and international donor(s). Data/Parameter: Data Unit: Description: Measurement and QC procedures (if any): Monitoring frequency: Data / Parameter: Data Unit: Description: Measurement and QC procedures (if any): Monitoring frequency: US$ International financial support spent per activity All finances disbursed need to be tracked as per the standard governmental tracking procedures. The document NAMAs Investor Guide 16 will provide the guidance to track this support. The Trustee will be responsible for tracking this support. Measured continuously and recorded annually US$ National financial support spent per activity All finances disbursed need to be tracked as per the standard governmental tracking procedures. The NAMAs Investor Guide will provide the guidance to track this support. The Trustee will be responsible for tracking this support. Measured continuously and recorded annually 88

222 9.1.4 Transformative change It is expected that the NAMA will change public perception of CC as a nationally produced good, which can be produced legally and sustainably with the cooperation of the regulator, law enforcement and the consuming public. The transformation to sustainable sourced and efficiently produced charcoal will reduce the carbon emissions to a small fraction of the present, while maintaining the yield. Along with this, the NAMA will create jobs, providing rural employment. In synergy with the Kenya Household Energy NAMA, consumers can move away from practices resulting in unacceptably high GHG emissions, indoor air pollution which damages health and forest cover, with its significant environmental impact. The achievements regarding transformative change will be monitored for each type of change identified in the NAMA, as well as for each segment of the CVC. 9.2 Reporting Process and plan for reporting The data management and reporting system of the MRV structure, at the centre of which sits the MRV Cell, includes the entities shown in Figure 9-1. Figure 9-1: Components of the MRV Data Management and Reporting System As the large and medium sized woodlots will be the main units under the NAMA, data collection and data recording will happen directly in the large and medium sized lots through dedicated MRV personnel using data management software, a unique identification system and other relevant information (e.g. contact information on logging and sale, loan amounts, etc.). Each large woodlot will be monitored by personnel from the MRV Cell who will be responsible for data collection from the NEEs. As part of the MRV structure, an internet enabled MRV framework along with a Central Monitoring System (CMS) will be established. The geographical spread of the woodlots and charcoal production units will make the decentralized aggregation of data both desirable and feasible before it is collated in a CMS located in 89


223 the NIE offices. The process of data collection and reporting will follow the following sequence (Figure 9-2). 1. NEEs operating in the counties monitor data according to the monitoring plan and ensure they fulfil all requirements such as record keeping and quality control. 2. The county office/officer representative responsible for MRV collects data from the NEEs on the parameters to be monitored and feed them into the CMS on monthly basis. 3. The official from the MRV Cell based in the county office reports the results of the monitoring to the MRV Cell in an annual report. The minimum information to be provided in these reports is listed in Section on reporting forms. 4. The MRV Cell compiles these annual reports along with the monthly data fed into the CMS. It also combines the findings in the reports and summarizes them in an annual NAMA monitoring report. This annual NAMA monitoring report will contain information on GHG emissions reductions, progress on the SD indicators, and the financial performance of those engaged in NAMA activities. The MRV Cell may hire an international consultant for preparation of this annual report. Finally, the MRV Cell will submit this report to the NCA for checking and approval. 5. The NCA checks the NAMA monitoring report in accordance with the quality assurance/quality control (QA/QC) process mentioned in the monitoring plan and approves the report. 6. The NIE along with the MRV Cell arranges for an external entity to undertake independent verification of the annual NAMA monitoring report. 7. The final NAMA monitoring report together with the report of the external verifier is submitted to NAMA donor(s) by the NCA Figure 9-2: The Reporting Process a a MRVcounty = The official from the MRV Cell based in the (each) county. 90
224 9.2.2 Reporting forms The MRV Cell is charged with creating reporting form templates. These forms will include at a minimum the following information: Details about the charcoal production technologies (i.e. technology code, unique identification number etc.) and the conditions for sustainable sourcing (woodlot organization); County responsible contact details; Description of the measuring system; Data parameters measured; The default values applied; Calculations of emissions reductions. The reporting form template will be provided to the NEEs by the MRV Cell. NEEs submit the completed form to the MRV Cell annually. 9.3 Verification and Evaluation The goal of verification is to have an independent third party auditor ensure that the NAMA is operating as planned and that the measuring and reporting system is being implemented as planned. Verification also ensures that emissions reductions and SD benefits are real and measurable. Auditors should be accredited entities. They can be entities accredited under the CDM or under another accreditation system acceptable to the Government of Kenya and the NAMA donor(s). Verification should occur every two years. The verification will consist of: Desk review of documents; Interviews with key stakeholders; Site visits to demonstration woodlots and charcoal production sites; The drafting of the verification report; Provision of feedback on the report by the NIE, the NCA and the Trustee; Finalization of the verification report. The verification boundary will primarily consist of sourcing and production sites, and the Central Monitoring System including registry for certified producers of biomass and charcoal. The verification report will contain an assessment of the performance of the NAMA and the extent to which it has contributed to the outcomes set out in the monitoring plan. 91
225 92
226 References Bailis, R. (2005). Fuel from the Savannah: the Social and Environmental implications of the Charcoal Trade in Sub-Saharan Africa. Berkeley: University of California (Doctoral dissertation). Bailis, R. (2011). Naroks charcoal commodity chain: land use change and charcoal production in southwestern Kenya. ATBC & SCB Conference. Arusha: Association for Tropical Biology and the Society for Conservation Biology (Africa Section). Basu, A., Blodgett, C., Müller, N., & Soezer, N. (2013). Nationally Appropriate Mitigation Action Study on Sustainable Charcoal in Uganda. New York: UNDP. Retrieved from %20Facility/CharcoalNAMAstudy_9Jan2013.pdf Bautista et al. (2009). Indoor charcoal smoke and acute respiratory infections in young children in the Dominican Republic. American Journal of Epidemiology, 169(5), Business Daily Africa. (2011). Unique biofuel warms its way to kitchen as search for green energy hots up. Retrieved from Business Daily Africa: CAMCO. (2013). ANALYSIS OF THE CHARCOAL VALUE CHAIN IN KENYA. Study on behalf of the Ministry of Environment, Water and Natural Resources. Retrieved from KFS: f Cerin, P., & Dobers, P. (2008). EDITORIAL: The Contribution of Sustainable Investments to Sustainable Development. Progress in Industrial Ecology, Volume 5, No. 3, Dalberg. (2013). GLPGP Kenya Market Assessment (Global LPG Partnership). Dalberg Consultants. Dam et al. (2008). Overview of recent developments in sustainable biomass certification. Biomass and energy 32, Falzon, J., Veum, K., van Tilburg, X., Halstead, M., Bristow, S., Owino, T.,... Olum, P. (2014). NAMA for accelerated geothermal electricity development in Kenya: Supporting Kenya's 5000+MW in 40 months initiative and Vision Retrieved from FAO. (2010). Global Forest Resources Assessment. Retrieved from FAO. (Undated). The Role of Wood Energy in Africa, Apendix 1: Definitions, Conventions and Conversion Factors. Retrieved from FSC. (undated). FSC's impact on the ground: rescuing species and preserving traditions. Retrieved from Gichu, A., & Chapman, S. (2014). Overview of REDD+ in Kenya, REDD+ Law Project - Briefing Paper. Retrieved from Gichuki, L. (2015). Draft Charcoal Rules And Regulations Retrieved from KFWG: GLPGP. (2015). Ghana LPG Partnership. Retrieved from 5BgNHNoY0ZyWlR4R1U/edit GoK. (2004). Sessional Paper No. 4 on Energy. Nairobi : Ministry of Energy. GoK. (2010a). National Climate Change Respnse Strategy. Ministry of Environment and Natural Resources. Nairobi. 93
227 GoK. (2010b). The Constitution of Kenya. Nairobi: National Council for Law Reporting. GoK. (2012). Forest (Charcoal) Rules, 2009 (Revised 2012). Retrieved from GoK. (2013a). National Climate Change Action Plan (NCCAP) Retrieved from Ministry of Environment, Water and Mineral Resources: GoK. (2013b). National Environment Policy 2013., Nairobi.. Retrieved from Ministry of Environment, Water and Natural Resources. GoK. (2015a). Kenya s Intended Nationally Determined Contribution (INDC). Retrieved from UNFCCC: pdf GoK. (2015b). The Environmental Management and Coordination (Amendment) Act, Retrieved from NEMA: 15.pdf GoK. (2015c). Kenya Green Economy Strategy and Implementation Plan (GESIP), Maanzoni-1 Draft. Nairobi. Retrieved from Economy-Strategy-and-Implementation-Plan-GESIP-.pdf GoK. (2016, May 13). The Climate Change Act Kenya Gazette Supplement No. 68 (Acts No. 11). Nairobi. Retrieved from Gordon et al. (2014, October). Respiratory risks from household air pollution in low and middle income countries. The Lancet, Respiratory Medicine, 2(10), Grieshop, A., Marshall, J., & Kandlikar, M. (2011). Health and climate benefits of cook stove replacement options. Energy Policy, 39, Retrieved from GVEP. (2010). Kenya Briquette Industry Study. Global Village Energy Partnership. ICRAF/SEI. (2014). Achieving sustainable charcoal in Kenya - Harnessing the opportunities for crosssectoral integration. Retrieved from SEI International: IPCC. (1996). IPCC Guidelines for National Greenhouse Gas Inventories.. Retrieved from IPCC: ISO. (2012). How ISO Standards Help: Environmental labels and Declarations. Retrieved from KEFRI. (2014, July). DRYLANDS FOREST LIVELIHOODS. FACTSHEET NO.2: Charcoal. Retrieved from KEFRI: KENDBIP. (2016). Retrieved from Kenya National Domestic Biogas Programme: KFS, undated. (n.d.). Available charcoal production technologies IN KENYA, report for UNDP (Draft Copy). Retrieved 09 01, 2015, from UNDP: kilns_study-1-.pdf Lusambo, P., Monela, G., & Katani, J. (2007). Socio-Economic Analysis of Land Use Factors Causing Degradation and Deforestation of Miombo Woodlands in Kilosa DIstrict, Tanzania. Journal of Forestry and Nature Conservation, 76(1). MEWNR. (2013). Analysis of demand and supply of wood products In Kenya. Kenya Ministry of Environment, Water and Natural Resources (report authored by Wanleys Consultancy Services). 94
228 Mugo, F., & Gathui, T. (2010). Biomass energy use in Kenya - Prepared for International Institute for Environment and Development (IIED) for an international ESPA workshop on biomass energy, October 2010, Edinburgh. Kenya: Practical Action. Retrieved from Mugo, F. & Ong, C. (2006). Lessons from eastern Africa s unsustainable charcoal business. World agroforestry Centre. Retrived from: d=y Mwampamba, T. (2007). Has the woodfuel crisis returned? Urban charcoal consumption in Tanzania and its implications to present and future forest availability. Energy Policy, 35, Retrieved from Tanzania.pdf Njenga, M., Karanja, N., Munster, C., Livama, M., Neufeldt, H., Kithinji, J., & Jamadass, R. (2013a). Charcoal production and strategies to enhance its sustainability in Kenya. Development in Practice, 23(3), Njenga, M., Yonemitsu, A., Karanja, N., Iiyama, M., Kithinji, J., Dubbeling, M., Jamnadass, R. (2013b). Implications of Charcoal Briquette Produced by Local Communities on Livelihoods and Environment in Nairobi, Kenya. International Journal of Renewable Energy, 2(1). Nyeng, F.O. (1999). Household energy demand and environmental management in Kenya. PhD Thesis Owen, M. (2013). Support to forest sector reform in Kenya. Retrieved from file:///c:/users/val%c3%a9rie.morgan/downloads/mmmb%20programme%20document%20- %20Very%20Final%20_Corrected%20(1).pdf Practical Action. (2010). Promoting Sustainable Charcoal Production and Marketing in Kenya: A Comparative Analysis through Participatory Market Mapping. Eastern Africa: PISCES. Practical Action. (2012). Sustainable Feedstock Management for Charcoal Production in Kenya - Resources, Initiatives and Options. Working Brief. Retrieved from SalvaTerra and FoTea. (2015). Opportunities for improving efficiency in forestry operations and forest products processing in Kenya. UN-REDD. Retrieved from /unep-publications/improving-efficiency-forestry-operations-and-forest-product-processing SLEEK. (2016, July). System for Land-Based Emissions Estimation in Kenya. Retrieved from Standing & Gachanja, 2014, The political economy of REDD+ in Kenya Identifying and responding to corruption challenges. U4 Issue March 2014 No 3 UNDP. (2013). Guidance for NAMA Design: Building on Country Experiences. Retrieved from UNEP. (2005). Selection, Design and Implementation of Economiv Instruments in the Solid Waste Management Sector in Kenya: The Case of Plastic Bags. Retrieved from UNEP. (2014). Green Economy Assessment Report - Kenya. Retrieved from UNEP, the Katoomba Group, Forest Trends. (2008). Payments for Ecosystem Services: Getting Started A Primer. Nairobi: UNON. Retrieved from UNFCCC. (2006). Definition of Renewable Biomass. CDM Executive Board Report (EB23), Annex 18. Retrieved from 95
229 UNFCCC. (2015). Compilation of information on NAMAs to be implemented by developing country parties. UNFCCC Secretariat. Retrieved from 96
230 97
231 98

232 REPUBLIC OF KENYA THE NATIONAL TREASURY MEDIUM TERM 2017 BUDGET POLICY STATEMENT CONSOLIDATING ECONOMIC GAINS IN AN ENVIRONMENT OF SUBDUED GLOBAL DEMAND November 2016
233 Budget Policy Statement (BPS) 2017 To obtain copies of the document, please contact: Public Relations Office The National Treasury Treasury Building P. O. Box NAIROBI, KENYA Tel: Fax: The document is also available on the website at: Budget Policy Statement
234 Foreword The 2017 Budget Policy Statement (BPS) is prepared against a backdrop of slow global economic growth owing to a more subdued outlook for advanced economies following the UK vote in favour of leaving the European Union (Brexit), weaker than expected growth in the United States, and a sharp slowdown among Sub- Saharan African economies especially commodity exporters. However, the Kenyan economy remains resilient registering strong economic growth of 5.6 percent in 2015 compared to the average growth of 3.4 percent for Sub Saharan Africa and 3.2 percent for global economy. Further, our macroeconomic performance remains broadly stable with overall inflation within target, Kenya Shilling exchange rate to the US dollar remaining stable and low short term interest rates, a reflection of ample liquidity in the money market. The economy is projected to grow at 6.0 percent in 2016 and over 6.5 percent in the medium term. This BPS also comes at the brink of completion of the Second Medium Term Plan (MTP II) ( ). The preparation of the third Medium Term Plan (MTP III) of the Kenya Vision 2030 for the period has commenced with a midterm review of MTP II by taking stock of the milestones achieved so far and transiting to MTP III. As such, the policy goals, priority programs and fiscal framework in this BPS are revised to reflect emerging realities and priorities in the MTP. The fiscal framework will ensure sustainable debt and improvement in expenditure management. In particular, we plan to gradually lower our fiscal deficit (by closing the gap between revenue and expenditure), over the medium term, while at the same time providing sufficient room to finance productive expenditure so as to sustain equitable growth. Further, expenditures will be scrutinized carefully to ensure quality and alignment to the government economic transformation agenda as outlined in the MTP and strategic interventions of national interest. The MTP III will mainstream the Sustainable Development Goals (SDGs) based on key thematic areas that include advocacy and awareness creation; domestication and localizing SDGs; capacity building; stakeholder mapping and engagement; monitoring and reporting, and resource mobilization. This being the fourth BPS since the onset of the economic transformation agenda, tremendous achievements have been realized from the past investments. These include among others: improved infrastructure particularly construction of Standard Gauge Railway which is nearly complete, construction of 1,194km of new roads, rehabilitation of 523km of existing roads, completion of the first phase of second container terminal at the Mombasa port, an addition of 615MW of electricity to the national grid and an enhanced electricity connection. We have also greatly improved the business environment for investment opportunities, enhanced security through modernizing police equipment and improving police mobility, and heightened the fight against corruption. Going forward, spending on infrastructure, education, health and social safety net and preparations for the elections remains a priority. Implementation of priority programs will be monitored closely so as to realise benefits and maintain positive growth momentum, create jobs, reduce poverty and inequality Budget Policy Statement
235 The policy intentions outlined in this BPS have benefited from wide consultations. I would like to thank the President and the Deputy President for the effective leadership in putting together this document. To my cabinet colleagues, staff of the National Treasury and other government officials, Asante Sana for your contributions and understanding as we build a united and prosperous Kenya. HENRY K. ROTICH, EGH CABINET SECRETARY/THE NATIONAL TREASURY Budget Policy Statement
236 Acknowledgement The 2017 Budget Policy Statement (BPS) is prepared in accordance with the Public Finance Management (PFM) Act, It outlines the current state of the economy and outlook over the medium term, broad macroeconomic issues and medium term fiscal framework, the set strategic priorities and policy goals together with a summary of Government spending plans, as a basis of the FY 2017/18 budget. The document is expected to improve the public s understanding of Kenya s public finances and guide public debate on economic and development matters. Over the 2013/ /16 Medium Term Expenditure Framework (MTEF), the government has funded priority programs that are supportive of accelerated inclusive growth and development. The programs are carefully assessed before funding to ensure they are in line with the broad economic transformation agenda. The key programs implemented are aimed at creating conducive business environment, developing infrastructure to support manufacturing and industrialization, transforming agriculture, provision of better social services and rural development through devolution. The key achievements realised under the prioritized programs include: improved security infrastructure and police capacity in the country in order to secure citizens, investors, investments and boost investor s confidence; development of road network, rail and ports to decongest major cities and open up Kenya for trade at home and with our neighbours. To this end, implementation of phase one of the SGR project is progressing on well and H.E The President recently launched phase two which will link the planned special industrial zone in Naivasha to Nairobi and Mombasa. In addition, the government is on course to provide quality and affordable energy through exploiting the vast potential in geothermal, wind and solar energy and transformation of the Agricultural sector towards mechanization to ensure food security is ongoing. On social services, the government has made great progress in improving welfare of all Kenyans through improved services in health care and education and caring for the vulnerable groups through cash transfers. Our financial sector has attained notable achievements in increasing financial access among Kenyans. We are ranked number 50 out of 138 countries for financial market development and our capital market was voted the most innovative in Africa in Devolution has led to distribution of resources and development to all corners of the country. The national government is committed to build capacity in the counties to enhance resource management, raise own source revenue and entrench good governance in all institutions and fight against economic crimes. The government will continue to implement priority programs to raise productivity and economy-wide efficiency for sustainable and inclusive growth. The preparation of the 2017 BPS was a collaborative effort among various Government Agencies. We are grateful for their inputs. We thank all the spending units, the Ministries, Government Departments and Agencies for timely provision Budget Policy Statement
237 of information. We are also grateful for the comments from the Macro Working Group and Public Sector Hearings of October 2016 which provided inputs to this 2017 BPS, in addition to comments from the public. A core team in the National Treasury spent substantial amount of time putting together this BPS. We are particularly grateful to them for their tireless efforts in ensuring that this document was produced in time and is of high quality. DR. KAMAU THUGGE, CBS PRINCIPAL SECRETARY/THE NATIONAL TREASURY Budget Policy Statement
238 Table of Contents Foreword Acknowledgement... 5 Table of Contents... 7 I. CONSOLIDATING ECONOMIC GAINS IN AN ENVIRONMENT OF SUBDUED GLOBAL DEMAND Overview Sustaining Conducive Business Environment for Investment Opportunities Continued spending in Infrastructure to Unlock Constraints to Growth Sustaining Sectoral Spending for Employment Creation Sustained Investment in Social Services for the Welfare of Kenyans Enhancing Service Delivery through Devolution Structural Reforms II. RECENT ECONOMIC DEVELOPMENTS AND MEDIUM TERM OUTLOOK Overview Recent Economic Developments Fiscal Performance in FY 2016/ FY 2016/17 Revised Fiscal Estimates Adherence to Fiscal Responsibility Principles Economic Outlook External Environment Kenya s Macroeconomic Prospects Risks to the Economic Outlook Fiscal Policy and Outlook Deficit Financing Policy III. FY 2017/18 BUDGET AND THE MEDIUM TERM Budgetary Allocations for the FY 2017/ /20 MTEF Details of Sector Priorities Public Participation/ Sector Hearings and Involvement of Stakeholders IV. COUNTY FINANCIAL MANAGEMENT AND DIVISION OF REVENUE Performance of County Governments in FY 2015/ County Governments compliance with fiscal responsibility principles Compliance with the requirement for development spending allocations Compliance with requirements on recurrent spending and salary costs Prudent management of fiscal risks Enhancement of counties own-source revenues and ensuring predictability in taxes Short term borrowing by County Governments for management of cash flows Finalizing the transfer of assets and liabilities to the counties Vertical Division of Revenue Horizontal allocation of revenue Conclusion ANNEX 1: STATEMENT OF SPECIFIC FISCAL RISKS Budget Policy Statement
239 ANNEX TABLES Annex Table 1: Macroeconomic Indicators, 2014/ / Annex Table 2: Government Fiscal Operations, Ksh Billions Annex Table 3: Government Fiscal Operations, Percent of GDP Annex Table 4: Summary of Expenditure by Programmes, 2016/ /20 (Ksh Million) Budget Policy Statement
240 About the Budget Policy Statement The budget policy statement (BPS) is a government policy document that sets out the broad strategic priorities and policy goals that will guide the national government and the county governments in preparing their budgets both for the following financial year and over the medium term. In the document, adherence to the fiscal responsibility principles is explained to demonstrate prudent and transparent management of public resources in line with the Constitution and the Public Finance Management (PFM) Act, Section 25 of the Public Finance Management Act, 2012, provides that the National Treasury shall prepare and submit to Cabinet the Budget Policy Statement for approval. Subsequently, the approved BPS is submitted to Parliament, by the 15th February in each year. Parliament shall, not later than 14 days after the BPS is submitted, table and discuss a report containing its recommendations and pass a resolution to adopt it with or without amendments. The Cabinet Secretary shall take into account resolutions passed by Parliament in finalizing the budget for the relevant financial year. The budget calendar for the FY 2017/18 has been adjusted to take into account the general elections to be conducted in The Budget Policy Statement contains: (a) an assessment of the current state of the economy and the financial outlook over the medium term, including macroeconomic forecasts; (b) the financial outlook with respect to Government revenue, expenditures and borrowing for the next financial year and over the medium term; (c) the proposed expenditure limits for the national government, including those of Parliament and the Judiciary and indicative transfers to county governments; (d) the fiscal responsibility principles and financial objectives over the medium term including limits on total annual debt; and (e) Statement of Specific Risks. The preparation of the BPS is a consultative process that involves seeking and taking into account the views of: the Commission on Revenue Allocation; County governments; Controller of Budget; Parliamentary Service Commission; Judicial Service Commission; the public and any other interested persons or groups Budget Policy Statement
241 I. CONSOLIDATING ECONOMIC GAINS IN AN ENVIRONMENT OF SUBDUED GLOBAL DEMAND 1.1 Overview 1. The global economy is experiencing a period of growth slowdown in the volume of international trade mainly driven by subdued demand, particularly in investment, which is necessary for generating international trade flows in the form of capital goods and intermediate inputs. 2. Domestically, despite the improvements in growth over the last few years, we are yet to reach our optimal levels and hence the need to tackle the challenges that hinder us from operating optimally. Some of the constraints as identified in the previous budget policy statements include: business environment; infrastructure; agriculture; devolution and social services. The government therefore, requires focused measures aimed at tackling the constraints and advancing structural reforms to substantially unlock the growth potential and reduce unemployment and poverty. 3. In this regard, implementation of the Vision 2030, and in particular the five pillars of the economic transformation agenda, namely: creating conducive business environment; developing infrastructure for growth of industries; transforming agriculture to sustain growth; supporting manufacturing to create employment; investing in quality, accessible and relevant social services; and enhancing rural economic development through consolidating gains made in devolution will ensure that Kenya makes social progress and build a competitive economy. 4. This Budget Policy Statement therefore builds on the commitments made by the government in the last BPS of implementing programs to raise productivity and economy-wide efficiency, thereby sustaining high and inclusive growth in line with aspirations of Vision The preparation of the third Medium Term Plan (MTP III) of the Kenya Vision 2030 for the period has commenced with a concept note that will be finalized after incorporating stakeholder comments both at the national and county levels. 6. On the Post-2015 development agenda, the 17 Sustainable Development Goals (SDGs) and respective 169 targets and 230 indicators will be mainstreamed into the MTP III and County Integrated Development Plans (CIDPs). The SDGs will be mainstreamed based on key thematic areas that include advocacy and awareness creation; domestication and localizing SDGs; capacity building; stakeholder mapping and engagement; monitoring and reporting and resource mobilization. 1.2 Sustaining Conducive Business Environment for Investment Opportunities 7. This thematic area continues to focus on sustaining conducive business environment by maintaining macroeconomic stability and enhancing security so as Budget Policy Statement
242 to promote sustainable growth and encourage investment opportunities in the country. Macroeconomic Stability for Sustained Growth and Development 8. The Government has established a strong track record of macroeconomic stability for sustained and inclusive development. In order to sustain this effort going forward, the Government will continue to implement prudent fiscal and monetary policies that are supportive of accelerated inclusive growth and development. 9. To anchor macroeconomic stability, the fiscal policy strategy recognizes the need to efficiently apply the limited resources on priority programs with the highest impact on the stated objectives, but within a medium term framework of sustainable debt and strong financial position. As outlined in 2016 BPS, this will be achieved by further rationalization and alignment of programs and resources to the priorities undertaken by the spending Ministries, Departments/Agencies to deliver desired outcomes economically and efficiently. 10. Monetary policy stance will aim to maintain overall month-on-month inflation rate within the Government s target range of 2.5 percent on either side of 5.0 percent target and ensure that movements in the short-term interest rates support the objective of price stability. The level of foreign exchange reserves together with the Precautionary Arrangements with the IMF will continue to provide an adequate buffer against short-term shocks. The annual growth in credit to the private sector is projected to pick up gradually in the year to June Overall macroeconomic stability and sustainability of public debt will be supported by continued coordination of fiscal and monetary policies. The National Treasury will continue to work closely with the Central Bank of Kenya and Kenya Revenue Authority to strengthen the coordination between fiscal and monetary policies. Enhancing Security for Sustained Growth and Employment 12. Kenya is part of the global community and is susceptible to various security challenges including terrorism and the radicalization of young men and women. Recognizing the importance of security in sustaining economic growth and attracting investments, the Government remains committed to reducing incidences of crime and insecurity. 13. Some of the achievements realised in this sector include: enhanced surveillance system especially in urban areas, investment in street lighting in major cities and towns, establishment of command and control centre, expansion of police training facilities, acquisition of police patrol vehicles and motorbikes and vehicles for National Government officers and motorbikes for chiefs and assistant chiefs, enhanced connection of the Integrated Population Registration System (IPRS) to agencies and launch of e-passport. In addition, the government has improved police welfare through provision of comprehensive life and medical insurance cover and construction of housing units, recruitment of more police Budget Policy Statement
243 officers hence improving on police to population ratio. Further the Government has restructured the National Government Administration (NGA) thereby improving efficiency and service delivery to the people. 14. Going forward, the Government will continue focusing on the following areas; scaling-up investments towards modernization of security systems aimed at strengthening security of our borders and throughout the country, enhanced security operations, especially of areas prone to crimes; building capacity for effective and faster investigation, and strengthening coordination among security agencies with stronger partnership with communities. The Government will further invest in ICT to facilitate timely access to crime scenes through comprehensive mapping of crime and its incidences over time. This database would then be applied to facilitate improved planning, deployment of assets and performance management as it would be possible to understand why and how crime occurs. 15. In addition to the above, the government will further implement the following reforms over the medium term to enhance security: capacity enhancement of NGA to improve coordination of National Government functions, acquisition of vehicles and motorbikes for the newly recruited assistant county commissioners and assistant chiefs, creation of infrastructure Security Unit to safeguard the numerous Government projects such as roads, dams and ports, continued and sustained public sector reforms, increase public awareness, partnerships and stakeholder s engagements. 1.3 Continued spending in Infrastructure to Unlock Constraints to Growth 16. In order to support a rapidly-growing economy as envisaged in the Kenya Vision 2030, the Government will continue to sustain and expand the on-going public investments in road, rail, energy and water supplies. Further Expanding Road Network 17. Great strides have been made in the road construction and rehabilitation which include construction of new roads, rehabilitation and maintenance of existing roads. The major achievements include the construction of 1,194km of new roads, rehabilitation of 523km of existing roads, and maintenance of 149,604km of roads. 18. Over the medium term, the strategy is to expand, modernize and maintain the road transport in order to have an effective, efficient and secure road network. Further, we aim to, strengthen the institutional framework for road development and accelerate the speed of completion of road construction projects, and step up road transport safety and regulations. 19. To this effect, in the FY 2017/18 the Government has earmarked to construct 1,138km of low volume seal roads to enhance rural connectivity, 1,768km of new roads and 41 footbridges, rehabilitate 224km of roads, and maintain an additional 36,225km of roads to facilitate efficient movement of goods and people Budget Policy Statement
244 20. The Government is committed to decongest major urban centres through the expansion of major roads in urban areas, such as the Outering road in Nairobi City and Mombasa road section dual carriage way. To further decongest the City of Nairobi and improve traffic flow, the Government will fast track the construction of Ngong Road, the improvement of road junctions and construction of missing-link roads and non-motorised transport facilities. 21. In order to boost regional trade, the Government will prioritize the advancement of the LAPSSET project implementation on the first three berths at the port of Lamu and the construction of major roads under the East African and Transport Facilitation Programs and the South Sudan East African Regional Transport, Trade and Development Facilitation Program. Rail, Marine and Air Transport Standard Gauge Railway 22. The Government s commitment to develop and manage efficient and safe railway transport is clearly demonstrated by the pace of the construction of the Standard Gauge Railway (SGR) from Mombasa to Nairobi which is nearly complete and is expected to be completed by mid Construction works for the second phase (Nairobi Naivasha section of 120kms) of the SGR project was officially launched by the President on October 19, This extension will link special industrial zones that would be established in Naivasha, home to the Olkaria geothermal power plants, to Nairobi and Mombasa. Sea Ports 23. The Government has made good progress on reforms and modernization of the port of Mombasa, especially in expansion of the container terminals and cargo handling and storage, which has reduced significantly time to clear cargo. The first phase of the second container terminal has been completed which is capable of handling fourth generation vessels of 60,000 twenty foot equivalent units (TEUs) capacity. Moreover, the Kipevu Oil Terminal will be relocated to a more suitable location to allow for expansion. The multi-billion shilling project will involve the decommissioning of the existing Kipevu Oil Terminal and the construction of an off-shore jetty near Dongo Kundu. In addition, a framework has been developed to encourage private investments and participation in port expansion and port operations. 24. These developments, together with the integration of the single window system with other related systems to facilitate faster, efficient and competitive clearance of cargo, will ultimately position the port of Mombasa as a preferred hub in Eastern and Central Africa. The Government will continue to develop several commercial ports within the next 5 years, including the Lamu Mega Port, Kisumu Port as well as other smaller but highly developed ports along the coastline Budget Policy Statement
245 Airports 25. Kenya aims to entrench her position as undisputable regional aviation hub by expanding, modernizing and managing the aviation sector. The screening yard and security toll gate at Jomo Kenyatta International Airport (JKIA) has been completed while rehabilitation work at the five airstrips (Nanyuki, Ikanga, Lodwar, Embu and Malindi) and expansion and modernization of Isiolo and Kisumu airports are ongoing. Going forward, the Government will further scale up the ongoing airports expansion and modernization; commence work on the JKIA Second runway for completion by end of the year The Government also plans to commence the expansion of the Eldoret International Airport to enable large cargo planes to land and position it as a transport hub. Access to Adequate, Affordable and Reliable Energy Supply 26. The realisation of the development objectives set out in the Government s economic transformation agenda and Vision 2030 will be feasible if quality energy services are availed in a sustainable, competitive, cost effective and affordable manner to all sectors of the economy. 27. The Government s commitment to provide affordable and competitive electrical energy remains on course. Significant progress has been made towards generation of 5000 MW of power. Already, a program to add adequate power generation is on-going, and since March 2013, more than 615 MW of electricity have been added to the national grid; of which, 371 MW are from geothermal. With this additional power, total power available on the national grid is 2,282MW and this has significantly reduced the cost of power. 28. The Government has also continued to raise its power production by further exploiting the vast geothermal, wind and solar resources that Kenya is endowed with. These resources are expected to increase the clean energy mix cementing Kenya s position as a world leader in renewable energy. 29. Going forward, the Government will continue to invest in the construction of more electricity substations, transmission lines, and distribution transformers to boost the availability of electricity and to sustain demand. To date, the Government has constructed and upgraded more than 81 power substations between 2013 and June The additional power supply has significantly widened access to power, reduced the cost of doing business, and spurred growth of enterprises, and expanded the consumer base from 2.2 million households in March 2013 to 4.9 million households in June In addition, more than 22,245 primary schools have been connected to the power grid to facilitate the digital literacy programme and 810 public institutions have been connected to alternative (solar) power. 30. To conserve the environment and encourage value addition, the Government will continue to improve access to clean alternative energy through connection of more public institutions with solar energy, installation and maintenance of wind masts and data loggers. The Government will also connect an additional 52 towns under the street lighting program which aims at lighting towns and cities into 24-hour economy Budget Policy Statement
246 1.4 Sustaining Sectoral Spending for Employment Creation Agricultural Transformation to Sustain Growth 31. Agriculture is indeed a key sector in the economy of our nation, contributing 23 percent to the country s GDP and 27 percent indirectly through forward and backward linkages. It is worth noting that the sector is not only a key player in our economy as a nation but that it also provides employment and is a means of livelihood for the majority of the Kenyan people. 32. Recognizing the importance of the sector, the Government has remained committed to ensuring that the sector is cushioned through development of policies, measures and interventions to enable transformation of agriculture from subsistence to commercial farming and agribusiness, and to ensure sustainable food security in the country. 33. As a result, tremendous achievements have been realized, which include among others; availed 521,047 MT of subsidized fertilizer and established a fertilizer blending facility; enhanced Strategic Grain Reserve (SGR); procurement and distribution of 72 tractors, 16 rice combine harvesters, 72 rice reapers and 100 motorized rice threshers; production and distribution of 880,880 straws of semen; production of 135 million doses of assorted vaccines; insurance of 66,085 tropical livestock units (TLUs) under the Livestock Insurance Programme ; establishment of mini fish processing facilities ; and development of National Residue Monitoring Plan (RMP) for farmed fish that was approved by the European Union. Government has commissioned two fertiliser plants in Eldoret and Nakuru with a capacity of 500,000 tonnes in total. Once fully operational, the plants will enable local blending of fertilisers and hence lower cost of fertilizers. 34. Land is a key resource in growing the agricultural sector. The government has developed a draft National Spatial Plan and physical planning manual (standards and guidelines); formulated National Land Use Policy and digitized 13 land registries; registered 2.4 million title deeds; enhanced administration and management of public land; and procured and installation of Enterprise Resource Plan (ERP) comprising of Land Information Management System (NLIMS). 35. During the FY 2017/ /20 Medium Term Expenditure Framework (MTEF) period, the government has prioritized among others the following programs: development of Agriculture Technology Centres; strengthening agricultural mechanization; development of Soil and water conservation national strategy; enhancement of Kenya Cereal Program and Climate Resilience Agriculture; Aflatoxin management; National Accelerated Agricultural Inputs Access Programme; improve access to market information and Eastern African Agriculture Productivity Project for commercialization of technology Budget Policy Statement
247 Supporting Growth of Manufacturing for Employment Creation 36. Manufacturing sector is among priority sectors identified by the Vision 2030, earmarked to catalyze Kenya s leap to a higher middle income economy. Despite the difficult times due to weak exports and loss of flagship investors, the sector s notable contributions include 10.3 percent share of Gross Domestic Product (GDP) in 2015, and increased employment creation to 2.8 million persons in 2015 up from 2.4 million in The sector has also made great strides in the development of industrial infrastructure such as Special Economic Zones, Free Trade Zones, and Industrial Parks. The SEZs, and the subsequent boost in manufacturing, is intended to create jobs and expand after it starts. In effect, the SEZ Act 2015 has been enacted and the master plan, feasibility study and strategic environmental assessment for Special Economic Zones (SEZ) at Dongo Kundu Mombasa have been completed. The construction of the textile and apparel industrial buildings and worksites at the Export Processing Zones (EPZ) Athi River are at 65 percent. 38. As a result, the Sector has realized growth in both foreign direct investment and exports; total foreign direct investment doubled from Ksh101 billion in FY 2013/14 to Ksh 224 billion in FY 2015/16. The country s total exports to AGOA markets rose from Ksh 47 billion to Ksh 67 billion during the same period, out of which exports of apparels increased by 14.4 percent from Ksh 30.2 billion to Ksh 34.6 billion. 39. To promote the development of industries and extractive sectors of the economy, the Government continues to promote the ease of doing business by reengineering processes and cost reduction. To this end, the country s competitiveness in Ease of Doing Business ranking index improved by 21 points to position 92 from position 113 previously out of 190 countries according to the 2016 World Bank Doing Business report. The Government has also continued to allocate national resources towards the leather industrial park development, textile development, modernizing both Rivatex and the new Kenya Cooperative Creameries. 40. Going forward, the Government will prioritize the development of regional specific industrial clusters in Mombasa, Kisumu and Garissa, operationalization of the SEZ Act 2015, development of the basic infrastructure in Dongo Kundu/Mombasa, development of integrated industrial database, development of basic infrastructure for leather industrial park in Kenanie, development of a common manufacturing facility for leather in Kariokor, and training SMEs on business management and value addition in counties, development of industrial parks and establishment of small and medium industries (SMI) Budget Policy Statement
248 Tourism Recovery, Sports, Culture, and Arts 41. The role of tourism, sports, culture and arts in the country s transformation and economic development is diverse. These sectors play this role by promotion and exploitation of Kenya s diverse culture and arts; enhancing Kenya s reading culture; regulation, development and promotion of sports, film industry and music; and preservation of Kenya s heritage. In cognizance of this, the Government has continued to undertake several initiatives to spur recovery of the tourism sector and create an enabling environment for tourism businesses, sports and culture, including encouraging joint partnerships between individuals, citizen companies and non-citizens. 42. Other achievements in the tourism sector include: increased bed-nights by Kenyans, increased conference activity in the country, operationalization of the Tourism Regulatory Authority, which has enabled the tourism sector to classify and rate 122 hotels and restaurants and assessment of 54 pre-qualified tourism establishments in Nyanza, Western and North Rift regions and classification of 25 establishments (1-4 star rating). 43. In sports, culture and art, over the last medium term period, government trained and nurtured 73,700 talented youth in various sports disciplines against the target of 55,490, sensitized 694 persons and tested 231 athletes on anti-doping against a target of 200 set in both cases; enhanced film monitoring and enforcement by issuing 1,043 film regulatory licenses; and conducted 5,753 random inspections against a set target of 5000 to ensure inappropriate content is not distributed to the public, and heightened the construction of the National Library in Nairobi. 44. Going forward, the Government working in partnership with key stakeholders aims to increase tourism earnings, international and domestic tourist arrivals, and conference tourism; develop and diversify niche tourism products; facilitate concessional loans to tourism and tourism related facilities; and complete the construction of Ronald Ngala Utalii College. Further, government will continue to upgrade 5 regional stadia (Kamariny, Chuka, Karatu-Ndarugu, Marsabit and Wote); completion of the Ultra-modern National library, full operationalization of the Kenya Film School, improve compliance with sports regulations, increase awareness on the fight against doping, and disseminate heritage knowledge. Promoting Mining Sector for Job Creation 45. The mining sector has been identified by the Medium Term Plan II of the Vision 2030 as one of the key drivers for economic growth and transformation currently contributing 0.9 percent to GDP but this is expected to rise to at least 10 percent by 2030 with the discovery and exploitation of new minerals. In addition to contributing to GDP, the sector employs more than 13,800 and 6,000 Kenyans in private and public sectors respectively. In order, to spur growth in the sector and Budget Policy Statement
249 attract investors, the Government has over the years continued to initiate measures to transform the sector. 46. These initiatives have paid off, as evidenced by the significant achievements of the sector. Kenya is one of the world s leading producers of natural carbon dioxide, fluorspar, soda ash and titanium. Twenty other minerals have been identified and confirmed, including a unique type of ruby. In the year 2015, 0.6M metric tonnes of titanium, 340kg gold, 64,000 metric tonnes of Fluorspar, 0.5M metric tonnes of Soda Ash, and 3,700 M metric tonnes were mined. Overall, mineral output value rose by 14.7 percent from Ksh 21.1 billion to Ksh 24.2 billion in 2015, while in terms of current prices, the contribution of mining and quarrying activities rose from Ksh 23.0 billion in 2011 to Ksh 53.8 billion in The Government recognizes that the mining sector can only become a core driver of Kenya s economy, to the extent that the conditions are put in place to support an attractive climate for investors. To this effect, the Government has enacted a new Mining Act, 2016, in order to make the sector stable, predictable and transparent. In addition, the Government has developed a set of 16 regulations to fill in the gaps in the new law and help operationalize it. The Government has also strengthened the licensing process through the Online Transactional Mining Cadastre Portal (OTMCP), which has enhanced transparency and accountability. Further, in a bid to attract investment in the sector, the Government is in the process of finalizing the process of conducting a nationwide Airborne Geophysical Survey and establishing a Geological Data Bank to provide data on mineralized areas in the country and act as repository centre for all geological data and information respectively. These developments will ease access to geological data and information thus reduce exploration risk. Going forward, the Government will prioritize on the implementation of the new Mining Act, 2016 and the development of an overarching National Extractive Policy and a 20- year Mining Strategy. 1.5 Sustained Investment in Social Services for the Welfare of Kenyans 48. To foster inclusive growth, reduce poverty and inequality, the Government will continue investing in quality and accessible healthcare, relevant education and strengthen the social safety net. Health Care 49. The health sector aims to achieve the highest possible health standards in line with the population needs through supporting provision of equitable, affordable and quality health and related services to all Kenyans. 50. Spending in the health sector recorded improvements in communicable disease control, maternal and child health as well as access to ARVs. The government will continue to implement programs and projects aimed at promoting health promotion and prevention; addressing the health needs of children, mothers and adolescents; improving the health infrastructure; enhancing social health protection and Budget Policy Statement
250 achievement of universal health coverage and the strengthening of adherence to norms and standards as well as health regulation. 51. To this effect, the FY 2017/ /20 budget will prioritize scaling up of policy interventions aimed at enhancing equitable access to high impact healthcare services, addressing challenges associated with devolution of health care and high turnover rate among health workers, controlling non-communicable diseases, and improving health service delivery in the country. The emphasis will therefore, be addressing these challenges in order to ease the burden to the households and attainment of the highest standards and care for sustained long-term growth and development. Quality and Relevant Education for all Kenyans 52. The Government s overall goal in the education sector is to increase access to education and training; improve quality and relevance of education; reduce inequality as well as leverage on knowledge and skills in science, technology, and innovation for global competitiveness. To achieve this goal, the Government is committed to further entrenching universal and compulsory basic education and expanding tertiary education. 53. The education sector achievements have been significant in the FY 2015/16. They include; increase in the number of Early Childhood Development and Education (ECDE) centres, Free Primary Education which continues to be implemented with enrolment stabilizing at 8.8m over and the number of Primary schools increasing from 21,302 in FY 2013/14 to 21,877 in FY 2015/16. Despite these achievements, a number of challenges still remain. They include high poverty incidence, high education costs to households and government, unsatisfactory access levels especially at post primary education, low progression and regional and gender disparities in educational attainment. 54. The medium term strategy will therefore, focus on: Construction and improvement of infrastructure in all learning institutions and county offices for teacher management services. Enhancing capitation and grants to institutions, support for education and curriculum reforms and enhancement and support for examination, competence assessment and certification. Expansion of education and training opportunities in marginalized and underserved areas. Promotion of education and TVET activities by development of policies, licensing, accreditation and quality assurance of all institutions. Increasing provisions for loans, bursaries and scholarships to meet the increased demands of education and training. Enhancement of ICT integration in education at all levels and promotion of science, technology and innovation activities by development of policies, research licensing, and accreditation of research and quality assurance of research institutes Budget Policy Statement
251 Mainstreaming, monitoring and evaluation of programmes and empowering the Central Planning and Project Monitoring Unit (CPPMU) to conduct effective monitoring of institutions. Scaling up Social Safety Nets 55. The Government continues to build resilience and promote affirmative action for addressing challenges facing vulnerable groups. Between the year 2013 and 2016, the sector realized a number of achievements, including: 40,520 Orphans and Vulnerable Children (OVC) who have been supported with scholarships; 792,815 children in distress assisted through the child help line 116; 13,679 persons with disabilities provided with assistive and supportive devices and 3,026 supported with sun screen lotion while 133,000 Self Help Groups/Community Based Organizations that have been registered. 56. On the National Safety Net Programs, the achievements include: increased number of older persons receiving cash transfers from 164,000 to 310,000; increased number of households with OVCs receiving cash transfers from 253,000 to 353,000; and increased number of Persons with Severe Disabilities receiving cash transfers from 27,000 to 46, The first phase of the Single Registry has already been set up; this phase entailed its establishment where all the information on the five Cash Transfer Programs is kept. These programs include: Cash Transfer to Orphans and Vulnerable Children (CT- OVC), Older Persons Cash Transfer (OP-CT), Cash Transfer to Persons with Severe Disability (CT- PWSD), Hunger Safety Net Program (HSNP) and Cash for Asset programme of the World Food Programme. The Government is now embarking on the second phase of the Single Registry where it will ensure that the Single Registry is secure and expand it to accommodate as many as beneficiaries as possible. 58. Over the medium term, the Government is targeting to carry out the following measures in order to ensure the success of the National Safety Net Programme: To build capacities of communities and register Self Help Groups and Beneficiaries Welfare Committees (BWCs) providing them with formal recognition and opportunities to link with Micro Finance Institutions (MIF) and non-state actors. Infrastructure Development of 12 Vocational Rehabilitation Centres(VRCs) in order to provide trainees who are Persons With Disabilities with proper learning environment and equip them with skills for self-reliance and also enable them to participate in socio economic activities. Establish National Development Fund for Persons with Disabilities (PWDs) which is aimed at improving livelihoods of PWDs, improving physical accessibility in learning institutions, increasing enrolment, retention and completion of PWDs in schools, improving literacy and Budget Policy Statement
252 transition to higher levels of education and improving participation of PWDs in development activities. Single registry for the National Safety Net Programme will be decentralized to the remaining 18 Counties by the end of FY 2016/17. Integrate the existing Management Information Systems for the CT-OVC, OPCT and PWSD-CT programs into a one-stop system. The integrated system will enhance automation of key program components such as targeting, enrolment, payroll preparation, bank reconciliation, change management and management of complaints and grievances. It will be designed to be compatible with the electronic targeting tool which is being piloted and finalized in the current (2016/17) financial year. Empowering Youth, Women and Persons with Disabilities 59. Kenya is among the countries with large proportion of youthful population. Demographic dividend is reaped when this youthful population is utilized to accelerate economic development. To reap the benefits of the demographic dividend, the government recognizes that it is important to empower youth, women and persons with disabilities and remove all obstacles to ensure their full participation in social economic development of the country. 60. During the FY 2013/14 FY 2015/16 MTEF, 46,699 and 58,549 groups were supported through Women Enterprise Fund and Uwezo Fund against a target of 40,000 and 55,000 respectively. Further, Anti FGM campaign forums aimed at reducing FGM prevalence in the country were held in 20 counties against a target of 17 counties. 61. The government will continue to promote gender and youth empowerment, livelihoods for the vulnerable groups and marginalized areas through the National Youth Service (NYS) program, the social transformation program, and SACCOs in order to attain sustainable youth led enterprises and promote employment creation services. Further, the Government will expand opportunities for the youth in procurement through the Access to Government Procurement Opportunities (AGPO) platform, and ensure that the youth suppliers under the platform are paid in time. The Government will also designate resources for the establishment of youth empowerment centers which will help facilitate mentoring of youth on leadership, national values, entrepreneurship skills and further entrench digital literacy. Environmental Conservation and Making Water Accessible 62. The national policy blue print envisions the country to be a nation that prides in a clean, secure and sustainable environment and targets universal access to clean water and basic sanitation for all by the year To date, about Budget Policy Statement
253 percent of Kenyans have access to reliable clean water, while 70 percent have access to clean sanitation. 63. Noting that Kenya is a water-scarce country with less than 1,000 cubic metres per capita of renewable freshwater resources, the Government working with devolved units of government will continue to invest in clean water supply and put in place measures to control floods and harvest rain water as well as to protect and conserve the environment thus connecting over one million additional Kenyans to safe drinking water. 64. The Government remains committed on its bid to mitigate the impact of climate change, having signed the Protocol on Climate Change following the adoption of the Paris Agreement. Prior to the signing, the Government adopted a Green Economy Strategy and Implementation Plan as a guideline for its environmental sustainability efforts. Critical part of the Government s environmental conservation efforts is the stand against poaching and the illegal trade in wildlife and wildlife products. In addition, the Government will continue to mainstream climate change measures into all its projects and programmes. 65. Going forward, the Government will prioritize on sustainable water, wildlife and natural resources management, the governance of land and water utilities, the promotion of information technology, the reduction of non-revenue water, together with reliable water distribution; prudent infrastructure development and adoption of best practices in operation and maintenance. Moreover, the Government will strengthen the uptake of Environmental Impact Assessment for every project. 1.6 Enhancing Service Delivery through Devolution 66. The three years that devolution has been in existence, despite its many challenges, shows that it s one of the greatest successes of our new constitutional architecture. The decentralization has led to distribution of resources to all corners of our country and spread development to previously marginalized villages. Further, it has devolved leadership hence reducing political and social risks that come with systems where leadership is centralised hence some communities/people feel left out. 67. A challenge of low performance of own-source revenue against respective target has been witnessed since the establishment of County Governments (CGs) in A survey by the National Treasury of eight County Governments revealed, among other findings, that: revenue forecasting in CGs is not underpinned by macroeconomic assumptions or a credible methodology; revenue forecasts once included in the budget are hardly updated since there is no in-year monitoring that is done; and, there is an ambiguity of roles within County Governments in the ownsource revenue forecasting process. In a number of instances, County Executives prepare revenue forecasts which are later raised by County Assemblies. 68. The National Government has adhered to the principles of devolution by providing resources to the county governments to run their affairs Budget Policy Statement
254 69. To strengthen accountability and fiscal discipline, the National Government will continue building capacity in the counties and assist them develop a strategy to enhance revenue management by identifying strong revenue raising measures and correct duplication and distortions in local taxes and fees that hurt the business environment and reduce revenue streams when investors shy away from such counties. 70. With regard to cash management, the National Government will continue disbursing funds to county governments in accordance with the approved disbursement Schedule. In disbursing the funds, however, the National Government will prioritize disbursements to county governments with least fund balances at the Central Bank of Kenya in order to ensure prudent cash management as required under Article 201(d) of the Constitution. 1.7 Structural Reforms Governance 71. The Government continues the fight against corruption and its adverse effects to the economy which include inefficiency, low productivity and high costs of doing business. The Government will continue with the implementation of the measures articulated in National Call to Action against corruption which include continuous and objective lifestyle audits for all Accounting Officers as well as Authority to Incur Expenditure (AIE) holders. The Government is also committed to strengthen expenditure control and improve the efficiency of public spending through public financial management reforms aimed at upgrading efficiency, transparency and accountability in order to free fiscal space for priority social and investment projects and to improve governance in the public sector. 72. Further during the State House Summit on Governance and Accountability, held in October 2016 in Nairobi, the Government reiterated its commitment to fight corruption and challenged the agencies charged with combating graft, especially the courts to fast-track their mandate. The Government further warned against politicization of corruption and integrity issues, promised swift action against procurement offenders and highlighted the need for strengthening of investigations and improvements to the anti-corruption cases in order to enhance their effectiveness. 73. Some of the achievements in the fight against economic crimes in the FY2015/16 include: 167 corruption and economic crime cases investigated while 358 case files were still at various stages of investigations; Ksh 2.6 billion loss averted by disruption of corruption networks; 17 corruptly acquired assets traced, recovered and/or restituted worth Ksh 701 million; and 3 systems reviewed and examinations to seal corruption loopholes conducted. In addition, 6.3 million persons were sensitized/enlisted to combat corruption, 4 cases comprising of 147 case files on ethical breaches were investigated and 2350 Integrity Assurance officers and corruption prevention committees were trained. 74. The Government has allocated adequate resources to the Independent Electoral and Boundary Commission towards the management of the voter registration and electoral operations for the 2017 General Elections and its Budget Policy Statement
255 aftermath. This will ensure voice and accountability as well as stability and lack of violence which are crucial for development of our country. 75. Further, the Government continues to strengthen various institutions that are mandated to fight corruption in the country in order to instill good governance and to enhance capacity to vigorously combat corruption and recover corruptly acquired assets. Already progress has been made in the coordinated investigations among the agencies. The Multi-Agency Team (MAT), which brings together the Kenya Police Service (Directorate of Criminal Investigations), the Ethics and Anticorruption Commission, the Financial Reporting Centre, the Directorate of Public Prosecutions, the Kenya Revenue Authority and the Asset Recovery Agency, have taken to courts more than 360 corruption cases. 76. The parliament, in FY 2017/18, will continue to fast-track consideration of reports on budget implementation, audited accounts of the National Government, County Governments and State Corporations. In addition, they will introduce bills; consider motions, statements and petitions; and carry out vetting of state officers presented to them as required by law. These activities will go a long way in entrenching good governance in our institutions and ensuring accountability of public resources. Financial Sector Developments and Reforms 77. Kenya s financial sector development continues to support economic growth and transformation. The banking sector has been expanding locally and across the Sub Saharan region with innovations driving financial inclusion. With the Banking (Amendment) Act 2015 that capped lending rates at four percentage points above the Central Bank's benchmark rate and deposit rate at at-least 70 percent of the benchmark rate, the sector is expected to continue with its growth based on the ability to respond to the needs of Kenyans for convenience and efficiency riding on Kenya s position as a world leader in mobile money technology. 78. The Kenya Deposit Insurance Corporation (KDIC) was voted the deposit insurer of the year 2016 by the International Association of Deposit Insurance (IADI). In FY 2016/17, the World Economic Forum Global Competiveness Report ranked Kenya number 50 in the world out of 138 countries for Financial Market Development. In the 2016 FinAccess survey, Kenyans access to financial services improved to 75.3 percent, up from 66.7 percent in Building on the progress made thus far, the Government will implement additional measures to further deepen and strengthen the financial sector, including: The policy framework to establish the Nairobi International Financial Centre (NIFC) and the NIFC Bill which are already before the Cabinet will be forwarded to the National Assembly; The Financial Services Authority (FSA) Bill which consolidates existing non bank financial sector regulators and creates a new market conduct framework Budget Policy Statement
256 for the entire non-bank financial sector is already before the Cabinet will be forwarded to the National Assembly; The Moveable Property Security Rights Bill which facilitates lenders to provide credit using moveable properties as collateral and also creates an online electronic collateral registry and is already before the Cabinet will be forwarded to the National Assembly; The Kenya Credit Guarantee Scheme Bill to further support access to credit by Small and Medium Enterprises will be finalised and forwarded to Cabinet and thereafter the National Assembly; Other reforms to address the high cost of credit include reforms to facilitate leasing and factoring, further extending the credit reporting framework to include credit providers from outside the financial sector, digitization of land registries and other legal reforms to facilitate the expansion of mortgage finance; Enhancing Kenya s position as an Islamic Finance Hub by putting in place an Islamic Finance Regulatory Framework through the recently launched Islamic Finance Steering Committee (IFSC) chaired by the Cabinet Secretary/National Treasury and Islamic Finance Consultative Committee (IFCC); Strengthening, by the Central Bank of Kenya, of the bank supervision legal and regulatory framework. This will include enhancing the macro- and microprudential Stress Testing Framework and cross border supervision framework; Strengthening the independence and capacity of the Kenya Deposit Insurance Corporation (KDIC) to ensure it is able to expeditiously undertake bank resolution and protect the interests of depositors; and, Launching the M-Akiba Government Bond which will be the world s first purely mobile phone based Government security Budget Policy Statement
257 II. RECENT ECONOMIC DEVELOPMENTS AND MEDIUM TERM OUTLOOK 2.1 Overview 80. Kenya s macroeconomic performance remains broadly stable despite the global economic slowdown. The economy s growth momentum has been strong supported by significant investment in infrastructure, construction and mining sectors, strong recovery in tourism, lower energy prices, and improved agricultural production following improved weather conditions. Inflation is within the target band due to prudent monetary policy management while interest rates are low and stable. 81. Improved export earnings from tea and horticulture, reduced import bill of petroleum products due to lower oil prices, resilient diaspora remittances and improved tourism performance led to a narrower current account deficit. The narrowing of the current account deficit together with strong capital inflows led to a stabilization of the shilling in the foreign exchange market, and also allowed the accumulation of international reserves. 82. Going forward, the economy is projected to expand further by 6.0 percent in 2016 and above 6.5 percent in the medium term supported by strong output in agriculture with a stable weather outlook, continued recovery of tourism and completion of key public projects in roads, rail and energy generation. In addition, strong consumer demand and private sector investment as well as stable macroeconomic environment will help reinforce this growth. 2.2 Recent Economic Developments Global Economic developments 83. The global economic growth outlook remains subdued in 2016, though expected to recover gradually in 2017 and beyond. The new shocks to the outlook include: Britain s referendum result in favor of leaving the European Union; ongoing realignments among emerging and developing economies, such as adjustment of commodity exporters to a protracted decline in the terms of trade; slow-moving trends, such as demographics and the evolution of productivity growth; as well as noneconomic factors, such as geopolitical and political uncertainty. 84. Global growth is estimated at 2.9 percent in the first half of 2016, slightly weaker than in the second half of 2015 and lower than the projected growth in the April 2016 World Economic Outlook. The forecasts for 2016 and 2017 are 3.1 percent and 3.4 percent, respectively Budget Policy Statement
258 Domestic Economic Developments 85. The Kenyan economy has sustained its robust growth in the past decade supported by significant structural and economic reforms. The economy grew by 5.6 percent in 2015 compared to 5.3 percent growth in The economy further improved and grew at 6.2 percent in quarter two of 2016 up from 5.9 percent growth registered in quarter one of 2016 (Table 2.1). This strong growth was supported by improved performance in agriculture, forestry and fishing (5.5 percent), mining and quarrying (11.5 percent), transport and storage (8.8 percent), electricity and water supply (10.8 percent), wholesale and retail trade (6.1 percent), accommodation and restaurant (15.3 percent) and information and communication (8.6 percent). Growth in other sectors, particularly manufacturing, construction, financial and insurance and real estate, though slightly lower compared to quarter two of 2015, remained robust. Table 2.1: Economic Performance by Sectors (Percent Growth Rate) Percetage Changes (growth) Gross Domestic Product by Activity Q2 Q2 Agriculture, forestry and fishing Mining and quarrying Manufacturing Electricity and water supply Construction Wholesale and retail trade; repairs Accomodation and restaurants Transport and storage Information and communication Financial and insurance activities Public administration Professional, admin and support services Real estate Education Human health and social work activities Other service activities FISIM All economic activities Taxes on products GDP at market prices Source of data: Kenya National Bureau of Statistics 86. The favourable weather conditions experienced during the second quarter enhanced agricultural production and as such, the sector expanded by 5.5 percent compared to 4.0 percent growth in quarter two of Similarly, electricity and water sector remained strong recording a growth of 10.8 percent compared to 9.2 percent in same quarter in 2015 owing to continued expansion of power generation from relatively cheaper sources. 87. The advantageous oil prices and continued improvement in the road network buoyed the transport and storage sector to a growth of 8.8 percent in the second quarter of 2016 compared to 6.8 percent during the same quarter of Budget Policy Statement

259 The accommodation and restaurants sector recorded an impressive growth of 15.3 percent in quarter two of 2016 from a contraction of 5 percent in the same quarter of The growth was on account of improved security and rigorous marketing initiatives that boosted conference tourism as well as the general tourism. 88. On average, GDP per capita for Kenya at US$ 1,105.8 is the highest in the East African Community sub region (Chart 1). The high and resilient GDP per capita is due to the diversified nature of the Kenyan economy. Chart 1: Average GDP per Capita for Various Countries ( ) Source of data: International Monetary Fund Inflation Rate 89. Overall month on month inflation rose slightly to 6.47 percent in October 2016 from 6.34 percent in September 2016 due to increase in food prices. The annual average inflation rate at 6.5 percent in the year to October 2016 was within the target range of 2.5 percent on either side of the 5.0 percent target (Chart 2). Chart 2: Inflation Rate Source of data: Kenya National Bureau of Statistics Budget Policy Statement

260 90. Inflation rates within the EAC region have remained low due to prudent monetary and fiscal policy management and lower oil and commodity prices (Chart 3). High inflation rates in Ghana, Nigeria and Zambia reflects difficult economic conditions as a result of foreign currency shortages resulting from lower commodity revenues and slow policy adjustment. Chart 3: Inflation Rates in selected African Countries (September 2016) Source of data: National Central Banks Kenya Shilling Exchange Rate 91. The Kenya Shilling exchange rate has continued to display relatively less volatility compared with the major regional currencies and strengthened by 1.4 percent for the period October 2015 to October 2016 (Chart 4). The stability of the Kenya shilling exchange rate reflects improved export earnings from tea and horticulture, a reduction in the imports of petroleum products due to lower oil prices, resilient Diaspora remittances and improved tourism performance. 92. In the Sub Saharan Africa region, large currency depreciations especially in Nigeria reflects challenging macroeconomic conditions as the countries adjust to lower commodity revenues. Chart 4: Selected Currencies Performance against the US Dollar (Oct Oct 2016) Source of data: National Central Banks Budget Policy Statement

261 93. The Kenya Shilling exchange rate strengthened in October 2016 against major international currencies. The currency traded at Ksh against the US dollar, Ksh against the Euro and Ksh against the Sterling Pound in October 2016 compared to Ksh 102.8, Ksh and Ksh respectively, in October Interest Rates 94. The moderate demand pressures on the overall inflation in the recent months, have led to the easing of the monetary policy stance in the East African countries, conversely, tight monetary policy has been adopted in commodityexporting countries due to the substantial depreciation of the currency that has translated into high inflation (Chart 5). Chart 5: Developments of the Policy Rate in selected Countries Source of data: National Central Banks 95. In Kenya, short term interest rates remained low due to the improvement of liquidity conditions in the money market. The interbank rate declined to 4.1 percent in October 2016 from 4.9 percent in September 2016 and 21.3 percent in September 2015, while the 91-day Treasury bill rate declined to 7.8 percent from 8.1 percent and 14.0 percent over the same period (Chart 6). Chart 6: Short-Term Interest Rates Source of data: Central Bank of Kenya Budget Policy Statement
 and sets the minimum interest paid for a saving product at 70.0 percent of the same base rate has led to the narrowing of the interest rate spread from 11.3 percent in August 2016 to 7.")
262 96. The implementation of the Banking (Amendment) Act, 2015 effective September 14, 2016, that capped interest rates on banks loans at 4.0 percent above the base rate (currently at 10.0 percent) and sets the minimum interest paid for a saving product at 70.0 percent of the same base rate has led to the narrowing of the interest rate spread from 11.3 percent in August 2016 to 7.0 percent by September 14, 2016 (Chart 7). As a result of the new Act, Kenya has the lowest lending rate among the East African Countries. 97. The average lending rates which had increased to 17.7 percent in August 2016 from 15.7 percent in August 2015 have declined to 14.0 percent. Similarly, the deposit rate which had decreased to 6.4 percent in August 2016 from 6.9 percent in August 2015 have risen to 7.0 percent from September 14, 2016 as provided in the Banking (Amendment) Act, Chart 7: Commercial Banks Lending Rates of Selected Countries (Sept 2016) Source of data: National Central Banks Money and Credit 98. Growth of broad money supply, M3, slowed to 8.1 percent in the year to September 2016 compared to a growth of 13.5 percent in the year to September 2015 (Table 2.2). The slowdown in the growth was largely on account of a decline in the uptake of domestic credit. 99. Net Foreign Assets (NFA) of the banking system grew by 52.0 percent in the year to September 2016 from a contraction of 12.8 percent over a similar period in 2015 following increased accumulation of foreign assets of the Central Bank. Meanwhile, the Net Domestic Assets (NDA) of the banking system increased by 0.1 percent in the year to September 2016 from the growth of 20.0 percent over a similar period in The slowdown of NDA was occasioned by decline in domestic credit and other assets net of the banking system Budget Policy Statement
 in the year to September 2016 compared with a growth of Ksh 526.0 billion (23.3 percent) in September 2015.")

263 Table 2.2: Money and Credit Developments, Ksh billion Source of data: Central Bank of Kenya 100. Domestic credit slowed to an annual growth of Ksh 66.4 billion (2.4 percent) in the year to September 2016 compared with a growth of Ksh billion (23.3 percent) in September The slowdown was mainly attributed to a decline in lending to the Government of Ksh 36.0 billion, the private sector of Ksh billion and the other public sectors by Ksh 1.2 billion Bank credit to the private sector slowed to a growth of 4.8 percent in the year to September 2016 from a 20.6 percent growth in the same period in Except for the finance & insurance, real estate and transport & communication, all the other sectors experienced a slowdown in credit uptake compared to the same period in 2015 due to tight credit conditions (Chart 8). A contraction in credit flows was experienced in the trade, mining and business services sectors. Chart 8: Private Sector Credit to Sectors, Ksh Billion Source of data: Central Bank of Kenya Budget Policy Statement

.")
264 External Sector Developments 102. The overall balance of payments position recorded a deficit of US$ 1,225 million in the year to August 2016 from a surplus of US$ 716 million in the year to August As a share to GDP, the current account deficit improved to 5.9 percent in August 2016 from 7.9 percent in August This is attributed to a 22.5 percent improvement in the value of the merchandise account reflecting a decline in payments for merchandise imports (Chart 9). Chart 9: Balance of Payments Source of data: Central Bank of Kenya 103. The decline in commodity prices has adversely impacted the exports of Africa s major exporters of non-oil, non-renewable resources. In some cases, this has more than offset the improvement in the oil trade balance resulting to the widening of the current account balance (Chart 10). In some of the oil rich countries, the current account balances tend to swing from large surpluses to large deficits and these swings are typically accompanied by declines in international reserves. Chart 10: Current Account Balance (Percent of GDP) for Selected Countries Source of data: International Monetary Fund Budget Policy Statement
 to US$ 8,144 million (5.")
265 Foreign Exchange Reserves 104. The banking system s total foreign exchange holdings increased by 11.8 percent to US$ 10,355 million in August 2016 from US$ 9,265 million in August 2015 (Chart 11). This was due to the increase of the Official reserves held by the Central Bank (constituting the bulk of the gross reserves) to US$ 8,144 million (5.5 months of import cover) in August 2016 from US$ 6,963 million (4.4 months of import cover) in August However, reserves held by commercial banks decreased slightly to US$ 2,211 million in 2016 from US$ 2,303 million in Chart 11: Official Foreign Exchange Reserves (US$ million) Source of data: Central Bank of Kenya Capital Markets 105. The capital market recorded mixed performance in both equities and bonds market segments in the year to October Activities at the stock market slowed down with the Nairobi Securities Exchange (NSE) 20 share index recording 3,202 points in October 2016 compared to 3,869 points in October Market capitalization was at Ksh 1,982 billion in October 2016 compared to Ksh 2,046 billion in September The drop in market capitalization is as a result of an increase in share supply which depressed the overall share prices There has been a gradual recovery of the NSE reflecting restoration of market stability and improved confidence in the economy. The NSE index had been weighed down by the prolonged uncertainty in the global financial markets, and capital outflows from emerging and frontier market economies. 2.3 Fiscal Performance in FY 2016/ The implementation of the budget for FY 2016/17 has progressed well. Revenue collection has improved in the first quarter with high receipts of VAT and excise revenues reflecting improvements in revenue administration from the i-tax system, new excise tax measures and the re-introduction of withholding VAT. Expenditures lagged behind their respective targets during the first quarter but are Budget Policy Statement
266 expected to pick up in the next quarter as implementation of development programmes and the general activity of Government gain pace By the end of September 2016, total cumulative revenue including A-I-A collected amounted to Ksh billion against a target of Ksh 328.0, representing a shortfall of Ksh 14.4 billion. The shortfall was as a result of the below target collection of the ordinary revenue by Ksh 3.8 billion and the ministerial A-I-A by Ksh 10.6 billion. The shortfall in ordinary revenue was mainly on account of underperformance in import related revenues namely; import duty, VAT imports and IDF fees The total expenditure and net lending for the first quarter of FY 2016/17 amounted to Ksh billion, against a target of Ksh billion. The shortfall of Ksh billion was attributed to lower absorption recorded in both recurrent and development expenditures by the National Government and lower than projected disbursement to County Governments. Recurrent expenditure for National Government amounted to Ksh billion, against a target of Ksh billion, with underperformance recorded in wages and salaries, and Operation and Maintenance which accounted for Ksh 15.1 billion, and Ksh 38.8 billion, respectively The combined effect of the revenue and expenditure performance in the first quarter of FY 2016/17 resulted to an overall fiscal deficit, on a commitment basis (including grants) of Ksh 72.5 billion (equivalent to 1.0 percent of GDP) against a targeted deficit of Ksh billion (equivalent to 2.5 percent of GDP). On cash basis the overall deficit was Ksh.88.8 billion (equivalent to 1.2 percent of GDP).This deficit was financed through foreign borrowing amounting to Ksh 39.2 billion and net domestic financing amounting to Ksh 49.7 billion Net domestic financing amounted to Ksh 49.7 billion against a target of Ksh 97.1 billion by end September 2016, an under performance of Ksh 47.4 billion. The net domestic borrowing of Ksh 49.7 billion comprised borrowing through government securities of Ksh 76.3 billion and net repayment of other domestic borrowing of Ksh 40.7, less accumulation of government deposits of Ksh 13.8 billion and receipts from government on lent loans of Ksh.0.2 billion. 2.4 FY 2016/17 Revised Fiscal Estimates 112. In view of the fiscal developments to end September 2016, 2015/16 base adjustment and weaker than expected performance to September 2016 especially on import related taxes the Government has revised downwards its tax revenue projections for the financial year, However this downward reduction is offset by higher investment income than in the original budget estimates Overall revenue inclusive of A-I-A are projected to rise by Ksh.18.2 billion above the previous estimates, reflecting projected reduction in ordinary revenues by Ksh 1.9 billion and increase in A-I-A by Ksh 20.1 billion. The downward revision in ordinary revenues is on account of projected shortfalls in Import duty (Ksh 5.9 billion), Income tax (Ksh 11.3 billion) largely on account of PAYE and VAT by Ksh 6.9 billion on account of VAT on imported goods. However, the Budget Policy Statement
267 shortfalls in these taxes are significantly offset by upward revision in excise revenues (Ksh.9.1 billion) due to the positive outlook of the new excise tax measures, and Investment income (11.7 billion) and other revenue (Ksh.1 5 billion) In addition, the Government has instituted various measures aimed at aligning the expenditures within the revised resource envelope. These include measures to curb non priority expenditures and to free resources for more productive purposes as well as expenditures cuts on slow and delayed projects. Similarly, foreign financed development expenditures has been revised downwards to reflect realistic absorption capacity 115. In summary, the revised fiscal framework reflects overall increase in revenues by Ksh 18.2 billion from Ksh 1,500.5 billion to Ksh 1,518.7 billion; and a reduction in total expenditures and net lending by Ksh billion, from Ksh 2,275.6 billion to Ksh 2,071.7 billion. The deficit, inclusive of grants, is, therefore, projected to decline from Ksh billion to Ksh billion (equivalent to 6.9 percent of GDP). Borrowing from the domestic market has been revised downwards to Ksh billion from Ksh billion in the budget. The overall impact of these developments is reflected in Table Budget Policy Statement
268 Table 2.3 Revised Fiscal Framework (Ksh Million) Source: National Treasury FY 2015/16 FY 2016/ Adherence to Fiscal Responsibility Principles FY 2015/16 Printed Revised Deviation Preliminary Revised Preliminary Printed Revised Estimates Estimates I Actual* Estimates Actual* Estimates Estimates I Ksh Million % share of GDP A. TOTAL REVENUE AND GRANTS 1,267,479 1,365,885 1,573,228 1,550,462 (22,766) Revenue 1,237,883 1,299,912 1,500,509 1,518,717 18, Ordinary revenue 1,158,211 1,184,368 1,376,424 1,374,547 (1,877.5) Import Duty 79,188 83,628 96,281 90,398 (5,883.6) Excise Duty 139, , , ,367 9, Income Tax 566, , , ,803 (11,296.2) VAT 289, , , ,680 (6,902.0) Investment Income - Others 19,250 21,580 19,665 31,351 11, Others 65,019 63,975 74,486 75,947 1, Appropriation in Aid 79, , , ,171 20, GRANTS 29,597 65,973 72,719 31,744 (40,975) AMISOM Receipts 4,293 6,440 6,440 6, Projects Grants(Revenue) 7,866 17,025 16,787 7,944 (8,842.8) Projects Grants(AIA) 16,275 41,165 48,569 16,438 (32,131.8) Italian Debt Swap County Health Facilities - DANIDA B. TOTAL EXPENDITURE AND NET LENDING 1,781,945 2,032,509 2,275,556 2,066,969 (208,586) Recurrent 1,027,543 1,085,307 1,168,483 1,186,604 18, Domestic Interest 172, , , ,554 (24,713.0) Foreign Interest 42,471 41,387 53,520 58,439 4, Pensions & Other CFS 53,401 56,129 60,169 60, Wages & Salaries 307, , , , Defense and NSIS 113, , , , O&M/Others 337, , , ,666 37, Development and Net Lending 478, , , ,580 (226,708) Equalization Fund 6,400 6,400 6,000 6, County Governments' Allocation 264, , , , Contingencies Fund 5,000 5,000 5,000 5, C. DEFICIT EXCL. OF GRANTS (Commitment basis) (544,062) (732,597) (775,047) (548,252) 226,795 (8.4) (10.7) (7.4) D. DEFICIT INCL. OF GRANTS (Commitment basis) (514,466) (666,624) (702,328) (516,508) 185,820 (7.9) (9.7) (6.9) E. Adjustments to cash basis 22, F. DEFICIT INCL. OF GRANTS (Cash basis) (492,079) (666,624) (702,328) (516,508) 185,820 (7.6) (9.7) (6.9) G. TOTAL FINANCING 474, , , ,508 (185,820) Net Foreign Financing 269, , , ,099 (175,168.2) Disbuserments 304, , , ,721 (175,168.2) Commercial Financing 145, , , , Project Loans AIA 55, , ,584 52,923 (126,661.4) Project Loans Revenue 43,654 61,119 50,446 43,091 (7,355.1) Project Loans SGR _ AIA 52, , ,226 73,574 (44,651.7) Programme Loans 8,574 8,213 3,855 7,355 3, Debt repayment - Principal (35,062) (38,379) (43,623) (43,623) - (0.5) (0.6) (0.6) Other Domestic Financing 2,389 2,579 3,956 2,629 (1,327.5) NET DOMESTIC FINANCING 202, , , ,780 (9,324.4) Nominal GDP (Fiscal Year) 6,508,084 6,444,000 7,259,000 7,435, , The Government recognizes that the fiscal stance it takes today will have implications into the future. Therefore, and in line with the Constitution and the Public Finance Management (PFM) Act of 2012, the principle of sharing the burdens and benefits of the use of resources and public borrowing between the present and future generation implies that we have to make prudent policy decisions today so that we do not impose an unwarranted debt burden on future generations. Also to ensure that development portfolio is not crowded out by both Budget Policy Statement FY 2016/17
269 the National and County Governments, we shall ensure adherence to the ratio of development to recurrent expenditures of at least 30:70 over the medium term, as set out in the PFM Act The National Government will observe strictly regulation 26 (1) (a) of the PFM Act, which requires that the national government s expenditure on the compensation of employees (including benefits and allowances) shall not exceed 35 percent of the national government s equitable share of the revenue. It is expected that county governments will also strictly adhere to this requirement as stipulated in the PFM regulations 25 (1) (b) (County Regulations) and those that are already in breach to take remedial measures as provided in the regulations In addition, the national and county governments will through implementation of the e-procurement module of the IFMIS apply prudent expenditure management on items such as office supplies and their pricing that should, as much as possible, reflect actual market prices. Time for paying for goods and services should be reduced to enable Government get competitive prices in the market The respect and observance of these fiscal rules set out in the PFM law and its regulations is important and necessary to entrench fiscal discipline. Observance of the principles of public finance and fiscal responsibility principles, as stipulated by the Constitution and the PFM Act, 2012, has been as follows: a) The National Government s development as a percent of total budget was 32.1 percent in FY 2015/16 as shown in Table 2.4. It is expected at 33.2 percent in FY 2016/17 and projected at 32.6 percent in the FY 2017/18 and 34.4 percent in FY 2018/19. These resources for development are above the 30 percent minimum threshold set out in the PFM law Budget Policy Statement
270 Table 2.4: Revenues and Expenditures, (Ksh billion) FY 2014/15 FY 2015/16 FY 2016/17 FY 2017/18 FY 2018/19 FY 2019/20 Revised Budget Revised BROP'16 Ksh. billions Actual Prel. Actual Final BPS'17 Budget BROP'16 BPS'17 BROP'16 BPS' Total Expenditure & Net Lending 1, , , , , , , , , , , , Total National Govt Expenses 1, , , , , , , , , , , ,258.5 Total Recurrent , , , , , , , , , , ,480.5 CFS (Interest & Pensions) Total Ministerial Recurrent , ,057.1 o/w Wages & Salaries Wages as % National Government Revenues/1 33.9% 31.6% 29.7% 29.4% 29.2% 28.4% 29.0% 28.5% 26.1% 27.6% 23.3% 25.3% Development Development as % NG expenditures 36.3% 32.1% 41.2% 33.8% 33.2% 35.0% 34.1% 32.6% 35.2% 34.2% 35.9% 34.4% Domestic External Contingencies County Allocation Total Revenues 1, , , , , , , , , , , , Total National Government Revenues (Incl. A-I-A) , , , , , , , , , , National Government Domestic Borrowing (net) of which Sovereign Bond Proceeds Others Source: National Treasury b) On compensation of employees, the share to National Government revenues was 31.6 percent in FY 2015/16, and is projected at 29.7 percent in FY 2016/17 and at 29.0 percent in the FY 2017/18. These ratios demonstrate the commitment to the fiscal responsibility principle of ensuring that the national government s expenditure on wages and benefits for public officers shall not exceed a percentage of the national government revenue as prescribed by the regulations 26(1)(a). c) Another fiscal responsibility principle requires that the national government s borrowings be used only for the purpose of financing development expenditure and not for recurrent expenditure. This principle continues to be adhered to by the government ensuring that its policy as set out in the Medium Term Debt Management Strategy and other policy documents requires that external financing is done only for development purposes. d) The National government is required to maintain Public debt and obligations at a sustainable level as approved by Parliament. The Government borrowing level is set in the Medium Term Debt Strategy approved by the National Assembly. The strategy aims at ensuring public debt sustainability and minimizing the level of contingent liabilities. The Government is committed to adherence to this principle at all times. Our debt ratios compared with internationally recognized threshold continues to show that our debt level Budget Policy Statement
271 remains sustainable (Tables 2.5a and 2.5b). The baseline public debt path remains consistent with the EAC convergence criteria (deficit and debt) and below the relevant public debt benchmark. Table 2.5a: Kenya s Public Debt Sustainability Indicators Indicator Threshold position PV of Public Sector Debt to GDP ratio PV of Public Sector Debt to Revenue ratio Debt Service to Rrevenue ratio Source: IMF Staff report for Kenya, March 2016 Table 2.5b: Kenya s External Debt Sustainability Indicators Indicator Threshold position PV of External Debt to GDP ratio PV of External Debt to Export ratio PV of External Debt to Revenue ratio Debt Service to Export ratio Debt Service to Revenue ratio Source: IMF Staff report for Kenya, March 2016 e) To manage fiscal risks prudently as required, the Government has improved its macroeconomic forecasts and regularly reviews the impact of macroeconomic projections and their implications on the budget. A detailed Annex on the Specific Fiscal Risks is prepared as part of the Budget Policy Statement. The Government also takes into account the fiscal risks arising from contingent liabilities, impact of the Public Private Partnership and Financial Sector Stability. Further, every year a contingency provision of Ksh 5.0 billion is factored in the budget to cater for urgent and unforeseen expenditure. f) On the principle of maintaining a reasonable degree of predictability with respect to the level of tax rates and tax bases, in the FY 2014/15 Government simplified and modernized the VAT legislation and consolidated all the appeals in the tax legislation to a single legislation. Similarly in the FY 2015/16, modern and simplified Excise Duty and Tax Procedure legislations were enacted. A review of the Income Tax Act will commence shortly. These reforms are intended to lock in predictability and enhance compliance with the tax system and ensure stability in tax revenue flows Budget Policy Statement
272 2.6 Economic Outlook External Environment 120. The global growth for 2016 is estimated to expand by 3.1 percent, a slowdown from a growth of 3.2 percent recorded in 2015 (Table 2.6). The recovery is expected to gather some pace in 2017 and beyond, driven primarily by developments in emerging market and developing economies, as conditions in stressed economies gradually normalize Economic growth in advanced economies is expected to decline slightly in 2016 compared to 2015 and then rise gradually. The decline is due to: weak current demand and a lower equilibrium real interest rate; the slowdown and rebalancing in China, weakening global trade; decline in commodity prices, a windfall gains for most advanced economies but sizable losses in disposable income for commodity exporters A few emerging market and developing economies have experienced deep recessions that have dragged global activity over 2015 and They have been affected by generalized slowdown in advanced economies; rebalancing in China; the adjustment to lower commodity prices; an uncertain external environment; and geopolitical tension and conflict in some countries and regions. To avert this, the emerging market economies require demographic transition and export diversification However, with declining commodity prices, depreciating currencies of some emerging market economies, and increasing financial market volatility, downside risks to the global outlook have risen, particularly for emerging market and developing economies. Table 2.6: Growth Projections for Selected Regions/Countries WEO GDP OCTOBER 2016 Actual Projected REGION/COUNTRY World Advanced Economies USA Euro Area Japan UK Canada Emerging and Developing Economies Emerging and Developing Asia China India MENA Sub-Saharan Africa South Africa Nigeria Source: October 2016 World Economic Outlook Budget Policy Statement
273 124. Growth in Sub-Saharan Africa is expected to weaken from 3.4 percent in 2015 to 1.4 percent in 2016, occasioned by the repercussions of declining commodity prices, particularly those for oil, as well as lower demand from China, the largest single trading partner of sub-saharan Africa, and the tightening of global financial conditions for the region s frontier market economies. Among the region s oil importers, a majority will continue to experience solid growth, especially low-income countries, where investment in infrastructure continues and private consumption remains strong. The growth will pick up in 2017 to 2.9 percent, driven by sustained infrastructure investment; buoyant services sectors, and strong agricultural production, even as oil-related activities provide less support Kenya s Macroeconomic Prospects 125. Kenya s economic growth prospects for the FY 2017/18 and the medium term takes into account the global slower growth in demand, particularly investment, which is especially pertinent to generate international trade flows in the form of capital goods and intermediate inputs. Further, it takes cognizance of the domestic environment including the general election to be held in August The growth profile accommodates the strategic objectives of the Government as outlined in the second Medium Term Plan (MTP) of Vision 2030, considering progress made in implementation of key projects The outlook, therefore points to a continued robust growth, lower fiscal deficits, contained inflation within the target range and a gradual improvement in the external current account balance Real GDP is projected to expand by 6.0 percent in FY 2016/2017, 6.2 percent in FY 2017/2018, 6.5 percent in FY 2018/2019 and. 6.6 percent by FY 2019/20 (Table 2.7 and Annex Table 1). This high growth will be supported by ongoing investments in infrastructural development, resilient domestic demand, continued recovery in the tourism sector and growth of exports in the sub region. In addition, the growth will be supported by structural reforms aimed at improving competitiveness of the private sector and promoting overall productivity in the economy Inflation is currently within set target and is expected to remain so in the medium term underpinned by prudent monetary policy by the Central Bank of Kenya. Interest rates have declined under the new interest rate regime following assent to the Banking (Amendment) Act, The interest rates are expected to remain low over the projection period. At the same time, the Kenya Shilling exchange rate is expected to remain stable and competitive Kenya s external position is projected to strengthen over the medium term supported by a narrower current account deficit due to low international oil prices, a slowdown in consumer imports, improved earnings from tea and horticulture exports, and the resilient diaspora remittances 130. The fiscal policy aims at supporting rapid and inclusive economic growth, ensuring sustainable debt position and at the same time supporting the devolved system of Government for effective delivery of services. Consistent with this objective, the policy is set to gradually reducing fiscal deficits, with a focus on Budget Policy Statement
274 higher revenues to protect growth enhancing public investments and social spending. Fiscal deficit, as a percent to GDP, is projected to decline to 6.9 percent in FY 2016/17 and 6.4 percent in FY 2017/18 which takes into account one off 2017 General election related expenditures. Thereafter the deficit is projected to decline to 4.1 percent of GDP in 2019/ The revenue performance will be underpinned by on-going reforms in tax policy and revenue administration while in expenditure side austerity measures will be taken to reduce current spending and improve resource absorption for development purposes especially infrastructure development. Table 2.7: Macroeconomic Indicators Underlying the Macroeconomic Policy Framework 2014/ / / / / /20 Act. Rev. Budget Prel. Budget'16 BROP'16 BPS'17 BPS'16 BROP'16 BPS'17 BPS'16 BROP'16 BPS'17 BROP'16 BPS'17 Annual percentage change National Account and Prices Real GDP GDP Deflator CPI Index (eop) CPI Index (avg) Terms of Trade (-deterioration) in percentage of GDP Investment and saving Investment Gross National SavingS Central government budget Total revenue Total expenditure and net lending Overall balance (commitment basis) excl. grants Overall balance (commitment basis) incl. grants Nominal public debt, net External sector Current external balance, including official transfers Gross international reserve coverage in months of imports Source: National Treasury Risks to the Economic Outlook 132. Risks to the outlook for FY 2017/18 and the medium term emanate from both external and domestic sources. They include weaker than expected growth in the global economy, continued low demand in advanced and emerging market economies as well as the low commodity prices that may impact negatively on our exports and tourism activities Further, the uncertainty in the global markets due to potential tightening of US monetary policy and consequent increase in the US interest rates, Britain s vote Budget Policy Statement
275 to exit the European Union and persistent geopolitical uncertainty in the international oil markets may have an impact on our economy Domestically, the economy is exposed to risks including any occurrence of adverse weather conditions, public expenditure pressures especially recurrent expenditures pose a fiscal risk, and potential uncertainties associated general, thereby dampening short-term growth prospects The government will, however, continue to monitor the above risks and will undertake appropriate measures to safeguard macroeconomic stability wherever necessary. 2.7 Fiscal Policy and Outlook 136. The 2017 Medium-Term Fiscal Policy aims at supporting rapid and inclusive economic growth, ensuring a sustainable debt position and at the same time supporting the devolved system of Government for effective delivery of services. Our fiscal policy also indicates our deliberate convergence path towards the East African Community Monetary Union protocol s fiscal targets. Specifically, the Fiscal policy underpinning the FY 2017/18 Budget and MTEF aims at raising revenue from an estimated 20.4 percent of GDP in FY 2016/17 to 20.6 percent of GDP in FY 2017/18 and 21.5 percent of GDP over the medium term while containing growth of total expenditure. Total expenditures and net lending is projected to decrease from 27.8 percent of GDP in FY 2016/17 to 27.6 percent of GDP in FY 2017/18 and 26.4 percent of GDP over the medium term The overall fiscal deficit inclusive of grants is therefore projected to decrease from 6.9 percent of GDP in FY 2016/17 to 6.4 percent in FY 2017/18 and then decline to 4.0 percent of GDP over the medium term. The higher deficit continues to reflect the implementation of the one off SGR project and general election expenses. Including grants and excluding expenditures related to the SGR, the deficit declines from 5.5 percent of GDP in FY 2017/18 to 3.6 percent of GDP over the medium term This consolidation process will ensure smoother transition towards the EAC convergence criterion on the deficit inclusive of grants of 3.0 percent of GDP by FY 2020/21. Embedded in this policy is the aim to continue containing the growth of recurrent expenditures in favour of capital investment so as to promote sustainable and inclusive growth. 2.8 Deficit Financing Policy 139. The government will continue borrowing from domestic and external sources mainly on concessional terms. Non-concessional external borrowing will be limited to projects with viable expected returns and the ceiling stated in the Medium-Term Debt Strategy paper. The Government will also continue diversifying its sources of funds through accessing international capital markets. Other alternative sources of financing the government may explore over the Budget Policy Statement
276 medium term include; the Islamic financing instruments, the Samurai market, Panda bonds and Diaspora bonds The Government s borrowing plans remain anchored in the medium term debt management strategy which aims at ensuring public debt sustainability. The Government will ensure that the private sector is not crowded out through high domestic borrowing levels. This is to ensure that their participation in the development agenda is guaranteed in order to accelerate economic activities. This will be achieved by ensuring transparency in the market through issuance of the borrowing calendar and introduction of various products/initiatives aimed at widening the investor base and increasing the retail participation in the government securities market On the external financing front, the Government will minimize the degree of foreign exchange rate risk exposure associated with the external debt portfolio by adopting a deliberate approach in diversifying currency structure so as to hedge against exchange rate risks especially to new loan commitments. A cautious approach will be adopted in the issuance of external Government loan guarantees and provision of government support to minimize the risk exposure to contingent liabilities Budget Policy Statement
277 III. FY 2017/18 BUDGET AND THE MEDIUM TERM 142. The resource envelope available for allocation among the programmes is based on the fiscal policy and medium term fiscal framework which is explained as follows: Revenue Projections 143. The fiscal framework for the FY 2017/18 Budget is set based on macroeconomic policy framework set out in Chapter II The FY 2017/18 budget targets revenue collection including Appropriation-in-Aid (AIA) of Ksh 1,706.0 billion (20.6 percent of GDP) from Ksh 1,518.7 billion (20.4 percent of GDP) in FY 2016/17(Annex Tables 2 and 3). This performance will be underpinned by on-going reforms in tax policy and revenue administration, through automation and inter agency collaboration and connectivity. The Government will also complete the review the Income Tax law so as to modernize it and align it to international practice. Ordinary revenues for the budget year is projected at Ksh 1,549.4 billion (18.7 percent of GDP) in FY 2017/18 up from the projected Ksh 1,374.5 billion (18.5 percent of GDP) in FY 2016/17. Expenditure Projections 145. In the FY 2017/18, total expenditure and net lending are projected at Ksh 2,288.4 billion (or 27.6 percent of GDP) from the estimated Ksh 2,067.0 billion (27.8 percent of GDP) in the FY 2016/17 budget. Recurrent expenditures will amount to Ksh 1,339.1 billion (16.2 percent of GDP) compared with Ksh 1,186.6 billion (16.0 percent of GDP) in FY 2016/ The wages and salaries for the National Government (excluding MDAs whose budget is captured as current grants/transfer) in FY 2017/18 is projected at 4.8 percent of GDP Expenditure ceilings on goods and services for sectors/ministries are based on funding allocation in the FY 2016/17 budget as the starting point. The ceilings are then adjusted to take into account one-off expenditures in FY 2017/ The ceiling for development expenditures including foreign financed projects (including net lending) in nominal terms amounts to Ksh billion in the FY 2017/18. Most of the outlays are expected to support critical infrastructure. Part of the development budget will be funded by project loans and grants from development partners, while the balance will be financed through domestic resources A contingency of Ksh 5.0 billion is provided for in FY 2017/18. In addition, Ksh 7.7 billion is provided for the Equalization Fund Budget Policy Statement
278 Deficit Financing 150. Reflecting the projected expenditures and revenues, the fiscal deficit (excluding grants), is projected at Ksh billion (equivalent to 7.0 percent of GDP) in FY 2017/18 against the estimated fiscal deficit of Ksh billion (7.4 percent of GDP) in FY 2016/17. Including grants, the fiscal deficit is projected at Ksh billion (6.4 percent of GDP) in FY 2017/18 against the estimated fiscal deficit of Ksh billion (6.9 percent of GDP) in FY 2016/ Excluding expenditures related to the Standard Gauge Railway (SGR) which is a one off expenditure, the deficit for the FY 2017/18 amounts to Ksh billion or 5.5 percent of GDP The fiscal deficit in FY 2017/18, will be financed by net external financing of Ksh billion (2.7 percent of GDP), Ksh billion or -0.1 percent of GDP (repayment to Central Bank of Kenya) and Ksh billion (3.9 percent of GDP) from net domestic borrowing. 3.1 Budgetary Allocations for the FY 2017/ /20 MTEF 153. The budgetary allocations to the three arms of Government as well as sharable revenues to the Counties is summarised in Table 3.1 as follows: Table 3.1: Summary Budget Allocations for the FY 2017/ /20 MTEF (Ksh Million) Details 2016/ / / / National Government 1,628, ,551, ,676, ,735, Parliament 31, , , , The Judiciary 17, , , , The County Government 284, , , ,875.8 Total 1,962, ,904, ,055, ,143,683.7 Source: National Treasury Key Priorities for the 2017/18 Medium Term Budget 154. The budget submissions by MDAs will critically be reviewed with a view to remove any non-priority expenditures and shift the savings to the priority programmes. The Second MTP ( ) and the priorities of the Jubilee Administration will guide resource allocation The Government is committed to improving the implementation and absorption capacity of projects. In this regard, we shall continue to reflect specific projects planned for implementation in the development budget. This will help in monitoring and reporting on project implementation The budget for FY 2017/18 will focus on the following: Budget Policy Statement
279 Capital investments in Energy, Infrastructure, ICT sector and other development expenditure in general. This reflects the priority assigned to capital investments in our growth objectives. The Energy, Infrastructure and ICT Sector will receive 26.7 percent of total discretionary expenditures. This reflects Government s commitment in improving infrastructure countrywide for faster growth. Enhancing support to social sectors (Social Protection, Health and Education). These will continue to receive the bulk of budgetary resources especially in education and health sectors. The Social Sectors will receive 29.2 percent of total discretionary expenditures Other priority areas including security, governance, justice, and agriculture will be given priority in the allocation of resources. Medium-Term Expenditure Estimates 158. Table 3.2 provides the projected baseline ceilings for the FY 2017/18 and the medium term, classified by sector Budget Policy Statement
280 Table 3.2: Medium Term Sector Ceilings, 2017/ /20 (Ksh Million) SECTOR Printed BPS Estimates BPS Ceiling Projection Estimates Ceiling Projections 2016/ / / / / / / /20 Agriculture, Rural & Urban Development Sub_Total 46, , , , % 2.6% 3.0% 2.9% Rec. Gross 15, , , , % 1.1% 1.0% 1.0% Dev. Gross 30, , , , % 1.6% 2.0% 1.9% Energy, Infrastructure & ICT Sub_Total 529, , , , % 26.7% 28.4% 28.4% Rec. Gross 41, , , , % 4.2% 4.1% 3.9% Dev. Gross 487, , , , % 22.5% 24.4% 24.5% General Economic & Commercial Affairs Sub_Total 23, , , , % 1.2% 1.2% 1.2% Rec. Gross 12, , , , % 0.6% 0.6% 0.6% Dev. Gross 11, , , , % 0.6% 0.6% 0.6% Health Sub_Total 60, , , , % 3.4% 3.6% 3.5% Rec. Gross 28, , , , % 1.9% 1.7% 1.7% Dev. Gross 31, , , , % 1.6% 1.8% 1.8% Education Sub_Total 339, , , , % 23.3% 22.5% 22.3% Rec. Gross 315, , , , % 21.9% 21.1% 20.9% Dev. Gross 24, , , , % 1.4% 1.4% 1.4% Governance, Justice, Law & Order Sub_Total 195, , , , % 12.1% 11.0% 10.9% Rec. Gross 165, , , , % 10.8% 9.4% 9.3% Dev. Gross 29, , , , % 1.3% 1.6% 1.6% Public Administration & International Relations Sub_Total 224, , , , % 15.5% 15.1% 15.0% Rec. Gross 114, , , , % 9.0% 8.1% 7.9% Dev. Gross 110, , , , % 6.5% 6.9% 7.1% National Security Sub_Total 124, , , , % 8.1% 7.8% 7.8% Rec. Gross 124, , , , % 8.1% 7.8% 7.8% Dev. Gross % 0.0% 0.0% 0.0% Social Protection, Culture & Recreation Sub_Total 44, , , , % 2.7% 2.8% 2.8% Rec. Gross 18, , , , % 1.2% 1.2% 1.2% Dev. Gross 26, , , , % 1.5% 1.6% 1.6% Environment Protection, Water & Natural Resources Sub_Total 88, , , , % 4.4% 4.7% 5.2% Rec. Gross 19, , , , % 1.4% 1.3% 1.2% Dev. Gross 69, , , , % 3.0% 3.5% 4.0% TOTAL TOTAL 1,677, ,599, ,727, ,788, % 100.0% 100.0% 100.0% Rec. Gross 857, , , , % 60.0% 56.2% 55.5% Dev. Gross 820, , , , % 40.0% 43.8% 44.5% Source: National Treasury Allocation of the Baseline Ceilings 159. The baseline estimates reflects the current ministerial spending levels in sector programmes. In the recurrent expenditure category, non-discretionary Budget Policy Statement % Share of the Total Expenditure
281 expenditures take first charge. These include payment of statutory obligations such as interest payments, salaries for Constitutional offices and pensions Compensation of employees covering staff in the line ministries providing services for National Government functions accounts for about 4.8 percent of the GDP. Other recurrent expenditures that include operations and maintenance account for 4.7 percent of GDP Development expenditures have been shared out on the basis of the MTP priorities and strategic interventions. The following criteria was used in apportioning capital budget: On-going projects: emphasis has been given to completion of on-going capital projects and in particular infrastructure projects with high impact on poverty reduction, equity and employment creation. Counterpart funds: priority was also given to adequate allocations for donor counterpart funds. Donor counterpart funds are the portion that the Government must finance in support of the projects financed by development partners. Strategic policy interventions: priority was also given to policy interventions covering the entire nation, regional integration, social equity and environmental conservation. Finalization of Spending Plans 162. The finalization of the preparation of the detailed budgets will entail thorough scrutiny to curtail spending on non-productive areas and ensure resources are directed to priority programmes. As detailed budgets are scrutinized and the resource envelope firmed up, in the event that additional resources become available, government will utilize them to accommodate key national strategic priorities. Specifically, the following will receive priority: Intervention identified during the stakeholders consultation for 2017/18 MTEF budget; Strategic intervention in food security enhancing programmes, expansion of energy connection to rural areas and public facilities and other policy interventions to enhance regional integration and social equity; and Specific consideration to job creation for the youth based on sound initiatives identified within and outside the normal budget preparation. 3.2 Details of Sector Priorities 163. The medium term expenditure framework for 2017/ /20 ensures continuity in resource allocation based on prioritized programmes aligned to the Second MTP ( ) of Vision It also focuses on strategic policy initiatives of the Jubilee Administration to accelerate growth, employment creation Budget Policy Statement
282 and poverty reduction. The recent achievements and key priority targets for each sector are based on the sector reports that can be accessed on the National Treasury website Agriculture, Rural & Urban Development Sector 164. The overall goal of the sector is to attain national food security and sustainable management of land and the blue economy During the FY 2017/ /20 MTEF period, focus will be to increase productivity and outputs in the sector; improve market access and trade; enhance national food security; sustainably exploit the Blue Economy; strengthen institutional capacity for improved service delivery; enhance the role of youth and women in the sector; enhance accessibility, equity and sustainable management of land resource; and improve storage, access and retrieval of land and land resource data and information In order to implement the prioritized programmes, the Sector has been allocated Ksh 42.1 billion, Ksh 51.2 billion and Ksh 52.6 billion for the financial years 2017/2018, 2018/2019 and 2019/2020 respectively. Recurrent expenditure allocation is Ksh 17.0 billion, Ksh 17.4 billion and Ksh 17.9 billion for FY 2017/18, FY 2018/19 and FY 2019/20 respectively, whereas Development expenditure for the same period is Ksh 25.0 billion, Ksh 33.8 billion, and Ksh 34.8 billion. Energy, Infrastructure and Information, Communication and Technology Sector 167. The sector aims at promoting and sustaining cost-effective public utility infrastructural facilities and services in the areas of energy, transport, housing, urban and ICT and telecommunications Some of the major projects prioritized in the MTEF period FY 2017/ /20 include: 5,538MW of additional installed electricity generation capacity; Northern Corridor Transport Improvement Project; Lamu Port Southern Sudan and Ethiopia Transport corridor (LAPSSET); Standard Gauge Railway; Slum improvement projects, completion of Economic Stimulus Projects (retail and market hubs), construction of civil servant Houses, Improvement of services within Nairobi Metropolitan region, Konza Technopolis; National Optic Fiber Backborne Infrastructure (NoFBI) Phase II, promotion and development of the maritime sector, Digital Literacy Programme and County Connectivity; Construction of houses for Police and Prisons services, exploration and appraisals in oil blocks and Early Oil Pilot Scheme (EOPS) to enhance early commercialization of the crude oil discoveries; Kenya Petroleum Technical Assistance Project (KEPTAP) In order to implement the prioritized programs, the Sector has been allocated Ksh billion, Ksh billion and Ksh billion for the financial years 2017/18, 2018/19 and 2019/20 respectively. Recurrent expenditure for the medium-term is Ksh 66.5 billion, Ksh 70.1 billion and Ksh 70.6 billion Budget Policy Statement
283 respectively. The development expenditure for the same period is Ksh billion, Ksh billion, and Ksh billion respectively. General Economic and Commerce Affairs Sector 170. The strategic objectives of the sector, include; Improvement of the business environment; Mobilizing savings and investment resources for national development; Improving governance and accountability in the cooperative movement; Promoting regional integration and cooperation; and, Supporting growth and development of domestic and international trade During the FY 2017/ /20 MTEF period the sector focus will be, among others, to: Operationalize the Special Economic Zones (SEZ) Act 2015; develop new standards by KEBS; Increase KIE credit disbursed; install new milk processing machinery and equipment at New KCC; Develop Risk Based Supervision system (RBS) for Sacco Societies Regulatory Authority (SASRA); Develop an Integrated information management system for co-operatives; Improve accessibility of agricultural products/commodities to markets; equip Weights & Measures laboratories; Investigate and prosecute contraband and counterfeit cases; Facilitate potential and existing enterprises including youth and women in export business to increase exports; Comply with harmonized EAC tariffs and Common External Tariff; Reduce Non-Tariff Barriers; Commission One Stop Border Posts (OSBP) and establish a Monetary Institute for the East African Community; tourist establishments; Hold cultural tourism festivals and promote tourism to increase earnings 172. To implement the prioritized programmes, the Sector has been allocated Ksh 19.0 billion, Ksh 20.0 billion and Ksh 20.8 billion for the financial years 2017/2018, 2018/2019 and 2019/2020 respectively. Recurrent expenditure allocation for FY2017/18, FY2018/19 and FY2019/20 is Ksh 9.6 billion, Ksh 9.8 billion and Ksh 9.9 billion respectively. The Development expenditure for the same is Ksh 9.4 billion, Ksh 10.2 billion, and Ksh 10.8 billion respectively. Health 173. The general health sector goal is to attain the highest possible health standards in a manner responsive to the population needs; it aims to achieve this goal through supporting provision of equitable, affordable and quality health and related services at the highest attainable standards to all Kenyans Key projects to be implemented in the FY2017/18 MTEF period include: undertaking provision of water and sanitation activities in the counties in order to improve health and hygiene to the citizens, construction of a radiation waste management facility that is aimed at reducing radiation and radioactive substance away from the environment and people, rehabilitation of hospitals across the country, free maternity services for the deliveries in public hospitals and accredited private hospitals and low cost private hospitals under new expanded free maternity program and roll out of Universal Health Coverage in order to improve efficiency Budget Policy Statement
284 in the provision of the essential health services for Kenyans while also ensuring financial risk protection particularly for the poor and vulnerable groups In order to implement the prioritized programmes, the Sector has been allocated Ksh 54.9 billion, Ksh 62.0billion and Ksh 62.8 billion for the financial years 2017/2018, 2018/2019 and 2019/2020 respectively. The recurrent expenditure allocation for FY2017/18, 2018/19 and 2019/20 is Ksh 29.6 billion, Ksh 30.1 billion and Ksh 30.4 billion, while development expenditure allocation for the same period is Ksh 25.3 billion, Ksh 31.9 billion, and Ksh 32.3 billion respectively. Education Sector 176. The sector s overall goal is to increase access to education and training; improve quality and relevance of education; reduce inequality as well as leverage on knowledge and skills in science, technology, and innovation for global competitiveness To meet its goal as well as contribute to economic growth, the sector has prioritized the following programmes for the 2017/18 to 2019/20 MTEF Period: Teacher resource management with recruitment of 5,000 additional teachers and promotion of the existing establishment; free primary education; free day secondary education; University Education; Technical and Vocational Education and Training (TVET) infrastructure and Research Science, curriculum reform and deepening technology (ICT). An additional allocation has been provided for the establishment of seven additional universities i.e Koitalel samoei, Bomet, Alupe, Gatundu, Tom Mboya; Kaimosi and Turkana In order to implement the prioritized programmes, the Sector has been allocated Ksh billion, Ksh billion and Ksh billion for the financial years 2017/2018, 2018/2019 and 2019/2020 respectively. The recurrent expenditure allocation for FY2017/18, 2018/19 and 2019/20 is Ksh billion, Ksh billion and Ksh billion, while development expenditure allocation for the same period is Ksh 22.3 billion, Ksh 25.0 billion, and Ksh 25.4 billion respectively. Governance, Justice, Law and Order Sector 179. The sector plays a key role by creating an enabling environment for economic, social and political development of the country. It is responsible for providing security, correctional services, legal advice to Government agencies and administration of justice. It is also responsible for promoting integrity and the fight against corruption, providing prosecution services, regulating political parties, protecting witnesses and protecting human rights. Further, the Sector is charged with delimitation of electoral boundaries and management of electoral process, promotion of gender equality and inclusion of marginalized groups and communities. Additionally, the Sector plays a role in peace building and conflict management, registration services, regulation of gaming industry, provision of population management services, eradication of drugs and substance abuse, crime research and government printing services Budget Policy Statement
285 180. Some of the Sector s critical and priority areas in the 2017/18 to 2019/20 MTEF period include: modernization of policing services; preparation and management of the 2017 general elections; scaling-up issuance of third generation IDs; registration, regulation and funding of political parties; securitization of Somali border; national cohesion and integration initiatives; decentralization of prosecution services; modernization, automation and decentralization of key subsector s programmes to all the Counties; entrenchment of democracy and promotion and mainstreaming of human rights; gender equality and nondiscrimination across all sub-sectors In order to implement the prioritized programmes, the Sector has been allocated Ksh billion, Ksh billion and Ksh billion for the financial years 2017/2018, 2018/2019 and 2019/2020 respectively. The recurrent expenditure allocation for FY2017/18, FY2018/19 and FY2019/20 is Ksh billion, Ksh billion and Ksh billion, while development expenditure allocation for the same period is Ksh 21.4 billion, Ksh 27.0 billion, and Ksh 28.7 billion respectively. Judiciary 182. The overriding goal for the Judiciary is to provide equitable access to and expeditious delivery of justice During the MTEF period 2017/ /20, the Judiciary will continue to implement the Dispensation of Justice programme. The objective of this programme is to implement Judiciary s Constitutional mandate which includes inter alia; dispensing justice expeditiously to all irrespective of status, promote alternative dispute mechanisms, administer justice without undue regard to procedural technicalities and promote the purpose and principles of the Constitution In order to implement the prioritized programmes, the sub-sector has been allocated Ksh 18.0 billion for FY 2017/18, Ksh 19.4 billion for FY 2018/19, and Ksh 20.4 billion for the FY 2019/20. Public Administration and International Relations Sector 185. The Sector provides overall policy, planning, coordination and leadership for national prosperity; enhance intergovernmental relations; articulates Kenya s Foreign Policy, protect Kenya s sovereignty and enhance territorial integrity; promote prudent financial and fiscal management; oversees national legislation, public service delivery. Further, the sector promotes harmony, equity and fairness in public service remuneration and administrative justice in the public sector In the FY /20 MTEF period, the Sector intends to implement thirty six programmes which are aimed at fulfilling constitutional mandates; providing leadership for national unity, growth and prosperity; supporting devolution; implementing affirmative initiatives towards empowerment of youth, women and persons with disabilities; coordinating public benefits Budget Policy Statement
286 organizations; ensuring prudent financial management in the public sector; promoting economic and commercial diplomacy; and ensuring macro-economic stability for sustainable development To implement the prioritized programmes, the Sector has been allocated Ksh billion, Ksh billion and Ksh billion for the financial years 2017/18, 2018/19 and 2019/20 respectively. Recurrent expenditure for the medium-term is Ksh billion, Ksh billion and Ksh billion respectively. The development expenditure for the same period is Ksh billion, Ksh billion, and Ksh billion respectively. Parliament 188. Parliament plays a crucial role in strengthening the democratic space and good governance in the country. It approves overall policy and provides leadership to National Legislation and oversight with respect to public expenditures. It also vets and approves appointment of state officers as per the provisions of the Constitution During the 2017/ /20 MTEF period, the sub-sector will introduce bills to parliament; consider motions, statements, and petitions; and provide oversight over usage of public resources. It will also carry out other activities including vetting of State Officers, conduct public hearings, and prepare working policy documents on all Government sectors and conduct trainings and induction for new members after the August 2017 general elections In order to implement the prioritized programmes, the sub-sector has been allocated Ksh 30.9 billion for FY 2017/18, Ksh 31.7 billion for FY 2018/19, and Ksh 32.6 billion for the FY 2019/20. National Security 191. The Sector is mandated with the mission of deterring aggression, defending the Republic of Kenya and providing support to civilians in maintaining peace and order. The Sector will continue to defend and protect the territorial integrity and sovereignty of Kenya and modernize its operations during the FY 2017/18 and the medium term In order to implement the prioritized programmes, sector has been allocated Ksh billion for FY 2017/18, Ksh billion for FY 2018/19, and Ksh billion for the FY 2019/20. Social Protection, Culture and Recreation Sector 193. The sector is mandated to address the issues on promotion and exploitation of Kenya s diverse culture for peaceful co-existence; enhancing Kenya s reading culture; development and promotion of sports; preservation of Kenya s heritage; promotion of cultural and sports tourism; regulation, development and promotion of the film industry; and development, research and preservation of music in the Budget Policy Statement
287 country. The sector is also mandated with the enhancement and promotion of harmonious industrial relations; safety and health at workplaces; employment, industrial training, regulation of sports organizations and trade unions, productivity management, national human resource planning and development, social security, social assistance, children welfare and social development In order to implement the prioritized programmes, the Sector has been allocated Ksh 43.4 billion, Ksh 48.3 billion and Ksh 49.6 billion for the financial years 2017/2018, 2018/2019 and 2019/2020 respectively. The recurrent expenditure allocation for FY2017/18, 2018/19 and 2019/20 is Ksh 18.9 billion, Ksh 20.2 billion and Ksh 20.9 billion, while development expenditure allocation for the same period is Ksh 24.5 billion, Ksh 28.1billion, and Ksh 28.7 billion respectively. Environment Protection, Water and Natural Resources 195. The overall goal of the Sector is to ensure sustainable development in a clean and secure environment. The specific objectives are to: enhance sustainable management of environment, water, irrigation and natural resources; ensure access to water and natural resources benefits for socio-economic development; enhance capacity building for environment, water and natural resources management; increase utilization of land through irrigation, drainage and land reclamation; enhance research on environment, water and natural resources for sustainable development and protect and reclaim the environment in order to establish a durable and sustainable system of development and resilience to climate change For the 2017/ /20 MTEF period the sector has prioritized programmes intended to promote sustainable utilization and management of the environment and natural resources for socio-economic development. These programmes include: environmental management and protection, metrological services, natural resource management programme, water harvesting, irrigation, integrated regional development, mineral resource management, general administration, planning and support services In order to implement the prioritized programmes, the Sector has been allocated Ksh 69.9 billion, Ksh 81.5 billion and Ksh 93.6 billion for the financial years 2017/2018, 2018/2019 and 2019/2020 respectively. The recurrent expenditure allocation for FY2017/18, 2018/19 and 2019/20 is Ksh 21.7 billion, Ksh 21.8 billion and Ksh 22.0 billion, while development expenditure allocation for the same period is Ksh 48.2 billion, Ksh 59.7 billion, and Ksh 71.6 billion respectively. 3.3 Public Participation/ Sector Hearings and Involvement of Stakeholders 198. The Sector Working Groups (SWG) provide an all-inclusive process for identifying and prioritizing Government Projects and activities by stakeholders Budget Policy Statement
288 The involvement of stakeholders is a Constitutional requirement. The process is commenced early in the budget preparation process with the launch of SWGs The Constitution provides that the public should be involved in the budget making process through public participation. Further, the Public Finance Management (PFM) Act, 2012 section 25 (5) requires the National Treasury while preparing the Budget Policy Statement to seek views of various institutions and the public. In this regard, the sector priorities were subjected to public sector hearings in October All the sectors incorporated views arising from the Public during the sector hearings Specific issues raised during the public sector hearings under the various Sector Working Groups included: Agriculture, Rural and Urban Development Sector 201. There was concern about the deficit budget and the public felt that the budget of the sector needs to be reviewed upwards due to the importance and contribution of the sector to the economy. Strategic partnerships with donors and other stakeholders could be enhanced as a way of also addressing the deficit. The sector noted this and agreed on the importance of strengthening the linkages The public stated that post-harvest equipment faces a number of taxes like import duty and VAT, and wanted these taxes be removed as for the other agricultural production implements to boost and curb post-harvest losses. The sector stated that they are in talks with National Treasury to zero rate these equipment. Energy, Infrastructure and ICT Sector 203. The public was pleased with the progress in catering for people with disability in terms of infrastructure through having universal design in construction of roads and houses. The sector noted this and offered assurance that they would keep enforcing these in the various infrastructure put up to ensure the various groups of people are catered for There were also calls by the public to have affordable housing to the masses in addition to providing affordable safe energy. The sector stated that they are liaising with the private sector to provide housing to the public through using affordable building technologies. They are also improving access to electricity which is now at percent and they target to increase to 70 percent in General Economic and Commercial Affairs Sector 205. With regards to tourism, the public noted that arrivals in tourism in MTEF figures in the presentation figures were a reduction even from the strategic plan/vision It was explained that the figures were revised downwards especially owing to the security challenges that affected tourism and also the budgetary provisions Budget Policy Statement
289 206. Emphasis was given on linkages with the social protection sector in giving innovations to cash transfers. Especially in skills training and households budgeting and investment to ensure the transfers sustain and improve livelihoods. It was also recommended that priority areas should include robust interaction with the civil society in addition to linking the report not only to the MTP II but also to the Kenya industrial transformation programme. The sector welcomed the recommendation. Health 207. The public commended the sector on the transformation KNH has had in terms of service delivery, equipment, infrastructure and quality of service and hoped this will be up scaled and maintained As regards disability, the sector was asked to take not of cerebral palsy whose prevalence was on the rise. In addition they are to conduct training and specialised services for staff to deal with the various kinds of disabilities The public sought to understand the relationship between ministry and county governments in the provision of health services. The sector informed the public that the ministry s role is to set norms, standards and regulation and they do work in collaboration and cooperation with county government through the intergovernmental forum up to the higher levels of IBEC and the Summit. Education 210. On teacher training institutions the public wanted to know what the sector is doing to ensure quality. The sector said they achieve this by ensuring capitation and they have set aside funds to improve infrastructure, also evaluating the minimum entry level for their teachers in training institutions There was also concern that TVET allocation in HELB being too low to cater for the fees charged by institutions. The HELB said that it is working with the ministry to ensure that the amounts provided go to the needy students and they are increasing their loan recovery in order to increase loan for funding. They are also working with other bodies that fund education to administer the funds. The sector was also urged to starting a campaign on TVET loans to ask student to apply for the loan through TVET to create awareness and increase the uptake of this new product Further the public wanted to know how the sector compensates counties that fund school activities. It was clarified that primary education is a national government function funded at the national level but if counties fund education related activities then it is a complementary activity unless it is Early Childhood Development (ECD) which is a clearly stipulated function The relocation of KTTC was also questioned and it was explained to be government strategic decision due to its interaction with other stakeholders and it is of national importance Budget Policy Statement
290 Governance, Justice, Law and Order Sector 214. The public wished to know IEBCs state of preparedness for 2017 election. They were informed that this is informed by the IEBC election preparedness plan and also the strategic plan and they will endeavour to carry out the elections within the approved budget and timelines The sector was also asked to capture commitments from donor funding to indicate the counterpart funding to facilitate funding. The sector responded that donor commitments are still being firmed up and once this is done the counterpart will be given and indicated in the BPS The public also called for the need to open the space of engagement between police, citizens and CSOs to dispense the fears, create a cordial relationship and address pertinent issues rather than having reactive tendencies after something displeasing has happened. Public Administration and International Relations Sector 217. Regarding the initial tensions between national and county government the public was pleased and commended efforts of working together for the developmental agenda of the country. This relationship was as a result of a robust intergovernmental relations body put in place that engages with the 2 levels of government to bring out a more cordial relationship The public also reiterated the need to cascade intergovernmental relations to the county levels and lower levels e.g. public participation and civic education. This is together with strengthening capacities for counties to improve own revenue generation and diversify the revenue sources. The sector stated that there is a public participation guideline and they will put effort to cascade it to the counties and that the structures are operationalized. Further the National Treasury is working with governors on how counties can diversify their revenue base and there is progress being done. Social Protection Culture and Recreation Sector 219. The public raised concern over the many strikes especially in the counties which are attributed to challenges in the Ministry of labour on staff shortage in labour offices and wanted to know the mechanisms in place to fill the voids. The sector responded that there are plans to hire 56 labour officers and approvals are in place and together with the succession issues which will be addressed by the sector Regarding the cash transfers to older persons, there was concern that the data on the number of people getting the transfer and their location isn t publicly available. The sector clarified that the data is available on the social protection website and on the single window platform where information about the recipients can be traced up to the ward level There was a call to have more investment in the arts in order to capture the high population of youth and provide employment in areas such as fashion, performing arts, film and music etc. Further there is need to lower the high taxation on imports for software for film creation and reduce multiple taxation on royalties for artistes, which make the country uncompetitive. The sector appreciated these Budget Policy Statement
291 recommendations and on the issue of taxation they stated that they are in talks with the National Treasury to harmonise the taxes. Programme Performance Information for 2017/ /20 MTEF Period 222. Information on programmes outputs, key performance indicators, and the set targets for the 2017/ /20 MTEF period is contained in Annex Table 6, annexed separately to this 2017 BPS Budget Policy Statement
292 IV. COUNTY FINANCIAL MANAGEMENT AND DIVISION OF REVENUE 4.1 Performance of County Governments in FY 2015/ County Governments budget allocations for FY 2015/16 amounted to Ksh billion, a 12 percent growth from FY 2014/15 (Table 4.1). Development budget allocations grew by 10 percent, while recurrent budget allocations grew by 15 percent. The counties aggregate expenditure in FY 2015/16 amounted to Ksh billion, or 80 percent of allocations. Development spending was 35 percent of the total actual expenditure, growing by 14.5 percent in the FY2015/16 compared to the actual spending in the FY2014/15. Table 4.1: County Governments Aggregate Budgets and Expenditures (Ksh billions) Financial Year Budget Allocations Expenditure Development Recurrent Total Development Recurrent Total 2013/ / / Source of data: Controller of Budget 224. In FY 2015/16, County Governments collected an aggregate of Ksh 35 billion from local revenue sources, equivalent to 63.4 percent of the targeted Ksh 55.2 billion. Three key observations can be made from this performance. Firstly, counties own-source revenue (OSR) is growing significantly slower. The counties OSR grew by about Ksh 7.6 billion (28.9 percent growth) from Ksh 26.3 billion in the FY 2013/14 to Ksh 33.9 billion in the FY2014/15. In contrast, between 2014/15 and 2015/16, the increase was 3.2 percent, equivalent to only Ksh 1.1 billion. (Figure 4.1a). This underscores the need for counties to apply more fiscal effort, while also improving efficiency in revenue collection. Secondly, actual OSR collection as a proportion of target has dropped from 67.3 percent in FY 2014/15 to 63.4 percent in FY 2015/16. Collections in FY 2015/16 remained below even the 2014/15 target, which was itself downgraded due to poor performance in the previous year. In general, the escalating misalignment between target and actual OSR collection highlights the difficulty counties continue to face in preparing realistic forecasts. Thirdly, quarter three (i.e. January-March) is the most productive for County Governments revenue-wise (Figure 4.1b). This is when property rates and business licenses -- the two decentralized tax bases with greatest potential -- become due for collection. Counties would do well therefore to develop and maximize the scope for collecting these two charges Budget Policy Statement
 5,000 4,000 3,000 2,000 1,000 Source of data: Controller of Budget 0 Jul-15 Aug-15 Sep-15 Oct-15 Nov-15 Dec-15 Jan-16 Feb-16 Mar-16")
293 Figure 4.1a: Counties annual OSR performance (Ksh billion) Figure 4.1b: Counties quarterly OSR performance in FY 2015/16 (Ksh million) 5,000 4,000 3,000 2,000 1,000 Source of data: Controller of Budget 0 Jul-15 Aug-15 Sep-15 Oct-15 Nov-15 Dec-15 Jan-16 Feb-16 Mar-16 Apr-16 May-16 Ju QUARTER 1 QUARTER 2 QUARTER 3 QUARTER County Governments compliance with fiscal responsibility principles Compliance with the requirement for development spending allocations 225. In FY 2015/16, forty-five (45) counties complied with the requirement in the PFM Act, 2012 that at least 30 percent of budgets be allocated to the development expenditure (Figure 4.2). Eight counties managed to allocate more than half of their budgets to development. The eight are Turkana, Mandera, Kwale, Tana River, Wajir, Kilifi, Kitui and Makueni. All except the last two feature in the list of marginalized counties as per the Marginalization Policy developed by the Commission on Revenue Allocation (CRA). Nairobi and Kiambu counties were below the 30 percent budget allocation to development spending marginally. Figure 4.2: Recurrent and Development Budget Allocations for FY 2015/16 (Percent) Nairobi Kiambu Nyeri Taita Taveta Mombasa Kirinyaga Narok Meru Homa Bay E. Marakwet Vihiga Nakuru Kericho Nyandarua Isiolo Uasin Gishu Kisii Bungoma Kajiado Samburu Baringo Tharaka N. Embu West Pokot Laikipia Kisumu Nyamira Migori Garissa Lamu Nandi Siaya Bomet Trans Nzoia Kakamega Murang'a Machakos Marsabit Busia Makueni Kilifi Kitui Wajir Tana River Kwale Mandera Turkana Source of data: Controller of Budget Development Recurrent 226. However, compliance with this principle does not always translate into actual development spending of similar proportion. In Taita Taveta for instance, development was allocated 30 percent of budget, but only15 percent was spent on development. In fact, this trend is true for all counties, with the exception of Budget Policy Statement
294 Mombasa, which allocated 31.6 percent of its budget to development but spent a slightly higher proportion (32.5 percent). In general, variances between budget allocations and actual spending are of concern, more so when they are significant as was the case in Makueni and Machakos (-23 percent and -18 percent, respectively). It is critical for the counties to narrow such variances by striving to meet their development spending targets, as per approved County Integrated Development Plans (CIDPs) and County Fiscal Strategy Papers (CFSPs) Compliance with requirements on recurrent spending and salary costs 227. Personnel emoluments by the County Governments remains at 40 percent of overall expenditure, although as a proportion of recurrent spending, salary costs exceed 60 percent. (Table 4.2). Since their establishment, the counties aggregate personnel-related spending has grown by more than 53 percent, which hints at a rapid increase in new recruitments in the counties. The Public Finance Management (County Governments) Regulations, 2015, requires that counties wage bill be set at 35 percent of total revenue i.e. National Government transfers and local revenues. In FY 2015/16, aggregate personnel emoluments represented 40.2 percent of combined county revenues, a 10 percentage-point increase from FY 2014/15. For a number of County Governments, personnel costs dominate their budgets, leaving little fiscal space for Operations and Maintenance (O&M) or capital spending. The need for counties to contain their wage bill is now urgent, as is the need to expand development spending. Table 4.2: Summary of County Governments Expenditure Figures in KSh billions, except where indicated otherwise 2013/ / /16 Aggregate Recurrent Expenditure, of which: Personnel Emoluments Operations & Maintenance Aggregate Development Expenditure Overall Expenditure Personnel emoluments: as % of total recurrent expenditure as % of overall expenditure Source of data: Controller of Budget Prudent management of fiscal risks 228. The legal framework for Public Finance Management requires County Governments to disclose specific fiscal risks with potentially significant impact on the county economic environment, and to prudently manage such risks. In this context, it is important that among other measures, the counties: i) implement efforts to enhance own-source revenues to minimize overreliance on Exchequer transfers; ii) accurately forecast own-source revenue to avoid negative impacts on their budgets; and, iii) adhere more strictly to expenditure ceilings set out in County Fiscal Strategy Papers. In addition, efforts should be taken to avoid duplication of Budget Policy Statement
295 functions between the two levels of Government, as this carries the risk of generating intergovernmental conflicts, wasteful spending and financing gaps that could adversely affect implementation of the fiscal framework Enhancement of counties own-source revenues and ensuring predictability in taxes 229. As indicated in the BPS 2016, an Interagency Working Committee -- under the Intergovernmental Budget and Economic Council (IBEC) -- has been preparing a policy framework and a National Framework Legislation to support County Governments own-source revenue (OSR) efforts. A draft National Policy on County Government s OSR is ready, and is being subjected to stakeholder consultations. The draft Policy proposes measures to broaden County Governments tax bases, while strengthening their revenue administrative capacity. The draft Policy focuses on four distinct but interrelated themes as follows: (i) (ii) (iii) (iv) Legal and institutional framework for own source revenues: This aims to provide direction towards a more unified and coherent legal framework underpinning County Governments taxation efforts. Revenue potential: This aims to guide assessment of the counties revenue potential, by examining efficiency improvements. In this context, the National Treasury will undertake a County revenue potential study. The study will establish the current base for each county s local revenue, and articulate each county s tax potential and tax effort. It is expected that the Study s findings will help the counties improve their revenue forecasting. Preliminary outputs of the Study are expected in December 2016, with subsequent deliverables being spread over FY 2016/17 and FY 2017/18. Revenue assignments: This aims to clearly delineate revenue mandates both between the two levels of Government and among the counties to eliminate disputes. Capacity for revenue administration: This aims to assess counties existing capacity to manage revenue-related responsibilities, including collection and administration of taxes, fees and service charges and make recommendations on how to strengthen counties institutional capacity for better tax administration Further, the Interagency Working Committee has drafted a Bill to regulate the process to be followed by County Governments in imposing, varying or waiving taxes, fees, levies and other charges. The draft County Governments (Tax Regulation Process) Bill establishes the process whereby the counties may exercise their taxation authority -- in accordance with Articles 209 and 210 of the Constitution -- while the National Government, through the National Treasury exercises its policy oversight role. Like the draft Policy, the draft Bill is being Budget Policy Statement
296 subjected to broad stakeholder consultations before introduction in Parliament following Cabinet approval Short term borrowing by County Governments for management of cash flows 231. Pursuant to an Intergovernmental Budget and Economic Council (IBEC) agreement, the National Government will develop guidelines to regulate short-term borrowing by County Governments from the Central Bank of Kenya (CBK). Access to short-term borrowing will enable the counties to better manage their cash flow, while eliminating need for high-interest commercial bank loans The above guidelines will mitigate fiscal risks, which could arise from short-term lending or implicit guarantees to County Governments. One obvious risk is the realization of contingent liabilities. According to the 2016 Medium Term Debt Strategy (MTDS), contingent liabilities arising from the portfolio of lending and guarantees to counties can increase the National Government s debt stocks and servicing costs. Another risk is that of County Governments lowering their fiscal effort and focusing less on maximization of local revenue, due to the ability to access short-term borrowing. Apart from dealing with the above risks, there is need to enforce more strictly expenditure measures aimed at minimizing wastage and enhancing productivity of public spending. In addition, the National Treasury will sustain the efforts to end delays in disbursement of equitable share transfers and other factors which might lead to escalation of demand for short-term finance by the counties The National Treasury, through the Public Debt Management Office (PDMO) will pursue a number of strategic interventions aimed at supporting County Governments to plan for and manage their debt in a more sustainable manner. Among the interventions are: i) strengthening the institutional arrangement for public debt management at the county level; ii) providing technical assistance to County Treasuries in the preparation of Medium Term Debt Strategies as required by the PFMA; iii) upgrading of the debt recording system within IFMIS to correctly capture, analyze and report on any county borrowing; and, iv) ensuring comprehensive, accurate and timely information on any borrowing by the counties, including regular publication of public debt information to enhance transparency on debt management. 4.3 Finalizing the transfer of assets and liabilities to the counties 234. To finalize the transfer of assets and liabilities from the defunct Local Authorities (LAs) to the County Governments, a draft Legal Notice has been prepared to facilitate this transfer process. The transfer is expected to be concluded by March 31 st, Among assets and liabilities of the defunct LAs to be covered in this process are: i) pending bills; ii) tax arrears; and, iii) statutory deductions relating to the National Hospital Insurance Fund (NHIF), National Social Security Fund (NSSF), Pension Funds, VAT and PAYE. Preparation of the draft Legal Notice to enable the transfer has been done by the Intergovernmental Relations Technical Committee (IGRTC), which succeeded the defunct Transition Authority Budget Policy Statement
297 (TA). The IGRTC will also coordinate the actual auditing of assets and liabilities. As part of the institutional arrangement to facilitate this transfer process, multiagency committees are to be set up in the counties, and the Auditor-General will audit the final outcome. 4.4 Vertical Division of Revenue 235. County Governments equitable share of revenue raised nationally for FY 2017/18 is arrived at by adjusting the counties equitable share for 2016/17 (i.e. Ksh billion) by a factor of 6.72 percent, which is the average month-onmonth inflation for FYs 2013/14, 2014/15 & 2015/16, as reported by the Kenya National Bureau of Statistics (KNBS). The rationale for this adjustment factor is to ensure that counties are adequately compensated for escalation in costs related to the delivery of devolved functions. Based on this adjustment, County Governments equitable share in FY 2017/18 is estimated to be Ksh billion (Table 4.3). Table 4.3: County Governments Equitable Revenue Share Allocation (Ksh Million) Budget item 2015/ / /18 Baseline (i.e. allocation in the previous FY) 226, , ,300.0 Baseline adjustments: 1. Baseline adjustments (Due to additional county functions) 2,946.0 Adjusted baseline: 229, , ,300.0 Additional revenue measures 1. Adjustment for revenue growth 23, , , Other adjustments 4, Adjustments negotiated in Parliament post-bps 1,766.5 Computed equitable revenue share allocation 259, , , In addition to the above equitable share allocation, County Governments will in FY 2017/18 receive Ksh 34.0 billion through various financing streams as follows (Tables 4.4 and 4.5): From the National Governments equitable revenue share, Ksh 13 billion conditional allocations for: i) level-5 hospitals; ii) free maternal healthcare; iii) leasing of medical equipment; and, iv) compensation for foregone user fees. Ksh 605 million as a supplement for construction of offices in five county headquarters that did not inherit adequate office space. Ksh 7.9 billion from the Road Maintenance Fuel Levy Fund (RMLF). As in previous years, this is calculated at 15 percent of projected FY 2017/18 collections by the Kenya Roads Board (KRB). Ksh 12.5 billion from proceeds of external loans/grants to be transferred to County Governments as conditional allocations, and which will finance devolved functions in accordance with signed financing agreements for the loans/grants. The loans/grants to be distributed to counties in FY 2017/18 are as follows: i) a World Bank loan financing the Health Support Project (also known as Result Based Financing) in 21 Arid- and Semi-Arid counties (Ksh billion); ii) a World Bank loan supporting the Kenya Devolution Support Budget Policy Statement
298 Programme (KDSP), which is facilitating capacity building and performance grants to all counties (Ksh 5.5 billion); iii) a World Bank loan financing the National Urban Transport Improvement Project (NUTRIP) in two counties (Ksh 6.02 billion); and, iv) financing under the Kenya-Italy Debt for Development Programme (KIDDP) financing rehabilitation of youth polytechnics (Ksh 97 million) and rehabilitation of sub-county hospitals (Ksh 51 million). For all the loans/grants above, release of funds to counties will be based on Guidelines for Management of Intergovernmental Fiscal Transfers, which was developed by an interagency committee under the auspices of the National Treasury, pursuant to a directive from The Summit. However, management of loans/grants from NUTRIP and KIDDP is to be undertaken by the National Government with involvement of County Governments through Project Steering Committees and Project Implementation Units for each programme/project. Proceeds from the above-mentioned World Bank loan for KDSP will be distributed to counties via two grants: i) a capacity building ( level 1 ) grant of Ksh 1.5 billion, to be distributed using two equallyweighted parameters i.e. equal share and the revenue sharing formula approved by Parliament; and, ii) a performance ( level 2 ) grant of Ksh 4.0 billion, to be distributed on the basis of counties attainment as determined through an annual independent performance assessment. Whereas the level 2 grant is included in County Governments FY 2017/18 allocations from loans/grants, in Table 4.5, its distribution is not reflected in Table 4.6, because distribution will be determined upon completion of the performance assessment in early Table 4.4: Vertical Division of Revenue (Ksh Million) Type/level of allocation 2015/ / /18 National Government 991, ,099, ,250,275.8 Of which: Free maternal healthcare 4, , ,369.2 Leasing of Medical Equipment 4, , ,500.0 Compensation for user fees forgone Level 5 hospitals 3, , ,200.0 Special Purpose Grant (Emergency Med. Serv.) Supplement for construction of county headquarters Equalization Fund 6, , ,727.0 County equitable share 259, , ,136.2 Total shareable revenue 1,251, ,380, ,549, As highlighted in Table 4.4, more than Ksh 7.7 billion is also allocated in FY 2017/18 through Equalization Fund. The National Treasury appointed Fund s Administrator, and the Fund s newly-constituted Board commenced operations. Moreover, an Equalization Fund account has been opened at the Central Bank of Kenya (CBK) with a balance of Ksh 6.4 billion as at 30 th June, 2016, being undisbursed allocations from previous years. In the financial year 2016/17, a further amount of Ksh 6.0 billion was budgeted for distribution to 14 Counties identified in the Policy on Marginalized Areas, which was developed by the CRA Budget Policy Statement
299 Table 4.5: Disaggregation of County Governments Allocation (Ksh Million) 2015/ / /18 County equitable share 259, , ,136.2 Additional conditional allocations, of which: Free maternal healthcare 4, , ,369.2 Leasing of medical equipment 4, , ,500.0 Compensation for user fees forgone Level 5 hospitals 3, , ,200.0 Special Purpose Grant (Emergency Med. Serv.) Supplement for construction of county headquarters Allocation from Fuel Levy Fund (15% of collections) 3, , ,875.0 Allocations from loans and grants 10, , ,541.4 Total County Allocations 287, , , Horizontal allocation of revenue 238. Horizontal distribution of County Governments equitable revenue share allocation for FY 2017/18 is based on the revised revenue sharing (second generation) criteria recommended by the Commission on Revenue Allocation (CRA) and approved by the Senate and the National Assembly respectively, on 20th April and 22nd June, The criteria takes into account population (45 percent), basic equal share (26 percent), poverty (18 percent), land area (8 percent), fiscal responsibility (2 percent) and development factor (1 percent). The population data used in the above criteria is based on the 2009 census, as adjusted by the Kenya National Bureau of Statistics (KNBS) following the Court of Appeal (Civil Appeal) Ruling No. 64 of It is worth noting that application of the adjusted population data has intense implications particularly for Mandera, Wajir and Garissa counties. Table 4.6 shows the projected transfer to each county. 4.6 Conclusion 239. In order to enhance performance of County Governments, the National Treasury will implement wide-ranging reforms under the Revised Public Finance Management Reform Strategy ( ). Among other areas, the reforms are aimed at strengthening counties own-source revenue (OSR) systems, improving their capacity to formulate realistic and credible budgets and supporting County Assembly oversight committees. It should also be noted that the National Treasury has received comments from the Commission on Revenue Allocation (CRA) which have been incorporated in the foregoing sections of this chapter Budget Policy Statement
300 Table 4.6: Revenue Allocation for Each County Government County Allocation Ratio 2016/ /18 Total Allocations Allocation Ratio Equitable Share Level-5 Hospitals Compensation for user fees foregone Free Maternal Road Maintenance Healthcare Levy Fund Leasing of Medical Equipment Supplement for construction of county headquarters Loans & Grants Total Allocations Baringo 1.71% 5,129,582, % 4,965,660,256-13,191,000 51,951, ,725,000 95,744, ,617,447 5,379,889,996 9,686 Bomet 1.81% 5,336,838, % 5,264,796,416-16,713,356 59,038, ,600,000 95,744,681-29,157,447 5,604,050,158 7,679 Bungoma 2.95% 8,735,435, % 8,794,603,104-32,837,307 59,038, ,525,000 95,744,681-38,007,447 9,251,755,796 6,731 Busia 2.09% 6,171,913, % 5,833,155,120-16,934, ,389, ,562,500 95,744,681-30,582,447 6,295,368,118 8,466 Elgeyo/Marakwet 1.26% 3,805,329, % 3,619,547,536-8,788,919 40,106,303 95,287,500 95,744,681-73,022,447 3,932,497,385 10,631 Embu 1.48% 4,659,902, % 4,098,165, ,040,462 10,724,225 39,763, ,887,500 95,744,681-26,232,447 4,679,558,660 9,070 Garissa 2.22% 6,864,515, % 5,803,241, ,739,884 12,964,636 42,211, ,775,000 95,744,681-69,152,447 6,520,829,907 17,344 Homa Bay 2.17% 6,433,098, % 6,521,168,288-22,185, ,153, ,675,000 95,744,681-72,807,447 6,995,734,622 7,261 Isiolo 1.18% 3,496,421, % 3,769,115,616-3,472,461 20,318,473 99,225,000 95,744, ,000,000 38,014,947 4,146,891,178 28,957 Kajiado 1.70% 5,150,776, % 5,773,327,888-16,955,365 43,855, ,987,500 95,744,681-68,077,447 6,149,947,916 8,952 Kakamega 3.43% 10,530,015, % 10,110,802, ,283,237 37,789, ,205, ,175,000 95,744,681-41,307,447 11,141,307,292 6,559 Kericho 1.73% 5,149,062, % 5,234,882,800-18,048,789 71,927, ,812,500 95,744,681-29,082,447 5,587,498,951 7,430 Kiambu 2.87% 8,932,697, % 9,692,011, ,716,763 34,671, ,604, ,150,000 95,744,681-40,257,447 10,728,156,437 6,613 Kilifi 2.86% 8,578,765, % 9,961,234,128-25,969, ,461, ,237,500 95,744, ,772,447 10,627,419,963 9,585 Kirinyanga 1.36% 4,035,586, % 4,427,215,168-11,282,570 38,274, ,550,000 95,744,681-27,057,447 4,716,124,596 8,934 Kisii 2.73% 8,471,708, % 7,448,490, ,572,254 26,138, ,013, ,087,500 95,744,681-34,632,447 8,359,680,228 7,257 Kisumu 2.19% 6,849,697, % 6,551,081, ,017,341 21,299, ,962, ,462,500 95,744,681-32,382,447 7,351,951,182 7,591 Kitui 2.80% 8,285,242, % 8,674,948,640-22,499,906 64,481, ,375,000 95,744,681-95,917,447 9,181,967,297 9,071 Kwale 1.97% 5,935,176, % 7,239,095,072-15,209, ,154, ,575,000 95,744,681-71,182,447 7,730,961,711 11,901 Laikipia 1.33% 4,012,138, % 4,487,042,400-9,968,208 52,054, ,125,000 95,744,681-52,462,447 4,815,397,053 12,069 Lamu 0.79% 2,479,974, % 2,452,916,512-2,451,034 8,815,513 64,575,000 95,744, ,000,000 33,892,447 2,779,395,187 27,388 Machakos 2.61% 8,020,334, % 7,418,576, ,583,815 24,129,039 71,551, ,300,000 95,744,681-34,557,447 8,223,442,899 7,491 Makueni 2.30% 6,751,278, % 6,820,304,448-19,435,760 68,298, ,550,000 95,744,681-33,057,447 7,216,391,160 8,161 Mandera 3.45% 10,028,184, % 8,286,071,632-25,474,920 51,729, ,137,500 95,744,681-65,037,447 8,742,195,265 14,124 Marsabit 2.00% 5,855,548, % 6,551,081,904-6,643,714 19,137, ,462,500 95,744,681-69,182,447 6,914,252,611 23,754 Meru 2.50% 9,423,247, % 7,747,626, ,872,832 31,648,428 88,035, ,962,500 95,744,681-3,955,382,447 12,496,272,735 9,220 Migori 2.25% 6,833,223, % 6,461,341,056-21,655, ,699, ,100,000 95,744,681-72,782,447 6,939,323,997 7,570 Mombasa 2.00% 6,328,843, % 8,166,417, ,439,306 23,385,934 79,921, ,987,500 95,744,681-36,432,447 9,005,328,644 9,595 Muranga 2.06% 6,075,714, % 6,192,118,512-20,138,691 64,789, ,012,500 95,744,681-55,482,447 6,591,286,569 6,996 Nairobi 5.00% 14,988,400, % 15,495,253,088-79,423, ,791, ,925,000 95,744,681-2,154,807,447 18,435,944,490 5,882 Nakuru 3.12% 9,611,129, % 9,303,134, ,872,832 38,723, ,995, ,912,500 95,744,681-39,282,447 10,241,665,459 6,391 Nandi 1.83% 5,400,805, % 5,115,228,336-18,086,363 51,814, ,662,500 95,744,681-28,782,447 5,444,319,000 7,233 Narok 2.04% 6,069,533, % 6,521,168,288-20,595,297 58,353, ,675,000 95,744,681-74,087,447 6,941,624,271 8,164 Nyamira 1.60% 4,753,135, % 4,606,696,864-13,175,221 68,795, ,275,000 95,744,681-27,507,447 4,933,194,446 8,249 Nyandarua 1.66% 4,883,603, % 4,786,178,560-12,735,922 36,271, ,000,000 95,744, ,000,000 36,957,447 5,214,888,593 8,749 Nyeri 1.71% 5,453,740, % 4,965,660, ,861,272 13,701,379 39,866, ,725,000 95,744,681-28,407,447 5,681,966,692 8,195 Samburu 1.37% 4,045,213, % 3,769,115,616-5,235,578 14,875,108 99,225,000 95,744,681-78,532,447 4,062,728,430 18,146 Siaya 1.92% 5,713,934, % 5,563,932,576-18,194,808 97,963, ,475,000 95,744,681-67,907,447 5,990,217,964 7,116 Taita Taveta 1.27% 3,809,410, % 3,888,770,080-5,296,305 29,579, ,375,000 95,744,681-57,504,947 4,179,270,052 14,689 Tana River 1.53% 4,620,956, % 5,294,710,032-5,682,537 19,120, ,387,500 95,744, ,000,000 53,957,447 5,729,602,445 23,873 Tharaka Nithi 1.21% 3,622,329, % 3,679,374,768-8,218,119 24,272,615 96,862,500 95,744, ,000,000 43,949,947 4,069,422,629 11,145 Trans Nzoia 1.96% 5,785,005, % 5,653,673,424-21,304,915 57,685, ,837,500 95,744,681-30,132,447 6,007,378,941 7,339 Turkana 4.03% 11,707,868, % 10,050,974,976-25,634,941 49,657, ,600,000 95,744,681-65,352,447 10,551,964,913 12,342 Uasin Gishu 2.00% 5,854,438, % 5,713,500,656-20,813,065 35,826, ,412,500 95,744,681-30,282,447 6,046,580,277 6,766 Vihiga 1.49% 4,423,789, % 4,457,128,784-12,657,201 55,597, ,337,500 95,744,681-43,632,447 4,782,098,253 8,428 Wajir 2.78% 8,147,672, % 7,179,267,840-15,784,997 52,379, ,000,000 95,744,681-78,997,447 7,611,174,514 19,055 West Pokot 1.66% 4,947,297, % 4,726,351,328-12,128,484 43,444, ,425,000 95,744,681-95,792,447 5,097,886,154 9,946 GRAND TOTAL % 302,198,516, % 299,136,160,000 4,200,000, ,000,000 3,369,237,538 7,875,000,000 4,500,000, ,000,000 12,541,407, ,126,805,038 10,804 Per capita allocation (Kshs)
301 ANNEX 1: STATEMENT OF SPECIFIC FISCAL RISKS Introduction 1. Kenya s recent growth performance remains robust and the outlook is positive. Despite positive economic policies and structural reforms undertaken under the Economic Transformation Agenda program, the economy remains vulnerable to shocks, reflecting less favourable global financial market conditions, as well as security threats and extreme weather events. To this end, maintaining fiscal stability is critical for safeguarding against these adverse shocks and ensuring that growth is sustained despite challenging circumstances. 2. The Statement of Specific Fiscal Risks is part of the requirement under the Public Finance Management Act, 2012 for prudent management of risks. It outlines Kenya s exposure to fiscal risks that are associated with assumptions used for fiscal projections, public debt dynamics, operations of state corporations, contingent liabilities, vulnerabilities of the financial sector, as well as risks posed by nature. 3. The Statement is intended to inform the parliament and the public about the country s exposure to these various sources of risk, and what more can be done to ensure fiscal viability in the event of the occurrence of the stated risks. 4. Overall, the Statement highlights the following: spending at current levels and low absorption of development funding, combined with low revenue collections, makes it more difficult for the government to achieve its fiscal targets; Shocks to the exchange rate could impact the size of debt servicing, the terms of trade, and inflation; the financial sector remains sound and is adequately capitalized despite global financial crisis; Contingent liabilities from key State Corporations present minimal fiscal risks; and Risks from the devolved system of government remain a key concern. Macroeconomic Assumptions Changes 5. Changes in macroeconomic assumptions create risks to both revenue and expenditure projections as they play a key role in the formulation of the budget. This section reviews past macroeconomic and fiscal performance in Kenya and then assesses four important sources of fiscal risk to the budget namely: Reduction in real GDP. Inflation instability; Exchange rate volatility, and Volatility of commodity prices on imports;
302 6. Table 1 presents the magnitude of first round impacts of various macroeconomic variables mentioned above on fiscal aggregates. Table 1: Fiscal Sensitivity to Key Macroeconomic Variables, 2017/18 (Ksh bn) Revenue Expenditure Budget Balance One percentage point reduction in real GDP (%) One percentage point increase in inflation rate (%) % depreciation in exchange rate (Ksh/US$) percentage increase in value of imported goods (US$ ) All shocks Combined Source: Estimates from National Treasury 7. The reduction in real GDP and depreciation of the exchange rate results in reduction of revenue against expenditures while an increase in inflation and value of imports in dollar terms results in higher revenue against expenditures. Overall, when all the shocks are applied at the same time, revenues increase more than expenditures. Assessment of Past Forecast Accuracy of Underlying Assumptions and Budgetary Aggregates 8. Overall, the macroeconomic assumptions underlying the recent budgets and actual budget outturn have generally been accurate with minimal deviations as shown in Table 2. Over the period 2013/ /17, the average deviation between the assumed and provisional actual real GDP growth rates was only 0.1 percentage point. With respect to inflation assumption, the largest deviation was in FY 2014/15 by only 1.0 percentage point which reflects the stability of inflation rates. The depreciation of the shilling exchange rate against major international currencies since the FY 2015/2016 was due to the strengthening of the US dollar Budget Policy Statement
303 Table 2: Deviations in Macroeconomic and Fiscal Aggregates 2013/ / / /17 Financing Net Foreign Financing Other Net Domestic Financing Of which: Sovereign Bond Proceeds Others Memo items: Nominal GDP (Ksh billion) 5, , , , , , , , Source: National Treasury Source: National Treasury 9. The actual performance of fiscal aggregates vis-à-vis target was largely as per target. Ordinary revenue collection performance was broadly on target with all the tax revenue categories recording slight positive variances except income tax. The underperformance in A-i-A largely reflects the under reporting from the relevant ministries/departments. 10. The average deviation of total expenditure and net lending between FY 2013/14 and FY 2016/17 represented an underspending of Ksh 97.2 billion. This shortfall was attributed to lower absorption in development expenditures in FY 2016/17. The recurrent expenditure had an overspending of Ksh 14.6 billion in FY 2016/ / /17 (In percentage points; unless specified) Proj. Act. Dev. Proj. Prel. Dev. Proj. Rev. Dev. Proj. Rev. Dev. Average Deviation I. Key Macroeconomic Assumptions Real GDP 5.9% 5.6% -0.3% 6.1% 5.5% -0.6% 5.8% 5.8% 0.1% 5.5% 6.2% 0.7% -0.1% Inflation rate (avg) 6.7% 7.1% 0.4% 5.7% 6.6% 1.0% 5.7% 6.4% 0.7% 6.6% 5.0% -1.6% -1.4% Exchange rate (Ksh/USD), Avg Export growth 0.9% 0.9% 12.6% 12.6% -4.6% -4.6% 26.4% 26.4% Import growth 7.5% 7.5% 3.4% 3.4% -7.9% -7.9% 21.3% 21.3% II. Fiscal Aggregates (in Ksh billion) Total Revenue Tax and non-tax Ordinary Revenue AiA Grants Total Expenditure Recurrent Development Domestic External Net Lending Equalization Fund Others County Allocation Balance Budget Policy Statement
304 11. Execution of development expenditure was generally below target which reflects low absorption of domestically financed development by MDAs, delays in procurement and low absorption of external donor funds. 12. The slower-than-programmed spending on development budget poses a risk to the fiscal program, going forward. In order to prevent this risk from materializing, the National Treasury is preparing guidelines on how capital projects should be planned, appraised and evaluated before funds are finally committed in the budget. The National Treasury will engage Development Partners and execute financial agreements when the project has fulfilled all preliminary conditions for execution. 13. Going forward, there are risks associated with expenditure proposals that cannot be accommodated within the baseline ceilings. SPECIFIC FISCAL RISKS 14. This section addresses areas of specific fiscal risk faced by Kenya. Each of these risks has a linkage to the expansion of infrastructure in the country, a key government priority, which makes effective risk management all the more important: The sustainability of public debt; Explicit Contingent Liabilities Implicit Contingent Liabilities Devolved System of Government Sustainability of Public Debt 15. The sustainability of Kenya s debt depends on macroeconomic performance and prudence debt management. Significant uptake of domestic debt could lead to refinancing risk and expected increase in the US interest rates could also exert pressure on the debt sustainability position due to expected rise in interest rates in the global markets. In addition, increased external financing on both concessional and non-concessional terms pose an inherent foreign exchange risk which may worsen the PV of debt and therefore increases the risk of debt distress. Increased use of longer-term domestic debt instruments would help mitigate exposure of the government debt portfolio to foreign currency risk and contribute to reducing domestic rollover risk. 16. The government recognizes the importance of managing debt in a prudent way to ensure the debt burden is shared equally between the current and future generation. The latest debt sustainability analysis (DSA) for Kenya (March 2016) Budget Policy Statement
305 indicates that Kenya s debt is sustainable. The DSA compares debt burden indicators to indicative thresholds over a 20-year projection period. A debt-burden indicator that exceeds its indicative threshold suggests a risk of experiencing some form of debt distress. 17. The World Bank`s Country Policy and Institutional Assessment (CPIA) Index, classifies countries into three performance categories i.e. Strong, Medium and Poor and each category has different indicative thresholds for debt burdens depending on the country`s policies and institutions. Kenya is rated as a strong policy performer and a low middle income country and thus is subject to the threshold of 74 percent on the Present Value of Debt/ GDP, Kenya s debt ratios compared with internationally recognized threshold continues to show that our debt level remains sustainable. Table 3: Public Debt Indicators Indicator Threshold position PV of Public Sector Debt to GDP ratio PV of Public Sector Debt to Revenue ratio Debt Service to Rrevenue ratio Source: IMF Country Report No. 16/85, March 2016 and National Treasury 18. Public debt has been on a rising trend, increasing at an average annual rate of 19.8 percent, and reaching a nominal value of approximately Ksh 3,603.3 billion in 2015/16. As a proportion of GDP, public debt has risen from 40.7 percent in 2011/12 to 54.8 percent in 2015/16 (Chart 1). However, there is increase in government support in the funding of heavy capital projects through the public private partnership arrangement. This will help in reducing the rate of debt accumulation and thus maintain the net present value of public debt to GDP ratio at below 50 percent Budget Policy Statement

306 Chart 1: Evolution of Debt Stock FY 2009/10 to 2015/16 Source: National Treasury Explicit Contingent Liabilities State Corporations/State Owned Enterprises 19. While liabilities of state-owned enterprises constitute a potential source of fiscal risk, they are currently not a major cause of concern. The government is cautious in issuance of guarantees and other support measures to the state owned enterprises. 20. A study that conducted few years ago identified some sources of liabilities in state corporations including on-going court cases, penalties for non-compliance with statutory deductions, poor and non-performance of state corporations leading to calls on government guarantees, under insurance of assets, and liabilities associated with defined-benefit pension schemes. 21. Some of the recommendations of the study which have been implemented include conversion of pension schemes from defined-benefit pension schemes to defined-contribution pension schemes and conclusive vesting of assets and liabilities in respect of some state corporations. Respective state corporations have come up with remedial plan to ensure compliance with the requirements of Retirement Benefits Authority including providing for budgetary resources to make good any actuarial deficit arising from the conversion. Other on-going Budget Policy Statement
307 initiatives include review of governance frameworks of state corporations and privatization of state-owned enterprises. 22. Contingent liabilities are frequently not recorded directly in the budget and thus are not subjected to budgetary oversight. These could lead to poor quantification of Contingent Liabilities and the possibility of large unplanned expenditures if the guarantee materializes. There is need for monitoring of these contingent liabilities to avoid fiscal difficulties in the budget year in case they happen. Failure of State Owned Enterprises 23. While Government at times has a stake in state owned enterprises and other Government investments in public companies, its contractual obligations may be limited. However, due to the strategic nature of those state owned enterprises and public companies in view of the national interest and the overall impact of their failure to the economy, the Government may be morally obligated to bail out those state owned enterprises and public companies in financial distress. This may pose serious fiscal risk and challenge to budget implementation as The National Treasury has to provide budgetary resources to bail out those state owned enterprises and public companies in the course of the budget year. Unfunded Pension Liabilities 24. Under current pension arrangements, the government funds its pension liabilities from the current budget based on projections of those entering retirement from the public service. The legal retirement window ranges from 50 years to 60 years, where 50 years is the voluntary retirement age while 60 years is mandatory. Unfunded pension liabilities arise as a fiscal risk as the projected voluntary retirees pension liabilities have yet to be quantified and the government has not set aside a fund or scheme to cover for these. Were the proportion of voluntary retirees to all claim pension, the government would face a larger pension liability putting a burden on the current budget. Public Private Partnership (PPP) Projects 25. Since 1996 and as a result of progressive legal, regulatory and institutional reforms of the economy, Kenya has attracted private investments into the country s economic infrastructure sectors including telecommunications, energy, transport, water and sewerage. The frontrunner sector to lock in private participation in public infrastructure development is the energy sector which witnessed its first Independent Power Producers (IPPs) in electricity generation starting from Budget Policy Statement
308 Currently, all of the country s generated electricity is private sector-led, with thirteen (13) active IPPs. In most of the IPPs, Government has provided some forms of government support measures, mainly a Letter of Support. (Annex Table 5). 26. There are twenty-one (21) new generation projects that are at an advanced stage of planning three (3) being large projects using coal and geothermal technologies, and eighteen (18) renewable energy projects that will use wind, solar and other renewable energy technologies. Other ongoing and planned PPPs in the other sector are shown in the table below. Infrastructure Road sector (PPP Toll Road Projects: 2 nd Nyali Bridge, Nairobi-Nakuru-Mau Summit Dualling; Nairobi- Mombasa Dualling, O&M of Nairobi Southern Bypass; O&M of Nairobi-Thika Highway) Ongoing (USD Mn) Planned (USD Mn) 2500 Ports (CT2, Kisumu, Shimoni, IMTS) 150 Rail sector RVR Nairobi Commuter Rail 600 Education sector (KU, 1 st Umbrella students hostels, 52.5 other universities) Water and Environment (multi-purpose dams, water 2000 supply projects, solid waste mgmt.) Health sector (300 bed private wing, cancer mgmt 100 centres) Accommodation (civil servants housing, police and 600 prisons housing) Tourism (MICC, BICEC, Marina) 500 Export Quarantine Station & Livestock Export Zone 10 Multi-storey car park in Nairobi and Mombasa 100 Likoni Cable Car 43 Totals ,723 Percentage of GDP 0.65% 11.1% Budget Policy Statement

309 Other Planned Infrastructure PPP Projects Kenya (Value in USD Million) 27. Following the adoption of the PPP Policy in 2011, and the enactment of the PPP Act in 2013, as well as the establishment and operationalization of critical PPP institutions (the PPP Committee, the PPP Unit and the Petition Committee), there has been a steady growth in the quality and size of the PPP pipeline of projects, drawn from diverse economic sectors and county governments. A total of 64 projects are in the National Priority List of PPP projects. These projects are in the transport and infrastructure, energy, tourism, education, environment, health among others (Table below) Budget Policy Statement

310 Note: FS stands for feasibility study stage. TA Proc stands for transaction advisory procurement. Commercial Close stands for signing of the PPP project agreement. TA TOR stands for preparation of terms of reference for the recruitment of a transaction advisor. Prelm FS stands for Preliminary Feasibility Study. These acronyms serve to indicate the current stage of each project s development. 28. The GOK understands that any PPP project comprises roles and responsibilities for both the public and private sector. In particular and based on specific project needs, the public sector s contributions to the partnership of PPPs would typically include the use of multiple instruments of support and credit enhancement measures such as project development funding, availability payments, upfront capital grants, operational grants, revenue guarantees, Partial Risk Guarantees (PRG), etc. 29. In accordance with section 7(1) of the PPP Act, the PPP Committee has adopted a Fiscal Commitment and Contingent Liability (FCCL) Management Framework to ensure approval of, and fiscal accountability in the management of, financial and any other form of Government support granted in the implementation of the country s PPP program. To oversee the institutionalisation and operationalization of this Management Framework, the Government in collaboration with the World Bank (WB) and the PPP Unit, has established an FCCL Unit within the Directorate of Public Debt Management Office of the National Treasury. 30. The unit is responsible for: mandatory evaluation of all proposed PPP projects for financial risks and contingent liabilities as a condition of project approval; confirmation of this initial approval at feasibility stage based on preferred bidder Budget Policy Statement
311 submission and final negotiated project structure; regular monitoring of all support measures for any amendment(s) or variation(s) to a project agreement s terms and conditions, project outputs or any waivers in the project agreement; and, the ongoing development of a policy framework to govern the issuance of any and all types of letters of support requested across Government. The policy will provide a clear structure and process as a primary means of managing financial risks to government by ensuring robust and rigorous analysis and review before the Government takes on such commitments. 31. All guarantees and other security instruments provided under the PPP agenda, together with all other contingent liabilities will be integrated into The debt management process. The FCCL Unit now routinely assesses and is establishing systems for monitoring these projects with a view to ensuring continuous risk management and the scheduled disclosure and reporting of all fiscal risks associated with PPPs. 32. To mitigate the risks, operationalization of the PPP Project Facilitation Fund (PFF) (a multi-purpose revolving fund) and establishment of a good Governance Framework to manage Direct (or explicit) Liabilities and Contingent Liabilities is critical. A useful component of the good governance framework is the below qualitative risk assessment tool that is currently under implementation, while the Unit researches and practices on quantitative approaches of valuing CLs and calculating estimated payments. Contingent Liability Risk Assessment Tool for Operational and Planned PPP Projects PPP Projects Type of Explicit CL Probability/Impa ct Energy 300MW L. Turkana Wind 80.32MW Gulf Power 150MW Olkaria III 82MW Triumph Power 90MW Rabai HFO 74MW Kipevu II HFO GoK Letter of Support covering Political Risk events: Total project cost depreciated at 5% per annum Expenses incurred by the Seller as a result of termination NPV of 5 years profits at 10% discount rate Indemnity Agreement covering PRG payments (WB and AfDB, as appropriate) Indemnity Agreement covering PRG payments Probability, Low. Impact, High. Reason** Probability, Low. Impact, High. Reason** Budget Policy Statement
312 PPP Projects Type of Explicit CL Probability/Impa ct 140MW Longonot Geothermal GoK Letter of Support covering political risk events: Probability, Low. Impact, High. Total Project Cost depreciated at Reason** 60MW Kinangop 5% p.a. Wind Power Expenses incurred by the Seller as a result of termination NPV of 5 years profits at 10% discount rate Rift Valley Railway (RVR) Kenyatta University Student Hostels Transport IDA PRG to the concession company Education GoK Letter of Support covering political risk events: Total cost of the project depreciated at 5% p.a. NPV of 5 years profits at 10% discount rate 100% occupancy guarantee provided by KU Probability, Low. Impact, High. **These probabilities are deemed low based on Kenya s sovereign credit rating. According to Standard & Poor s, the current credit rating of Kenya is B+, implying that the probability of default of GoK within one year is 0.4% (estimated by Standard & Poor s using historical data of defaults of the last 20 years). 33. To entrench better outcomes in fiscal risk management, the PPP Unit is also placing a lot of emphasis in project financial models, with the view to ensuring that project debt repayment is front-loaded, while equity pay-out is back-loaded. This way, overall fiscal exposure is potentially lowered. 34. Overall, the foregoing disclosures establish the case that Kenya s PPP programme remains affordable, sustainable and generally responsive to the demands of public finance: transparency, fairness, equality of opportunity and fiscal responsibility. Environment 35. Natural disasters often lead to lower economic growth and a worsening in fiscal and external balances. They can also have a significant impact on poverty and social welfare. For instance, flood depending on its magnitude could impact agriculture, infrastructure such as electricity poles and transformers, roads, bridges and therefore affect households both directly and indirectly. Due to the impact a natural disaster on social welfare and its effects on essential amenities, the Budget Policy Statement
313 government may feel obligated to prevent social welfare reduction by incurring cost of returning normalcy after an occurrence. 36. The government being privy to some past occurrences has been providing a contingency fund to cushion the fiscal framework from the risks, among others. However, the impact of such likely unforeseen events could be of greater magnitude than the provision and hence pose fiscal risk to the government. Climate Change related fiscal risks to the economy 37. Temperature will continue to increase over the next century by 2.8 o C, with a possibility of rising above 3 o C or more. The physical consequences of such a rise include: changed precipitation patterns, sea level rise (amplified by storm surges), more intense and perhaps frequent extreme weather events, and increased prevalence of vector-borne diseases as well as catastrophic events, such as prolonged droughts and flooding in many counties. 38. The potential economic consequences of climate change include:- productivity changes in agriculture and other climate sensitive sectors, damage to coastal areas, stresses on health, biodiversity, fragile ecosystems, water systems, changes in trading patterns and international investment flows, financial market disruption, increased vulnerability to sudden adverse shocks, and altered migration patterns all with potential implications for external stability. 39. The fiscal implications of climate change could be among its most powerful and immediate, affecting many countries including Kenya. Climate developments will directly affect fiscal positions, through their impact on tax bases and spending programs and use of fiscal instruments in mitigating the extent of CC and adapting so as to limit the damage that remains. 40. Over the last three years, the National Treasury has been leading the process of developing fiscal instruments for climate proofing vulnerable sectors of the economy through enhancing mitigation and adaption. These include: Climate Finance Policy, Climate Public Expenditure review and climate change budget coding for tracking climate change related expenditure. However, climate change will continue to pose significant fiscal risk especially through potential flooding and drought incidences. Terrorist Attack 41. Potential terrorist attacks would affect the tourism sector and may also impact market confidence. Tourism contributes 0.5% of GDP and brings in a substantial Budget Policy Statement
314 amount of foreign earnings. In the recent past, Kenya faced terror attacks including in: Westgate Shopping Mall in Nairobi (September 2013), Eastleigh in Nairobi (April 2014), Thika Highway attack (May 2014), Gikomba Market attack (May 2014), Mpeketoni attack in Lamu (June 2014), Mandera bus attack (November 2014), Mandera quarry workers attack (December 2014) and Garissa University College attack (April 2015). These attacks have resulted in loss of lives, destruction of property, loss of businesses, disruption of families, restriction of movement of people, religious animosity and profiling of certain communities. 42. These direct and other indirect costs including loss of jobs have a negative impact on government revenue from tax, increased government spending on security and peace restoration as well as redeeming country s image hence risk to the government s fiscal framework. 43. The Governmnt has undertaken a lot of reforms over the last two financial years to mitigate the adverse effects of this risk under the Economic Transformation Agenda particularly on the creation of a conducive business environment. Technological Disaster 44. Information technology accounts for about 0.9 percent of GDP (2015) driven by financial innovation in mobile money transfer services. 1.1 billion transactions amounting to Ksh.2.8 trillion were transacted through this system in The main telecommunication company driving this channel constitutes a significant share of the market as well as a significant proportion of corporate tax paid to the government. Various financial products have been leveraged on this payment channel increasing the inter linkages between this technology and the banking sector. If this system was to be compromised, the impact would be substantial considering the linkages and the corporate tax revenue for government. The financial and other institutions liked to this system would be susceptible possibly amounting to the value transacted through the channel, were this risk to materialize, the impact on government including loss of deposits, loss of potential revenue and market confidence would put pressure on the government to compensate the losses. 45. Technological innovation via the mobile money transfer services and its pivotal role in the economy should therefore be given due consideration as a plausible fiscal risk Budget Policy Statement
315 Liabilities of the financial sector via systemically important Banks 46. The Kenya Deposit Insurance Corporation (KDIC) was established under Section 36 of the Banking Act as a deposit protection scheme to cover depositors and act as a liquidator of failed member institution. As at December 2015, Ksh billion were insured by KDIC. 30 million accounts out of 31 million accounts were covered, translating to 96 percent coverage of accounts. As KDIC was established to protect small depositors, deposits are insured only up to Ksh 100,000, which may be low as the economic mobility increases and the Kenya middle class grows changing the average value of deposits and the definition of small depositors. Simulation analysis indicates that the KDIC is adequately funded to be able to pay at a higher cap level, However, deposits held by Systemically Important Bank s may be held by a large proportion of the population that the government may feel compelled to pay depositors the gap between the value of their deposits and the maximum covered amount even if this is at an enhanced level. Devolved System of Government 47. The constitution of Kenya provides for two level of government i.e. National and County governments which are both independent and inter-dependent. This system of governance which came into place in March 2013 gives County governments powers under Article 209 to collect assigned revenues, budgets and spend. Counties spend as per the functions assigned to them under Schedule 4 of the constitution (Devolved functions). They are financed through Central Government Transfers, Own Source Revenues and Conditional Allocations. 48. However, major risks have emerged from Kenya s fiscal decentralization, and which require prudent management especially by the County Governments: These include: (i) Overreliance on national government transfers and the need to increase own source revenues. (ii) Dependence by some counties on one major own-source revenue hence exposing them to fiscal shocks occasioned by a dip in their main revenue source. (iii) Unrealistic own-source revenue projections which results to unrealistic expenditure estimates inevitably generating pending bills and causing general cash flow problems. This could engender undue demand for borrowing. (iv) Duplication of functions that risk generating intergovernmental conflicts, wasteful spending and financing gaps that could adversely affect implementation of the fiscal framework Budget Policy Statement
316 (v) Illegal borrowing by some County Governments: Constitution allows County Governments to raise revenue by way of borrowing subject to guarantee by the National Government. A borrowing framework to operationalize this has been prepared and embedded in the Public Finance (County Governments ) Regulations, However, some counties have borrowed from commercial banks without the requisite guarantee. Such unlawful borrowing is a potential source of fiscal risks Budget Policy Statement
317 ANNEX TABLES Annex Table 1: Macroeconomic Indicators, 2014/ / / / / / / /20 Rev. Act. Budget'16 Prel. Budget'16 BROP'16 BPS'17 BPS'16 BROP'16 BPS'17 BPS'16 BROP'16 BPS'17 BROP'16 BPS'17 annual percentage change, unless otherwise indicated National Account and Prices Real GDP GDP deflator CPI Index (eop) CPI Index (avg) Terms of trade (-deterioration) Money and Credit (end of period) Net domestic assets Net domestic credit to the Government Credit to the rest of the economy Broad Money, M3 (percent change) Reserve money (percent change) in percentage of GDP, unless otherwise indicated Investment and Saving Investment Central Government Other Gross National Saving Central Government Other Central Government Budget Total revenue Total expenditure and net lending Overall balance (commitment basis) excl. grants Overall balance (commitment basis) incl. grants Overall balance (commitment basis) incl. grants exl SGR Primary budget balance Net domestic borrowing Total external support (grant & loans) External Sector Exports value, goods and services Imports value, goods and services Current external balance, including official transfers Gross international reserve coverage in months of next year imports (end of period) Gross international reserve coverage in months of this year's imports (end of period) Public debt Nominal central government debt (eop), net of deposits Domestic (gross) Domestic (net) External Memorandum Items: Nominal GDP (in Ksh Billion) 5,811 6,444 6,586 7,259 7,259 7,435 8,151 8,151 8,284 9,159 9,159 9,259 9,838 10,022 Nominal GDP (in US$ Million) 63,600 64,843 65,143 72,348 71,909 73,655 80,462 79,973 81,284 89,551 89,007 89,981 94,699 96,468 Source: National Treasury Notes: BPS = Budget Policy Statement; BROP = Budget Review & Outlook Paper; SGR = Standard Gauge Railway Budget Policy Statement
318 Annex Table 2: Government Fiscal Operations, Ksh Billions 2014/15 Act 2015/ / / / /20 Rev. Budget Prel Budget'16 BROP'16 BPS'17 BPS'16 BROP'16 BPS'17 BPS'16 BROP'16 BPS'17 BROP'16 BPS'17 TOTAL REVENUE 1, , , , , , , , , , , , , ,157.5 Ordinary Revenue 1, , , , , , , , , , , , , ,013.5 Income Tax ,008.8 Import duty (net) Excise duty Value Added Tax Investment income Other Railway Development Levy Ministerial and Departmental fees (AiA) EXPENDITURE AND NET LENDING 1, , , , , , , , , , , , , ,642.3 Recurrent expenditure , , , , , , , , , , , , ,504.5 Interest payments Domestic interest Foreign Interest / Wages and Salaries/ Contribution to civil service pension fund Civil service Reform Pensions etc Other Defense and NSIS Development and Net lending Domestically financed o/w Domestically Financed (Net)/ o/w Exchequer Issues/ Ministerial Development AIA Foreign financed/ Net lending Contingencies/ County Allocation Of which: sharable Conditional Level Five Hospitals County Health Facilities - DANIDA Health Care Facilities Compensation Other conditional transfer Equalization Fund for Marginal areas / Fiscal Balance (commitment basis excl. grants) Adjustment to cash basis Grants Of which: Project grants Debt Swap Programmme grants County Health Facilities - DANIDA Fiscal Balance (cash basis incl. grants) Fiscal Balance (cash basis incl. grants) Exl. SGR Statistical discrepancy FINANCING Net Foreign Financing Project loans Programme loans Commercial Financing/ of which: Syndicated Loan Repayments due O/W syndicated Loan repayments Other Domestic Financing Of which: NBK Rights Domestic Loan Repayments (Receipts) Domestic Loan Repayments CBK Net Domestic Financing Of which: Sovereign Bond proceeds Others Financing gap Memo items External Debt 1, , , , , , , , , , , , , ,471.1 Domestic Debt (gross) 1, , , , , , , , , , , , , ,855.9 Domestic Debt (net) 1, , , , , , , , , , , , , ,447.5 Primary budget balance Nominal GDP 5, , , , , , , , , , , , , ,021.8 Source: The National Treasury Notes: BPS = Budget Policy Statement; BROP = Budget Review & Outlook Paper; SGR = Standard Gauge Railway Note/1 Interest payments for FY 2014/15 includes Ksh million on syndicated loan Note /2 Salaries and Wages reflect the wages for civil service inclusive of the police and prison officers and teachers Note /3 Domestically financed development for FY 2014/15 is higher than Exchequer issued of Ksh billion on account of commitments Note /4 Comprises total excheque releases (Ksh billion) excluding from grants and loans (Ksh 36.8 billion) Note /5 Foreign Financed development for FY 2014/15 includes grants and loans through the exchequer of Ksh 36.8 billion Note /6 Commercial Financing item includes all forms of external financing not related to projects including, first Eurobond receipts, Eurobond tap sales, syndicated loans Note /7 Equalization Fund expenditures for actual years represent actual disbursements to the Fund Budget Policy Statement
319 Annex Table 3: Government Fiscal Operations, Percent of GDP 2014/15 Act 2015/ / / / /20 Rev. Budget Prel Budget'16 BROP'16 BPS'17 BPS'16 BROP'16 BPS'17 BPS'16 BROP'16 BPS'17 BROP'16 BPS'17 TOTAL REVENUE Ordinary Revenue Income tax Import duty (net) Excise duty Value Added Tax Investment income Other Railway Development Levy Ministerial and Departmental fees (AiA) EXPENDITURE AND NET LENDING Recurrent expenditure Interest payments Domestic interest Foreign Interest / Wages and Salaries/ Contribution to civil service pension fund Civil service Reform Pensions etc Other Defense and NSIS Development and Net lending Domestically financed o/w Domestically Financed (Net)/ o/w Exchequer Issues/ Ministerial Development AIA Foreign financed/ Net lending Contingencies/ County Allocation Of which: sharable Equalization Fund for Marginal areas / Fiscal Balance (commitment basis excl. grants) Adjustment to cash basis Grants Of which: Project grants Debt Swap Programmme grants Fiscal Balance (cash basis incl. grants) Fiscal Balance (cash basis incl. grants) Exl. SGR FINANCING Net Foreign Financing Project loans Programme loans Commercial Financing/ of which: Syndicated Loan Repayments due O/W syndicated Loan repayments Other Domestic Financing Of which: NBK Rights Domestic Loan Repayments (Receipts) Domestic Loan Repayments CBK Net Domestic Financing Of which: Sovereign Bond proceeds Others Financing gap Memo Items Total Public Debt (net) External Debt Domestic Debt (gross) Domestic Debt (net) Primary budget balance Nominal GDP Source: The National Treasury Notes: BPS = Budget Policy Statement; BROP = Budget Review & Outlook Paper; SGR = Standard Gauge Railway Note/1 Interest payments for FY 2014/15 includes Ksh million on syndicated loan Note /2 Salaries and Wages reflect the wages for civil service inclusive of the police and prison officers and teachers Note /3 Domestically financed development for FY 2014/15 is higher than Exchequer issued of Ksh billion on account of commitments Note /4 Comprises total excheque releases (Ksh billion) excluding from grants and loans (Ksh 36.8 billion) Note /5 Foreign Financed development for FY 2014/15 includes grants and loans through the exchequer of Ksh 36.8 billion Note /6 Commercial Financing item includes all forms of external financing not related to projects including, first Eurobond receipts, Eurobond tap sales, syndicated loans Note /7 Equalization Fund expenditures for actual years represent actual disbursements to the Fund Budget Policy Statement
320 Annex Table 4: Summary of Expenditure by Programmes, 2016/ /20 (Ksh Million) Sector/ Vote/Programme Details 2016/17 Estimates 2017/18 Ceiling 2018/19 Projection 2019/20 Projection Current Capital Total Current Capital Total Current Capital Total Current Capital Total AGRICULTURE, RURAL & URBAN DEVELOPMENT 15, , , , , , , , , , , , Ministry of Lands and Physical Planning 2, , , , , , , , , , , , P. 1 Land Policy and Planning 2, , , , , , , , , , , , State Department for Agriculture 8, , , , , , , , , , , , P1: General Administration Planning and Support Services 2, , , , , , , , , , , P2: Crop Development and Management 5, , , , , , , , , , , , P3: Agribusiness and Information Management , , , , , , , State Department for Livestock 1, , , , , , , , , , , , P 6: Livestock Resources Management and Development 1, , , , , , , , , , , , State Department for Fisheries and the Blue Economy 1, , , , , , , , , , , , P5: Fisheries Development and Management 1, , , , , , , , , , , ,967.0 P 6: General Administration, Planning and Support Services P 7: Development and Coordination of the Blue Economy National Land Commission 1, , , , , , , , , P1: Land Administration and Management P2. General Administration, Planning and Support Services 1, , , , P3. Land Disputes and Conflict Resolutions P4. National Land Information Management System , , ,156.0
321 Annex Table 4: Summary of Expenditure by Programmes, 2016/ /20 (Ksh Million)..Contd Sector/ Vote/Programme Details 2016/17 Estimates 2017/18 Ceiling 2018/19 Projection 2019/20 Projection Current Capital Total Current Capital Total Current Capital Total Current Capital Total ENERGY, INFRASTRUCTURE AND ICT 41, , , , , , , , , , , , State Department for Energy 2, , , , , , , , , , , , P1 General Administration Planning and Support Services P2 Power Generation , , , , , , , , P3 Power Transmission and Distribution , , , , , , , , P4 Alternative Energy Technologies , , , , , State Department for Petroleum , , , , , , , , P5 Exploration and Distribution of Oil and Gas , , , , , , , , State Department of Infrastructure 29, , , , , , , , , , , , P.2 Road Transport 29, , , , , , , , , , , , State Department of Transport 5, , , , , , , , , , , , P.1 General Administration, Planning and Support Services , , , P3 Rail Transport , , , , , , , , P4 Marine Transport , , , , , , , , P5 Air Transport 4, , , , , , , , , , , , Road Safety State Department for Maritime Affairs P4 Marine Transport Shipping and Maritime Affairs State Department for Information Communications and Technology & Innovation , , , , , , , , , , P1: General Administration Planning and Support Services P4: ICT Infrastructure Development , , , , , , , , P5 E-Government Services Budget Policy Statement
322 Annex Table 4: Summary of Expenditure by Programmes, 2016/ /20 (Ksh Million)..Contd Sector/ Vote/Programme Details 2016/17 Estimates 2017/18 Ceiling 2018/19 Projection 2019/20 Projection Current Capital Total Current Capital Total Current Capital Total Current Capital Total ENERGY, INFRASTRUCTURE AND ICT 41, , , , , , , , , , , , State Department for Broadcasting & Telecommunications 2, , , , , , , , P1: General Administration Planning and Support Services P2: Information And Communication Services 1, , , , , , , , P 3: Mass Media Skills Development State Department for Housing & Urban Development , , , , , , , , , , , P.2 Housing Development and Human Settlement , , , , , , , , P 5 Urban and Metropolitan Development , , , , , , , , P 6 General Administration Planning and Support Services Programme 4 - Regulation and Development of the Construction Industry State Department for Public Works , , , , , , , , , P 3 Government Buildings , , , , , , , , P 4 Coastline Infrastructure and Pedestrian Access P 6 General Administration Planning and Support Services GENERAL ECONOMIC AND COMMERCIAL AFFAIRS 12, , , , , , , , , , , , State Department for Investment and Industry 2, , , , , , , , , , , , P.1 General Administration Planning and Support Services P.2 Industrial Development and Investments 1, , , , , , , , , , , , P.3 Standards and Business Incubation , , , , , , , State Department for Cooperatives 3, , , , P.4 Cooperative Development and Management 3, , , , Budget Policy Statement
323 Annex Table 4: Summary of Expenditure by Programmes, 2016/ /20 (Ksh Million)..Contd Sector/ Vote/Programme Details 2016/17 Estimates 2017/18 Ceiling 2018/19 Projection 2019/20 Projection Current Capital Total Current Capital Total Current Capital Total Current Capital Total GENERAL ECONOMIC AND COMMERCIAL AFFAIRS 12, , , , , , , , , , , , State Department for Trade 2, , , , , , , , P 3: Trade Development and Promotion 2, , , , , , , , State Department for East African Integration 1, , , , , , , , P 1: East African Affairs and Regional Integration 1, , , , , , , , Ministry of Tourism 2, , , , , , , , , , , , P 2: Tourism Development and Promotion 2, , , , , , , , , , , ,232.0 HEALTH 28, , , , , , , , , , , , Ministry of Health 28, , , , , , , , , , , , P.1 Preventive, Promotive & RMNCAH 1, , , , , , , , , , , , P.2 National Referral & Specialized Services 16, , , , , , , , , , , , P.3 Health Research and Development 5, , , , , , , , P.4 General Administration, Planning & Support Services 5, , , , , , , , , , , , P.5 Health Policy, Standards and Regulations , , , , , , , , , , , Budget Policy Statement
324 Annex Table 4: Summary of Expenditure by Programmes, 2016/ /20 (Ksh Million)..Contd Sector/ Vote/Programme Details 2016/17 Estimates 2017/18 Ceiling 2018/19 Projection 2019/20 Projection Current Capital Total Current Capital Total Current Capital Total Current Capital Total EDUCATION 315, , , , , , , , , , , , State Department for Basic Education 58, , , , , , , , , , , , P.1 Primary Education 17, , , , , , , , , , , , P.2 Secondary Education 33, , , , , , , , , , , , P.3 Quality Assurance and Standards 4, , , , , , , , P. 8 General Administration, Planning and Support Services 4, , , , , , , , State Department for Vocational and Technical Training 2, , , , , , , , , , , , P.5 Technical Vocational Education and Training 2, , , , , , , , , , , , P.7 Youth Training and Development P. 8 General Administration, Planning and Support Services State Department for University Education 60, , , , , , , , , , , , P.4 University Education 56, , , , , , , , , , , , P. 6 Research, Science, Technology and Innovation 3, , , , , , , , P. 8 General Administration, Planning and Support Services Teachers Service Commission 193, , , , , , , , P.1 Teacher Resource Management 187, , , , , , , , P.2 Governance and Standards P.3 General Administration, Planning and Support Services 6, , , , , , , , Budget Policy Statement
325 Annex Table 4: Summary of Expenditure by Programmes, 2016/ /20 (Ksh Million)..Contd Sector/ Vote/Programme Details 2016/17 Estimates 2017/18 Ceiling 2018/19 Projection 2019/20 Projection Current Capital Total Current Capital Total Current Capital Total Current Capital Total GOVERNANCE, JUSTICE, LAW AND ORDER 165, , , , , , , , , , , , State Department for Interior 102, , , , , , , , , , , , P.1 Policing Services 77, , , , , , , , , , , , P.2 Planning, Policy Coordination and Support Service 18, , , , , , , , , , , , P3 Government Printing Services , , P.4 Population Management Services 5, , , , , , , , , , , , P.3 Betting Control, Licensing and Regulation Services State Department for Correctional Services 19, , , , , , , , , , , P1 Correctional services 18, , , , , , , , , , , P.2 General Administration, Planning and Support Services State Law Office and Department of Justice 4, , , , , , , , P.1 Legal Services 1, , , , , , , , P.2 Governance, Legal Training and Constitutional Affairs 1, , , , , , , , P. 4 General Administration, Planning and Support Services The Judiciary 12, , , , , , , , , , , , P 1: Dispensation of Justice 12, , , , , , , , , , , , Ethics and Anti-Corruption Commission 2, , , , , , , , P.1 Ethics and Anti-Corruption 2, , , , , , , , Office of the Director of Public Prosecutions 2, , , , , , , , P.1 Public Prosecution Services 2, , , , , , , , Office of Registrar of Political Parties P.1 Registration, Regulation and Funding of Political Parties Budget Policy Statement
326 Annex Table 4: Summary of Expenditure by Programmes, 2016/ /20 (Ksh Million)..Contd Sector/ Vote/Programme Details 2016/17 Estimates 2017/18 Ceiling 2018/19 Projection 2019/20 Projection Current Capital Total Current Capital Total Current Capital Total Current Capital Total GOVERNANCE, JUSTICE, LAW AND ORDER 165, , , , , , , , , , , , Witness Protection Agency P.1 Witness Protection Kenya National Commission on Human Rights P 1: Protection and Promotion of Human Rights Independent Electoral and Boundaries Commission 18, , , , , , , , P.1 : Management of Electoral Processes 18, , , , , , , ,536.9 P2 Delimitation of electoral boundaries Judicial Service Commission P. 1 General Administration, Planning and Support Services National Police Service Commission P.1 National Police Service Human Resource Management National Gender and Equality Commission P 1: Promotion of Gender Equality and Freedom from Discrimination Independent Police Oversight Authority P.1 Policing Oversight Services Budget Policy Statement
327 Annex Table 4: Summary of Expenditure by Programmes, 2016/ /20 (Ksh Million)..Contd Sector/ Vote/Programme Details 2016/17 Estimates 2017/18 Ceiling 2018/19 Projection 2019/20 Projection Current Capital Total Current Capital Total Current Capital Total Current Capital Total PUBLIC ADMINISTRATION AND INTERNATIONAL RELATIONS 114, , , , , , , , , , , , The Presidency 7, , , , , , , , P2 Cabinet Affairs 1, , , , , , , , P4 State House Affairs 3, , , , , , , , P.6 Deputy President Services 2, , , , , , , , P3 Government Advisory Services 1, , , , , , , , State Department for Planning and Statistics 4, , , , , , , , , , , , P1 : Economic Policy and National Planning 1, , , , , , , , , , , , P2 : National Statistical Information Services 1, , , , , , , , , , , , P3: Monitoring and Evaluation Services P8: NGO Regulatory Services P.7 Integrated Regional Development 1, , , , , , , , , , , , P4: General Administration Planning and Support Services State Department for Devolution , , , , , , , , , P.3 General Administration, Planning and Support Services P7: Devolution Services , , , , , , , , Ministry of Foreign Affairs and International Trade 17, , , , , , , , , , , , P.2 Foreign Relation and Diplomacy 12, , , , , , , , , , , ,657.0 Economic and Commercial Diplomacy Foreign Policy Research, Capacity Development and Technical Cooperation P.1 General Administration Planning and Support Services 4, , , , , , , , Budget Policy Statement
328 Annex Table 4: Summary of Expenditure by Programmes, 2016/ /20 (Ksh Million)..Contd Sector/ Vote/Programme Details 2016/17 Estimates 2017/18 Ceiling 2018/19 Projection 2019/20 Projection Current Capital Total Current Capital Total Current Capital Total Current Capital Total PUBLIC ADMINISTRATION AND INTERNATIONAL RELATIONS 114, , , , , , , , , , , , The National Treasury 36, , , , , , , , , , , , P1 : General Administration Planning and Support Services 30, , , , , , , , , , , , P2: Public Financial Management 4, , , , , , , , , , , , P3: Economic and Financial Policy Formulation and Management 1, , , , , , , , , , , , P4: Market Competition P5 Government Clearing Services State Department for Public Service and Youth Affairs 13, , , , , , , , , , , , P 5: Public Service Transformation 5, , , , , , , , , , , , P6: Youth Empowerment 7, , , , , , , , , , , , P4: General Administration Planning and Support Services National Assembly 16, , , , , , , , P.1 National Legislation, Representation and Oversight 16, , , , , , , , Parliamentary Service Commission 10, , , , , , , , , , , , P.2 Senate Affairs 5, , , , , , , , P. 3 General Administration, Planning and Support Services 4, , , , , , , , , , , , The Commission on Revenue Allocation P.1 Inter-Governmental Revenue and Financial Matters Budget Policy Statement
329 Annex Table 4: Summary of Expenditure by Programmes, 2016/ /20 (Ksh Million)..Contd Sector/ Vote/Programme Details 2016/17 Estimates 2017/18 Ceiling 2018/19 Projection 2019/20 Projection Current Capital Total Current Capital Total Current Capital Total Current Capital Total PUBLIC ADMINISTRATION AND INTERNATIONAL RELATIONS 114, , , , , , , , , , , , Public Service Commission 1, , , , , , , , , P.1 General Administration, Planning and Support Services , , , P.2 Human Resource management and Development P.3 Governance and National Values Salaries and Remuneration Commission P.1 Salaries and Remuneration Management Auditor-General 4, , , , , , , , P.1 Audit Services 4, , , , , , , , Controller of Budget P.1 Control and Management of Public finances The Commission on Administrative Justice P.1 Promotion of Administrative Justice NATIONAL SECURITY 124, , , , , , , , Ministry of Defence 98, , , , , , , , P.1: Defence 97, , , , , , , , P.2 Civil Aid P.3 General Administration, Planning and Support Services 1, , , , , , , , National Intelligence Service 25, , , , , , , , P.1 National Security Intelligence 25, , , , , , , , Budget Policy Statement
330 Annex Table 4: Summary of Expenditure by Programmes, 2016/ /20 (Ksh Million)..Contd PROGRAMME ALLOCATIONS FY 2017/18 AND MEDIUM TERM (AMOUNTS IN MILLIONS) Sector/ Vote/Programme Details 2016/17 Estimates 2017/18 Ceiling 2018/19 Projection 2019/20 Projection Current Capital Total Current Capital Total Current Capital Total Current Capital Total SOCIAL PROTECTION, CULTURE AND RECREATION 18, , , , , , , , , , , , State Department for Special Programmes 1, , , , , , , , , , , , P 8: Special Initiatives , , , , , , P.9 Accelerated ASAL Development , , , , , , , ,379.2 P 14:General Administration Services State Department for Sports Development 3, , , , , , , , , , , P.1 Sports 3, , , , , , , , , , , P.5 General Administration, Planning and Support Services State Department for Arts and Culture 2, , , , , , , , , , P.2 Culture Development 1, , , , , , , , P.3 The Arts P.4 Library Services , P.5 General Administration, Planning and Support Services State Department for Labour 1, , , , , , , , P 1: Promotion of the Best Labour Practice P 2: Manpower Development, Employment and Productivity Management P 5: General Administration Planning and Support Services State Department for Social Protection 8, , , , , , , , , , , , P 3: Social Development and Children Services 3, , , , , , , , P 4: National Social Safety Net 5, , , , , , , , , , , , P 5: General Administration Planning and Support Services State Department for Gender 1, , , , , , , , , , , , P 1: Community Development - 2, , , , , , , , P 2: Gender Empowerment 1, , , , , , , , , ,322.0 P 17:General Administration and Planning Budget Policy Statement
331 Annex Table 4: Summary of Expenditure by Programmes, 2016/ /20 (Ksh Million)..Contd Sector/ Vote/Programme Details 2016/17 Estimates 2017/18 Ceiling 2018/19 Projection 2019/20 Projection Current Capital Total Current Capital Total Current Capital Total Current Capital Total ENVIRONMENT PROTECTION, WATER AND NATURAL RESOURCES 19, , , , , , , , , , , , State Department for Water Services 3, , , , , , , , , , , , P.2 General Administration, Planning and Support Services P.3 Water Resources Management 3, , , , , , , , ,032.0 P3. Water and Sewerage Infrastructure Development , , , , , , , , , State Department for Irrigation , , , , , , , , P.4 Irrigation and Land Reclamation , , , , , , , , P.1 Water Storage and Flood Control - 5, , , , , , , ,830.0 Programme 1: General Administration and Support Services State Department for Environment 2, , , , , , , , , , , , P.3 Meteorological Services 1, , , , , , , , , , , , P.2 Environment Management and Protection 1, , , , , , , , , , , , P.1 General Administration, Planning and Support Services State Department for Natural Resources 11, , , , , , , , , , , , P.3 Natural Resources Management and Protection 11, , , , , , , , , , , , Ministry of Mining , , , , , , , P.1 General Administration Planning and Support Services P.2 Resources Surveys and Remote Sensing P.3. Mineral Resources Management , , , , , ,978.0 Total 857, , ,677, , , ,599, , , ,727, , , ,788, Budget Policy Statement
332 Annex Table 5: Public Private Partnership (PPP) Projects Kenya, government s guarantee and termination terms No. Project Name Project Description 1. Africa Geothermal International 140 MW 2. Lake Turkana Wind Power - 300MW 25-year Power Purchase Agreement on a Build, Own, and Operate (BOO) basis at Longonot geothermal power project adjacent to Olkaria, Kenya. The wind turbine farm is being developed on BOO basis in Loyangalani, Marsabit West County, on a 20- year PPA with Kenya Power. Project Value ($ Mn) Status 760 Financial Close: 3rd April 2014 Status: Under construction 847 Financial Close: 24th March 2014 Status: Under construction Type/Value/ State Guarantee Letter of Support is being finalized Letter of Support covering Political Risks issued on 28th February 2013 Indemnity Agreement LC to be replaced with Escrow Account Amount for Termination Payment (default by GoK) 1. Total Project Cost depreciated at 5% per annum. 2. Expenses incurred by the Seller as a result of termination. 3. Net Present Value of 5 Years profits at 10% discount rate. 1. Total Project Cost depreciated at 5% per annum. 2. Expenses incurred by the Seller as a result of termination. 3. Net Present Value of 5 Years profits at 10% discount rate. Obligation for fixed Capacity Payments(Ann ual) US$ 77.3Mn Deemed Generated Energy Payments Euros 110.4Mn Call on Guarant ee (Y/N) NO NO Budget Policy Statement
333 No. Project Name Project Description 3. Gulf Power MW 4. Triumph Power - 82MW The Heavy Fuel Oil (HFO) power plant is being developed on a BOO basis, in the Athi River region, on a 20-year PPA with KPLC. The Heavy Fuel Oil (HFO) power plant is being developed on a BOO basis, at Kitengela near the Athi River area of Mavoko, on a 20- year PPA with KPLC. Project Value ($ Mn) Status 108 Financial Close: 18th Nov Status: Under construction Financial Close: 7th August 2013 date Status: Under construction Type/Value/ State Guarantee Letter of Support covering Political Risks issued on 2nd July 2012 Indemnity Agreement covering PRG payments was signed on 14th March PRG Amount US$ 35Mn and Euros 7Mn Letter of Support covering Political Risks issued on 2nd July 2012 Indemnity Agreement covering PRG payments was signed on 5th December PRG Amount US$ 45Mn Amount for Termination Payment (default by GoK) 1. Total Project Cost depreciated at 5% per annum. 2. Expenses incurred by the Seller as a result of termination. 3. Net Present Value of 5 Years profits at 10% discount rate. 1. Total Project Cost depreciated at 5% per annum. 2. Expenses incurred by the Seller as a result of termination. 3. Net Present Value of 5 Years profits at 10% discount rate. Obligation for fixed Capacity Payments(Ann ual) Euros 16.3 Mn US$ 24.5Mn Call on Guarant ee (Y/N) NO NO Budget Policy Statement
334 No. Project Name Project Description 5. Thika Power - 87MW 6. Kinangop Power 60.8MW 7. Orpower 150MW** Olkaria III Geothermal power plant(1 st plant 48MW,2 nd Plant 36MW,3 rd plant 16MW and 4 th Plant 29MW) The Heavy Fuel Oil (HFO) power plant is being developed on a BOO basis, in Thika, on a 20-year PPA with KPLC. The wind power plant is being developed on a BOO basis in South Kinangop, Nyandarua County on a 20-year PPA with KPLC. Description: 20 year - BOO Project Value ($ Mn) Status 146 Financial Close: 11th October 2012 Status: Operational from Aug Financial Close: 31st December 2012 Status: Under construction 558*** Financial Close: Jan, 1999 Status: Operational Type/Value/ State Guarantee Letter of Support covering Political Risks issued on 2nd July 2012 Indemnity Agreement covering PRG payments was signed on 28th August PRG Amount US$ 35Mn and Euros 7.7Mn Letter of Support covering Political Risks issued on 26th July, 2013 Letter of Support covering Political Risks issued on 16th April 2015 Indemnity Agreement LC covering PRG payments of Amount US$ 31Mn Amount for Termination Payment (default by GoK) 1. Total Project Cost depreciated at 5% per annum. 2. Expenses incurred by the Seller as a result of termination. 3. Net Present Value of 5 Years profits at 10% discount rate. 1. Total Project Cost depreciated at 5% per annum. 2. Expenses incurred by the Seller as a result of termination. 3. Net Present Value of 5 Years profits at 10% discount rate. 1. Total Project Cost depreciated at 5% per annum. 2. Expenses incurred by the Seller as a result of termination. 3. Losses incurred by the seller Obligation for fixed Capacity Payments(Ann ual) Euros 17.1Mn Deemed Energy Payment US$ 26.8Mn US$70.98 Mn Call on Guarant ee (Y/N) NO NO* NO Budget Policy Statement
335 No. Project Name Project Description 8. Rabai Power Plant 90MW 9. Mumias Power Plant 35MW 10. Kipevu III, 120MW 11. Kipevu II 74MW Project Value ($ Mn) Status 20 year - BOO 155 Financial Close: Oct, 2008 Status: Operational 10 Years-BOO 50 Financial Close: July, 2008 Status: Operational Located at Kipevu 134 Financial in Mombasa, the Close: None diesel power plant Status: is on a BOO basis Operational for a 20-year period Located in Mombasa next to Kilindini seaport, the Heavy Fuel Oil (HFO) power plant is on BOO basis a 20-year period 85 Financial Close: Sept, 1999 Status: Operational Type/Value/ State Guarantee Indemnity Agreement LC Account Amount for Termination Payment (default by GoK) Net Present Value of Non- Escalabe Capacity Charges for the remaining period to the expiry of the term discounted at 12% per annum Obligation for fixed Capacity Payments(Ann ual) Euros 19.7Mn None None US$ 5.3Mn NO None None Ksh 2,209Mn NO Indemnity Agreement 1. Net Present Value of Nonescalabe Capacity Charges for the remaining period to the expiry of the term discounted at 10% per annum. 2. Expenses incurred by the Seller as a result of termination. 3. The value of the stock of fuel and other consumables and spare parts at the Plant US$9.62 Mn Call on Guarant ee (Y/N) NO NO Budget Policy Statement
336 No. Project Name Project Description 12. Imenti tea Factory Limited 0.28MW 13. Power Technology Solutions Ltd. Gikira Kianjora Small Hydro Power Stations Feed in Tariff Power Plant on a BOO basis Feed in Tariff Power Plant on a BOO basis Project Value ($ Mn) Status Type/Value/ State Guarantee Amount for Termination Payment (default by GoK) Obligation for fixed Capacity Payments(Ann ual) - Operating None None None NO - Operating None None None NO Call on Guarant ee (Y/N) 0.514MW *With respect to Kinangop Wind Power, it is recognized that a claim under the Government Letter of Support was lodged, and the matter is currently sub judice, before an arbitration panel under ICC rules. While a claim has been lodged, there has been no actual call on the guarantee. It is expected that this matter will find amicable resolution. **The Orpower s Olkaria III Geothermal power plant is currently operating at 129MW from the existing 4 plants; however, the PPA indicates the project is sized at 150MW, with the outstanding 21MW not yet implemented. ***The project value for Orpower s Olkaria III Geothermal project of USD 558 Mn is for the already installed 129MW. It does not include the cost of the yet-to-beimplemented 21MW, which would bring the project to 150MW. THE NATIONAL TREASURY Budget Policy Statement
337 Budget Policy Statement

338

339 THE NAROK COUNTY ENVIRONMENT MANAGEMENT BILL, 2017 SPECIAL ISSUE Narok County Gazette Supplement No (1 of 2017) NAROK COUNTY GOVERNMENT NAROK COUNTY GAZETTE SUPPLEMENT COUNTY ASSEMBLY BILLS, 2017 NAROK, 23 rd January 2017 CONTENT Bill for Introduction into the Narok County Assembly NAROK COUNTY ENVIRONMENT MANAGEMENT BILL, 2017 PRINTED AND PUBLISHED BY NAROK COUNTY GOVERNMENT 1
IDFC Position Paper Aligning with the Paris Agreement December 2018
 IDFC Position Paper Aligning with the Paris Agreement December 2018 The Paris Agreement bears significance to development finance institutions. Several articles of the Agreement recall it is to be implemented
UN BHUTAN COUNTRY FUND
 UN BHUTAN COUNTRY FUND Terms of Reference Introduction: 1. The UN system in Bhutan is implementing the One Programme 2014-2018. The One Programme is the result of a highly consultative and participatory
G20 STUDY GROUP ON CLIMATE FINANCE PROGRESS REPORT. (November )
") G20 STUDY GROUP ON CLIMATE FINANCE PROGRESS REPORT (November 2 2012) SECTION 1 OVERVIEW OF STUDY GROUP INTRODUCTION This study group has been tasked by G20 leaders in Los Cabos to consider ways to effectively
G20 STUDY GROUP ON CLIMATE FINANCE PROGRESS REPORT (November 2 2012) SECTION 1 OVERVIEW OF STUDY GROUP INTRODUCTION This study group has been tasked by G20 leaders in Los Cabos to consider ways to effectively
Supplementary budget for the implementation of the medium-term strategic and institutional plan
 UNITED NATIONS HSP UN-Habitat Governing Council of the United Nations Human Settlements Programme Distr. General 10 April 2007 Original: English Twenty-first session Nairobi, 16-20 April 2007 Item 7 of
Sustainable Development Goals Fund (SDG Fund) Framework and Guidance for Partnerships with the Private Sector
 Framework and Guidance for Partnerships with the Private Sector") Sustainable Development Goals Fund (SDG Fund) Framework and Guidance for Partnerships with the Private Sector Why partner with the SDG Fund The private sector has played an active role in the work of the
Sustainable Development Goals Fund (SDG Fund) Framework and Guidance for Partnerships with the Private Sector Why partner with the SDG Fund The private sector has played an active role in the work of the
A Roadmap for SDG Implementation in Mauritius Indicative. UNDP Mission Team 17 November 2016
 A Roadmap for SDG Implementation in Mauritius Indicative UNDP Mission Team 17 November 2016 WHAT IS MAPS? MAINSTREAMING Landing the SDG agenda at the national and local levels: integration into national
REPUBLIC OF KENYA THE PRESIDENCY MINISTRY OF DEVOLUTION AND PLANNING STATE DEPARTMENT OF PLANNING AND STATISTICS
 REPUBLIC OF KENYA THE PRESIDENCY MINISTRY OF DEVOLUTION AND PLANNING STATE DEPARTMENT OF PLANNING AND STATISTICS Telegrams "PLANNING" Nairobi Fax No: 2218475 Telephone: 2252299 E-mail: ps@devolutionplanning.go.ke
In addition to embarking on a new dialogue on Ohio s transportation priorities,
 Strategic Initiatives for 2008-2009 ODOT Action to Answer the Challenges of Today In addition to embarking on a new dialogue on Ohio s transportation priorities, the Strategic Initiatives set forth by
CLIMATE CHANGE SPENDING IN ETHIOPIA
 CLIMATE CHANGE SPENDING IN ETHIOPIA Recommendations to bridge the funding gap for climate financing in Ethiopia Civil Society and government representatives attending the round table discussion on Ethiopia
Table of Contents. BioCF ISFL 2015 Annual Report
 2015 Annual Report Table of Contents Acronyms... 3 Introduction to the Report... 4 Initiative Objectives... 4 Annual Progress Report and the Year Ahead... 6 Initiative-level... 6 ISFL Notes and Approaches...
EAST AFRICAN COMMUNITY. CHALLENGES AND OPPORTUNITIES OF CLIMATE CHANGE: Post COP19 Perspective of East African Civil Society Organizations
 EAST AFRICAN COMMUNITY CHALLENGES AND OPPORTUNITIES OF CLIMATE CHANGE: Post COP19 Perspective of East African Civil Society Organizations EAC Climate Change Policy Framework 5 th December 2013 Arusha,
GOVERNANCE FRAMEWORK FOR
 December, 2011 GOVERNANCE FRAMEWORK FOR THE STRATEGIC CLIMATE FUND Adopted November 2008 and amended December 2011 Table of Contents A. Introduction B. Purpose and Objectives C. SCF Programs D. Governance
Strengthening Vermont s Economy by Integrating Transportation and Smart Growth Policy
 Strengthening Vermont s Economy by Integrating Transportation and Smart Growth Policy Technical Memorandum #4: Short List of Recommended Alternatives May 21, 2013 Tech Memo #4: Short List of Recommended
GCF Readiness Programme Fiji
 GCF Readiness Programme Fiji In Fiji, The Programme will target two important aspects of the GCF approach, access to funds and private sector engagement. In this context the Programme focuses on a range
Executive Summary (in one page)
") Kenya 2015.10.28 PAGE 1 OF 6 (Please submit completed form to countries@gcfund.org) Executive Summary (in one page) Country (or region) Kenya Submission Date 28/10/2015 NDA or Focal Point Contact Point
Kenya 2015.10.28 PAGE 1 OF 6 (Please submit completed form to countries@gcfund.org) Executive Summary (in one page) Country (or region) Kenya Submission Date 28/10/2015 NDA or Focal Point Contact Point
Organisation strategy for Sweden s cooperation with the Green Climate Fund for
 Organisation strategy for Sweden s cooperation with the Green Climate Fund for 2016 2018 Appendix to Government Decision 22 June 2016 (UD2016/11355/GA) Organisation strategy for Sweden s cooperation with
SAMOA S SMOOTH TRANSITION STRATEGY REPORT
 SAMOA S SMOOTH TRANSITION STRATEGY REPORT 1 31 DECEMBER 2015 OVERALL ASSESSMENT OF THE TRANSITION PROCESS Background: Samoa graduated out of LDC status on 1 st January 2014. The Government decided that
FINAL CONSULTATION DOCUMENT May CONCEPT NOTE Shaping the InsuResilience Global Partnership
 FINAL CONSULTATION DOCUMENT May 2018 CONCEPT NOTE Shaping the InsuResilience Global Partnership 1 Contents Executive Summary... 3 1. The case for the InsuResilience Global Partnership... 5 2. Vision and
Duration of Assignment: Approx. 150 working days from January to September 2015
 Terms of reference GENERAL INFORMATION Title: Gender Poverty Expert _CPEIR Bangka Belitung (Indonesian National) Project Name : Environment Unit/ Sustainable Development Financing (SDF) SIDA Funding Reports
Duration of Assignment: Apprx. 150 working days from January to September 2015
 Terms of reference GENERAL INFORMATION Title: Governance and Institutional Expert _CPEIR Bangka Belitung (Indonesian National) Project Name : Environment Unit/ Sustainable Development Financing (SDF) SIDA
A REVIEW OF EXISTING AND POTENTIAL ENVIRONMENTAL FISCAL REFORMS AND OTHER ECONOMIC INSTRUMENTS IN RWANDA
 A REVIEW OF EXISTING AND POTENTIAL ENVIRONMENTAL FISCAL REFORMS AND OTHER ECONOMIC INSTRUMENTS IN RWANDA (i) Objectives; The objective of the study on Environmental Fiscal Reform in Rwanda was to improve
Road and Transport Management Project Phase II SAU/10/51658
 UNITED NATIONS DEVELOPMENT PROGRAMME United Nations Department of Social and Economic Affaires (UNDESA) Project of the Government of the Kingdom of Saudi Arabia Ministry of Transport (MOT) Road and Transport
The UNOPS Budget Estimates, Executive Board September 2013
 The UNOPS Budget Estimates, 2014-2015 Executive Board September 2013 1 Key results of 2012 Benchmarks and standards Content UNOPS strategic plan 2014-2017 UNOPS budget estimates 2014-2015 Review of the
Additional Modalities that Further Enhance Direct Access: Terms of Reference for a Pilot Phase
 Additional Modalities that Further Enhance Direct Access: Terms of Reference for a Pilot Phase GCF/B.10/05 21 June 2015 Meeting of the Board 6-9 July 2015 Songdo, Republic of Korea Provisional Agenda item
Annex Agreed documents The following documents agreed by the G20 support our Communique: G20 Blueprint on Innovative Growth G Innovation
 Annex Agreed documents The following documents agreed by the G20 support our Communique: G20 Blueprint on Innovative Growth G20 2016 Innovation Action Plan G20 New Industrial Revolution Action Plan G20
with the Ministry of Finance and Planning for the United Republic of Tanzania 08 November 2015 NDA Strengthening & Country Programming
 with the Ministry of Finance and Planning for the United Republic of Tanzania 08 November 2015 NDA Strengthening & Country Programming PAGE 1 OF 8 (Please submit completed form to countries@gcfund.org)
Second-Party Opinion EUROFIMA Green Bond
 Evaluation Summary Sustainalytics is of the opinion that the Framework is credible and impactful, and aligns with the four core components of the Green Bond Principles 2018. This assessment is based on
Arrangements for the revision of the terms of reference for the Peacebuilding Fund
 United Nations A/63/818 General Assembly Distr.: General 13 April 2009 Original: English Sixty-third session Agenda item 101 Report of the Secretary-General on the Peacebuilding Fund Arrangements for the
REPUBLIC OF KENYA COUNTY GOVERNMENT OF BUSIA DEPARTMENT OF FINANCE AND ECONOMIC PLANNING
 REPUBLIC OF KENYA COUNTY GOVERNMENT OF BUSIA DEPARTMENT OF FINANCE AND ECONOMIC PLANNING COUNTY TREASURY REF NO: BC/CT/CIR/VOL.1/88 P.O.BOX Private Bag 50400 BUSIA 28 th August, 2015 TO: ALL CHIEF OFFICERS/DEPARTMENTAL
with the National Rural Support Programme (NRSP) for the Islamic Republic of Pakistan 13 November 2015 NDA Strengthening & Country Programming
 for the Islamic Republic of Pakistan 13 November 2015 NDA Strengthening & Country Programming") with the National Rural Support Programme (NRSP) for the Islamic Republic of Pakistan 13 November 2015 NDA Strengthening & Country Programming READINESS AND PREPARATORY SUPPORT PROPOSAL PAGE 1 OF 10 Country
with the National Rural Support Programme (NRSP) for the Islamic Republic of Pakistan 13 November 2015 NDA Strengthening & Country Programming READINESS AND PREPARATORY SUPPORT PROPOSAL PAGE 1 OF 10 Country
Government Policy Statement on land transport 2018 release for public engagement
 In Confidence Office of the Minister of Transport Chair, Cabinet Economic Development Committee Government Policy Statement on land transport 2018 release for public engagement Proposal 1. This paper seeks
ENVIRONMENT, CLIMATE CHANGE AND THE MDGS: RESHAPING THE DEVELOPMENT AGENDA
 Environment for the MDGs ENVIRONMENT, CLIMATE CHANGE AND THE MDGS: RESHAPING THE DEVELOPMENT AGENDA A Poverty Environment Partnership Event in support of the UN High Level Event on MDGs UNDP-UNEP Poverty-Environment
GOVERNANCE FRAMEWORK FOR THE CLEAN TECHNOLOGY FUND
 June 2014 GOVERNANCE FRAMEWORK FOR THE CLEAN TECHNOLOGY FUND Adopted November 2008 and amended June 2014 Table of Contents A. Introduction B. Purpose and Objectives C. Types of Investment D. Financing
Introduction. I. Background
 High Level Panel (HLP) on Illicit Financial Flows (IFF) from Africa Briefing Note on the ongoing efforts to curb Illicit Financial Flows (IFFs) from Africa Introduction The aim of the briefing note is
DOCUMENT OF THE EUROPEAN BANK FOR RECONSTRUCTION AND DEVELOPMENT STRATEGY FOR ALBANIA
 DOCUMENT OF THE EUROPEAN BANK FOR RECONSTRUCTION AND DEVELOPMENT STRATEGY FOR ALBANIA REPORT ON THE INVITATION TO THE PUBLIC TO COMMENT 1. Overview of the public consultation process The objective of this
CLIMATE FINANCE OPPORTUNITIES FOR ENHANCED LOCAL ACTION
 CLIMATE FINANCE OPPORTUNITIES FOR ENHANCED LOCAL ACTION V-LED AFRICA WORKSHOP: LOCALISING CLIMATE FINANCE AND ACTION 23-25 APRIL 2018, IRENE, SOUTH AFRICA 1 CC expenditure will absorb ~ 70% of domestic
Decision 3/CP.17. Launching the Green Climate Fund
 Decision 3/CP.17 Launching the Green Climate Fund The Conference of the Parties, Recalling decision 1/CP.16, 1. Welcomes the report of the Transitional Committee (FCCC/CP/2011/6 and Add.1), taking note
Synthesis report on the progress made in the implementation of the remaining elements of the least developed countries work programme
 United Nations FCCC/SBI/2014/INF.17 Distr.: General 23 October 2014 English only Subsidiary Body for Implementation Forty-first session Lima, 1 8 December 2014 Item 11(b) of the provisional agenda Matters
Building a Nation: Sint Maarten National Development Plan and Institutional Strengthening. (1st January 31st March 2013) First-Quarter Report
 First-Quarter Report") Building a Nation: Sint Maarten National Development Plan and Institutional Strengthening (1st January 31st March 2013) First-Quarter Report Contents 1. BACKGROUND OF PROJECT... 3 2. PROJECT OVERVIEW...
Building a Nation: Sint Maarten National Development Plan and Institutional Strengthening (1st January 31st March 2013) First-Quarter Report Contents 1. BACKGROUND OF PROJECT... 3 2. PROJECT OVERVIEW...
Ethiopia s Climate Resilient Green Economy (CRGE) Facility Terms of Reference
 Facility Terms of Reference") Federal Democratic Republic of Ethiopia Ethiopia s Climate Resilient Green Economy (CRGE) Facility Terms of Reference Final Version Ministry of Finance and Economic Development August 2012 Addis Ababa
Federal Democratic Republic of Ethiopia Ethiopia s Climate Resilient Green Economy (CRGE) Facility Terms of Reference Final Version Ministry of Finance and Economic Development August 2012 Addis Ababa
Proposed Working Mechanisms for Joint UN Teams on AIDS at Country Level
 Proposed Working Mechanisms for Joint UN Teams on AIDS at Country Level Guidance Paper United Nations Development Group 19 MAY 2006 TABLE OF CONTENTS Introduction A. Purpose of this paper... 1 B. Context...
FISCAL STRATEGY PAPER
 REPUBLIC OF KENYA MACHAKOS COUNTY GOVERNMENT THE COUNTY TREASURY MEDIUM TERM FISCAL STRATEGY PAPER ACHIEVING EQUITABLE SOCIAL AND ECONOMIC DEVELOPMENT IN MACHAKOS COUNTY FEBRUARY2014 Foreword This Fiscal
with UNDP for the Union of the Comoros 25 June 2015 NDA Strengthening & Country Programming
 with UNDP for the Union of the Comoros 25 June 2015 NDA Strengthening & Country Programming PAGE 1 OF 12 Country (or region) Executive Summary (in one page) Union of the Comoros Submission Date 29/05/2015
BACKGROUND PAPER ON COUNTRY STRATEGIC PLANS
 BACKGROUND PAPER ON COUNTRY STRATEGIC PLANS Informal Consultation 7 December 2015 World Food Programme Rome, Italy PURPOSE 1. This update of the country strategic planning approach summarizes the process
Earthquake 2005 Recovery and Reconstruction
 Earthquake 2005 Recovery and Reconstruction 2 Earthquake 8 Oct 2005 Nine Districts 1. MANSHERA 2. BATAGRAM 3. SHANGLA 4. ABBOTTABAD 5. KOHISTAN Epicentre 6. MUZAFFARABAD 7. NELUM 8. BAGH 9. RAWALAKOT Depth:
ADDIS ABABA ZERO DRAFT WWF REACTION
 ADDIS ABABA ZERO DRAFT WWF REACTION 9 April 2015 Summary WWF welcomes the zero draft of the Addis Ababa Accord (16 March 2015) as a positive initial draft for a global framework for financing sustainable
SUBMISSION BY DENMARK AND THE EUROPEAN COMMISSION ON BEHALF OF THE EUROPEAN UNION AND ITS MEMBER STATES
 SUBMISSION BY DENMARK AND THE EUROPEAN COMMISSION ON BEHALF OF THE EUROPEAN UNION AND ITS MEMBER STATES Bonn, 25 May 2012 Subject: EU Fast Start Finance Report Key Messages In accordance with developed
Principles for the Design of the International Financing Facility for Education (IFFEd)
") 1 Principles for the Design of the International Financing Facility for Education (IFFEd) Introduction There is an urgent need for action to address the education and learning crisis confronting us. Analysis
1 Principles for the Design of the International Financing Facility for Education (IFFEd) Introduction There is an urgent need for action to address the education and learning crisis confronting us. Analysis
with Caribbean Community Climate Change Centre (5Cs) for Belize 14 December 2016 NDA Strengthening & Country Programming
 for Belize 14 December 2016 NDA Strengthening & Country Programming") with Caribbean Community Climate Change Centre (5Cs) for Belize 14 December 2016 NDA Strengthening & Country Programming PAGE 1 OF 16 28 July 2016 Readiness and Preparatory Support Proposal Readiness -
with Caribbean Community Climate Change Centre (5Cs) for Belize 14 December 2016 NDA Strengthening & Country Programming PAGE 1 OF 16 28 July 2016 Readiness and Preparatory Support Proposal Readiness -
United Nations Fund for Recovery Reconstruction and Development in Darfur (UNDF)
") United Nations Fund for Recovery Reconstruction and Development in Darfur (UNDF) Terms of Reference 29 March 2013 1 Contents I. Introduction... 3 II. Purpose, Scope and Principles of the UNDF... 4 III.
United Nations Fund for Recovery Reconstruction and Development in Darfur (UNDF) Terms of Reference 29 March 2013 1 Contents I. Introduction... 3 II. Purpose, Scope and Principles of the UNDF... 4 III.
CC is a development issue - not just an environmental concern CC impacts on human development, economic growth, poverty alleviation and the
 CC is a development issue - not just an environmental concern CC impacts on human development, economic growth, poverty alleviation and the achievement of MDGs Long term: human lives and livelihoods are
Fortieth Session. Rome, 3-8 July Medium Term Plan and Programme of Work and Budget (Draft Resolution)
") June 2017 C 2017/LIM/4 Rev.1 E CONFERENCE Fortieth Session Rome, 3-8 July 2017 Medium Term Plan 2018-21 and Programme of Work and Budget 2018-19 (Draft Resolution) This document: I) provides an extract
June 2017 C 2017/LIM/4 Rev.1 E CONFERENCE Fortieth Session Rome, 3-8 July 2017 Medium Term Plan 2018-21 and Programme of Work and Budget 2018-19 (Draft Resolution) This document: I) provides an extract
International Policies and Cooperation to Advance an Inclusive Green Economy
 Section 4 International Policies and Cooperation to Advance an Inclusive Green Economy 6 Learning Unit International Funding Sources for Green Economy The Green Economy transition requires the mobilizations
Suggested elements for the post-2015 framework for disaster risk reduction
 United Nations General Assembly Distr.: General 16 June 2014 A/CONF.224/PC(I)/6 Original: English Third United Nations World Conference on Disaster Risk Reduction Preparatory Committee First session Geneva,
Synthesis of key recommendations and decisions 8 March 2018
 SDG-Education 2030 Steering Committee Paris, 28 February-2 March 2018 Synthesis of key recommendations and decisions 8 March 2018 This synthesis summarizes the main recommendations and decisions made at
October 2018 JM /3. Hundred and Twenty-fifth Session of the Programme Committee and Hundred and Seventy-third Session of the Finance Committee
 October 2018 JM 2018.2/3 E JOINT MEETING Hundred and Twenty-fifth Session of the Programme Committee and Hundred and Seventy-third Session of the Finance Committee Rome, 12 November 2018 Implications of
VOLUNTARY NATIONAL REPORT FOR KENYA
 VOLUNTARY NATIONAL REPORT FOR KENYA Theme: HEALTH WEEK Progress made 12 th to in 16Implementation th September, 2016 of the SDGs in Kenya Mr. Irungu Nyakera CBS 1 Outline Country Profile Introduction Institutional
Tajikistan Country Report. Mid Term Review of the UNDP-UNEP Poverty- Environment Initiative (PEI) Scale-Up. Kris B. Prasada Rao
 Scale-Up. Kris B. Prasada Rao") Tajikistan Country Report Mid Term Review of the UNDP-UNEP Poverty- Environment Initiative (PEI) Scale-Up Kris B. Prasada Rao 27 October 2011 1 LIST OF ACRONYMS CC CCA CP CIS CBO CSO CPAP DDP DFID EC ECIS
Tajikistan Country Report Mid Term Review of the UNDP-UNEP Poverty- Environment Initiative (PEI) Scale-Up Kris B. Prasada Rao 27 October 2011 1 LIST OF ACRONYMS CC CCA CP CIS CBO CSO CPAP DDP DFID EC ECIS
Community-Based SME For Road Maintenance
 Community-Based SME For Road Maintenance Insights from the W.B and IADB-Peruvian Rural Roads maintenance contracts Project & Poverty Reduction Presented by Jacob Greenstein (EGAT) Scope of Presentation
REPUBLIC OF KENYA BARINGO COUNTY GOVERNMENT COUNTY TREASURY AND ECONOMIC PLANNING
 REPUBLIC OF KENYA BARINGO COUNTY GOVERNMENT COUNTY TREASURY AND ECONOMIC PLANNING 29 th August 2018 TREASURY CIRCULAR NO. BCG/CT/BUDGET/05/VOL.1/77 TO: CLERK COUNTY ASSEMBLY COUNTY EXECUTIVE COMMITTEE
GREEN CLIMATE FUND GOVERNANCE MECHANISM IN NEPAL
 GREEN CLIMATE FUND READINESS PROGRAMME GREEN CLIMATE FUND GOVERNANCE MECHANISM IN NEPAL Operational Manual January 2017 1 ACRONYMS CC CFU CFSC GCF GCF - RP GDP GoN IECCD MoAD MoF MIE MoFSC MoPE MoFALD
ISIOLO COUNTY GAZETTE SUPPLEMENT
 SPECIAL ISSUE \-11,01 C0131,1C11, RE? 0 E.1:11,,C INBRM N. Isiolo County Gazette Supplement No. 8 (Bills No. 7) REPUBLIC OF KENYA ISIOLO COUNTY GAZETTE SUPPLEMENT BILLS, 2016 NAIROBI, 27th June, 2016 CONTENT
Our Expertise. IFC blends investment with advice and resource mobilization to help the private sector advance development.
 Our Expertise IFC blends investment with advice and resource mobilization to help the private sector advance development. Where We Work As the largest global development institution focused on the private
Incremental cost methodology: potential approaches for the Green Climate Fund
 Meeting of the Board 27 February 1 March 2018 Songdo, Incheon, Republic of Korea Provisional agenda item 14(f) GCF/B.19/34 20 February 2018 Incremental cost methodology: potential approaches for the Green
Evaluation of the European Union s Co-operation with Kenya Country level evaluation
 "FICHE CONTRADICTOIRE" Evaluation of the European Union s Co-operation with Kenya Country level evaluation Recommendations Responses of Services: Follow-up (one year later) GENERAL RECOMMENDATIONS 1 Give
Aloysius M. Kamperewera [PhD] Ministry of Environment and Climate Change Managment Director for Environmental Affairs
![Aloysius M. Kamperewera [PhD] Ministry of Environment and Climate Change Managment Director for Environmental Affairs](/thumbs/73/68978313.jpg "Aloysius M. Kamperewera [PhD] Ministry of Environment and Climate Change Managment Director for Environmental Affairs") Session 6: Element D: Reporting, Monitoring And Review: Experiences And Lessons Learnt From National Climate Change Programme And NAPA Implementation In Malawi Aloysius M. Kamperewera [PhD] Ministry of
Session 6: Element D: Reporting, Monitoring And Review: Experiences And Lessons Learnt From National Climate Change Programme And NAPA Implementation In Malawi Aloysius M. Kamperewera [PhD] Ministry of
REGIONAL EVALUATION FRAMEWORK 1.0 INTRODUCTION 2.0 PURPOSE 3.0 DEFINITIONS. Edmonton Metropolitan Region Planning Toolkit
 Edmonton Metropolitan Region Planning Toolkit Re-imagine. Plan. Build. Edmonton Metropolitan Region Growth Plan 1.0 INTRODUCTION On October 26, 2017, the Government of Alberta approved the Edmonton Metropolitan
Green Finance for Green Growth
 2010/FMM/006 Agenda Item: Plenary 2 Green Finance for Green Growth Purpose: Information Submitted by: Korea 17 th Finance Ministers Meeting Kyoto, Japan 5-6 November 2010 EXECUTIVE SUMMARY Required Action/Decision
THE COUNTY GOVERNMENT OF MACHAKOS THE COUNTY TREASURY PROGRAMMME BASED BUDGET FY 2015/2016
 REPUBLIC OF KENYA THE COUNTY GOVERNMENT OF MACHAKOS THE COUNTY TREASURY PROGRAMMME BASED BUDGET FY JUNE 2015 0 Table of contents Table of contents... 1 Revenue Estimates FY 2015/16-2017-18... 2 Summary
Getting you there. GCF country programme development guide. Turning aspirations into actions preparing country programme
 INITIAL DRAFT COUNTRY PROGRAMME GUIDE Getting you there GCF country programme development guide Turning aspirations into actions preparing country programme. A key step in turning a country s climate action
Accelerating Progress toward the Economic Empowerment of Rural Women (RWEE) Multi-Partner Trust Fund Terms of Reference UN WOMEN, FAO, IFAD, WFP
 Multi-Partner Trust Fund Terms of Reference UN WOMEN, FAO, IFAD, WFP") Accelerating Progress toward the Economic Empowerment of Rural Women (RWEE) Multi-Partner Trust Fund Terms of Reference UN WOMEN, FAO, IFAD, WFP March 2013 TABLE OF CONTENTS I. Introduction II. Programme
Accelerating Progress toward the Economic Empowerment of Rural Women (RWEE) Multi-Partner Trust Fund Terms of Reference UN WOMEN, FAO, IFAD, WFP March 2013 TABLE OF CONTENTS I. Introduction II. Programme
Analysis of the Alameda County Transportation Expenditure Plan Prepared by Alameda County Transportation Commission
 Analysis of the Alameda County Transportation Expenditure Plan Prepared by Alameda County Transportation Commission Discussion: In 1986, voters approved Measure B, a 1/2 cent sales tax, to fund transportation
CANADIAN URBAN TRANSIT ASSOCIATION BUDGET ANALYSIS
 FEDERAL BUDGET 2017 CANADIAN URBAN TRANSIT ASSOCIATION BUDGET ANALYSIS In its second budget since forming government, the federal Liberals continued with the vision they set for the country in the 2015
Public Finance Reforms in Kenya Some Emerging Issues and their Relevance under the Context of Devolution
 Society for International Development Public Finance Reforms in Kenya Some Emerging Issues and their Relevance under the Context of Devolution Introduction The Government of Kenya has made deliberate efforts
Programme Manual
 1.1.1. 25 October 2010 Table of contents 0. Introduction... 1 1. General programme information... 2 1.1. Main objectives of the programme...2 1.2. Programme area...2 1.3. Programme funding...2 1.4. Programme
Executive Summary(in one page)
") Senegal 2015.10.08 PAGE 1 OF 7 (Please submit completed form to countries@gcfund.org) Executive Summary(in one page) Country (or region) Senegal Submission Date 08/10/2015 NDA or Focal Point Contact Point
Senegal 2015.10.08 PAGE 1 OF 7 (Please submit completed form to countries@gcfund.org) Executive Summary(in one page) Country (or region) Senegal Submission Date 08/10/2015 NDA or Focal Point Contact Point
2018 report of the Inter-agency Task Force Overview
 2018 report of the Inter-agency Task Force Overview In 2017, most types of development financing flows increased, amid progress across all the action areas of the Addis Ababa Action Agenda (hereafter,
The Benefits of a Carbon Tax Swedish experiences and a focus on developing countries
 1 The Benefits of a Carbon Tax Swedish experiences and a focus on developing countries Susanne Åkerfeldt Senior Advisor Ministry of Finance, Sweden susanne.akerfeldt@gov.se +46 8 405 1382; +46 70 681 25
SUSTAINABLE URBAN MOBILITY PLAN TRAINING WORKSHOP. Module 6 Implementation Plan
 SUSTAINABLE URBAN MOBILITY PLAN TRAINING WORKSHOP Module 6 Implementation Plan Sustainable Urban Mobility Plans: Delivery & Implementation Plans Identifying phased approach to delivery and programming
Green Climate Fund and the Paris Agreement
 Briefing Note February 2016 Green Climate Fund and the Paris Agreement Climate Focus Client Brief on the Paris Agreement V February 2016 Introduction The Paris Agreement and the supporting Decision include
Public Works and Development Services
 City of Commerce Capital Improvement Program Prioritization Policy Public Works and Development Services SOP 101 Version No. 1.0 Effective 05/19/15 Purpose The City of Commerce s (City) Capital Improvement
Introduction. The Assessment consists of: A checklist of best, good and leading practices A rating system to rank your company s current practices.
 ESG / CSR / Sustainability Governance and Management Assessment By Coro Strandberg President, Strandberg Consulting www.corostrandberg.com September 2017 Introduction This ESG / CSR / Sustainability Governance
Report of the Standing Committee on Finance
 United Nations FCCC/CP/2018/L.13 Distr.: Limited 14 December 2018 Original: English Conference of the Parties Twenty-fourth session Katowice, 2 14 December 2018 Agenda item 10(b) Matters relating to finance
Chad 16 September 2015
 Chad 16 September 2015 PAGE 1 OF 7 (Please submit completed form to countries@gcfund.org) Executive Summary(in one page) Country (or region) Chad (Africa) Submission Date 16/09/2015 NDA or Focal Point
T H E NA I RO B I C A L L TO A C T I O N F O R C L O S I N G T H E I M P L E M E N TA T I O N G A P I N H E A LT H P RO M O T I O N
 T H E NA I RO B I C A L L TO A C T I O N F O R C L O S I N G T H E I M P L E M E N TA T I O N G A P I N H E A LT H P RO M O T I O N 1. INTRODUCTION PURPOSE The Nairobi Call to Action identifies key strategies
Summary of Project/Program. Summary - Project/Program Approval Request. Private: Public: X Mixed: Grant: USD31 Million 1. Loan: USD5 Million Project:
 Summary of Project/Program PILOT PROGRAM FOR CLIMATE RESILIENCE Summary - Project/Program Approval Request 1. Country/Region: Zambia 2. CIF Project ID#: XPCRZM041A 3. Project/Program Title: Zambia Strengthening
Annex 1: The One UN Programme in Ethiopia
 Annex 1: The One UN Programme in Ethiopia Introduction. 1. This One Programme document sets out how the UN in Ethiopia will use a One UN Fund to support coordinated efforts in the second half of the current
UNDP Executive Board Funding Dialogue. January 2015
 UNDP Executive Board Funding Dialogue January 2015 Overview A. Overall objective B. Global context C. UNDP s development and institutional context D. Overview of resources E. EB principles for UNDP programming
Management response to the recommendations deriving from the evaluation of the Mali country portfolio ( )
") Executive Board Second regular session Rome, 26 29 November 2018 Distribution: General Date: 23 October 2018 Original: English Agenda item 7 WFP/EB.2/2018/7-C/Add.1 Evaluation reports For consideration
Executive Board Second regular session Rome, 26 29 November 2018 Distribution: General Date: 23 October 2018 Original: English Agenda item 7 WFP/EB.2/2018/7-C/Add.1 Evaluation reports For consideration
CALL FOR PROPOSAL. Title: Improving Tenure Security of Smallholder Farmers in Select Areas in the Philippines
 CALL FOR PROPOSAL The purpose of the Call for Expression of Interest is to solicit interest from regional or national not for profit rural civil society organizations as Implementing Partners that wish
Relationship with UNFCCC and External Bodies
 Relationship with UNFCCC and External Bodies 19 June 2013 Meeting of the Board 26-28 June 2013 Songdo, Republic of Korea Agenda item 9 Page b Recommended action by the Board It is recommended that the
Economic and Social Council
 United Nations Economic and Social Council Distr.: Limited 26 May 2015 Original: English 2015 session 21 July 2014-22 July 2015 Agenda item 7 Operational activities of the United Nations for international
October 2017 JM /2
 October 2017 JM 2017.2/2 E JOINT MEETING Joint Meeting of the Hundred and Twenty-second Session of the Programme Committee and Hundred and Sixty-ninth Session of the Finance Committee Rome, 6 November
Private Sector Facility: Working with Local Private Entities, Including Small and Medium-Sized Enterprises
 Private Sector Facility: Working with Local Private Entities, Including Small and Medium-Sized Enterprises GCF/B.09/12 5 March 2015 Meeting of the Board 24-26 March 2015 Songdo, Republic of Korea Agenda
World Investment Forum 2014 Investing in Sustainable Development
 24 March 2014 pm World Investment Forum 2014 Investing in Sustainable Development Geneva, Switzerland 13-16 October Provisional Programme The UNCTAD World Investment Forum is a high-level, biennial, multi-stakeholder
Public Disclosure Authorized. Public Disclosure Authorized. Public Disclosure Authorized. Public Disclosure Authorized. Report No.
 Public Disclosure Authorized Project Name Region Sector Project ID Borrower Report No. PIC4620 Senegal-Urban Transport Reform and... Capacity Building Project Africa Urban Transport SNPA44383 Republic
Terms of Reference (ToR)
") Terms of Reference (ToR) Mid -Term Evaluations of the Two Programmes: UNDP Support to Deepening Democracy and Accountable Governance in Rwanda (DDAG) and Promoting Access to Justice, Human Rights and Peace
Terms of Reference (ToR) Mid -Term Evaluations of the Two Programmes: UNDP Support to Deepening Democracy and Accountable Governance in Rwanda (DDAG) and Promoting Access to Justice, Human Rights and Peace
Austrian Climate Change Workshop Summary Report The Way forward on Climate and Sustainable Finance
 Austrian Climate Change Workshop 2018 - Summary Report The Way forward on Climate and Sustainable Finance In close cooperation with the Austrian Federal Ministry of Sustainability and Tourism, Kommunalkredit
EU Funds for Road Safety Multiannual Financial Framework Saving Lives on EU Roads until 2020 January 2012
 EU Funds for Road Safety Multiannual Financial Framework 2014-2020 2020 Saving Lives on EU Roads until 2020 January 2012 Introduction In the context of the adoption of the new Multiannual Financial Framework
Indicative Guidelines for Country-Specific Resource Mobilization Strategies
 Indicative Guidelines for Country-Specific Resource Mobilization Strategies I. GENERAL PROVISIONS 1. In decision IX/11 B, the Conference of the Parties adopted the strategy for resource mobilization (SRM)