Adopted. Operating Budget & Capital Improvements Plan. Adopted October 7, 2015
|
|
|
- Poppy Haynes
- 6 years ago
- Views:
Transcription


1 Adopted 2016 Operating Budget & Capital Improvements Plan Adopted October 7,


2 GFOA Award The Government Finance Officers Association of the United States and Canada (GFOA) presented a Distinguished Budget Presentation Award to Madison Metropolitan Sewerage District, Wisconsin for its annual budget for the fiscal year beginning January 1, In order to receive this award, a governmental unit must publish a budget document that meets program criteria as a policy document, as an operations guide, as a financial plan, and as a communications device. This award is valid for a period of one year only. We believe our current budget continues to conform to program requirements, and we are submitting it to GFOA to determine its eligibility for another award. 3 i.

3 Officers Commissioners (left to right) John Hendrick Caryl Terrell, President Topf Wells Thomas Hovel, Vice President Ezra Meyer, Secretary Budget Team (back row left to right) Janelle Werner, Executive Coordinator Jeff Brochtrup, Director of Administration Mike Simon, Asst. Chief Engineer & Director Michael Mucha, Chief Engineer & Director Paul Nehm, Dir. of Operations & Maintenance (front row left to right) Laurie Dunn, Information Systems Manager Shirley Fox, Controller Dave Taylor, Director of Ecosystem Services Stephanie Calkins, Accountant Bruce Borelli, Director of Engineering (not pictured) Irene DeLuna, Program Resource Associate 4 ii.
4 Table of Contents INTRODUCTION TO THE DISTRICT BUDGET BUDGET MESSAGE... 1 BUDGET PROCESS... 5 Budget Calendar Table BUDGET AMENDMENT PROCEDURES... 6 Amendment Procedures Table BUDGET POLICIES AND PRACTICES... 7 BUDGET POLICY GUIDANCE... 7 DEFINITIONS COMBINED SUMMARY OF OPERATING, CAPITAL PROJECTS, AND DEBT SERVICE... 9 Fund Structure for Budgets Table Combined Summary of Revenues & Expenditures Table Operating & Capital Project Budgets Combined Summary Table Combined Summary of Revenue Table Combined Summary of Expenditures Table OPERATING BUDGET SUMMARY OVERVIEW Revenues Expenditures Operating Budget Table Revenues Expenditures Operating Fund Balance Impacts of Capital Investments on the Operating Budget Operating Budget Planning Service Charge Rates Revenue Categories Expenditure Categories Personnel Full-Time Equivalent Positions (FTE) Table ORGANIZATIONAL CHART CAPITAL IMPROVEMENTS PLAN & BUDGET INTRODUCTION OVERVIEW AND HIGHLIGHTS CAPITAL PROJECTS BUDGET SUMMARY Summary Summary Revenues & Expenditures Capital Projects Budget Table Capital Projects Fund Balance SIX-YEAR CAPITAL PROJECTS OVERVIEW Six-Year Capital Projects Summary Table iii.
5 iv. 6 Master Plan Conformance Project Summaries and Business Cases Capital Projects Budget Expenses CAPITAL PROJECTS CASH FLOW SUMMARY Capital Projects Cash Flow Summary Table Wisconsin Clean Water Fund Program DEBT SERVICE OVERVIEW DEBT SERVICE BUDGET Debt Service Budget Table DEBT SERVICE FUND BALANCE SIX-YEAR DEBT SERVICE SUMMARY AND DEBT SERVICE LIMIT Six-Year Debt Service Summary Table DEBT SERVICE IMPACTS ON CUSTOMERS DEBT STABILIZATION CURRENT DEBT SERVICE SCHEDULE Debt Service Payment Schedule Table FUTURE DEBT SERVICE SCENARIOS SCENARIO ASSUMPTIONS STRATEGIC PLANNING DEPARTMENTAL INFORMATION CHIEF ENGINEER AND DIRECTOR S OFFICE ADMINISTRATIVE SERVICES DEPARTMENT ECOSYSTEM SERVICES DEPARTMENT ENGINEERING AND PLANNING/STRATEGY DEPARTMENT OPERATIONS AND MAINTENANCE DEPARTMENT APPENDICES APPENDIX A: PROJECT SUMMARIES Nine Springs WTP Projects Conveyance System Projects Capital Budget Expenses APPENDIX B: COMPLETED PROJECTS & RETAINERS Project Completions Project Completions/Anticipated Completions Retainers APPENDIX C: BUDGET SUMMARIES APPENDIX D: 2016 WAGE SCHEDULE FOR HOURLY EMPLOYEES APPENDIX E: 2016 NON-REPRESENTED WAGE SCHEDULE APPENDIX F: STATISTICAL & SUPPLEMENTAL DATA Governance Service Area APPENDIX G: ORGANIZATIONAL CHANGES MEMORANDUM APPENDIX H: GLOSSARY Common Acronyms District Definitions
6 SECTION 1 Introduction to the District Budget 2016 Budget Message Commissioners: I am pleased to present the Madison Metropolitan Sewerage District 2016 Operating Budget and Capital Improvements Plan. Generally, the budget reflects the budget trends and forecasts staff reported to you in May, and the capital needs presented in July. However, given all the critical needs, this budget has deferred or eliminated some expenses that were anticipated to be included earlier this year. Service charges are expected to increase on average by 7.92%, primarily to account for a 6.28% increase in costs and 2% to correct for the structural deficit that was created by the budgeted use of reserves in The billing parameters for flows and loadings are trending downwards which influence the costs passed on to households. For example, as a large business produces less waste, those costs must be redistributed to other system users. The District does not charge households directly, and must use general estimates to determine the impact on households. With that clarification, the average household user charge for District services is estimated to be $167 per year, an increase of 11%, or $1.30 more per month. It is important to emphasize that these estimates are a prediction not a promise because the District does not control weather, flows, or loadings which can be highly variable from year to year. The only factor the District controls are costs. The 2016 Budget has expenditures increasing by 6.28% overall, primarily caused by an expected increase in debt service payments (3.5 percentage points of the increase), increased labor costs (1.9 percentage points), chloride reduction and adaptive management strategies (0.7 percentage points), and a contribution to the Equipment Replacement Fund (ERF) required by the Clean Water Fund (0.20 percentage points). There are other increased costs that are absorbed in the base budget and they are summarized as follows: Highlights of the Operating Budget are: To reduce phosphorous, chlorides, and fats, oils, and greases (FOG) in the wastewater through pollution prevention and source reduction programs. To effectively manage new regulatory requirements for our air emissions through air quality compliance assurance staff. To develop a multi-year budget planning process and budget planning principles that is more resilient to changes in weather patterns and demand. To upgrade information technology systems to support the outcomes of the Information Technology Strategic Plan and improve business decision making to support sustainable infrastructure management. To create a diversity internship program to respond to the Race to Equity Report. 1
7 To address safety issues and/or improve efficiency through Operations and Maintenance improvements. To initiate the first phase of a force main inspection program to determine pipe condition and identify critical repair needs. To reduce our energy costs and reliance on non-renewable energy sources through continued, promising research efforts. Highlights of the Capital Budget are: To develop a facility plan for the liquid stream of the plant to address peak capacity concerns, replace aging systems, and reduce energy consumption. To ensure adequate pumping capacity for the next 50 years in the Middleton and West Madison areas through the rehabilitation of Pumping Station 15. To complete the Maintenance Facility and consolidate maintenance staff in a safe, healthy and efficient workspace. To accommodate road improvements at the intersection of Verona Road and County Highway PD through the relocation of the Pumping Station 12 Force Main at Verona Road. To complete the rehabilitation of Pumping Stations 11 & 12 and provide redundant power supplies. Not included in the budget are capital and operating costs related to implementation of the Metromix Program, staffing for strategic communications, scheduled vehicle replacements, source separated organics project, prairie restorations and staff overlaps to assist with succession planning of senior managers. Approximately 95% of District resources are allocated to the construction, operation, and maintenance of physical infrastructure. Effectively managing infrastructure to protect public health and the environment is, and always will be, a primary responsibility of the District. However, the District can no longer operate in the same manner that has proven to be successful in the past because of the following trends: Certainty. The District s system of pipelines, pumping stations, and treatment plants were designed to accommodate operating conditions that were assumed to remain constant over time. Science is proving, and recent experience is showing, that future operating conditions in terms of wastewater inputs, availability of natural resources, and weather patterns are highly uncertain. Aging Infrastructure. The average age of the District s infrastructure is increasing, which lowers system performance and increases the probability of failure. To respond to these trends, the District is responding through the implementation of the following goal: 2
8 To manage risk and maximize wise investments in the expansion, replacement, and refurbishment of physical assets through the Sustainable Infrastructure Management (SIM) program. In 2016, priority projects will improve existing data and reports; establish condition assessment protocols; collect condition data for key assets at the treatment plant; and, establish policy level risk assessment and management guidance. In 2015, the Sustainable Infrastructure Management Framework and follow-up implementation plan laid out the future roadmap for the District s infrastructure management program. The District continues to increase its use of data-based decision-making in managing the performance, replacement, and expansion of the District s infrastructure. The goal is to reduce total lifecycle costs, while managing the risks - environmental, social, and economic - associated with potential asset failure. The 2015 efforts included development of an initial business risk exposure matrix, level of service definition, and consequence of failure scoring table. While efforts to improve infrastructure management and decision making are essential, it is becoming clear that the District must increasingly consider non-infrastructure strategies because of diminishing returns for treatment plant improvements. With over 100 years of incremental improvements in wastewater treatment performance, most of the cost effective engineered solutions are in place. Achieving further reductions in pollutant loadings to achieve regulatory compliance using traditional brick and mortar approaches will be disproportionately expensive relative to potential gains in water quality. To respond to this trend, the District will rely on meeting regulatory requirements for phosphorous and chlorides through pollution prevention and source reduction programs that can deliver equivalent or superior environmental outcomes at significantly lower costs. The District s goals related to this response are: To structure a regulatory compliance strategy for phosphorous reduction through Watershed Adaptive Management. In 2016, the District will transition to a full scale adaptive management project with a diverse partnership formed through the development of an intergovernmental agreement. The 2016 budget includes a position for an Adaptive Management Coordinator to support this effort. In 2015, the Commission adopted a Resolution that formalized the District s intent to pursue watershed adaptive management as a fiscally and environmentally-responsible approach to achieving compliance with phosphorous WPDES permit requirements. To develop a regulatory compliance strategy for chlorides through the Chloride Pollutant Minimization Plan. In 2016, the District will implement a chloride reduction strategy that includes a strong social marketing component. This strategy is designed to achieve a 20,000 lb. reduction in annual chloride loads over the next five year period. In 2015, the District completed a study to evaluate cost effective approaches for removing chloride loads from the wastewater stream. That study concluded that the most cost-effective approach was a multi-pronged effort to reduce chlorides at the source through pollution prevention strategies versus infrastructure-based removal strategies. 3
9 In closing, the District s 2016 budget continues a commitment to taking care of District facilities, provides for regional collaboration, and continues to provide a high level of environmental performance to District customers. The District s ongoing vision and commitment to providing sustainable, high value water resource management services at a reasonable cost continues with this budget. We thank the Commission, our partners, our staff, and most of all, our customer communities for enabling this vital work. Respectfully submitted, D. Michael Mucha, P.E. Chief Engineer and Director 4
10 Budget Process The purpose of the annual budgeting process is to ensure that the District has adequate resources to deliver its planned services during the upcoming year and in future years. As part of this process, the following questions need to be answered: 1. What are the estimated expenses for operating the District s facilities next year? 2. What are the estimated costs for construction of new or replacement facilities over the next six years? 3. How much money can the District expect from the various revenue sources next year, and how much money will the District need to recover through service charges? 4. How much money will the District need to borrow to finance construction work? 5. How much money does the District need in the bank to ensure adequate cash flow, to fulfill promises made when borrowing money, and to address unforeseen emergencies? The annual budget process addresses the upcoming year s financial management plan in three areas: 1. The Operating Fund budget addresses the operation of facilities and includes recovery of future years debt service costs to comply with promises made at the time the District borrows money to finance construction projects. Service charge revenue is the primary source of funds used to pay for the operation of facilities. 2. The Capital Projects Fund budget addresses construction of new or replacement facilities. Larger projects are typically funded with proceeds from a Clean Water Fund loan. These loans are administered by the State of Wisconsin. The District uses its taxing authority as collateral for these loans; however, the intent is to repay these loans with revenues generated through service charges. Smaller construction projects are funded through connection charge revenue and interest earned on the fund s investments. 3. The Debt Service Fund budget addresses debt service, the annual principal and interest payments due on borrowed funds. When the District borrows money from the state in the form of a Clean Water Fund loan, the District promises to place the amount of the next year s debt service payments on the tax roll unless the Debt Service Fund has a balance by October 1 sufficient to make those payments. Since the District intends to repay its debt through service charges, each year s Operating Fund budget includes sufficient amounts of principal and interest in its operating expenses to fulfill this requirement. This money is transferred from the Operating Fund to the Debt Service Fund prior to October 1 each year to ensure that no debt service payments need to be placed on the tax roll. Each year, the Chief Engineer and Director submits a Proposed Operating Budget, Proposed Capital Projects Budget, and Proposed Debt Service Budget. These proposed budgets are typically submitted at the first Commission meeting in September. After a public hearing and 5
11 further consideration by the Commission, the Commission commonly approves the Operating, Capital Projects, and Debt Service budgets at the second Commission meeting in October. In July of 2015, the Wisconsin statutes governing the District were modified. The statute modifications changed the number of Commissioners and the appointment process for the Commissioners effective October 11, Because of the change in Commission structure on October 11, the budget process was expedited with a special Commission meeting on October 7, 2015 to approve the 2016 budget. Table 1 summarizes the budget calendar for the 2016 Budget and Capital Improvements Plan. June - July July - August August September 9 September 10 September 11 September 24 September 30 October 7 October 29 November 1 Budget Calendar Table 1 Commission review and acceptance of the Draft CIP. The Executive Team discusses critical needs, expense and revenue trends, and goals. The team is made up of the Chief Engineer and Director (CED), Department Directors, HR Manager, and Executive Coordinator. Department staff develops and submits their budget requests to the Budget Review Team (CED, Dir. of Admin, and Controller), who then balances and develops the CED s proposed budget. A summary of the proposed budget is published and notice given of the upcoming budget hearing as required by Wisconsin Statutes Section CED presents preliminary budget. Notification of the District s 2016 Budget and Budget hearing mailed to communities. Public hearing and Commission discussion. Deadline to receive written comments from the public on the proposed budget. Commission adopts Operating, Capital Projects, and Debt Service budgets. Commission adopts service charge rates and septage disposal rates. Notify customers and septage haulers of new rates and estimated charges. Budget Amendment Procedures Amendments to the proposed Operating, Capital Projects, and Debt Service budgets, or to the approved budgets, can be initiated by either the Commission or staff. Once the Commission approves the budgets for the succeeding calendar year, amendments to the budgets must be approved by the Commission as shown in Table 2. 6
12 Budget Operating Capital Projects Debt Service Amendment Procedures Table 2 Requirements for Budget Amendments Any increase in the total authorized expenditures. Any increase in the budget total for the year. The addition of a new project not previously included in the adopted budget. Any increase to a previously approved total project cost. Any change to the approved amount to be transferred from the Operating Fund to the Debt Service Fund. Budget Policies and Practices Several overarching policies and practices combine to form the District s approach to budgeting for the services provided by the District: 1. Users pay charges based on the cost of the service. 2. Operating costs are funded on a pay-as-you-go basis. Annual costs for operating the District s facilities are recovered from current users through the payment of service charges that reflect the customer s use of the service and the current costs of providing that service. The District does not use borrowed money to pay for current operating costs. 3. Construction of new facilities is financed primarily with debt. New facilities are built to last twenty years or more, and designed with sufficient capacity to handle increasing loads caused by expected growth over their useful lives. Debt for new facilities is generally paid back over a 20-year period. This spreads the up-front construction costs over those users that actually use the facility during its service life. 4. Detailed long-range planning helps to ensure stable rates and charges. The District s Capital Projects Fund budget includes a six-year projection of construction-related expenses and revenues. The financial plan that evaluates the impacts of long-term borrowing on future budgets uses a 20-year projection. Budget Policy Guidance A number of policies guide the preparation of the annual budget for each of the three District funds. The Operating Fund budget policies are: 1. Maintain a minimum fund balance equal to 180 days of the annual operating costs (does not include debt service), to ensure adequate cash flow capabilities. 7
13 2. Balance the budget by calculating the required service charge revenues so that total revenues equal total expenditures. Service charge rates are reviewed and set annually so projected flows and loadings will provide the required service charge revenue. The Capital Projects Fund budget policies are: 1. Maintain a minimum fund balance of $3 million to fund any unforeseen project that may arise during the year. 2. Utilize reserve funds, interest earnings, and connection charge revenues to pay project costs before borrowing additional funds, unless the estimated project cost significantly exceeds the sum of these sources. In such cases, money is borrowed to finance the project. Since the early 1990s, the Clean Water Fund program has been the lowest cost source of debt financing for the District. All District loans since 1992 have been through the Clean Water Fund program. The Debt Service Fund budget policies are: 1. Maintain a minimum balance in the Debt Service Fund to ensure that no debt service payments need to be placed on the tax roll. Definitions Fiscal Year: The fiscal year for Madison Metropolitan Sewerage District begins on January 1 of each year and ends on December 31 of that year. The fiscal year is the accounting and budget year. Enterprise Fund: The District prepares its financial statements on an enterprise fund basis. Generally Accepted Accounting Principles (GAAP) require state and local governments to use the enterprise fund to account for business-type activities activities similar to those found in the private sector. Business-type activities include services primarily funded through service charges. Balanced Budget: The Madison Metropolitan Sewerage District is required to adopt a balanced budget each year. A balanced budget is one in which anticipated District revenues equal anticipated District expenditures for the fiscal year. The District achieves this with the Operating Budget by offsetting expenditures with service charge billings, other operating income, and fund reserves. The District s Capital Projects Budget is balanced by offsetting total project expenditures with Clean Water Fund loans, connection charge revenues, fund reserves, and all other capital projects fund income. The District s Debt Service Budget achieves balance by offsetting total debt service expenses with funds transferred from the Operating Fund, debt service reserves, and interest income. Fund Balance: Fund balance is the difference between the assets and liabilities of a fund. It is a measure of the amount available to budget or spend in the future. 8
14 2016 Combined Summary of Operating, Capital Projects, and Debt Service The District prepares its financial statements and budgets on an enterprise fund basis. The District s operating expenses are funded within the Operating Budget, the capital expenditures are funded within the Capital Projects Budget and the Debt Service Budget is funded by transfers from the Operating Fund. The Operating Fund is the main fund. The Operating Budget authorizes use of the Operating Fund. The Capital Projects Budget authorizes use of the Capital Projects Fund. The Debt Service Budget authorizes use of the Debt Service Fund. Table 3 summarizes the fund structure for the Operating, Capital Projects, and Debt Service budgets. The connection between the Operating Budget and the Debt Service Budget is the transfer of service charge revenues to the Debt Service Fund. The connection between the Debt Service Budget and the Capital Projects Budget is an indirect one. Loan proceeds are used to fund projects budgeted in the Capital Projects Budget while the debt service to pay off the loans is budgeted in the Debt Service Budget. Table 4 provides a combined summary of revenues and expenditures for 2014 through Table 5 provides details on the sources of funds, use of funds, basis of accounting, and basis for expense in the Operating and Capital Projects budgets. Fund Structure for Budgets Table 3 Operating Budget (Operating Fund) Operating Funding User Charges Servicing Pumping Stations Septage Disposal Struvite Fertilizer Sales Interest Income Other Income Operating Expenditures Net Operating Expenses* Transfers to Debt Service Fund Capital Projects Budget (Capital Projects Fund) Capital Funding Wisconsin Clean Water Fund Loans Interceptor and Treatment Plant Connection Charges Interest Income Capital Expenditures Treatment Plant Projects Conveyance System Projects Debt Service Budget (Debt Service Fund) Debt Funding Transfers from Operating Fund Interest Income Debt Expenditures Principal and Interest Payments *Net operating expenses are reported after charges to the Capital Projects Budget have been subtracted. 9
15 Combined Summary of Revenues & Expenditures Table 4 (Net of Transfers and Reserves) Revenue Category Proposed Change From Adopted Percent Actual Estimated Budget Budget Budget Change Operations and Maintenance Sewer Service Charges $27,900,206 $28,372,000 $29,272,449 $31,590,000 $2,317, % Septage Disposal Revenue 448, , , ,000 30, % Servicing Pumping Stations 242, , , ,000 13, % Struvite Fertilizer Sales 144, , , ,000 (25,000) % All Other Operating Income 260, , , ,000 27, % Cash Reserves , ,000 (424,000) % Total Operations and Maintenance Expenditures $28,997,411 $29,539,000 $30,883,079 $32,822,000 $1,938, % Capital Projects Clean Water Fund Loans $25,459,243 $20,807,000 $20,218,000 $13,221,000 ($6,997,000) % Interceptor and Treatment Plant Connection Charges 1,642, , ,000 1,050, , % Interest on Investments 28,399 34,000 34,000 38,000 4, % Total Capital Projects Expenditures $27,130,377 $21,741,000 $21,152,000 $14,309,000 ($6,843,000) % Debt Service Transfer from Operating Fund $10,865,000 $11,843,000 $11,843,000 $12,909,000 $1,066, % Interest on Investments 35,654 37,000 35,000 26,000 (9,000) % Total Debt Service Revenues $10,900,654 $11,880,000 $11,878,000 $12,935,000 $1,057, % Total Revenues (net of transfers and reserves) $56,163,442 $51,317,000 $51,466,079 $46,977,000 ($4,489,079) -8.72% Expense Category Proposed Change From Adopted Percent Actual Estimated Budget Budget Budget Change Operations and Maintenance Administration, Engineering & Commission $2,996,226 $3,453,000 $3,668,867 $3,901,000 $232, % User Charge & PreTreatment Program 473, , , , , % Wastewater Collection 2,034,700 2,100,000 2,273,971 2,334,000 60, % Wastewater Treatment 9,837,817 10,217,000 10,103,313 10,710, , % Effluent Diversion 96, , , ,000 5, % Metrogro Biosolids Reuse Program 1,367,082 1,545,000 1,585,584 1,516,000 (69,584) -4.39% Capital Outlay 265, , , ,000 (272,704) % Servicing Pumping Stations Owned by Others 246, , , ,000 13, % Contribution to Equipment Replacement Fund ,000 75,000 NMF Transfer to Debt Service Fund 10,865,000 11,843,000 11,843,000 12,909,000 1,066, % Total Operations and Maintenance Expenditures $28,182,250 $30,683,000 $30,883,079 $32,822,000 $1,938, % Capital Projects Nine Springs WWTP Projects $3,715,416 $11,092,000 $11,055,000 $3,209,000 ($7,846,000) % Interceptors 1,255, ,000 2,587,000 3,131, , % Pumping Stations and Force Mains 21,378,046 8,818,000 6,527,000 8,094,000 1,567, % Capital Budget Expenses 395, , , , , % Total Capital Projects Expenditures $26,744,265 $20,735,000 $20,439,000 $14,949,000 ($5,490,000) % Debt Service Principal Payments $5,568,912 $8,947,000 $9,086,000 $9,012,000 ($74,000) -0.81% Interest Payments 3,061,928 3,416,000 3,624,000 3,704,000 80, % Total Debt Service Expenditures $8,630,840 $12,363,000 $12,710,000 $12,716,000 $6, % Total Expenditures (net of transfers and reserves) $52,692,354 $51,938,000 $52,189,079 $47,503,000 ($4,686,079) -8.98% NMF = No Meaningful Figure Note: All projected values are rounded to the nearest $1,
16 Operating & Capital Project Budgets Combined Summary Table 5 ITEM OPERATIONS CAPITAL Sources of Funds Use of Funds Budgetary Basis of Accounting Basis for Expense Service Charges, Servicing Pump Stations, Struvite Fertilizer Sales, Reserve Funds, Interest and Other Income. Operating and Maintenance Expenses, Debt Service Actual revenues and expenses are recorded on a full accrual basis in accordance with Generally Accepted Accounting Principles. Revenues and expenses are budgeted on a full accrual basis, except capital outlays. These are budgeted as expense in the year incurred, but capitalized and depreciated for financial reporting purposes. Depreciation is not budgeted. Costs of operating and maintaining the sewerage system. Costs also include asset repair and replacement that is necessary to maintain the capacity and performance to meet the needs of the communities we serve, our regulatory requirements, and to protect the environment. Wisconsin Clean Water Fund Loans, Interceptor and Treatment Plant Connection Charges, Reserve Funds, and Interest. Project Expenses and All Other Capital Expenses For financial reporting, actual revenues and expenses are recorded on a full accrual basis in accordance with Generally Accepted Accounting Principles. Revenues are budgeted on a cash basis. Because the Capital Budget serves as a financing plan, it is important to plan when revenues are received rather than when they are earned. Expenses are budgeted according to what is projected to be completed for that particular year. Costs of acquiring, purchasing, planning, designing, construction, extending and improving all or any part of the sewerage system. 11
17 2016 Combined Summary of Revenues and Expenditures The District s 2016 combined budget totals approximately $47 million dollars. As seen in the following chart, the primary sources of revenue in the 2016 combined budgets are sewer service charges (67.0%) and clean water fund loans (28.0%). $35, Combined Summary of Revenue Table 6 $30,000 $25,000 $20,000 $15,000 $10,000 $5,000 $0 Sewer Service Charge Clean Water Fund Loans All Other Revenue On the expenditure side, the capital budget comprises (31.0%) of the 2016 combined budget while operations and maintenance of the District facilities (net of debt service) totals (42.0%). Debt service is (27.0%) of 2016 expenditures. $25, Combined Summary of Expenditures Table 7 $20,000 $15,000 $10,000 $5,000 $0 Net O&M Expenses Capital Projects Debt Service 12
18 SECTION 2 Operating Budget Summary Overview Table 8 summarizes the District s operating expenditures, revenues, and operating reserves for the years 2014 through The 2016 Operating Budget includes a 6.28% increase ($1.9 million) in expenses over the current year s budget and will require an 7.9% increase ($2.3 million) in service charge revenues. The larger increase in service charges is due to the use of cash reserves in the 2015 budget. Staff projects 2015 revenues to be $740,000 less than budgeted with 2015 expenses $200,000 less than budgeted. Operating budget reserves are projected to decrease by $1.1 million in The expected operating reserves at the end of this year are $13.0 million Revenues Staff estimates 2015 revenues will be approximately $740,000 or 2.4% less than budgeted. This is due to revenues from estimated service charges being $900,000 or 3.1% less than budgeted, septage disposal fees $30,000 more than budgeted, miscellaneous income $25,000 more than budgeted, and revenue from struvite fertilizer sales being $30,000 less than budgeted. A gradual spring snowmelt, lack of intense storms, and slightly lower than normal precipitation for the first half of the year has resulted in lower than anticipated wastewater flows. Pollutant loadings for biochemical oxygen demand and total suspended solids are also below the budgeted values. A significant factor in the decreased loadings for biochemical oxygen demand and total suspended solids is the unexpected loss in late 2014 of a significant industrial contributor. Struvite fertilizer sales are estimated to be $30,000 less than budgeted because of lower than expected struvite production. Income from servicing pumping stations is estimated to be $118,000 more than budgeted due to significantly higher than expected levels of required maintenance for pumping stations owned by others. Miscellaneous income is estimated to be $25,000 more than budgeted, largely due to higher than budgeted billings for lab services provided to others. Septage revenues are estimated to be $30,000 higher than budgeted due to a series of one-time revenues from an industry. Interest on investments, annexation and plan review fees, and rent revenue are all essentially on budget Expenditures The District anticipates expenditures for 2015 to be $200,000, or 0.6%, less than budgeted. Amounts under budget for administration and engineering ($216,000), wastewater collection ($174,000), and the Metrogro program ($40,000) offset amounts over budget for wastewater treatment ($114,000), and servicing pumping stations owned by others ($118,000). The expenses for servicing pumping stations owned by others are offset by the revenue collected for that service. 13
19 Operating Budget Table 8 Revenues Percent REVENUE CATEGORY Actual Thru June Estimated Total Budget Budget Change Sewer Service Charges $27,900,206 $14,004,523 $28,372,000 $29,272,449 31,590, % Servicing Pumping Stations 242, , , , , % Rent 68,418 36,956 70,000 69,630 71, % Interest 12,593 7,387 12,000 12,000 13, % Annexation and Plan Review Fees 42,500 36,200 67,000 50,000 65, % Miscellaneous Income 116,607 38,095 70,000 45,000 55, % Septage Disposal Revenue 448, , , , , % Pretreatment Monitoring 20,590-18,000 18,000 18, % Struvite Fertilizer Sales 144,717 55, , , , % Cash Reserves - 604, , % TOTAL REVENUES $28,997,411 $14,509,925 $29,539,000 $30,883,079 32,822, % Expenditures Percent EXPENSE CATEGORY Actual Thru June Estimated Total Budget Budget Change Administration, Engineering & Commission $2,996,226 $1,657,128 3,453,000 3,668,867 3,901, % User Charge & PreTreatment Program 473, , , , , % Wastewater Collection 2,034,700 $803,710 2,100,000 2,273,971 2,334, % Wastewater Treatment 9,837,817 4,705,790 10,217,000 10,103,313 10,710, % Effluent Diversion 96,163 $41, , , , % Metrogro Biosolids Reuse Program 1,367, ,660 1,545,000 1,585,584 1,516, % Capital Outlay 265,473 $129, , , , % Servicing Pumping Stations Owned by Others 246, , , , , % Contribution to Equipment Replacement Fund ,000 NMF Transfer to Debt Service Fund 10,865,000-11,843,000 11,843,000 12,909, % TOTAL EXPENDITURES $28,182,250 $8,233,462 $30,683,000 $30,883,079 32,822, % Operating Fund Balance Percent OPERATING FUND BALANCE Actual Thru June Estimated Total Budget Budget Change Beginning Balance $13,292,601 $14,107,762 $14,107,762 $13,460,379 $12,964, % Total Revenues less Cash Reserves Used $28,997,411 $14,509,925 $29,539,000 $30,279,079 $32,642, % Total Expenditures less contributions to ERF 28,182,250 8,233,462 30,683,000 30,883,079 32,747, % Ending Balance $14,107,762 $20,384,225 $12,964,000 $12,856,379 $12,859, % Note: All projected values are rounded to the nearest $1,000. NMF = No Meaningful Figure 2016 Revenues The budgeted revenues for 2016 are 6.28% greater than the budget for 2015 and 11.1% greater than the estimated 2015 revenues. Required service charge revenues will increase $2,318,000 (7.9%) over the 2015 budgeted amount and $3,218,000 over the estimated 2015 revenues. Revenues from struvite fertilizer sales are estimated to decrease by $25,000 compared to 2015 budgeted revenues due to lower than expected struvite production. Revenues from servicing pump stations are expected to increase by $13,000. Revenues from septage disposal are expected to increase by $30,000. Staff expects interest rates to remain low and interest income to increase slightly by $1,000 to $13,000. Plan review and annexation fees are projected to increase by $15,
20 2016 Expenditures The budgeted expenditures of $32.8 million are $1.9 million, 6.28%, more than the budget for Total operating budget personnel services related costs (salaries, benefits, payroll taxes, etc.) increase by $605,000, 6.5%, to $9.97 million. Non-personnel related costs increase by $1.33 million, 6.2%, to $22.9 million. The personnel services increase is due to the following factors: Market adjustment of 2.0% on January 1, 2016 for employees. Step and/or longevity increases for hourly employees. Performance increase for salaried employees. A $233,000 transfer in salary and benefits costs to the Operating Budget because of reduced construction activity at NSWTP. Net addition of one full-time equivalent position starting in October 2016 total salary and benefits cost of $27,090 ($112,500 full year amount). A 5% increase in health insurance rates. Significant non-personnel related operating expenditure changes include: Increase in Clean Water Fund debt service expenses $1,066,000. Increase in funding for chloride source reduction initiative $200,000. Contribution to the Equipment Replacement Fund $75,000. See Department Information on page 44 for more detail on departmental budgets. Operating Fund Balance The Operating Fund balance is projected to decrease by 0.8% or $105,000 in 2016 compared to the estimated 2015 ending balance. This decrease is due to the contribution of $75,000 to the Equipment Replacement Fund and the use of $180,000 of operating reserves. The District expects the actual Operating Fund 2015 ending balance to decrease $1.1 million over the 2014 ending balance. The decrease is due to lower than budgeted revenues and the budgeted use of $604,000 in reserve funds. The District s 2015 Operating Fund ending balance includes the District s Equipment Replacement Fund of $3,000,000 and unrestricted operating reserves. The projected Operating Fund balance at the end of 2016 of $12.9 million includes an Equipment Replacement Fund balance of $3,075,000 and unrestricted operating reserves of 180 days operating expenses and meets the District s target end-of-year minimum balance of 180 days operating expenses. Operating expenses for this purpose are defined as the Operating Budget expenditure total less the debt service expenditures and contributions to reserves. 15
21 Impacts of Capital Investments on the Operating Budget The District s capital investments have a major effect on the District s operating budget. The largest effect is from debt service expenses. Debt service accounts for 39.3% of the proposed operating budget expenditures in 2016 and accounted for 38.3% of budgeted expenditures in The $1.07 million increase in debt service in the 2016 budget is 55% of the total increase in expenditures of $1.94 million. The District s 2016 Capital Improvements Plan includes increases of 9.0% in debt service expenses raised through service charges for 2016 and This increase in debt service by itself will drive an annual increase in total operating budget expenditures of at least $1.2 million per year over the next 2 years. The District also funds some smaller capital investments in the capital outlay line item of the operating budget. The 2016 proposed operating budget includes $275,000 of capital outlay items, or 0.8% of total operating expenditures. Capital outlay items were budgeted at $548,000 or 1.8% of total operating expenditures in Operating Budget Planning The primary driver for operating budget increases in the last several years has been increases in debt service to support the District s capital improvements program. The last five budgets covering the years 2012 through 2016 have seen operating budget increases for debt service varying form from 9% to 12%. The increase for all other operating budget expenditures varied from 1.4% to 6.3%. Over the same years the overall increases in operating budget expenditures have ranged from 4.9% to 7.5%. Debt service costs in the operating budget are expected to increase by 9% in 2017, 5.5% in 2018, and 5.5% in If other operating budget expenditures increase between 3% and 6% annually then the overall operating expenditures would increase between 5.4% and 7.2% in 2017, and 4.0% and 5.8% in 2018 and The District has committed to developing a more detailed operating budget plan covering a three to five year period. The District currently has a good long-range budget forecast for its capital projects but has no comparable plan for its operating expenses. Projecting operating expenses over a five year period is a key element in the development of a multi-year operating budget forecast. The goal for 2016 is to develop a planning process and budget planning principles to guide the planning work. The goal for 2017 is to develop a more detailed operating budget plan covering 3 to 5 years in time to inform development of the fiscal year 2018 budget. A multi-year plan will better integrate in a proactive manner the strategic plan, new initiatives, and existing programs and activities into our annual budgeting work Service Charge Rates The District service charge rates depend on the budget and the predicted pollutant loadings for the coming year. The budget sets the service charge revenues required to cover expenses. Loadings to the treatment plant are estimated from recent loadings history. The service charge rates are determined by dividing the required service charge revenues by the loadings expected to be received at the treatment plant. Rate = (Required Revenue)/Loading 16 Rate = (Required Revenue)/Loading
22 The District has seven billing parameters: five wastewater parameters and two customer parameters. District expenses are allocated to these seven parameters and rates are determined for each parameter. The District therefore has seven rates that we use to determine billings to our customer communities. More details about the District s rate structure can be found in our Sewer Use Ordinance at The last year has shown lower loadings than what was estimated in the 2015 budget. The loss of a significant industrial contributor in late 2014 and lower than normal precipitation contributed to this decline. The decrease in flows and loadings will lead to an increase in service charge rates that is greater than the percentage increase in service charges. As loadings decrease, rates will increase even if expenses stay the same. Overall service charge rates for 2016 are therefore expected to increase more than the 7.9% increase in service charges. The service charge rate determinations are made in October after the third quarter service charge billings are completed. Revenue Categories Sewer Service Charges This category covers charges paid by the District s customer communities for the wastewater conveyance and treatment services provided by the District. Customer communities pay these charges according to the volume and strength of the wastewater they discharge to the District. These charges are the primary revenue source for the District. The District currently serves five cities, seven villages, and 23 sanitary or utility districts. Servicing Pumping Stations This category covers charges to various customer communities for District services to operate and maintain pumping stations owned by the communities. The District currently services 45 pumping stations owned by others. The station owner and the number of stations served as of August 31, 2015 are shown below: Owner City of Madison City of Verona Village of Maple Bluff Town of Dunn Sanitary District No. 1 Town of Dunn Sanitary District No. 3 Town of Madison Dane County Lake Farm Park Number of Pumping Stations
23 Rent This category covers rent the District receives for use of District-owned property. The District rents three houses, one set of farm buildings including a house, barn, sheds, and associated acreage, 157 acres of farmland, and land for an electrical substation. Interest This category covers interest earned on the District s cash reserves. Annexation & Plan Review Fees This category covers District expenses for the annexation process and sewer plan review and approval processes. Customer communities pay annexation fees when new lands are added to the District. Customer communities pay sewer plan review fees for modifications or additions to their sewer systems. Miscellaneous Income This category covers income received for various revenues that do not fit in other categories. For instance, the income from the sale of scrap materials and income for laboratory services performed for others are placed in this category. Septage Disposal Income This category covers income received for wastes delivered by truck to the Nine Springs Wastewater Treatment Plant. The largest single source of waste delivered by truck is septage from homes and businesses on septic systems. Twenty-nine haulers have permits to discharge at the treatment plant as of August 31, Pretreatment Monitoring This category covers the District s expenses for industrial monitoring. The fees are paid by businesses that are required to have industrial treatment permits issued by the District. Twenty-one businesses have industrial discharge permits issued by the District as of August 31, Struvite Fertilizer Sales This category covers the income from the sale of struvite fertilizer pellets. In 2014, the District began operating a process to recover phosphorus from the wastewater treated at the Nine Springs Wastewater Treatment Plant. The process recovers phosphorus in the form of struvite pellets, which is sold as a fertilizer. Cash Reserves This category covers funds used from our cash reserves. 18
24 Expenditure Categories Administration, Engineering & Commission This cost center includes Accounting, Information Systems, Resource Team, Engineering, the Chief Engineer s office, HR/Safety, and Ecosystem Services: Accounting: Provides general accounting, payroll, grants and loan administration. Information Systems: Ensures data integrity, optimal network functionality, and provides hardware, software and user support. IS also provides technological expertise to District staff. Resource Team: Provides District-wide communications and administrative support. Engineering: Oversees engineering, design and construction of projects within the District s capital improvement plan and the planning for the District s long-term and asset management needs. Chief Engineer and Director: Provides organizational leadership to the District. Oversees communication and public information, coordinates District strategic efforts, and oversees overall District performance and general administration of District business. Human Resources/Safety: Provides opportunities for growth of the organizational culture and performance. Provides cost effective employee management services for recruitment, safety, and leadership development while minimizing the District s liability in employment matters. Ecosystem Services: Oversees a wide range of regulatory, legislative, environmental and strategic initiatives that impact District operations and/or help establish overall District focus. User Charge & Pretreatment Program This cost center implements state and federal requirements directed towards industrial users and implements strategies for pollution prevention and source control. In addition, this cost center includes wastewater flow and loadings data sampling and analysis for customer billing. Wastewater Collection This cost center provides funding to operate and maintain the District s gravity sewers, pumping stations, and raw wastewater force mains. The District operated and maintained 95 miles of gravity sewer, 18 pumping stations and 32 miles of raw wastewater force mains as of August 31, Wastewater Treatment This cost center includes funding to operate and maintain the Nine Springs Wastewater Treatment Plant. This plant treats about 40 million gallons of wastewater per day from our customer communities and districts. The plant treats wastes from 35 customer communities and accepts septage from 29 permitted haulers as of August 31,
25 Effluent Diversion This cost center includes operations and maintenance for the District s 15 miles of force mains that discharge treated effluent to Badfish Creek and the Badger Mill Creek. The cost center also includes monitoring to determine the impact on receiving streams. Metrogro Biosolids Reuse Program This cost center recycles biosolids to agricultural land through the Metrogro program. Capital Outlay This cost center funds asset purchases such as vehicles and equipment. Service Pumping Stations Owned by Others This cost center funds activities to operate and maintain on a contract basis local pumping stations owned by other cities and districts. The District operated and maintained forty-five such pumping stations as of August 31, Transfer to Debt Service This cost center pays the annual debt service on the District s long-term debt. Personnel As of January 1, 2016 the District s workforce will no longer be comprised of two categories of employees: a) represented and b) management and non-represented. The previously unionized employees represented by Wisconsin Council 40, Local 60, AFSCME, AFL-CIO did not recertify. The labor agreement with represented employees expired on December 31, All District employees are now non-represented and are covered by an employee handbook, not a labor agreement. This change resulted in little to no change in benefits and working conditions for employees. Table 9 shows changes in the District s overall staffing from One FTE position is added in 2016, the Adaptive Management Coordinator (Ecosystem Services). Other changes noted are to better position the District for the future. For more information please refer to Appendix G. Full-Time Equivalent Positions (FTE) Table 9 Department Changes for 2016 Administration Purchasing moves from Operations to Admin Chief Engineer No Changes Ecosystem Services New FTE & 5 FTEs from Operations (Resource Recovery) Engineering FTEs from Engineering to Planning Operations FTEs moved to Admin, Ecosystem Services, and Planning Planning Staff from Operations & Engineering to form new Dept. Totals Note: Positions updated through the end of 2016
26 Organizational Chart (as of the end of 2016) 2016 Madison Metropolitan Sewerage District Organizational Chart Assistant Chief Engineer & Director of Administration Comptroller/Budget Manager Staff Includes: Accounting Clerk Business Analyst Staff Accountant Information Systems Manager Staff Includes: 2 Network Technicians 2 Programmers Executive Coordinator Staff Includes: Program Resource Associate Resource Team Assistant Purchasing Manager Staff Includes: Purchasing/Inventory Assistant Director of Engineering Staff Includes: 4 Civil Engineers Electrical Construction Manager Electrical Engineer Commissioners Director of Ecosystem Services Staff Includes: Adaptive Management Coordinator Environmental Specialist Pollution Prevention Specialist Pretreatment Coordinator Chief Engineer & Director Lab Manager Staff Includes: 5 Chemists Microbiologist Resource Recovery Manager Staff Includes: Field Operations Team Lead 2 Diesel Truck Drivers 1 Mechanic Human Resources Manager Staff Includes: Health & Safety Specialist Director of Operations & Maintenance Operations Manager Staff Includes: Assistant Operations Engineer PCS Programmer Process & Research Engineer Regulatory Engineer Operations Supervisor Staff Includes: Lead Operator 4-12 Hour Operators 4 Relief Operators Maintenance & Reliability Manager Building & Grounds Supervisor Staff Includes: 1 Custodian 8 Maintenance Workers Collection System Supervisor Staff Includes: 4 Monitoring Services/ Sewer Maintenance Workers Electrical Maintenance Supervisor Staff Includes: 8 Electricians Capital Planning Engineer Staff Includes: Engineering Technician Mechanical Maintenance Supervisor Staff Includes: 8 Mechanics 1 HVAC Technician Director of Planning GIS Technician Sustainable Infrastructure Manager Staff Includes: Asset Information Specialist 21
27 SECTION 3 22 Capital Improvements Plan & Budget Introduction The District s Capital Improvements Plan (CIP) represents the foreseen major capital projects for the next six years and, in some cases, beyond. The projects included represent the best estimate of what might happen over the next six-year period. Staff updates this plan on an annual basis using the latest information and estimates available while integrating the District s current financial situation. As a planning document, one of the main purposes of the District s CIP is to set the stage for development of the next year s Capital Projects Fund Budget (also known as the Capital Budget or Capital Projects Budget). Therefore, the CIP includes the proposed projects for the next sixyear period, with approximate costs and timeframes for planning, design, and construction. The proposed 2016 Capital Budget is based on the CIP, the status of ongoing and pending projects, and the District s current financial situation. The Capital Budget shows past actual revenues and expenditures through 2014, anticipated revenues and expenditures through the remainder of 2015, and projected revenues and expenditures for In addition, the Capital Budget includes anticipated total project expenditures for projects underway and those that will be approved prior to the end of Projects in the CIP that will begin after 2016 will require approval in subsequent budgets; approval of the Capital Budget on an annual basis provides a means to reauthorize funding for ongoing projects. The present revenues and expenditures information and total project costs typically change somewhat between the development of the draft CIP (the Draft 2016 Capital Improvements Plan was published on June 25, 2015) and the completion of the budget process. The District takes a conservative approach to budgeting and anticipates project spending as early and often. This typically means that subsequent projections show less spending in the near term and more spending later. Additionally, estimates are updated to reflect the most recent best estimate, which can be less or more than previously anticipated. Appendix A includes brief project summaries for projects within the six-year timeframe. Appendix B provides a short summary of completed projects and retainers. Business case summaries highlighting the need for each new project are available on the District s website through the Draft 2016 Capital Improvements Plan. The business case summaries will be updated following budget approval and published as a separate supplement to the adopted budget. For near-term projects, the project s anticipated financing mechanism has been identified with any resulting debt or debt service included in the debt service projection. Beyond three years into the future, the funding mechanism for each project is uncertain; however, many of the projects, especially larger projects, will require funding, most often through the use of a Clean Water Fund loan.
28 Overview and Highlights For 2016, the Capital Improvements Plan (CIP) anticipates total funds received (identified as revenues) of $14.3 million, expenditures of $14.9 million, and a projected 2016 year-end operating reserve of $7.4 million. The plan predicts that the District will incur additional debt of $13.2 million from construction activities during 2016, and that debt service revenue collected in rates will increase from $11,843,000 to $12,909,000. This level of increase, $1,066,000 (9%), is necessary to continue addressing debt service related to the Eleventh Addition ($48 million) and projects related to Pumping Station 18 ($32 million), in addition to other projects for which the District has incurred debt. Major construction activities through 2016 include: Completion and startup of Pumping Station 18 and its force main. Completion of the Process Control System Upgrade. A new Maintenance Facility and other space needs improvements at the Nine Springs Wastewater Treatment Plant. Rehabilitations of the District s Pumping Stations 11, 12, and 15. Construction of a new interceptor extension near Morse Pond. Relief of the District s Rimrock Interceptor. Lining projects on the Northeast, West, and Northend Interceptors. Relocation of a portion of the Pumping Station 12 Force Main to accommodate major road reconstruction at Verona Road. Lesser activities include potential improvements at the Struvite Harvesting Facility, minor improvements at Pumping Station 7, coating of thickener tanks, and pavement replacement. In addition, 2016 will bring further planning related to the District s Energy Study, and facility planning efforts related to addressing the Nine Springs Wastewater Treatment Plant s aeration systems, peak capacity, UV System, and Headworks Facility. Planning and design will also begin on a relief force main for Pumping Station 17, another portion of the Lower Badger Mill Creek Interceptor, and a potential addition to the District s Biosolids End Use Facility. In addition to the projects listed above, staff anticipates numerous other projects will develop during the years 2017 through 2021, and beyond. Table 11 highlights some of these projects in a six-year projection of anticipated capital expenditures. A summary of each of the projects in the six-year capital plan is included in Appendix A. Table 10 summarizes the District s 2016 Capital Budget showing actual results from 2014, ongoing information related to 2015, and expected 2016 activities. The anticipated Capital Projects Fund cash flow for 2016 to 2021 is included in Table 12. The plan s impact on the District s debt and debt service is summarized in Tables 13 through Table 15 in the next section (Section 4 Debt Service). Charts 1 to 3 and subsequent discussion, also in Section 4 on Debt Service, provide a more long term view on debt and potential scenarios that might drive debt. 23
29 The Future Debt Service Scenarios section of this document (see Section 4 Debt Service) includes several scenarios for comparison. The scenarios include significant costs for plant additions related to nutrient removal. Staff expects that the District s pending discharge permit (Fall 2015) will include language related to reducing additional amounts of phosphorus in the Plant s effluent. In addition, nitrogen will become a more significant issue, and stricter regulations will be included in the District s permit. Although unlikely, this could happen as early as In anticipation of these potential changes to our permit, District staff have included two scenarios that show the potential effects of these additional nutrient regulations on the District s long-term debt and finances. Other changes to the District s permit requirements will likely include thermal regulations and more stringent chloride restrictions. At this time, staff anticipates that the financial impact of these two items on the District s capital improvement plan will be minimal; however, the actual effects remain uncertain. The 2016 CIP forecasts annual increases in debt service of 9% through 2017, at which time the increase in debt service falls to 5.5% for two years, and then falls to 3.5% in 2020 and beyond. The anticipated 9% increase through 2017 is primarily due to the construction of the Eleventh Addition and the construction of Pumping Station 18 and its force main. Rather than a one-time, large increase, the District implemented multiple-year, yet still largerthan-normal, increases in debt service to address the debt impacts of the new facilities. In addition, several other trends continue to drive higher levels of construction and incurrence of debt. These include: The need to replace or refurbish aging facilities, many of which the District constructed around the same time. The need for more capacity in certain parts of the District s system due to long-term growth. Lower amounts of connection charge revenues and interest over the past several years. While connection charge revenues have rebounded from their low point, interest on capital continues to remain at historic lows. District staff cannot anticipate all projects that may become necessary in the future. However, staff believes that the District s asset management efforts, which include plant asset management planning and collection system facilities planning, coupled with annual capital improvements planning, reasonably anticipate most necessary major expenditures and reflect good long-term planning. Planning efforts continue throughout the year, not just while formulating the budget, with a process that is ongoing and constantly evolving. Staff updates its formal plans annually for presentation to the District s Commission and to the general public. In addition, plans, schedules, and corresponding estimates change throughout the year to reflect the most recent information available. 24
30 2016 Capital Projects Budget Summary Table 10 provides a summary of the Capital Budget for years 2014 through For 2014, the summary shows the actual year-end totals for revenue and expenses for each project. For the current year, 2015, the summary shows the budgeted amount, the actual revenue and expenses through June, and the estimated year-end totals. For 2016, the summary shows anticipated revenues and expenditures. Please note that estimates are rounded to the nearest thousand dollars Summary 2014 revenues of $27.1 million exceeded 2014 expenditures of $26.7 million, leaving an end-ofyear balance of $7.02 million. Revenues included clean water fund loan proceeds of $25.5 million, connection charge revenues of $1.64 million, and $28,000 of investment income. Expenditures included $3.7 million in treatment plant project expenses, $1.3 million in interceptor project expenses, $21.4 million in pumping stations and force mains projects expenses, and $395,000 in capital budget expenses Summary The 2015 Capital Budget showed 2015 revenues exceeding expenditures by $0.7 million; we now anticipate that revenues will exceed expenditures by $1.0 million. The year-end fund balance will be $8.0 million, which is greater than the budgeted $6.8 million. One of the main reasons for this is greater-than-anticipated connection charge revenues for Most of the remaining difference can be attributed to slightly later construction starts than originally anticipated for some projects. For Clean Water Fund loan projects, the District pays for planning and design from reserves until projects have been bid and move into the construction phase. For larger projects, planning and design costs can be significant and at times in the future, short-term lending may be required to cover these costs until loans close after the bidding process. Another possible way to cover these costs would be to increase the amount that the District keeps in reserves. The District s minimum balance is presently set at $3 million, or 10% of the next year s total capital expenditures, whichever is greater. Presently, no changes in the reserve amount are contemplated, and the District s reserves are in good condition Revenues & Expenditures The proposed 2016 Capital Improvements Plan (CIP) anticipates revenues from all sources totaling $14.3 million and expenditures of $14.9 million. The resulting year-end fund balance of $7.4 million represents a fund balance decrease of $0.6 million below the estimated year-end balance for
31 26 Capital Projects Budget Table Proposed Percent Revenue Category 2014 Actual Thru June Estimated Total Budget 2016 Budget Change Loans $25,459,243 $6,087,195 $20,807,000 $20,218,000 $13,221, % CWF Loan - NEI - Far East Interceptor to Southeast Interceptor 262, NMF CWF Loan - Eleventh Addition 3,147, , , NMF CWF Loan - Process Control System Upgrades 951, ,350 1,037, , % CWF Loan - Pumping Station 18 10,233, ,450 1,447, , % CWF Loan - Pumping Station 18 FM 10,864, , , NMF CWF Loan - Maintenance Facility/Space Needs Improvements - 2,405,939 10,000,000 10,649,000 2,095, % CWF Loan - PS 11 & 12 Rehab - 2,135,583 7,000,000 6,323,000 3,643, % CWF Loan - West Int. - West Randall to Near PS 2 (lining project) - - 1,333,000 1,372, % CWF Loan - Rimrock Int. Replacement/Relief - 267, , , % CWF Loan - Pumping Station 15 Rehabilitation - - 2,985,000 NMF CWF Loan - PS 12 Force Main Relocation at Verona Road - 2,554,000 NMF Connection Charge Revenues $1,642,735 $253,468 $900,000 $900,000 $1,050, % Interest on Investments & Misc. Income $28,399 $18,307 $34,000 $34,000 $38, % Total Sources of Funds $ 27,130,377 $ 6,358,970 $21,741,000 $ 21,152,000 $ 14,309, % 2015 Proposed Percent Expense Category 2014 Actual Thru June Estimated Total Budget 2016 Budget Change Nine Springs WWTP $3,715,416 $2,974,113 $11,092,000 $11,055,000 $3,209, % Operations Building HVAC System Rehab 10, NMF Eleventh Addition 1,853,516 (16,811) - 20, % Engine Stacks and Oxidation Catalysts 61,731 18,459 19, NMF Process Control System Upgrade 936, , , , % New Maintenance Facility/Space Needs Improvements 615,281 2,616,039 9,800,000 9,785,000 1,633, % Plant Energy Projects 83, , , , % 2016 Liquid Processing Facilities Plan , , , % Struvite Harvesting Facility & W4 System Improvements ,000 NMF Metromix Facility Expansion ,000 NMF Capital City Recreational Trail Relocation at Vehicle Loading Bldg ,000 NMF Annual Clarifier Coating 154,779-70, , , % Annual Pavement Improvements ,000 30,000 53, % Metrogro Applicators - 150, , NMF Interceptors $1,255,320 $108,221 $476,000 $2,587,000 $3,131, % Lower Badger Mill Creek Int. - Phase NMF NEI - Far East Int. to Southeast Int. Junction - 4,898 24,000 20, % West Int. Extension and West Point Extension (lining project) 256,543-5,000 5, % NEI - Rehab West of Airport (lining project) - Phase I 985,286 68, ,000 13,000 10, % West Int. - West Randall to Near PS 2 (lining project) 9,138 7,970 50,000 1,288,000 1,313, % Rimrock Int. Replacement/Relief 4,003 25, , , , % NSVI-Morse Pond Extension - 1,867 25, , , % NSVI - Mineral Pt. Ext. - Relocation at CTH PD (see PS 12 FM)* , % Northend Int. - Sherman Avenue (lining project) - - 5,000 15, , % NEI - Rehab West of Airport (lining project) - Phase , % Lower Badger Mill Creek Int. - Phase ,000 NMF Pumping Stations and Force Mains $21,378,046 $2,960,578 $8,818,000 $6,527,000 $8,094, % PS 6 & 8 Maintenance Retainer 20, NMF PS 16 Ventilation Modifications , , % PS 18 Construction 10,302, , , ,000 20, % PS 18 Force Main Construction 10,721,015 42, ,000 35,000 30, % PS 11 & 12 Rehab 319,970 2,090,785 7,052,000 5,377,000 3,022, % PS 15 Rehab 13, , , ,000 2,421, % PS 7 Improvements - Phase 1 (deferred to Phase 2) , % PS 12 FM Relocation at Verona Rd. (renamed NSVI project)* 393 3,636 15,000-2,539,000 NMF PS 17 Force Main Relief - Phase ,000 62, % Capital Budget Expenses $395,483 $175,788 $349,000 $270,000 $515, % Capital Budget Expenses 174, , , , , % PS 14 Service Area I/I Study 186,539 16,282 18,000 5, % Chloride Study 34,257 56,158 66, NMF Total Expenditures $ 26,744,265 $ 6,218,700 $20,735,000 $ 20,439,000 $ 14,949, % Capital Projects Fund Balance 2015 Proposed Actual Thru June Estimated Total Budget Budget Beginning Balance $ 6,635,096 $ 7,021,208 $ 7,021,000 $ 6,039,000 $ 8,027, % Total Revenues 27,130,377 6,358,970 21,741,000 21,152,000 14,309, % Total Expenditures 26,744,265 6,218,700 20,735,000 20,439,000 14,949, % Ending Balance $ 7,021,208 $ 7,161,478 $ 8,027,000 $ 6,752,000 $ 7,387, % NMF = No Meaningful Figure Percent Change
32 As detailed in Table 10, anticipated 2016 revenues include $13.2 million in Clean Water Fund loan proceeds for the six projects listed below: New Maintenance Facility/Space Needs Improvements ($2.1 million) Pumping Stations 11 & 12 Rehabs ($3.6 million) West Interceptor West Randall to Near PS 2 - lining project ($1.4 million) Rimrock Interceptor Replacement/Relief ($0.6 million) Pumping Station 15 Rehab ($3.0 million) Pumping Station 12 Force Main Relocation at Verona Road ($2.5 million) Other anticipated revenues include $1,050,000 in interceptor and treatment plant connection charges (connection charge revenues), and $38,000 in interest on investments. Since its low point, we have begun to see significant increases in connection charge amounts, and we are optimistic that connection charge amounts will continue to increase slowly. Interest on investments continues to remain at historically low amounts, and we do not anticipate any significant changes in the near-term. Also detailed in Table 10, the highest expense items for 2016 include the following projects: Pumping Stations 11 & 12 Rehab second year construction ($3.0 million) Pumping Station 12 Force Main Relocation at Verona Road ($2.5 million) Pumping Station 15 Rehab first year construction ($2.4 million) New Maintenance Facility/Space Needs project completion ($1.6 million) West Interceptor West Randall to Near PS 2 - lining project ($1.3 million) Nine Springs Valley Interceptor Morse Pond Extension ($1.0 million) Other anticipated expenditures include an additional $2.5 million in other capital project expenditures as well as $515,000 in Capital Budget Expenses Capital Projects Fund Balance The 2016 Capital Projects Fund ending balance of $7,387,000 is projected to increase by 9.4%, or $635,000, compared to the budgeted 2015 ending balance of $6,752,000, and to decrease by 8.0%, or $640,000, compared to the present estimated 2015 ending balance of $8,027,000. The end-of-year Capital Projects Fund balance can vary significantly from year-to-year, depending upon the timing of project expenses and loan proceeds. District policy requires a minimum Capital Projects Fund balance (or reserve) of $3,000,000 or 10% of anticipated expenditures, whichever is greater. For 2016, the minimum acceptable beginning-of-year balance should be $3.0 million (10% of $14.9 million is less than $3 million). The projected 2016 end-of-year balance of $7.4 million is well above the minimum acceptable amount. 27
33 Six-Year Capital Projects Overview Included in the District s six-year Capital Improvements Plan (CIP) projection are projects currently underway that will continue into 2016, as well as future projects that will begin in the associated six-year period. During the planning process, District staff have identified these projects as higher priority needs. Drivers include addressing condition and capacity needs, as well as meeting other facility needs or regulatory requirements. Table 11 provides a summary of the Six-Year Capital Projects plan. The base scenario shows $98 million worth of expenditures over the six-year period from 2016 to 2021; representing projects whose costs total $179 million (see Totals Before Nutrient Removal Projects in Table 11). At the bottom of the summary, the two advanced nutrient removal scenarios speculate additional expenditures based upon constructing advanced phosphorous removal facilities or implementing adaptive management approaches. Note that both nutrient removal scenarios anticipate advanced nitrogen removal facilities as a requirement in the District s 2020 discharge permit. At this time, we are uncertain when more stringent nitrogen limits would require this additional level of treatment. For comparative purposes, the base alternative includes no advanced nutrient removal alternatives. A more thorough discussion of advanced nutrient removal scenarios occurs below, as well as in Section 4 on Debt Service. At this time, the District plans to continue moving forward with an adaptive management approach, transitioning from the adaptive management pilot project that began in 2013, to a full-scale adaptive management agreement over the next two years. The District expects more stringent nutrient regulations will be included with its permit renewal, anticipated fall 2015; the permit will also include adaptive management as an alternative pathway to compliance. Note that comparing advanced phosphorus removal facilities and adaptive management as if both were capital expenditures is somewhat inaccurate. Adaptive management is primarily a program cost, and will likely continue to appear in the District s operating budget, although capital costs and associated debt are possible. In addition, both types of advanced nutrient facilities have associated operations and maintenance costs, which would normally be included in the operating budget. However, reviewing the two approaches as capital expenditures provides the simplest means to compare them and to show the large order-of-magnitude difference in cost between advanced phosphorous removal facilities and adaptive management approaches. A more detailed analysis of the life cycle costs associated with nutrient removal is included in the Nutrient Removal Cost Study completed by CH2M Hill in 2011 to 2012, available from the District upon request. 28

34 Six-Year Capital Projects Summary Table 11 29
35 Master Plan Conformance As with the 2015 Capital Budget and Capital Improvements Plan, current projects assume conformance with Master Plan Alternative 1A or potentially, Alternative 1B or 1C, and relief of the Nine Springs Valley Interceptor and other related capacity relief projects. More information on the Master Plan can be found at In accordance with the District s Master Plan, Alternative 1 options (1A, 1B, 1C, or 1D) are centralized treatment options as opposed to Alternative 2 options, which would require construction of a satellite treatment plant in the Sugar River Basin. Alternative 1 options rely on continued pumping to the Nine Springs Wastewater Treatment Plant and returning effluent to the Sugar River Basin. Specifically, Alternative 1A maintains the present effluent flow of up to 3.6 million gallons per day to Badger Mill Creek, while Alternatives 1B or 1C would increase flows to match the amount of flow (as groundwater) taken out of the Sugar River Basin. Future regulations and decisions will help determine if either Alternative 1B or 1C is a feasible option. Alternative 1D, returning a portion of the effluent to the Upper Sugar River, was determined not to be viable. The Master Plan recommended periodic plan review and adjustment based upon signposts, key external factors, or trends which could alter the District s future path. Such a Master Plan review may occur in Project Summaries and Business Cases Summary descriptions for each of the projects in Table 11 are included in Appendix A. Projects are categorized as Nine Springs Wastewater Treatment Plant Projects, Interceptor Projects, or Pumping Station and Force Main Projects. Projects are identified using an alphanumeric identifier. Specific identifiers included in Table 11 will match those used in the appendices. Project IDs for Nine Springs Wastewater Treatment Plant projects all begin with the letter A, those for Interceptor projects begin with the letter B, and those for Pumping Station Projects begin with the letter C. Business case summaries for most projects have been included in the District s Draft Capital Improvements Plan published on June 25, 2015, and available on the District s website at Excluded are some of the projects already underway and routine annual expenditures. A supplemental document with updated business cases will be available following budget approval. Since some projects are closely connected or contingent upon other projects more than one project may be included in a single business case. Note that some business cases, and hence associated costs, are more developed than others. Where costs have not been fully developed, figures have been included as placeholders or allowances to identify the need. As with all projects, these costs will be modified as better estimates become available. 30
36 Capital Projects Budget Expenses Planning for the future ensures long-term quality service for the District s customers. The final category of expenditures in Table 11 is Capital Budget Expenses, letter D. These expenses typically include expenses related to planning and studies assessed against the capital fund, but which would be difficult to capitalize to a specific asset. The 2015 budget included $265,000 related to ongoing planning efforts in the collection system and at the treatment plant including, but not limited to, planning-level asset management expenses (note that anticipated 2015 and budgeted 2016 costs are shown in Table 10). Other potential expenses in this category include studies similar to the Nutrient Removal Cost Study. For 2015, other anticipated expenditures in this category include completion of the Pumping Station 14 Service Area Inflow and Infiltration Study and a chloride study aimed at identifying the costs associated with reducing the level of chlorides in the District s effluent. To meet the growing need for program support, we have increased funding levels for ongoing administration of projects related to the District s asset management program ($515,000 for 2016). Further details are included in the business case on the Asset Management Program (see the District s Draft 2016 CIP at the website mentioned in the previous section). At this time, no other specific studies or planning efforts have been identified. Increasing levels of funds are included annually for each year beyond 2016, anticipating the Asset Management Program as an annual inflation-adjusted expense. Capital Projects Cash Flow Summary Table 12 provides a summary of the District s construction account cash flow for the period 2016 to The table includes anticipated revenue and expenditures for this six-year period. Total revenues for the period are anticipated at $93.8 million, with total expenditures anticipated at $98.2 million, and an ending balance of $3.6 million. Further details related to revenues are provided below, while expenditures were discussed previously as part of the sixyear capital project summary for the District s CIP. The District s construction account includes revenues from three sources: 1. Loan proceeds, 2. Interceptor and treatment plant connection charges, 3. Interest received on account balances. During the six-year period, the projection anticipates funds from each of these sources as follows: $84.3 million from loan proceeds $9.1 million from collection of connection charges $0.4 million from interest 31
37 Capital Projects Cash Flow Summary Table Revenues Clean Water Fund Loans $13,221,000 $1,676,000 $7,829,000 $22,760,000 $28,617,000 $10,220,000 Connection Charges $1,050,000 $1,200,000 $1,400,000 $1,600,000 $1,800,000 $2,000,000 Interest Revenues $38,000 $55,000 $72,000 $71,000 $71,000 $71,000 Total Revenues $14,309,000 $2,931,000 $9,301,000 $24,431,000 $30,488,000 $12,291,000 Expenditures Nine Springs WWTP Projects $3,209,000 $2,011,000 $4,222,000 $15,936,000 $18,120,000 $4,561,000 Interceptors $3,131,000 $1,315,000 $2,507,000 $1,985,000 $3,148,000 $2,167,000 Pumping Stations and Force Mains $8,094,000 $2,741,000 $2,175,000 $5,948,000 $8,640,000 $4,966,000 Capital Budget Expenses $515,000 $530,000 $546,000 $563,000 $580,000 $597,000 Total Expenditures $14,949,000 $6,597,000 $9,450,000 $24,432,000 $30,488,000 $12,291,000 Capital Projects Fund Cash Flow Beginning Balance $8,027,000 $7,387,000 $3,721,000 $3,572,000 $3,571,000 $3,571,000 Total Revenues $14,309,000 $2,931,000 $9,301,000 $24,431,000 $30,488,000 $12,291,000 Total Expenditures $14,949,000 $6,597,000 $9,450,000 $24,432,000 $30,488,000 $12,291,000 Ending Balance $7,387,000 $3,721,000 $3,572,000 $3,571,000 $3,571,000 $3,571,000 Note: All projected values are rounded to the nearest $1,000. Wisconsin Clean Water Fund Program Although the District can, and may, fund future projects with general obligation bonds, staff anticipates continued use of the Wisconsin Clean Water Fund (CWF) Loan Program to fund most of our larger projects and to ensure adequate capital reserves to address any unforeseen capital costs. As of August 26, 2015, the District has borrowed $209 million from this program for the following projects: Modifications to Pumping Station No. 7 ($1.9 million) Eighth Addition to Nine Springs ($19.9 million) Replacement of Pumping Station No. 5 ($1.2 million) Verona Force Main and Pumping Station ($2.7 million) Ninth Addition to Nine Springs ($14.9 million) Badger Mill Creek Effluent Return Project ($4.7 million) Pumping Station No. 2 Force Main Replacement ($3.8 million) Rehabilitation of Pumping Stations 1, 2, & 10 ($8.0 million) Tenth Addition to Nine Springs ($35.4 million) Effluent Equalization/Aeration Tanks 1-6 Rehab ($1.7 million) WI Ext. Replacement/PS 13 & PS 14 Firm Capacity Improvements ($2.6 million) Rehabilitation of PS 6 & PS 8/NEI-Truax Ext. Liner ($8.4 million) 32
38 NEI-PS 10 to Lien Road & FEI-Cottage Grove Ext. Liner ($8.9 million) Operations Bldg. HVAC Rehab ($3.0 million borrowed and $0.3 million grant) Eleventh Addition ($47.5 million) NEI - FEI to SEI Junction ($8.0 million) NS Process Control System Upgrade ($3.9M thru 8/26/2015; up to $ 4.7M) Pumping Station 18 ($13.9M thru 8/26/2015; up to $14.7M) Pumping Station 18 Force Main ($11.2M thru 8/26/2015; up to $12.4M) Pumping Stations 11 & 12 Rehabs ($3.3M thru 8/26/2015; up to $10.6M) New Maintenance Facility/Space Improvements ($4.0M thru 8/26/2015; up to $12.1M) If facilities are required for phosphorous and/or nitrogen removal, in lieu of implementing an adaptive management approach or trading, the District will incur additional borrowing related to construction of these facilities, most likely from the CWF Loan program. This would represent significant additional borrowing, anticipated at $135 million and $78 million respectively. The District also anticipates the need for funding from the CWF for many of the following future projects: Rimrock Interceptor Replacement/Relief ($0.8 million in 2015 to 2016) West Interceptor West Randall to PS 2 Lining Project ($1.4 million in 2016) Pumping Station 15 Rehab ($4.7 million ) PS 12 Force Main Relocation at Verona Road ($2.6 million in 2016) PS 17 Force Main Relief - Phase 1 ($1.1 million in 2017 likely from reserves) Metromix Facility Expansion ($2.0 million in 2018) NEI - Truax Lining Project Phase 1 ($2.0 million in 2018) Pumping Station 10 Force Main Rehab ($0.9 million in 2018) Plant Peak Capacity Improvements ($4.3 million in ) Plant Aeration System Projects ($9.4 million in ) Plant Unit Substation Improvements ($2.9 million in 2019) Headworks Facility Rehab Project ($3.9 million in ) UV Disinfection System Replacement/Rehab ($5.2 million in ) NEI - FEI to SEI Junction Lining ($1.6 million in 2019) Pumping Stations 13 & 14 Rehabs ($12.5 million in ) Plant Energy Projects ($10.5 million in ) NEI - Truax Lining Project Phase 2 ($2.2 million in 2020) West Int. - Spring Street Relief Lining Project ($1.0 million in 2020) PS 4 Rehab ($4.3 million in ) NEI - Waunakee Extension Relief Phase 1 ($10.4 million in 2022) Pumping Station 7 Improvements ($2.9 million in ) Pumping Station 17 Capacity Upgrade ($2.5 million in 2022) West Int. Relief - Walnut Street to Whitney Way ($15.1 million in ) NEI - Truax Lining Project Phase 3 ($2.1 million in 2022) Pumping Station 17 Force Main Relief - Phase 2 ($2.5 million in 2022) 33
39 SECTION Debt Service Overview The District s Debt Service Budget supports the District s Capital Budget and Capital Improvements Plan (CIP). The District uses service charge revenues, as identified in the Operating Budget, to meet debt service obligations. By October 1 of each year, the District deposits sufficient funds from the Operating Budget into a designated Debt Service Fund to make principal and interest payments for the following year. Doing so allows the District to avoid levying a property tax to meet its debt service obligations. As part of a rate smoothing strategy, the District may deposit, in a particular year, more or less revenue in the Debt Service Fund than is needed to fund the following year s debt service Debt Service Budget Table 13 provides a summary of the 2014 through 2016 Debt Service Budget details. Funds transferred from the Operating Fund provide the primary revenue source. Each year for Clean Water Fund loans, the District pays principal payments on May 1 and interest payments on May 1 and November 1. The amount of debt service necessary to pay the May 2016 principal and interest and November 2016 interest is $12,716,000. The amount recovered through service charges in 2016 for debt service will be $12,909,000. The District will add $219,000 to its Debt Service Fund reserves for future debt service payments Debt Service Budget Table Proposed 2016 Percent Revenue Category 2014 Actual Thru June Estimated Total Budget Budget Change Transfer from Operating Fund $10,865,000 $0 $11,843,000 $11,843,000 $12,909, % Interest 35,654 21,825 37,000 35,000 26, % Total Revenues $10,900,654 $21,825 $11,880,000 $11,878,000 $12,935, % 2015 Proposed 2016 Percent Expense Category 2014 Actual Thru June Estimated Total Budget Budget Change First Half Interest $1,480,292 $1,724,816 $1,724,816 $1,794,000 $1,852, % Principal 5,568,912 8,947,401 8,947,401 9,086,000 9,012, % Second Half Interest 1,581,636-1,691,000 1,830,000 1,852, % Total Expenditures $8,630,840 $10,672,217 $12,363,000 $12,710,000 $12,716, % 2015 Proposed 2016 Percent Debt Service Fund Balance 2014 Actual Thru June Estimated Total Budget Budget Change Beginning Balance $16,082,767 $18,352,581 $18,352,581 $18,356,563 $17,870, % Total Revenues 10,900,654 21,825 11,880,000 11,878,000 12,935, % Total Expenditures 8,630,840 10,672,217 12,363,000 12,710,000 12,716, % Ending Balance $18,352,581 $7,702,189 $17,870,000 $17,524,563 $18,089, % Note: All projected values are rounded to the nearest $1,000.
40 2016 Debt Service Fund Balance The Debt Service Fund ending balance is projected to increase by 3.2% to $18.1 million in This amount is adequate to pay the required principal and interest payments on existing and anticipated Clean Water Fund loans. The budgeted debt service balance at the end of 2016 meets the District s policy requirement to maintain a balance sufficient to avoid levying a property tax to satisfy our debt service obligations. Six-Year Debt Service Summary and Debt Service Limit In Table 14, the bottom line shows the effect future loans will have on the District s principal amount of outstanding debt as of the first of each year 2016 through On January 1, 2016, anticipated District debt will be roughly $143 million while on January 1, 2021 it will be roughly $168 million. Although not shown in Table 14, the District s anticipated debt at the end of the planning period, December 31, 2021, will be roughly $166 million. Wisconsin Statutes set the District s legal debt limit at 5% of the equalized property valuation of the District. As of January 1, 2015, the equalized property valuation was $38.30 billion. Therefore, the District s legal debt limit as of January 1, 2015 was $1.92 billion. At the end of 2015, the District s debt of $143 million will be 7.5% of this limit. If the debt limit does not increase, the District s debt at the end of 2021 would be less than 9% of this limit. Although the District s debt has increased during 2015, and the equalized property valuation has not yet been updated for 2016, it is clear from the 2015 property valuation that the District s debt, though increasing, will not exceed its legal limit over the time-period shown in Table 14. However, local, regional, and national factors, such as EPA s affordability criterion for wastewater services set at 2% of median household income, can and will be considered before more debt is assumed. Six-Year Debt Service Summary Table Debt Service Payments $12,716,000 $13,284,000 $13,217,000 $13,898,000 $15,594,000 $17,400,000 Debt Service Collected in Rates Debt Service Requirements for Succeeding Year $13,284,000 $13,217,000 $13,898,000 $15,594,000 $17,400,000 $18,156,000 Additions to (use of) Debt Service Reserve $(375,000) $854,000 $947,000 $67,000 $(1,191,000) $(1,379,000) Debt Service Included in Service Charge Rates $12,909,000 $14,071,000 $14,845,000 $15,661,000 $16,209,000 $16,777, Principal Amt. of Outstanding Debt on Jan. 1 $ 142,900,000 $147,100,000 $139,300,000 $137,500,000 $150,100,000 $167,600,000 Note: All projected values are rounded to the nearest $1,
41 Table 14 also shows the resulting levels of debt service that will be collected and paid from service charge revenues during the period of 2016 to Debt service payments will increase from $12.7 million in 2016 to $17.4 million in The debt service requirements included in the District s rates will increase from $12.9 million in 2016 to $16.8 million in The debt service requirements collected each year are stabilized by collecting more or less than needed in a given year to smooth the levels of increases over time. Further discussion of this technique is provided later in the section on Debt Stabilization. Debt Service Impacts on Customers It is difficult to estimate service charge rates directly since they are affected by so many variables. The following general discussion is for comparison only, and does not reflect planned or potential rate increases, especially since rates and rate increases vary significantly by community. A debt service transfer rate increase of 9%, as is reflected in the proposed CIP, could mean increases of roughly $7 to $8 more per year for a typical District household. This increase would only be used for additional debt service, and would be in addition to any increase resulting from changes in general operating expenses. Thus, after two years of the annual 9% increases proposed through 2017, a typical household might pay an additional $15 more per year to cover the District s debt service. Assuming the base scenario, over the full six-year planning period ( ), the debt service transfer rate is anticipated to increase almost 42%, which is roughly 6% per year compounded. With that level of increase, a typical household in 2021 could expect to pay about $30 per year more than they do in 2015 to help service the District s debt. In general, the District s debt service impact on a typical household will increase by about $0.50 to $0.60 per million dollars of borrowed money per year. Thus, a new $10 million dollar project will increase a typical household s share of the District s debt service by $5 to $6 per year. Projects that do not require borrowed funds do not directly impact debt service and the debt service transfer rate; however, since those projects reduce the amount of reserve funds, they affect how soon, how often, and how much the District borrows, thereby indirectly affecting the level of debt service incurred. Potential debt service related to different phosphorous scenarios is discussed later under longterm planning and scenario assumptions. Debt Stabilization In 2004, the District transferred $1,515,000 above the amount necessary from the General Fund to the Debt Service Fund to satisfy the 2004 debt service requirements. Since 2005, those extra funds have been used strategically to smooth and limit annual increases in future debt service expenses raised through service charges. In 2005 and 2006, these funds were used to limit the increase to 2.0%. Due to projected increases in the cost of future collection system and 36
42 treatment plant projects, beginning in 2007, the annual increase was raised to 3.4% for the 2010 and 2011 budgets. Due to further projected increases in the cost of future collection system and treatment plant projects, including the Eleventh Addition, we projected annual increases of at least 4.8% in debt service expenses over an extended period would be necessary to fund the District s ongoing capital improvements. For 2012, a significant increase in projected debt service required the annual amount collected for debt service (the transfer rate) to increase to 12% and it appeared that similar increases would be required through However, since the Eleventh Addition project bid was close to $10 million less than anticipated for the 2012 budget, the required increase for debt service collection was decreased to 10% for 2013 and In 2015, the transfer rate was again reduced, this time to 9%, and we anticipate maintaining this level of increase through After 2017, the increases in the transfer rate taper back to 3.5%, after being at 5.5% for 2018 and However, this does not take into account increases that may be required for advanced phosphorous or nitrogen removal facilities, or any additional costs for trading or adaptive management approaches. A large portion of the increase over the 2015 projection continues to be associated with the anticipated additional debt service required for the Eleventh Addition, and for Pumping Station 18 and related projects. Should costs change significantly from those shown in the projection, next year s projection will be modified accordingly. The actual cash flows and costs for the projects in this summary will have significant impacts on the District s resulting debt service. Although, as with any projection, there is uncertainty regarding what actual project cash flows and costs will be. However, there is certainty that the Eleventh Addition and Pumping Station 18 projects increased the District s debt and that debt will continue to increase. Given the District s needs, funding projects through the use of debt instruments requires users to pay for those assets during a significant portion of the assets lives. Although growing, the importance of keeping ahead of the District s needs and subsequent debt service cannot be overstated; by keeping ahead of its pending debt, the District will help prevent more significant rate increases in future years. Thus, given the present outlook, we believe and recommend that maintaining the transfer growth rate at 9% through 2017 is appropriate and necessary. Current Debt Service Schedule Currently all debt is financed through the state of Wisconsin s Clean Water Fund program. The District makes principal payments on its long-term debt in May of each year, and interest payments in May and November of each year. Future principal and interest due on existing long-term debt incurred as of August 31, 2015 are approximately as shown in Table 15. Note that this does not include any debt that will be incurred beyond August 31,
43 38 Debt Service Payment Schedule Table 15 Years Ending December 31 Principal Interest Total ,378,000 3,297,000 11,675, ,600,000 3,072,000 11,672, ,498,000 2,845,000 11,343, ,723,000 2,618,000 11,341, ,136,000 9,561,000 52,697, ,043,000 4,697,000 38,740, ,636, ,000 20,509,000 Total $131,014,000 $26,963,000 $157,977,000 Note: All projected values are rounded to the nearest $1,000. Future Debt Service Scenarios The three charts following this section are intended to provide a better picture of what the District s long-term future debt service needs might look like based upon three different scenarios. The first scenario, the base scenario, includes the projects discussed in Section 3 and applies to the previous debt discussions earlier in this section. This scenario contains no provisions for any advanced nutrient removal facilities or adaptive management approaches. The second scenario includes provisions for both advanced phosphorous and advanced nitrogen removal facilities. The third scenario includes provisions for adaptive management approaches along with advanced nitrogen removal facilities. All charts show annual amounts collected through service charges and used to fund capital projects or pay debt service since Each chart also provides a forecast for the next twenty years which includes: 1. The level of funds that the District is required to deposit in a debt service reserve each year to satisfy the bond ordinances; and 1. Projected annual amounts the District will need to collect through service charges to address debt service. Note that to make an accurate comparison of alternatives, the amounts in scenarios 2 and 3 also include funds for adaptive management and new facility O&M costs. The projections for each scenario are speculative in nature and contain numerous assumptions, all subject to change. The intent is merely to provide a long-term view of what might happen. Scenario Assumptions All three scenario projections include known projects through 2021 and, in some cases, beyond. In addition, beginning in 2022, expenditures are included for projects that begin in 2021 or earlier, but run past the end of the projection, as well as assumed costs for certain undefined
44 projects. Assumed costs for undefined future projects are based on annual expenditures of $11 million (in 2013 dollars). That amount is adjusted for inflation for each year where it is included in the projection; inflation is assumed at 3% per year. These undefined items include longerrange projects that will result from future collection system and plant asset management planning, and ongoing interceptor and plant inspection and maintenance programs. Identification and prioritization of these projects will be addressed in future budgets as specific projects are defined. Rough costs for treatment plant additions associated with new phosphorous limits and potential nitrogen limits are based upon the District s Nutrient Removal Cost Study completed in 2011 through 2012 by CH2M Hill. Scenario 2 assumes the new limits for phosphorous would require the addition of chemical polishing and effluent filtration processes with associated capital costs estimated to be $135 million (future costs in ). Likewise, new tanks and processes associated with advanced nitrogen treatment (included in Scenarios 2 and 3) are assumed to be $78 million (future costs ). Adaptive management program costs (Scenario 3) are assumed at $405,000 per year starting in 2017 and escalating from there at 3% each year. Pilot study costs were $126,000 in 2013 and 2014, and will be $276,000 in Program costs of $326,000 are anticipated for 2016 as the program transitions from a pilot program to full-scale implementation. Actual costs could be more or less than these assumptions, and those differences will affect each scenario accordingly. Chart 1, Scenario 1, or the base scenario, shows debt service for anticipated projects, assuming no additional projects or debt for advanced nutrient removal. As discussed previously, transfer rate increases of 9% for 2016 to 2017 will be required to fund debt service associated with the Eleventh Addition and other near-term projects. In 2018 and 2019, the transfer rate decreases to 5.5%; and in 2020 and beyond, the transfer rate will be 3.5% or lower. Chart 2, Scenario 2, shows the effect of the debt and O&M costs for a $135 million plant expansion related to advanced phosphorous treatment. In this scenario, construction of such a facility is anticipated in 2023 and The chart also shows the impact of a $78 million Plant expansion related to advanced nitrogen treatment. For purposes of this scenario, construction of such a facility is anticipated in 2025 and Chart 3, Scenario 3, still includes the impact of a $78 million plant expansion related to advanced nitrogen treatment; however, in lieu of a plant expansion for advanced phosphorous treatment, the projection includes $126,000 per year for pilot study costs in 2013 and 2014, $276,000 in 2015, $326,000 in 2016, and $405,000 per year (escalating at 3% per year) starting in 2017 to address adaptive management needs. Most adaptive management costs would likely be additional operating expenses and not debt service obligations. On the chart, however, these expenses are represented the same as debt service as a simple means to show the significant differences of the alternatives. 39
45 Please note that success of an adaptive management approach does not directly increase the amount of funds available to the District for other purposes, it only means that the District would not incur the additional debt that would otherwise be required to construct advanced phosphorous treatment facilities. By comparison, the District s anticipated debt at the beginning of 2027 would increase to $394 million (Scenario 2) or roughly 46% more than its anticipated debt of $269 million (Scenario 3) without construction of such advanced phosphorous treatment facilities. The impact these facilities might have on rates is difficult to assess since so many variables affect rates. However, under the Plant expansion scenario, i.e., construction of advanced phosphorous treatment facilities and advanced nitrogen facilities, a typical resident in 2027 might pay $18 per month in debt service versus the $7 per month they now pay in In addition, they might pay an additional $4 more per month for O&M costs related to these facilities. Under the adaptive management approach, a resident in 2027 might pay $13 per month to cover debt service (which includes advanced nitrogen removal facilities) and an additional $0.20 per month for the District s adaptive management program costs. They might also expect to pay $2 more per month in O&M for the nitrogen removal facilities. While it is not possible to envision or project all possible scenarios, the intent of this analysis is to compare potential scenarios and provide our best analysis of the scope of projects we anticipate, as well as their relative timeframes, levels of cost, and the level of debt the District might incur. This analysis continually changes as better information becomes available. 40
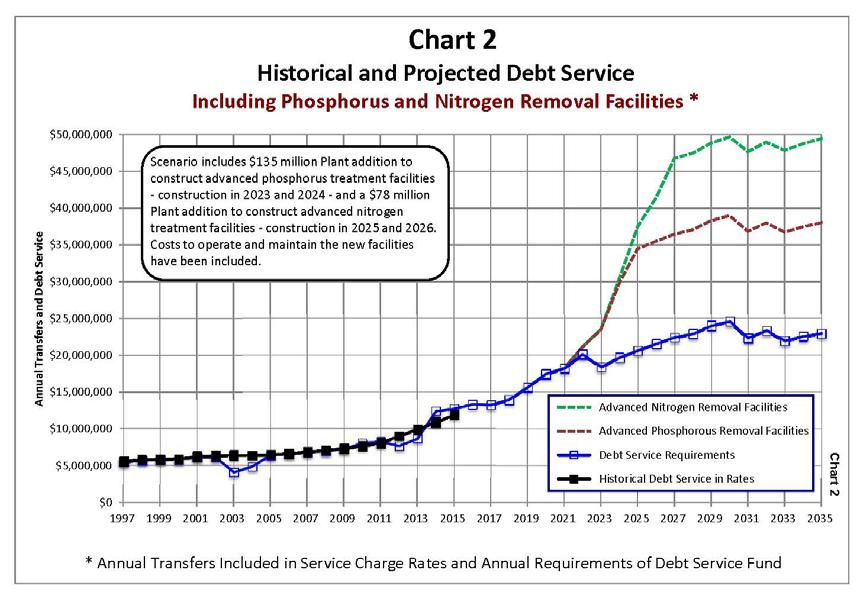
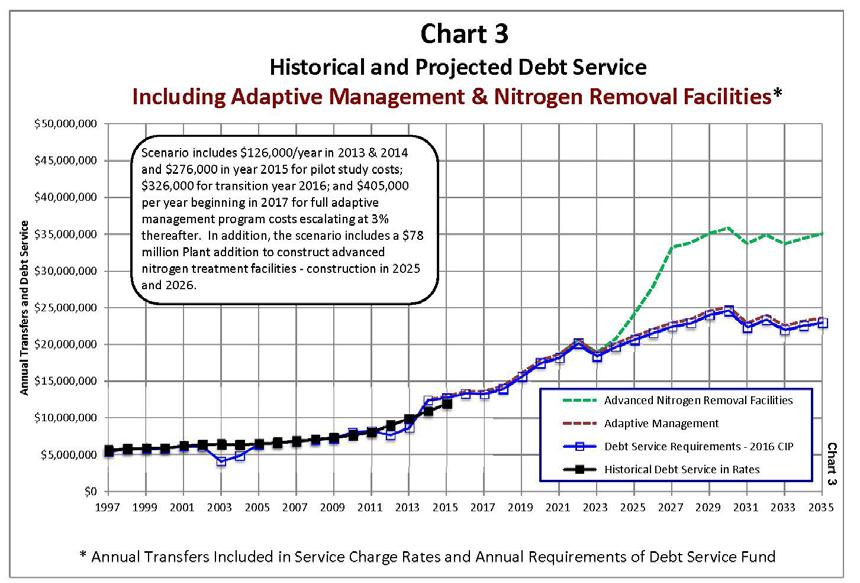
46 41
47 SECTION 5 Strategic Planning 42 Our Mission: To protect public health and the environment. Our Vision: Enriching life through clean water and resource recovery. Each year the District s Executive Team, working with department staff, review the 50 Year Master Plan, Commission priorities, and operational needs to develop a short-term operational strategy map. The strategy map brings needs together and is different than a plan, because it communicates an overarching strategic direction and allows the organization to creatively find solutions, coordinate activities, focus resources, and adapt to changing conditions. As a result of this work, programs, initiatives, and large scale activities are categorized to Key Result Areas as shown in Figure 1. Each Key Result Area represents a shared belief. We see opportunities in Wastewater to recover valuable resources. We see solutions in the Community to engage others in meeting future challenges. We see success in a healthy, resilient Workforce to promote a culture of positive engagement. We see value in Sustainable Infrastructure to support a vibrant regional community. These four shared beliefs help focus work and give direction; to help the District perform efficiently, cost-effectively, and with sound leadership and innovation. After a Key Result Area has been assigned to an initiative, the initiative is vetted through the Executive Team on a case by case basis. Business cases are written and reviewed for approval using a modified strengths, weaknesses, opportunities, and threats (SWOT) analysis called a Sustainable Action Map (SAM). The SAM integrates the concept of a SWOT analysis with sustainability measurements. These measurements include social, environmental, and financial performance measures. In addition, the SAM indicates level of risk with color coding, similar to a traffic light as shown in Figure 2. As business cases are approved, financial planning for necessary funding takes place and an annual assessment of department time commitments and priorities is reviewed and adjusted to meet the District s changing needs and environment. Strategic and financial planning occur simultaneously at the District so that there is a cohesive relationship between funding, initiatives, and priorities. Beginning in 2016, the Departmental Information section demonstrates how each department s goals and activities align within the Key Result Areas of the Strategic Plan. Figure 1, indicates the highest priority initiatives and programs from the Departmental Information goals and activities for the 2016 year.


48 Figure 1 Strategic Goals Diagram Figure 2 Sustainable Action Map 43
49 SECTION 6 Departmental Information The District is made up of five departments; The Office of the Chief Engineer and Director (CED), Engineering, Operations and Maintenance, Administrative Services, and Ecosystem Services. Each department has provided a narrative that gives a department description, identifies emerging trends, recaps the former year s goals and priorities, and establishes new goals and priorities including Key Result Measures seen in a chart for each department. In addition, a financial summary is provided for each department and a narrative section that identifies changes in key budget categories. Below is the overall Department Budget Summary. Department Adopted Budget Change Estimate Budget from 2015 Budget % from 2015 Budget CED 794, , ,561 87, % Admin 2,261,112 2,169,334 2,370, , % Engineering 971,335 1,073,541 1,160, , % Ecosystem Services 1,871,750 1,811,653 2,166, , % Operations & Maintenance 13,141,637 13,052,559 13,333, , % Debt Service 11,843,000 11,843,000 12,909,000 1,066, % Total 30,883,060 30,683,095 32,821,814 1,938, % Total without Debt Service 19,040,060 18,840,095 19,912, , % Major Expense Categories Asset Addition, Repair & Replacement 13,712,580 13,684,899 14,734,555 1,021, % Personnel Services 9,362,294 9,446,375 9,966, , % Contract Services 2,595,596 2,559,321 2,749, , % Materials, Supplies, and Misc. 5,212,590 4,992,500 5,371, , % Total 30,883,060 30,683,095 32,821,814 1,938, % 44
50 Chief Engineer and Director s Office Department Description The Chief Engineer and Director (CED) is hired by the Madison Metropolitan Sewerage District Commission and serves as the Chief Executive Officer. The CED provides organizational leadership on policy initiatives, while working with employees to fulfill the mission and longterm plans in a cost-effective manner. The CED s office also delivers programs that foster wellbeing, diversity, and excellence in employees, and oversees public information and engagement. Trends Rising public interest in water quality issues and our customer s limited ability to pay more is increasing overall attention to the business of the District. Community and professional interest in District leadership efforts are increasing, which creates new audiences and demands on staff time (e.g. adaptive management, chlorides, Ostara, energy efficiency and production, and Envision). Recruitment and retention of top talent will continue to be more competitive as baby boomers retire and the economy improves. Employee desires for flexible work arrangements and greater autonomy is shifting how work is organized and accomplished. Health care reform and continued increases in health care costs will require the District to regularly examine benefit offerings and plan designs. Several directors and managers are in the planning horizon for retirement, leading to a loss of more than 150 years of District experience Goals/Activities Category: Community Based Solutions 1. Goal/Activity: Facilitate a smooth transition to the new governance structure. Measures: The business of the District continues in a seamless manner and Commissioners feel the onboarding process meets their needs for being informed and engaged policy makers. 2. Goal/Activity: Strengthen citizen information and engagement efforts to fulfill regulatory requirements and reduce operational costs. Measures: Major new efforts will include adaptive management, Verona Road Force Main relocation, Metromix marketing, FOG (fats, oils and grease) reduction, and CMOM (Capacity, Management, Operation, and Maintenance Program) required public reporting. 3. Goal/Activity: Community touch points (Key Result Measure) Measures: Tours, Events, News Media, Activities, and Presentations. See Key Result Measures table for 2016 projected targets. 45
51 Category: Workforce Engagement 1. Goal/Activity: Implementation of the Employee Leadership Council. 46 Measures: Employees are elected to the council, a facilitator is selected, council members are trained in interest-based problem solving and develop a workplan. 2. Goal/Activity: Diversity internship program is established. Measures: The implementation of a program to provide job skill training and work experiences for at risk youth starting in the summer of Goal/Activity: Provide a seamless transition of leadership to prepare the organization for the retirement of key employees. Measures: Implement the succession development plan. 4. Goal/Activity: Achieve a score of 79% or greater on the Health Risk Assessment. (Key Result Measure) Measures: Increase employee engagement/participation in wellness activities in Category: Opportunities in Wastewater 1. Goal/Activity: Move toward energy independence and explore potential opportunities to convert food waste into low cost energy. Measures: Apply UW-Madison research to potential next steps for increased energy recovery at the treatment plant using food waste and identify potential partners Goals/Priorities 1. Work with the Commission to craft a response to the Race to Equity report as part of preparing the 2016 budget. Status Update: A broad, strategic discussion did not occur given other priorities. However, the 2016 Budget does include new resources for a pilot program designed to narrow the equity gap. 2. Demonstrate leadership through positive touch points with the community (Key Result Measure). Status Update: In 2015, the District experienced an increased demand for tours of the struvite harvesting operation and continued presentations on adaptive management and chlorides. While it is important for the District to share knowledge and experiences, the time demands can be challenging. However, this spike in demand is short term and should subside in This District, however, is planning to host more plant tours in 2016 with the opening of Shop 1 meeting space in spring The District hired and is training tour guides to meet the anticipated increased tour load. Other activities include involvement in short term partnership projects that build relationships and provide value to the District, such as the UW-Madison Capstone class, Watershed Academy planning, and continued
52 partnership activities with the Friends of the Capital Springs Recreation Area and Dane County Parks. 3. Convene an informal, One Water Working Group to bring together interests from drinking water, storm water, and wastewater to discuss issues of shared benefit and mutual concern. Status Update: The District convened a team from the Madison Water Utility, State DNR, health care sector and UW-Madison to develop a Holistic Water Decision Platform as part of the Climate Quest challenge, hosted by the University of Wisconsin. The proposal achieved finalist status but ultimately did not receive the necessary $250K in funding to scale up the effort. Next steps are being considered, and will include using the EPA s Integrated Planning model to assist staff with chloride reduction strategies. 4. Track anticipated regulatory issues of concern to the District during the next state biennial budget. Status Update: We tracked three primary issues for the District in the biennial budget process: (1) changes to the Clean Water Fund (2) changes to District governance and (3) changes to CARPC authority. Advanced contacts were made on all three issues. On the Clean Water Fund, some positive changes were made, but they were relatively limited. 5. Formalize a District intern program. Status Update: The District expanded its internship program in 2015 and continued to work with community partners such as The Boys and Girls Club and UW-Madison to provide internships to local youth. Research was performed on other successful programs and resources will be requested in 2016 to expand efforts. 6. Continue Succession Planning for key District positions. Status Update: Succession planning at the District has been on ongoing process involving the identification and replacement of key positions, assessment of our future staffing needs, and leadership development. The Operations Engineer position was filled with an internal candidate with six months of overlap. Some restructuring to address the knowledge gap was completed and the 2016 budget includes resources to strengthen operations capacity to compensate for the expected knowledge loss and address additional regulatory/compliance monitoring needs. 7. Develop a strategic plan for wellness (Key Result Measure). Status Update: Wellness efforts in 2015 have transitioned from short-term tactical activities to wellness campaigns focused on long-term behavior change and targeted areas of need based on the Health Risk Assessment. Wellness activities for 2015 include health risk assessments, wellness fair, nutritional challenge, flu shots, and a stress management campaign. 47
53 8. Develop a plan for District corporate strategic communications. Status Update: This was not completed. 9. Implement a competency based training program for new Operations and Maintenance employees to ensure they know how to safely perform their job. Status Update: Implemented for a new hire in May. 10. Continue to create equipment specific lock-out tag-out procedures. Status Update: Four large processes are complete and three are in progress. Key Result Measures Measure Target FY 2014 Actual FY 2015 Expected FY 2016 Projected Lost time accidents Health Risk Assessment Results (need more explanation here of what the number means) Demonstrating leadership through positive touch points with the community: Tours Events News Media Activities Presentations 70 1 to to Chief Engineer and Director s Department Summary Budget Category 2015 Adopted Budget 2015 Estimate 2016 Budget 2016 Change from 2015 Budget % Change from 2015 Budget Personnel Services 575, , ,911 19, % Asset Addition, Repair, and Replacement 18,200 15,816 22,700 4, % Contract Services 116,900 78, ,800 61, % Material, Supplies and Misc. 83,200 68,681 84, % Department TOTALS 794, , ,561 87, % 48
54 Changes to the Budget Personnel Services As shown in the Department Summary Table, Personnel Services budgeted for the Chief Engineer and Director s Department are expected to increase by 3.47%. Details are provided below. An increase of $30,000 for the diversity intern program. Asset Addition, Repair, and Replacement Asset Addition, Repair, and Replacement budgeted for the Chief Engineer and Director s Department are expected to increase by 24.73%. Details are provided below. Moderate increases for safety related supplies. Contracted Services Contracted Services budgeted for the Chief Engineer and Director s Department are expected to increase by 52.95%. Details are provided below. A total of $40,000 was added for services related to the Employee Leadership Council and $30,000 for professional communication related services. Materials, Supplies, and Miscellaneous Materials, Supplies, and Miscellaneous budgeted for the Chief Engineer and Director s Department are expected to increase by 1.14%. Details are provided below. No changes to report. 49
55 Administrative Services Department Department Description The Administrative Services Department performs a variety of services for internal and external customers. The Accounting and Office Work Group manages accounting, payroll, rate setting, and grants and loan administration. The group also provides administrative support for the Commission, Chief Engineer and Director, and other District groups, and supports the District s software and processes for Work and Asset Management (WAM) and document management (OnBase). The Information Systems Work Group manages the District s website, network infrastructure and applications, and data integrity and security. The group also provides application design services, hardware, software, user support, training, and other technical assistance. Trends Public concern about affordability is increasing, as the amount it costs the District to meet stricter regulatory requirements outpaces inflation. District obligations require a multi-year budgeting approach to ensure that there are sufficient resources to meet existing and emerging needs. There is a growing need to communicate with the general public and other interested stakeholders about necessary District activities and initiatives. The District is using increasingly complex technology and systems as part of its business processes. Staff demand is high for information systems services to support data driven decisions, and there is an associated high growth in data storage, databases, and reporting requirements. Demands for external connectivity and mobility are also increasing Goals/Activities Category: Sustainable Infrastructure 1. Goal/Activity: Develop a more detailed 3-5 year financial plan for the District. The current plan is a high level 10-year plan. A more detailed multi-year plan will better integrate, in a proactive manner, the Strategic Plan and new initiatives into our annual budget setting. This will be a multi-year effort involving all District departments. Measures: Develop the process and budget planning principles for this effort in Provide an initial 3-5 year plan in time to inform FY 2018 budget development. 2. Goal/Activity: Develop an IT strategic plan to guide IT priorities, direction, and investments to cover the next 3 to 5 years. Measures: Select a strategic planning consultant by December Deliver an IT strategic plan for Commission review in August
56 3. Goal/Activity: Produce budget reports, financial statements, and an annual report in formats that more effectively tell the District s story and are more easily understood by the public (Key Result Measure). Measures: Achieve a rating of outstanding on 50% of the mandatory criteria for the GFOA Budget Presentation Award. 4. Goal/Activity: Complete five sustainable activities or projects (MPOWER) in 2016 to improve sustainability in areas such as waste reduction, energy efficiency, transportation and supply chain efficiency, employee wellness and engagement, and community outreach (Key Result Measure). Measures: Projects that have been identified for 2016 include: Development of a green tour for the new Maintenance Facility. Participation in a CSA program. Introduction of a green cleaning program Employee engagement and education activities Goals/Priorities 1. Develop a strategic financial plan to support the District s long-term financial needs. Status Update: A multi-year financial forecast was developed in Produce budget reports, financial statements, and an annual report in formats that more effectively tell the District s story and are more easily understood by the public (Key Result Measure). Status Update: The budget documents for FY 2015 again received the GFOA Distinguished Budget Presentation Award. The 2015 budget documents met all 13 of the optional criteria. The FY 2014 budget documents met the mandatory criteria and 12 of the 13 optional criteria. 3. Maintain effective accounting and control practices to achieve financial audit reports that show no significant deficiencies or material weaknesses. Status Update: Completed. 4. Develop capability to support WAM and OnBase software applications. Status Update: System administrator duties for WAM and OnBase applications have been transferred to the Business Analyst position. 5. Implement a program resource group to provide administrative support, handle communications-related production work, develop lean systems, and centralize acrossdepartment support functions. 51
57 Status Update: The Program Resource Group, or Resource Team, was fully staffed at the beginning of The group has spent the year establishing itself, developing new workflows and processes, and absorbing some new responsibilities. 6. Use the new budgeting application for budget reporting and preparation of the FY 2016 budget. Status Update: Last-minute problems with the new application required staff to use the old budget system to prepare the 2016 budget. Staff will return to implementation of the new system after completion of this year s budget. 7. Implement a new Laboratory Information Management System (LIMS). Status Update: Implementation of a new LIMS began in July The project is on schedule for completion by January Develop an IT strategic plan to guide IT priorities, direction, and investments to cover the next 3 to 5 years. Status Update: Work on developing a request for proposal from a planning consultant is underway. We expect to complete consultant selection by December 2015 and the IT strategic plan by August Maintain 98% availability for our network servers. Planned downtime during off hours early in the morning, late in the day, and weekends will not count as downtime (Key Result Measure). Status Update: 99.8% availability as of August Complete five sustainable activities or projects through the MPOWER Team in In 2014, this goal shifted from the CED Department to Administrative Services. The 2014 goal is anticipated to be completed on target (Key Result Measure). Status Update: The MPower Team exceeded their goal for the 2015 year with completion of eight projects: Implementing a Community Supported Agriculture program (CSA). Participation in an electronics recycling day for employees. Hosting an alternative transportation day. Performing a District trash audit. Conducting a brown bag lunch series on sustainability. Having an expert educate and teach employees on home winterization. Purchasing recycling receptacles and educating employees on proper disposal of common wastes. Hosting an employee chili cook off event with chili made from local ingredients. 52
58 Key Result Measures Measure Target FY 2014 Actual FY 2015 Expected FY 2016 Projected Achieve a rating of proficient or better on 100% 100% 100% 100% mandatory criteria for the GFOA Budget Presentation Award Achieve a rating of proficient or better on 80%/100%* 92% 100% 100% optional criteria for the GFOA Budget Presentation Award Achieve a rating of outstanding on 50% of 50% % the mandatory criteria for the GFOA Budget Presentation Award Maintain 99% availability for our network 99%** 99.9% >99% >99% servers.** 5 sustainable activities/projects- MPOWER 100% 100% 100% 100% *2014 target was 80%. This target was achieved for the 2014 Budget. Increased target to 100% for **2014 target was 97%. Increased 2015 target to 98%, and 2016 target to 99% performance was 99.8% as of August 20. Administrative Services Department Summary 2015 Adopted Budget 2016 Change from 2015 Budget % Change from 2015 Budget Budget Category Estimate Budget Personnel Services 1,184,711 1,162,804 1,249,876 65, % Asset Addition, Repair and Replacement 394, , ,055-77, % Contract Services 589, , ,570 90, % Material, Supplies and Misc. 91,655 84, ,077 31, % Department TOTALS 2,261,112 2,169,334 2,370, , % 53
59 Changes to the Budget Personnel Services As shown in the Department Summary Table, budgeted amounts for Personnel Services in the Administration Department increase by $65,165 or 5.5%. There are no new positions in the department this year. The change is due to the following: No IT salaries are budgeted to the Capital Fund Budget for This change accounted for $29,173 of the 2016 increase. Market and progression increases for employees, along with increased health insurance and fringe benefits costs, account for the remainder. Asset Addition, Repair, and Replacement Budgeted amounts for Asset Addition, Repair, and Replacement are projected to decrease by $77,920 to $317,055. These changes are due primarily to the following: The 2015 budget included two large, one-time purchases in 2015 a laboratory information management system upgrade and a new phone system for the Nine Springs campus. These projects, which will be completed in 2015, amounted to a one-time expense of $190,000 in The 2016 budget includes a $75,000 contribution to the Equipment Replacement Fund (ERF) balance. To expand capacity to store data, the 2016 budget includes the addition of a Shared Network Storage (SAN) device at a cost of $50,000. The District has maintained a $3,000,000 ERF since The ERF is a requirement of our Clean Water Fund loans. With recent additions to our treatment plant and pumping station assets, the $3,000,000 total will no longer meet the minimum requirements for the ERF. The $75,000 budgeted amount is the first of what is anticipated to be a series of annual additions to the ERF to maintain the minimum required balance in the fund. The amount of the annual contribution to the ERF will be re-computed each year based on completed and planned additions to our assets. The new SAN device will provide additional capacity to store data from the full gamut of District systems. Existing storage is nearing capacity. Contracted Services Budgeted amounts for Contract Services increase by $90,799 to $680,570. The changes are primarily due to the following: A $50,000 increase in legal services to cover special legal services (e.g. Intergovernmental Agreement for phosphorus adaptive management, governance issues, the Connection Charge Rate Study, and other emerging legal projects). Consultant services to complete the Connection Charge Rate Study are projected to cost $25,000. No funds were included in the 2015 budget for this study. Connection Charge Rate 54
60 Study costs incurred in 2015 were paid out of a carryover from the 2014 budget allocation. Unspent amounts from the 2014 budget allocation are recognized in the projected 2015 end-of-year expenses. Consultant services to replace the existing Construction Database are projected to cost $35,000. The existing Construction Database is well-used and has outgrown its initial application. Improvements to this database have been postponed for the past two years. The Connection Charge Rate Study began in 2014, continued in 2015, and is awaiting appointment of the new Commission to be completed. The study will identify potential changes to District connection charges that reflect current development patterns and the District s interests in cost recovery for facilities built for new customers. Materials, Supplies, and Miscellaneous Budgeted amounts for Materials, Supplies, and Miscellaneous increased by $31,422 to $123,077. The major changes in the miscellaneous expenses are for additional smartphones for various workgroups, increased printer ink and toner, and miscellaneous computer supplies. More large jobs are being printed in-house because of a new printer purchased several years ago. 55
61 Ecosystem Services Department Department Description The Ecosystem Services Department is responsible for the District s laboratory, pretreatment, and waste acceptance programs, and a number of environmental and regulatory initiatives that involve working with stakeholders to reduce the demand for traditional wastewater treatment infrastructure and collection services. This includes working to advance regulatory and strategic initiatives that provide flexibility and encourage innovation, while protecting and enhancing environmental quality. Ecosystem Services works with other District departments on multiple initiatives, in some cases leading the initiative, while providing supporting services in others. The Ecosystem Services Department is currently staffed by 11 full-time equivalent positions. The 2014 Ecosystem Services Staffing Study identified the need for approximately one additional FTE if the District implements a full-scale adaptive management project as is currently anticipated. Part-time student help is used in the laboratory, and to conduct private well water sampling in support of the Metrogro Program. Interns are used to support pollution prevention activities related to chloride and adaptive management. Trends Pollution prevention and source reduction are increasingly looked to as alternatives to traditional brick and mortar solutions. Traditional District approaches to address regulatory requirements and/or meet environmental objectives have relied on adding new treatment technologies or expanding capacity at the Nine Springs Wastewater Treatment Plant. This approach is discharge focused and often results in expensive and resource intensive solutions. While there may be situations where traditional brick and mortar solutions make sense, the District will increasingly utilize Pollution Prevention/Source Reduction (PPSR) approaches to meet regulatory requirements and environmental objectives. These approaches can result in equivalent and/or improved environmental outcomes at lower overall costs. Major PPSR efforts currently underway include those associated with phosphorus and chlorides. These efforts have/will cut across multiple District areas, including the laboratory, pretreatment, operations, and engineering. A critical component of PPSR efforts is the ability to advance collaborative initiatives. New resources and tools will be required to support these activities. For example, the District will need to position itself to strategically utilize a wide array of information and engagement tools/techniques. Increased emphasis on process and environmental monitoring. There will be an increased emphasis on environmental monitoring (physical, chemical, and biological parameters) and use of the resulting data to support decision-making or advance program initiatives. Efforts will focus on a number of areas, including plant process changes, resource recovery (Ostara, MetroMix, energy, and water), adaptive management, PPSR initiatives, and preparing for future effluent limitations. The District will design monitoring programs, coordinate implementation of these programs, and where practical serve as the central laboratory for associated analytical requirements. Growing importance of resource recovery. The District will pursue and implement resource recovery initiatives where the business case can be made, using a triple bottom line analysis 56
62 that considers social, environmental, and economic factors. Current examples include energy recovery, phosphorus harvesting (Ostara), and biosolids reuse through the Metrogro Program. Additional efforts will likely focus on such areas as water reuse, increasing energy production through acceptance of high strength wastes, and diversifying the biosolids reuse program. Other opportunities will likely emerge. Proactive engagement with regulatory and legislative initiatives. The District has been well served by engaging in regulatory and legislative initiatives at the local, state and national level. This includes providing input on the development of new regulations and/or legislative initiatives, tracking a wide variety of new regulatory and legislative initiatives to determine potential impacts on District operations, and positioning the District so that it is compliant with new requirements. Recent examples include participating in the Mississippi River Nutrient Dialogue series to identify nutrient reduction approaches for the Mississippi River Basin, working at the state and national levels to develop a more functional water quality trading framework, and working with the National Association of Clean Water Agencies to address resource recovery related issues (e.g. Ostara) Goals/Activities Category: Community Based Solutions 1. Goal/Activity: Implementation of a full-scale adaptive management project to achieve compliance with anticipated phosphorus discharge permit limits. Measures: Full execution of an IGA for adaptive management. WDNR approval of the adaptive management plan. 2. Goal/Activity: Implementation of the first year of the Chloride Pollutant Minimization Plan (PMP) Measures: WDNR approval of Chloride PMP. Development of supporting Information and Education (I/E) materials. District award of chloride reducing grants. Achieve ~ 8,000 lb reduction in chloride mass. Category: Sustainable Infrastructure 1. Goal/Activity: Implementation of a new LIMS Measures: Migration of data and reporting functions to new LIMS. Staff training to complete implementation process. 57
63 2015 Goals/Priorities 1. Implementation of chloride PPSR initiatives with a District goal of achieving a 15% reduction in effluent chloride concentration and mass by the end of the District s current WPDES permit term (Key Result Measure). Status Update: Activities consistent with the 2015 chloride reduction plan have been implemented. Limited reduction in chloride mass has been achieved. No clear reduction in chloride concentration has been achieved as progress is masked by low flow conditions. 2. Procure and implement a new Laboratory Information Management System (LIMS). Status Update: LIMS vendor procurement process is complete. Implementation process has begun. 3. Develop an approach for addressing thermal requirements and reach agreement with DNR on the selected approach prior to reissuance of the District s WPDES permit. Status Update: Thermal data has been submitted to DNR along with a recommended approach for addressing Badfish Creek and Badger Mill Creek outfalls. Discussions with DNR are on-going. 4. Develop a job description for a new Ecosystem Services staff position and complete hiring process. Status Update: Job description was developed for the newly created Pollution Prevention specialist position, and the position was filled in February Develop a long-term plan for the use of interns to support Ecosystem Services related initiatives and begin implementing the plan. Status Update: Intern needs were identified in three key areas; pollution prevention, laboratory, and adaptive management. Interns were brought on board in each of these areas. 6. Develop and implement steps needed to support transition from an adaptive management pilot project to a full-scale project: Submit an adaptive management plan to DNR for approval. Complete revised cost model. Complete long-term brokering agreement. Develop organizational and administrative framework. Develop and conduct outreach efforts with adaptive management municipal partners needed to secure participation. Status Update: The adaptive management plan is currently under development and DNR staff has been engaged as part of this effort. The revised cost model is substantially complete. A service agreement is in place with Dane County. Work is progressing on developing an Intergovernmental Agreement (IGA) to support the full-scale adaptive management project. 58
64 Key Result Measures Measure Percent of time laboratory turnaround times are met Target FY 2014 Actual FY 2015 Expected FY 2016 Projected > 95% 96% 96% > 97% Reduction in chloride mass 20,000 lbs by 2020 No sig. change (year over year) No sig. change (year over year) 8,000 lbs Ecosystem Services Department Summary 2015 Adopted Budget 2016 Change from 2015 Budget % Change from 2015 Budget Budget Category Estimate Budget Personnel Services 1,301,400 1,254,281 1,341,247 39, % Asset Addition, Repair and Replacement 60,000 57,264 60, % Contract Services 377, , ,200 52, % Material, Supplies and Misc. 133, , , , % Department TOTALS 1,871,750 1,811,653 2,166, , % Changes to the Budget Personnel Services As shown in the Department Summary Table, the amount budgeted for this category has increased by approximately $39,847 or 3.06% relative to the 2015 budget request. The major changes to this category are: Addition of a FTE Ecosystem Services position in the fourth quarter of 2016 to support a fullscale adaptive management project (Note-it is possible that in the future this position could be funded through the Yahara Watershed Improvement Network, Yahara WINS). Increases associated with the District s pay plan for non-represented employees. Increases in health insurance and fringe benefits. The need for additional staff support for the full-scale adaptive management project was identified in the 2014 Ecosystem Services Staffing Evaluation Report submitted earlier this year. Note that funding for a student intern position is retained in the 2015 budget request. 59
65 Asset Addition, Repair, and Replacement There are no significant changes to the 2015 budget. Contract Services The amount budgeted for this category has increased by approximately $52,200 or 13.85%. The majority of this increase ($50,000) is related to the increased payment to Dane County in 2016 as part of the service agreement for adaptive management. Material, Supplies and Misc. The amount budgeted for this category has increased by approximately $202,550 or %. The majority of this increase ($190,000) is related to implementation of the District s chloride reduction strategy, which will allow the District to avoid making large infrastructure investments to remove chloride through treatment at the Nine Springs Wastewater Treatment Plant. The remainder of this increase is associated with Whole Effluent Toxicity Testing to support the potential development of site specific criterion for chloride and for additional low level mercury testing to support mercury pollution prevention and source reduction efforts. 60
66 Engineering and Planning/Strategy Department Department Description The Engineering and Planning/Strategy Departments plan, design, and construct conveyance and treatment infrastructure to meet the needs of our customers, all in an effort to serve the District's mission of protecting public health and the environment and manage District assets cost-effectively. The Engineering Department encompasses all key engineering functions: civil, structural, mechanical, plumbing, electrical, controls, and HVAC. Departmental planning and strategy provide leadership in long-range facilities planning/assessment efforts, capital improvements, and the District s asset management and Capacity Management Operation and Maintenance (CMOM) programs, among other major planning efforts. Trends Market demand for construction-related services continues to be strong. This makes the bidding climate for District capital improvement projects less competitive and increases project costs. In 2015, the average age of the District s infrastructure increased to approximately years old. Our aging infrastructure will require increased investments in Capital Improvement Projects. Adaptive management strategies used to meet permit requirements may reduce the need for future large treatment plant additions. Changes in development requirements, such as storm water treatment regulations, are limiting the District s ability to recover the full cost of conveyance and treatment systems needed to serve these areas. Climate change is affecting operating conditions. Design standards have become nonstationary and are no longer constant. Extreme weather conditions will continue to tax the limits of the infrastructure needed to maintain public health and the quality of the environment. Project Engineers are dedicating more time to engaging external stakeholders and the general public during capital improvement project design and construction Goals/Activities Category: Community Based Solutions 1. Goal/Activity: Complete a Connection Charge Rate Study Measures: Complete a rate study that minimizes interpretation/subjectivity associated with District connection charges and ensures that the District is fully recovering costs. The end result should be a system that is: Fair Equitable Easy to administer Understandable Consistent 61
67 Category: Sustainable Infrastructure 1. Goal/Activity: Complete Scheduled Capital Improvement Projects Measures: Maintenance Facility: Complete construction. WI-Randall Ave. to PS2: Complete design and construction. PS12 Forcemain Relocation at Verona Road: Complete design and construction. PS15 Rehabilitation: Bid the project and begin construction. PS11/12 Rehabilitation: Complete construction. Capital City Trail: Complete relocation of the trail. LBMCI-Phase 4: Begin planning and design. 2. Goal/Activity: CMOM (Capacity Management Operations and Maintenance) Program Measures: Finish completion of District s CMOM program with final program in place by DNR deadline of August Goal/Activity: Complete a Facility Plan for the Treatment Plant Liquid System Measures: Work with an external consultant to complete a facility plan for the liquid train of the treatment plant, which would include an analysis of the plant hydraulic characteristics and capacities, improvements to the aeration system, evaluation of the Headworks and UV systems, and other areas identified in the scope of work. 4. Goal/Activity: Asset Management Measures: The District will complete its Plant Asset Management Plan and other major Sustainable Infrastructure Management (SIM) Implementation Plan projects by the end of 2017 (Key Result Measure). Key elements of the SIM Implementation Plan include: Develop SIM Policy and Objectives (generally outlined in the SIM Framework). Identify/solidify Levels of Service. Create Business Risk Exposure Framework and Risk Register. Develop a Decision Support System and select related tools, such as software. Develop a Plant Asset Management Plan. Improve the Business Case Evaluation process. Improve the District s asset information and tracking systems. 5. Goal/Activity: Initiate a Force Main Inspection Program Measures: Force mains are a critical portion of the wastewater conveyance system. These pipelines can be very difficult to inspect to determine their condition and remaining useful life. The goal of this program in 2016 would be to initiate a force main inspection program, begin inspections (as budget permits), and determine future needs. 62
68 2015 Goals/Activities 1. Keep capital improvement construction project contract modifications below 5% (Key Result Measure). Status Update: Contract modifications were 2.97% for the 11th Addition, 3.21% for the NEI- FEI to SEI Replacement, and are expected to be near 2.5% for Pump Station 18 and -1.0% for the PS18 Force Main. 2. Keep total non-construction costs for projects below 20% of the final construction contract amount (Key Result Measure). Status Update: Total non-construction costs were 17.2% for the 11th Addition, 8.9% for the NEI-FEI to SEI Replacement, and 9.6% for the WI MH05-112A to MH Liner. They are anticipated to be below 15% for PS18 and the PS18FM. 3. Complete the Process Control System (PCS) upgrade. Status Update: Construction related to the PCS upgrade is essentially complete. All programming and other project related work should be completed by the end of Begin construction of the Maintenance Facility. This includes retaining an external consultant for construction services and internal project management/contract administration. Status Update: Consultants were retained, and the project was advertised and bid in early As of August 2015, construction was approximately 40% complete. 5. Continue development and implementation of the strategic asset management program by establishing a framework for asset management plans and instituting condition assessment practices and systems for equipment. Status Update: Development of an asset management program continued in 2015 and will continue for several more years. Ultimately, advanced asset management principles will be strategically integrated into the District s routine operation. 6. Develop and implement a business-risk assessment approach for critical assets, including a GIS-based analysis for pipes and manholes. Status Update: As the District develops its asset management program, it continues to refine its methods of assessing business risk for critical infrastructure. During 2015, an interim risk assessment approach was used for the 2016 CIP process. Follow-up to the District s sustainable asset management framework (June 2015), including the use of GISbased tools, will provide more thorough risk assessments. 7. Evaluate and develop an implementation plan for asset management software. Status Update: In August 2015, the District completed its plans to implement its asset management framework (June 2015). Asset management is data intensive, and a key part of 63
69 implementing asset management is access to the proper software tools. The District continues to assess its software needs as part of an overall strategic information technology plan, which includes assessing asset management, GIS, and other long-term technology needs. 8. Continue to improve the District s Capital Improvements Plan (CIP) and capital budgeting processes. Integrate the Sustainable Infrastructure Management Team (SIM) into CIP development. Refine and implement life cycle cost business case approach for capital project planning. Status Update: A key improvement during 2015 was successfully integrating the District s capital improvement planning financial model into the District s overall financial model. This will significantly enhance the future efficiency of the overall planning and budgeting process. The SIM Team participated in the 2016 CIP development process, and this should become a routine part of the SIM Team s ongoing duties. The CIP process is continually reviewed and improved upon throughout the year. 9. Address new asset management/financial criteria for Clean Water Fund loan applications. Status Update: The District continues to improve its asset management program. Existing processes and practices essentially meet the new asset management criteria for Clean Water Fund loan applications. 10. Complete design, approvals, bidding, and construction of the Rimrock Interceptor replacement project. Status Update: As of August 2015, design of the Rimrock Interceptor Replacement was essentially complete. The project is expected to be bid in fall 2015, with construction taking place in Winter/Spring 2015/ Complete all construction associated with Phase 1 Rehabilitation of the Northeast Interceptor west of the Dane County Regional Airport, and begin planning/design for Phase 2 of the project. Status Update: Construction of Phase 1 of the Northeast Interceptor Rehabilitation West of the Airport was completed in Phase 2 has been postponed due to other higher priority capital projects. 12. Begin facility planning for treatment plant aeration and peak capacity improvements. This includes selecting and retaining an external consultant to perform the work. Status Update: The scope of the facilities plan has been developed and an external consultant is expected to be hired before the end of Complete design and construction of the West Interceptor MH to PS2 Liner project. This includes coordination with the City of Madison, as necessary. 64
70 Status Update: Planning for this project started in 2015, including necessary coordination with the City of Madison. Due to traffic and UW-Madison constraints, the project is expected to be constructed during summer Begin initial planning for the rehabilitation of the North End Interceptor. Status Update: This is not expected to start until late 2015 or early Begin initial planning associated with control system improvements at PS7. Status Update: A review of the facilities in early 2015 revealed that systems are still in relatively good condition, and the District has adequate spare controllers to support it for quite some time. Therefore, related work has been postponed and will now be included in the next general rehabilitation of PS Complete all construction associated with Pumping Station 18 and PS18 FM, and successfully bring the facilities on line and operational. Status Update: PS18 and the PS18 Force Main were completed in early 2015 and successfully commissioned in the spring. An Open House was held in June Oversee construction of the PS11 & 12 Rehabilitation project, including all contract administration and resident engineering duties. Status Update: Construction of the PS11 &12 Rehabilitation project took place throughout 2015 and will continue through mid Complete planning and design for the rehabilitation of PS15 and begin construction (if scheduling permits). Status Update: Planning and design of the PS15 Rehabilitation project began in early A consultant was retained and external stakeholders have been engaged. The project is expected to bid in early Perform a comprehensive review, including an overall business/strategic plan, of the GIS system. Status Update: This will be included as part of the overall IT Strategic Plan, which will commence during the last quarter of 2015 and be completed in mid Complete the Connection Charge Rate Study and implement its recommendations. Coordinate with customers and other municipalities as necessary. Status Update: This has not been completed. Due to a switch in consultants and a change in District governance, this was delayed and eventually postponed until 2016 or later. 21. Conduct an audit of paid/unpaid connection charge areas and share the results with customer communities. 65
71 Status Update: As of August 2015, this work is ongoing and is expected to be completed by the end of Continue development of a District CMOM program, meeting DNR regulations and timeframe. The intent is to complete a draft by year-end Status Update: Development of a District CMOM program began in 2015, with a draft framework expected by the end of 2015, and a final program implemented by mid According to DNR regulations, a CMOM program must be in place by August With help from Sewer Maintenance and outside resources, score interceptor segments using PACP system for all past available (70-80% of system) televising records. Status Update: Complete. Key Result Measures Measure Keep Capital Improvement construction project contract modifications below 5% Keep total nonconstruction costs for projects below 20% of the final construction contract amount Apply triplebottom-line tools (SAM, LEED, Envision, etc.) during projects to make balanced business decisions Target Change orders less than 5% of the original contract amount Total other costs for projects less than 20% of the final construction contract amount Apply these tools at least 5 times during the year FY 2014 Actual 11 th Addition: 2.97% NEI-SEI to FEI:3.21% WI MH05-112A to MH05-119: 3.89% 11 th Addition: 17.2% NEI-SEI to FEI: 8.9% WI MH05-112A to MH05-119: 9.6% 3 PS11/12 Design (Envision); PS11/12 Back-up Power (SAM); Maintenance Facility (LEED) FY 2015 Expected PS18: Approx. 2.5% PS18FM: Approx % NEI Rehab West of Airport: Approx. 1.0% PS18: Less than 15% PS18FM: Less than 15% NEI Rehab West of Airport: TBD 5 PS15 Screenings (SAM); PS15 Odor Control (SAM); PS12FM Relocation (SAM); PS15 HVAC (SAM); PS15 Design (Envision) FY 2016 Projected <5% <20% >5 66
72 Engineering and Planning/Strategy Department Summary Budget Category 2015 Adopted Budget 2015 Year-End Estimate 2016 Budget 2016 Change from 2015 Budget % Change from 2015 Budget Personnel Services 779, , ,702 90, % Asset Addition, Repair and Replacement 67,750 63, , , % Contract Services 111, ,171 94,610 (16,590) -14.9% Material, Supplies and Misc. 12,600 11,452 7,250 (5,350) -42.5% Department TOTALS 971,335 1,073,541 1,160, , % Changes to the Budget Personnel Services As shown in the Department Summary Table, Personnel Services budgeted for the Engineering and Planning Strategy Departments are expected to increase by 11.66% from 2015 to This is due to the following: A higher percentage of employee time anticipated for Operating Fund salaries versus Capital Fund salaries. This is due to several major capital projects (Pumping Station 18 and the Pumping Station 18 Force Main) ending in 2015 and additional attention to infrastructure asset management, such as I/I reduction and force main condition assessments. A combination of market and progression salary increases projected for Increased health insurance and fringe benefit costs. Overall, Engineering Department workload is not expected to increase significantly in the near future, and therefore, no new positions are anticipated. However, the work split between capital and operating accounts is expected to continue to fluctuate as major projects are completed. The shift to general operating accounts includes required continuing education for professional engineers, additional coordination/outreach to customers, and technical involvement to support asset management. While this does shift costs to the operating fund in the near-term, it benefits the long-term outlook for the District, allowing staff to manage assets cost-efficiently and plan for future capital improvements. Asset Addition, Repair, and Replacement Budgeted Engineering and Planning/Strategy Department amounts for Asset Addition, Repair, and Replacement, are projected to increase from $67,750 in 2015 to $188,100 in 2016 (+177.6%). This is primarily due to: The initiation of a force main inspection program (+$50,000). Expansion of the manhole I/I-chloride reduction program (+$25,000). 67
73 The beginning of any transitions needed for new GIS software/tools (+$75,000) to integrate better with other software and support asset management initiatives. Contracted Services Budgeted Engineering and Planning/Strategy Department amounts for Contracted Services decreased from $111,200 in 2015 to $94,610 in This decrease of 14.9% is due to: Completion of the GIS strategic/business plan (-$40,000). A cost increase for locating services (+$15,000). Not all contracted services costs are incurred every year. Instead, they are incurred on a biannual, tri-annual, or longer basis. Materials, Supplies, and Miscellaneous Budgeted Engineering and Planning/Strategy Department amounts for Materials, Supplies, and Miscellaneous, decreased from $12,600 in 2015 to $7,250, or 42.5%, in This is due primarily to the completion of the Geomedia Smart Client GIS pilot project in
74 Operations and Maintenance Department Department Description The Operations and Maintenance Department is responsible for the core business of the District conveying wastewater to the treatment plant, treating wastewater to meet the District s discharge permit, recycling and reusing the effluent, biosolids, and biogas, and meeting the District air emissions permit. These resource recovery activities are accomplished by the following sections within the department: Operations Building and Grounds Mechanical Maintenance Electrical Maintenance Metrogro Monitoring Services/Sewer Maintenance Purchasing The Operations Section is responsible for control of the treatment processes, while the Metrogro Section is responsible for recycling of all biosolids to farmland. The various Maintenance Sections ensure that pumping stations operate reliably and that adequate equipment is available to treat all wastewater received at the treatment plant. Trends Workload issues will continue to be a concern. New facilities added with the 11th Addition are demanding a significant amount of operator attention and maintenance activities. Due to the interaction between new facilities and previously existing procedures, staff has to be cognizant of how changes in one process can affect other processes and equipment. Establishing the asset management program will require substantial input from members of the Operations and Maintenance Department. This will be particularly evident in the development of a condition assessment program. As pressure grows to keep budget increases low, there will be a greater tendency to defer maintenance to avoid increasing costs. The asset management program will need to demonstrate the economic benefits of timely maintenance. Resource recovery will continue to be essential to the District s operations. Efforts to maximize the amount of phosphorus recovered through struvite harvesting will continue. Markets for Metromix will be developed to serve as a second means of reusing biosolids beneficially. Energy production and conservation will be explored to find ways to lower costs Goals/Activities Category: Opportunities in Wastewater 1. Goal/Activity: Participate in the completion of the 2016 Liquid Processing Facilities Plan. 69
75 Measures: Provide plant operations data to the consultant as necessary. Participate in workshops. Review technical memoranda. Review the final plan. 2. Goal/Activity: Maximize production of struvite through the Struvite Harvesting Process (Key Result Measure). Measures: Collaborate with representatives of Ostara to develop trials of production increase theories. Install an on-line phosphorus monitor. Maintain the associated equipment to provide continuous reliable operation. 3. Goal/Activity: Expand marketing outreach for the Metromix product while delaying full implementation of Metromix production. Measures: Produce enough Metromix to use in a marketing program. Find three different uses for Metromix. Monitor the results in areas where Metromix will be used. 4. Goal/Activity: Minimize safety concerns in the monitoring services sampling program. Measures: Install flow inserts and laser flow measuring equipment where possible. Explain the new flow measuring system to the satisfaction of all customers. Install new sampling manholes where satisfactory monitoring does not now exist. Category: Opportunities in Sustainable Infrastructure 1. Goal/Activity: Fully participate in development of the Sustainable Asset Management Plan. Measures: Participate in all planning workshops. Participate in condition assessment activities. Assist as requested by the Sustainable Infrastructure Manager. Category: Workforce Engagement/Opportunities in Sustainable Infrastructure 1. Goal/Activity: Fully utilize the new Maintenance Facility. Measures: Complete the move into the new Maintenance Facility. Organize the inventory area. Use the training room for District and non-district activities as appropriate. Measure energy usage, production, and avoidance. 70
76 Category: Workforce Engagement 2. Goal/Activity: Work with the Administration Department to develop an efficient budget development workflow. Measures: Identify the SWOT of the current process. Address the key issues that drive development of the budget. Test the software early in the year Goals/Activities 1. Continue to find ways to reduce the amount of energy purchased. Work with a consultant to study the availability of high strength waste. Begin to accept enough high strength waste to allow for maximum engine operation. Continue UW projects investigating low dissolved oxygen removal of nutrients and use of food waste as feed to anaerobic digesters. Status Update: The feasibility of accepting high strength waste from a production facility in Stoughton was investigated. The material increased digester gas production, but the facility was not willing to pay the price the District needed to charge to make acceptance of the material economical. A study to determine availability of other high strength wastes will be conducted in the latter part of A research project to ascertain whether nitrogen and phosphorus can be removed from wastewater at low dissolved oxygen concentrations has shown promising results and will continue in If successful, this could significantly reduce energy needs at the treatment plant. Adding food waste to lab scale anaerobic digesters has shown this procedure can be done successfully, but there is a limit to how much of this material can be added without upsetting the digesters. This project is continuing to better define the effects of source separated organics on anaerobic digestion. 2. Incorporate a new scheduling process for maintenance workgroups to provide a more structured way to address maintenance needs, use personnel more efficiently, and assist the asset management group. Status Update: New scheduling software proved to have features that were difficult to use and did not provide the efficiencies expected. However, an older scheduling program was used to allow maintenance supervisors to implement improved procedures learned by working with the new software. The older program will be updated by the District s Information Technology section in Obtain an air permit for operation of emission equipment at the treatment plant and at Pump Station 18. Perform all testing required by the permit. Status Update: We are continuing to work with the Department of Natural Resources (DNR) to obtain this permit. A recent reorganization within DNR has led to some delays. It is expected that a permit can be obtained by the end of the year. 4. Continue to work with Ostara to maximize the production of struvite prills. This may include modifications to the drying equipment (Key Result Measure). 71
77 Status Update: Modifications were made to the drying equipment to reduce the time and effort necessary to clean the units. This has increased the availability of dryers. Modifications were also made to recycle lines on the reactors in an effort to reduce the negative impact of fine particulate matter. Near mid-year, the liquid streams that serve as feed to the reactors were separated to prevent struvite formation in the piping before the flow arrives at the reactors. The effect of these changes is still being evaluated. 5. Complete the conversion of the Process Control System by the mid-year deadline. Status Update: The field work on this project has been completed. Final acceptance is expected in the fourth quarter of the year. 6. Convert the User Charge monitoring system to the use of flow inserts and the LaserFlow metering system. Reduce the amount of confined space entries. Status Update: Flow inserts and the LaserFlow metering system have been purchased and used to collect flow data in the collection system. In some cases, there were differences in data collected by these new devices and methods used to measure flows in the past. Efforts are underway to reconcile these differences. The new devices have reduced the number of confined spaces entries into the collection system. 7. Produce enough Metromix to develop data on the cost of production and determine the market for the product. Status Update: Class A biosolids were produced in the west digester complex at the beginning of the year. These biosolids were then dewatered using a centrifuge. The resulting cake solids were analyzed for fecal coliform bacteria to monitor the regrowth phenomenon observed nationwide with centrifuged material. Research continues on how to eliminate this re-growth. Some cake solids were delivered to a landscaper to evaluate how well the material worked as a topsoil amendment. A significant amount of cake biosolids will be used to line the stormwater retention ponds under construction as part of the Maintenance Facility project. 8. Move into the new Maintenance Facility. The facility is expected to be completed near the end of the year. Status Update: Construction of the Maintenance Facility is on schedule to be completed by the end of Maintenance managers and supervisors have been preparing to move existing equipment and parts to that facility and install new furniture and equipment. 9. Complete modifications at Pump Station 16 to address neighbor concerns about odors. Status Update: A contract was awarded for modifications to the ventilation system in the pumping station. The work will be completed by the fourth quarter of
78 Key Result Measures FY 2014 Actual Operations and Maintenance Department Summary FY 2015 Expected FY 2016 Projected Measure Target Collection System: Number of bypass events Number of spill events Number of basement backup events Effluent Quality Percent of time BOD limit is met Percent of time TSS limit is met Percent of time Ammonia limit is met Percent of time Phosphorus limit is met Percent of time Fecal Coliform limit is met Percent of time Chlorides limit is met Struvite Production Tons of struvite produced Energy Usage Purchased electricity per gallon treated (kwh/gal) Adopted Budget 2016 Change from 2015 Budget % Change from 2015 Budget Budget Category Estimate Budget Personnel Services 5,520,472 5,590,140 5,909, , % Energy 3,286,070 3,225,128 3,313,605 27, % Asset Addition, Repair and Replacement 1,328,655 1,389,976 1,237,700-90, Contract Services 1,400,725 1,376,805 1,366,030-34, % Material, Supplies & Misc. 1,605,715 1,470,510 1,507,100-98, % Department TOTALS 13,141,637 13,052,559 13,333, , % Changes to the Budget Total Department Budget As shown in the Department Summary Table, the 2016 budget request for the Operations and Maintenance Department is $192,029 more than in the 2015 budget. This is an increase of 1.46%. Major factors contributing to the requested increase are an employee wage increase, a reduction in the number of labor hours that will be spent on capital projects, and the reassignment of a position within the department. 73
79 Personnel The budget for personnel services is $388,759, or 7.04%, higher than the 2015 budget. Part of the increase is due to a 2% increase in base wages, adjustments due to longevity, step raises, and mid-year performance reviews. In addition, fewer labor hours will be spent on capital projects in Therefore, a higher percentage of employee wages will be spent through the operating budget than in When capital projects labor is included, the actual increase in salaries for the department is 4.8%. The budget includes a new engineering position within the O&M Department. The Compliance Engineer will have multiple responsibilities, one of which will be regulatory compliance monitoring. It has become evident that maintaining strict compliance with the complexities of the air emissions permit requires a commitment of staff time that has not been addressed in the past. To ensure that the District remains in compliance with both air and water permits, the Compliance Engineer will develop and maintain schedules of permit-required submittals, records, and reports, and will also help with the heavy workload of operations supervisors and managers by assisting with hands-on process control activities. In addition, the Compliance Engineer will be responsible for designing and managing maintenance and repair projects smaller in scope than projects normally handled by the District s Engineering Department. Lastly, this position will assist with condition assessment activities associated with the District s Asset Maintenance program. This will not be an increase in full time equivalent (FTE) positions within the department. In 2015, we experimented with contracting janitorial services instead of filling a vacant custodial position. The 2016 budget continues this contractual arrangement and does not include a custodial position. The FTE position will instead be filled by the Compliance Engineer. The total salary will be increased in recognition of the higher pay rate needed for this position. Energy The 2016 budget for energy will be 0.84% higher than the 2015 budget. Electricity expenses for 2015 at both the treatment plant and pumping stations are expected to be less than budgeted. This is mainly due to dry weather which resulted in reduced water flow in the collection system. The 2016 electrical budget for the treatment plant was reduced by 2% to recognize the energysavings resulting from equipment replacement. However, the electrical budget for pumping stations has been increased, due to the operation of Pump Station 18. More natural gas is being used than expected. Natural gas is purchased to supplement the digester gas used for fuel in the boilers. Use of the steam boilers installed in the 11th Addition has also increased the amount of natural gas needed. Because of the relatively low price of natural gas compared to electricity, natural gas is purchased to keep the generator engines running at peak output. The 2016 budget shows increased costs for this fuel source. Asset Addition, Repair, and Replacement The 2016 budget for this category is $90,955, or 6.85%, less than 2015 budget levels. This category includes major projects and purchases, which are normally not recurring expenses. The 2015 projects that will not carry over to 2016 include air leak repairs, two replacement 74
80 vehicles, replacement of all telemetry radios on one frequency, expansion tanks on the hot water system, and wet well repair work at a pump station. When deciding what projects to include in the budget, the entire O&M Department budget is considered. To help minimize the increase in the District s overall budget, several repair and replacement items proposed by department supervisors were not included in this budget request. Major asset addition, repair, and replacement expenses in 2016 will be: $12,200 Electrostatic painting of fencing around process tanks $18,000 Replacement of the exterior stairs to the Operations Building $30,000 An additional vehicle for the electrical maintenance section $20,000 Replacement of a loading pump in the Vehicle Loading Building $20,000 Painting of the exterior of the Vehicle Loading Building $10,000 Sandblasting and painting the interior of a Metrogro nurse tank $30,000 An Operator safety alert system $40,000 Improvements to the effluent reuse disinfection system $28,500 Ultraviolet disinfection system control boards and lamps $25,000 Improvements to the polymer piping system $25,000 Safety improvements to the enclosures on the digesters $40,275 Addition of a platform on the H2S removal vessel to increase employee safety $25,000 An on-line phosphorus analyzer for the struvite harvesting system Many of the 2016 expenses address safety issues. The truck for the electrical section will allow all District electricians to work independently, thereby increasing the efficiency of this workgroup. The on-line phosphorus analyzer will allow adjustments to be made more frequently to the struvite harvesting system to maximize the production of struvite. This will result in increased revenue from the sale of struvite, and help reduce the recycling of phosphorus within the treatment plant. Contracted Services Contracted services for 2016 will decrease by $34,695, or 2.48%, compared to the 2015 budget. The main reason for the decrease is the decision to delay full-scale production of Metromix, a biosolids product that could be used by landscapers, homeowners, or anyone who needs a soillike material containing nutrients. Marketing efforts will continue to determine how to best promote and use the material. Metromix is considered to be a Class A biosolids material by EPA. To meet these standards, biosolids must be anaerobically digested at higher temperatures for a specified length of time. These biosolids are then dewatered on a centrifuge using polymer. The 2015 budget included polymer costs and funds to purchase amendments to mix with the biosolids. These costs have been removed from the 2016 budget. Digesting at the higher temperatures reduces the amount of solids. Since it will not be necessary to digest the biosolids for the specified length of time, more biosolids will be able to be digested at the higher temperature, which will reduce the total volume of material that will need to be recycled through the Metrogro program. This will further reduce the costs of that program. 75
81 The new Maintenance Facility will be placed in service in early Rather than increase staff to perform janitorial services in that building, funds are included in the budget to contract with a janitorial service. To ensure that assets are properly maintained, the maintenance section has used a professional technical writer to develop standard operating procedures. The 2016 budget includes funds to continue this project. Fencing around process tanks is attacked by hydrogen sulfide. A contract to use electrostatic painting to protect the fencing is included in the budget, as is a contract to paint the exterior of the Vehicle Loading Building. Worker safety will be improved by construction of a platform on top of the vessel that removes hydrogen sulfide from digester gas. The lack of a platform makes it difficult for workers to change the media in this vessel each year. Since 2014, the District has funded research on a process to remove nitrogen and phosphorus from wastewater using low levels of dissolved oxygen; this would lead to significant energy savings, since roughly half the annual cost of electricity at the plant goes to adding air to the aeration tanks. The 2016 budget includes funds to continue this research. Materials, Supplies, and Miscellaneous The 2016 budget for these items is $98,615 less than was budgeted in 2015, for a total budget of $1,507,100. The major expense items in this category are chemicals used in treatment processes, gasoline and diesel fuels, lubricants, and water from the Madison Water Utility. Polymers make up a major portion of this budget. They are used for thickening the solids fed to the digesters, thickening the digested biosolids, and centrifuge dewatering of the biosolids being converted to Metromix. Since the District will be delaying full production of Metromix, the elimination of the polymer used to make this product is a major reduction in overall costs. One cost increase in this category is the water utility s rate increase of almost 80%. Since water bills for the treatment plant and pump stations also include charges for sewer service in some cases, fire protection, and stormwater management, the entire water bill will not increase by this large percentage. Ferric chloride is used to control phosphorus recycle in the plant and to reduce the amount of hydrogen sulfide in digester gas. This process keeps air emissions within the limits set by the District s permit. Costs for ferric chloride are expected to increase in Sodium hypochlorite is used for disinfection of the treatment plant effluent that is used as an alternative to city water. The struvite harvesting process uses sodium hydroxide to control the ph of the process. Citric acid is also used in this process to keep the dryers clean. The cost of these chemicals has been fairly stable. 76
82 SECTION 7 Nine Springs WTP Projects Appendices Appendix A: Project Summaries A01. New Maintenance Facility/Space Needs Improvements A new maintenance facility will provide District staff with the necessary tools and equipment to address maintenance space needs well into the future. In August 2012, the District hired Bray Architects to conduct a space needs analysis for its existing maintenance facilities and operations space in order to help determine the best longterm facilities solution for its maintenance and operation needs. The District spent $37,000 in 2012 and $47,000 in 2013 to finish the needs study and the related design phase completed in Construction of the new maintenance facility will take place during 2015 followed by space needs improvements to the existing Maintenance Shop 1 and Operations Building in District staff anticipates total project costs of $12 million, financed with a Clean Water Fund loan. A02. Plant Energy Projects Improving the efficiency of the Plant s energy systems will reduce overall Plant energy use and improve Plant performance. The purpose of this work is to address projects identified during the 2013 Energy Study, potentially relating to the Plant s generation systems and process improvements, and changes required by the District s permit renewal in The CIP includes $12 million in funds as a placeholder for these related projects. Cost estimates and project details will be presented as they become more refined. The projection anticipates further study and planning through 2017, design in , and construction in Project financing is anticipated through the Clean Water Fund loan program. In the interim, the District plans to conduct a review of its aeration systems (aeration system efficiency improvements were considered in the Energy Study) to determine their adequacy and efficacy see A03 and A07 below. A Liquid Processing Facilities Plan This facilities plan will investigate the condition, reliability, and efficiency of the District s aerations systems (project A07), as well as determining the peak capacity of the Plant s entire liquid process train (project A09), including the Headworks Facility, primary tanks, aeration systems, ultraviolet disinfection (UV) system, and effluent systems. Additionally, the condition of the District s Headworks Facility (project A10) and UV System (project A11), and several unit substations (project A08) will be investigated. As a part of the aeration system assessment, the energy efficiency of the aeration systems will be investigated. The facilities plan is targeted to begin in late 2015 through 2016, with associated costs estimated at $977,000. It is anticipated that the cost of this 77
83 facilities plan will roll into future related project costs for projects that are funded with a Clean Water Fund loan. A04. Struvite Harvesting Facility and W4 System Improvements The District s Struvite Harvesting Facility recovers valuable phosphorous resources and helps protect Dane County s waterways by reducing like amounts in the District s biosolids. The capital projects projection includes almost $3.5 million as a placeholder for improvements to the District s Struvite Harvesting Facility and the W4 (effluent reuse) System within the new facility. At this time, specific improvements have not been identified; however, certain improvements will be required to optimize the new facility s systems. Smaller allowances have been included in the near term to identify and address more immediate concerns, with greater funding anticipated at a later date presently shown in year The plan is to fund smaller projects from reserves where possible, while potentially funding any resulting larger projects with a Clean Water Fund loan. A05. Metromix Facility Expansion Diversifying the District s biosolids program will help to ensure long-term markets for the District s biosolids. This project would expand the size of the existing Biosolids End- Use Facility, providing additional space to process and store soil-amendment products. The CIP includes $2.0 million for this project, anticipating planning and design in , with construction in Funding would be through the Clean Water Fund Loan program. A06. Capital City Recreational Trail Relocation at Vehicle Loading Building The Capital City Recreational Trail provides valuable recreation to the community and presently routes directly in front of the District s Vehicle Loading Building along South Towne Drive and along Moorland Road. The Moorland Road gate provides the entrance for Metrogro vehicles to the Vehicle Loading Building, while the South Towne gate provides the exit from the facility. During the hauling season, a significant amount of vehicle traffic crosses the bike path on a routine basis and has raised a number of safety concerns. Relocating the bike path behind the facility would reduce safety concerns and provide a better overall route. The projection includes a total of $116,000 to relocate the bike path in A07. Plant Aeration System Projects Improving the condition and efficiency of the Plant s aeration systems will improve Plant reliability and performance. The purpose of this project is to address issues related to inefficiencies, replacement, and operations and maintenance of the secondary treatment system aeration-related equipment including blowers, diffusers, control systems, electrical systems, dissolved oxygen probes, and transmitters. The CIP includes $9.4 million in funds as a placeholder for these related projects. Cost estimates and project details will be presented as they become more refined following facilities planning identified in summary A03. The projection anticipates design in , construction in , and financing through the Clean Water Fund loan program. 78
84 A08. Plant Unit Substation Improvements Improving the Plant s system of low voltage substations will help insure reliable power for Plant operation. Three of the District s low voltage unit substations are approaching the end of their useful lives. This project will update the power system as necessary to maintain power to all Plant loads fed by these substations. Related planning is included in the 2016 Liquid Processing Facilities Plan project (A03). The CIP includes $2.9 million, with design in , construction in 2019, and anticipated project funding with a Clean Water Fund loan. A09. Plant Peak Capacity Improvements Adding capacity or diversion capability will help the District address peak flows to the Plant. With the construction of Pumping Station 18, the conveyance system has the potential to overwhelm the Plant s hydraulic capacity. Potential alternatives to address this concern include, but are not limited to, adding influent storage, adding diversion/return capacity to/from the lagoons, blending options, and adding Plant capacity to the areas that are hydraulically deficient. The CIP includes a $4.3 million placeholder to address peak flows. Related planning is included in the 2016 Liquid Processing Facilities Plan project (A03), with design planned for , and construction in 2019 and The Plan anticipates financing through the use of a Clean Water Fund Loan. A10. Headworks Facility Rehab Project Keeping the Plant s Headworks Facility in proper working condition will help provide effective Plant operation. The Headworks Facility provides screenings and grit removal for the entire Plant; processes that require significant attention and maintenance. The intent of this project is to address issues related to inefficiencies in the operations and maintenance of raw wastewater screening, screenings handling, grit handling, and septage receiving equipment and facilities. The project will also investigate the possibility of providing back-up power for the Headworks Facility. The CIP includes $3.9 million as a placeholder for related work. Related planning is included in the 2016 Liquid Processing Facilities Plan project (A03) with design planned for , and construction in The Plan anticipates financing through the use of a Clean Water Fund loan. A11. UV Disinfection System Replacement/Rehab Replacing the District s aging infrastructure will help insure the District continues to treat its wastewater successfully and operate within its permit limits. The ultraviolet disinfection system, installed during the Ninth Addition in the mid-1990s, will need refurbishment or replacement to continue properly disinfecting the District s effluent prior to discharge from the Plant. Related planning is included in the 2016 Liquid Processing Facilities Plan project (A03) with design planned for and construction following in The CIP includes $5.2 million as a placeholder with funding anticipated through the use of the Clean Water Fund loan program. 79
85 A12. Annual Clarifier Coating Recoating clarifiers and other tanks increases their life and value, ensuring that they can serve the District s operation well into the future. The 2015 budget included funds to sandblast and coat the metal components on two final clarifiers. For 2016, we have included $170,000 to coat two more tanks. The 2016 coating projects will be funded from Capital Fund reserves. Future coating projects have been included in the CIP through the year A13. Annual Pavement Improvements Replacing the District s damaged roadways provides unimpaired access for District and customer vehicles; where possible, the District looks at environmentally friendly alternatives. The 2015 budget included just $30,000 in funds to replace damaged roadways within the Plant. Subsequent years include $53,000 for improvements in year 2016, increasing by 3% annually. Pavement projects are typically funded through Capital Fund reserves. A14. Metrogro Applicators New applicators will ensure that the Metrogro program remains the backbone of the District s biosolids reuse program. Originally, the District planned to purchase three Metrogro applicators individually, one in each of the years 2017, 2019, and 2021; the applicators would replace existing aging applicators presently in use. The District has since purchased a used applicator in 2015 at a cost of roughly $170,000, which includes the applicator s purchase price, travel, transportation, and improvements to bring the applicator up to the District s standard operating needs. The District s revised plans include two additional applicator purchases in 2018 and 2020 with the projection now including $1.33 million to cover the cost of the 2015 applicator purchase plus the two additional applicators. Funding will be from Capital Fund reserves. Conveyance System Projects INTERCEPTOR PROJECTS B01. NEI-Rehab West of Airport Phase 1 (lining project) Approximately 2,100 feet of the Northeast Interceptor, located west of the Dane County Airport, was found to be deficient and in need of rehabilitation via a cured-in-place liner. Insertion of a liner was completed at the end of 2014 to bring the interceptor back up to District standards. Staff estimates final total project cost for Phase 1 at $1.10 million with project funding coming from Capital Fund reserves. Phases 2 and 3 of this project will address defects in approximately 4,500 feet of sewer, which is adjacent to the Phase 1 limits. The defects in Phases 2 and 3 are not considered as severe as those in Phase 1 and thus, these phases can be deferred beyond this six-year CIP in order for more pressing needs to be addressed. 80
86 B02. West Int.-West Randall to Near PS2 (lining project) This interceptor was constructed in 1916 and is one of the District s oldest facilities in the collection system. The District s sewer televising program identified this portion of the West Interceptor along Randall Avenue and Regent Street to be deficient and in need of lining. Flow monitoring was performed on the interceptor in November 2014 to assess existing flows, and a flow study report was completed in May Assuming the interior of the sewer is suitable for lining, approximately 5,000 feet of 24-inch sewer will be lined in 2016 at an estimated cost of $1.38 million. The District will finance this project with a Clean Water Fund loan. B03. Rimrock Int. Replacement/Relief Replacing and rehabilitating the District s Rimrock Interceptor will improve the District s conveyance system by decreasing inflow and infiltration. The District televised the Rimrock Interceptor in 2009, finding a variety of deficiencies in this 56-year old facility that included areas with root intrusion, sags, and infiltration. This sewer section has also been under further evaluation for capacity relief. Present plans include replacing and upsizing approximately 2,200 feet of 12 sewer to 15 sewer and lining approximately 1,600 feet of existing 12 sewer. Final design of the project will be completed in the summer of 2015, with construction scheduled to begin in October It is anticipated that a Clean Water Fund loan will be used to finance the total project cost of $849,000. B04. NSVI-Morse Pond Extension A new interceptor to the Morse Pond area will provide sewer service for new regional development and serve multiple jurisdictions. This project extends a leg of the District s Nine Springs Valley Interceptor (NSVI) to the Morse Pond area to serve future development near the intersection of County Highways M and PD, north of the City of Verona. Approximately 3,600 feet of new interceptor will serve growth in the Cities of Verona and Madison. Final design will be completed in 2015, with construction planned for Staff estimates total project costs at $1.43 million with project funding from Capital Fund reserves. B05. NSVI-Mineral Point Ext. Relocation at CTH PD (See C06 - PS 12 Force Main Relocation at Verona Rd) B06. Northend Int. Sherman Avenue (lining project) This short section of interceptor along Sherman Avenue is in need of rehabilitation. Lining this portion of the Northeast Interceptor will address condition deficiencies in the 87-year old sewer and prolong its service life. The section to be lined consists of 1,480 feet of 10-inch and 12-inch sewer. District staff anticipates lining this sewer in 2016 at a total project cost of $165,000, with funding from Capital Fund reserves. B07. NEI-Rehab West of Airport Phase 2(lining project) As part of the District s ongoing sewer maintenance program, the District televises portions of its interceptor system on an annual basis. This portion of the Northeast Interceptor, located west of the Dane County Airport, was found to be deficient and in need of lining. Lining this portion of the District s Northeast Interceptor will bring it back 81
87 up to District standards and ensure long-term quality service for the customers served. Lining will consist of three phases, with Phase 1 construction substantially completed in Phases 2 and 3 of this project will address defects in approximately 4,500 feet of sewer, which is adjacent to the Phase 1 limits. The defects in Phases 2 and 3 are not considered as severe as those in Phase 1 and thus these phases can be deferred beyond this six-year CIP in order for more pressing needs to be addressed. B08. Lower Badger Mill Creek Int. Phase 4 Completion of the Lower Badger Mill Creek Interceptor will provide gravity sewer service for the entire Lower Badger Mill Creek drainage basin. Phase 3 construction was completed in 2013 as a joint project between the District, the City of Verona, and Epic Systems Corporation. This project extended service 900 feet further to the north from the location where Phase 2 ended near Northern Lights Road in Verona. Staff anticipates that Phase 4, about 3,850 feet of sewer from the end of Phase 3 to County Highway PD, will be constructed in 2017 to provide service to future expansion of the Epic campus and/or new development to the north of County Highway PD. Total project costs for Phase 4 are estimated at $970,000, with funding anticipated from Capital Fund reserves. B09. NEI-Truax Extension Rehab -Phase 1 (lining project) Approximately two miles of the Truax Extension, from the end of the Pumping Station 13 Force Main to Lien Road, have been found to be deficient and in need of rehabilitation. Lining the Northeast Interceptor from Lien Road to the end of the Pumping Station 13 Force Main will correct existing condition defects and prolong the service life of the sewer. This first phase, scheduled for 2018, will cover approximately one-third of the distance. Design of the second phase of the project will occur in 2019 with construction scheduled for Phase 3 of the project is scheduled for design in 2021 and construction in District staff anticipates funding the Phase 1 costs of $1.98 million with a Clean Water Fund Loan. B10. West Int. PS 5 to Gammon Extension (lining project) This section of the West Interceptor was inspected in 2009 as part of the District s sewer televising program and was found to be suffering from internal corrosion. Rehabilitation of the sewer will include lining 3,550 feet of 18-inch diameter sewer upstream of Pump Station 5 to extend the service life of this 83-year old facility. The project is scheduled for 2018 construction and will cost roughly $550,000, with funding anticipated from Capital Fund reserves. B11. SEI Rehab upstream of PS 9 (lining project) This section of the Southeast Interceptor, located in the Village of McFarland near the intersection of U.S. Highway 51 and the Yahara River, receives flow from three customer communities (Village of McFarland, Town of Dunn #3 Sanitary District, and Town of Dunn-Kegonsa Sanitary District). Due to the number and type of connections into the interceptor and the geometry of the upstream manhole, significant corrosion has taken place over the years. The District rehabilitated the upstream manhole in 2014 due to corrosion issues and recent inspection of the downstream interceptor segment reveals 82
88 that corrosion is prevalent there as well. Current plans propose to install a cured-inplace liner in a 72-foot interceptor segment that crosses U.S. Highway 51 in Total project costs are estimated at approximately $280,000, with funding anticipated from Capital Fund reserves. B12. NEI-Far East Int. to SE Int. Junction (lining project) This section of the Northeast Interceptor consists of 5,600 feet of 48-inch diameter reinforced concrete sewer. Televised in 2010 and 2011 as part of the District s sewer televising program, the interceptor contains defects related to corrosion of the interior concrete surface. Approximately 2,300 feet of the section was recently abandoned upon completion of the District s NEI - Far East Int. to Southeast Int. Replacement/Relief project. District staff anticipates lining the remaining 3,300 feet of sewer in 2019 at a cost of $1.62 million with funding from a Clean Water Fund loan. B13. NEI-Truax Extension Phase 2 (lining project) Approximately two miles of the Truax Extension, from the end of the Pumping Station 13 Force Main to Lien Road, have been found to be deficient and in need of rehabilitation. Lining the Northeast Interceptor from Lien Road to the end of the Pumping Station 13 Force Main will correct existing condition defects and prolong the service life of the sewer. The first phase, scheduled for 2018, will cover approximately one-third of the distance. Design of the second phase of the project will occur in 2019, with construction scheduled for Phase 3 of the project is scheduled for design in 2021 and construction in District staff anticipates funding the Phase 2 project costs of $2.25 million with a Clean Water Fund loan. B14. West Int. Spring Street Relief (lining project) Lining this portion of the West Interceptor will help maintain the integrity of the District s conveyance system. This lining project includes 4,580 feet of West Interceptor sewer located in downtown Madison near Regent Street. The District televised the sewer and found it to be deficient. The design for lining this sewer will begin in 2019, with lining anticipated in 2020 at an estimated cost of $990,000. Funding for this project is anticipated to be with a Clean Water Fund loan. B15. Lower Badger Mill Creek Int. Phase 5 Completion of the Lower Badger Mill Creek Interceptor will provide gravity sewer service for the entire Lower Badger Mill Creek drainage basin. Phase 3 construction was completed in 2013 as a joint project between the District, the City of Verona, and Epic Systems Corporation. This project extended service 900 feet further to the north from the location where Phase 2 ended near Northern Lights Road in Verona. Phase 4 of the project is scheduled for construction in 2017 and will extend service to County Highway PD. The final phase of this project, Phase 5, will extend the sewer 8,500 feet from County Highway PD to Midtown Road. Construction is tentatively scheduled for 2022, with need based on the rate of growth in the basin. With completion of Phase 5, all flows in the Lower Badger Mill Creek drainage basin will flow to the District s Pump Station 17. Total project costs for Phase 5 are estimated at $3.11 million and funding is 83
89 84 yet to be determined since the project may not be eligible for funding from a Clean Water Fund loan. B16. NEI-Waunakee Ext. Relief Phase 1 Capacity relief for this portion of the District s conveyance system will ensure reliable service continues to those customers served by this interceptor. This project will provide additional capacity in the Waunakee Leg of the Northeast Interceptor (Waunakee/DeForest Extension). An analysis of this interceptor by the Capital Area Regional Planning Commission (CARPC) identified the need to provide capacity relief for approximately 24,000 feet of 21-inch to 30-inch sewer prior to Phase 1 of the project will address the most critical sections of the interceptor which comprise a length of approximately 17,000 feet. Phase 1 of the project is tentatively scheduled for design in 2021, with construction in The project timeline is subject to the rate of growth in the basin and the need for capacity relief. Phase 2 of the project is not within the sixyear planning horizon. Staff anticipates funding the total project cost of $10.43 million for Phase 1 with a Clean Water Fund loan. B17. West Int. Relief Sewer Walnut Street to Whitney Way CARPC identified several sections of the West Interceptor Relief sewer that are in need of capacity relief in their 2009 report on the District s conveyance system. These sections comprise approximately 11,500 feet of sewer ranging in diameter from 24-inch to 36-inch along the University Avenue corridor between Walnut Street and Whitney Way. At this time, the District is contemplating a multi-year, three-phase construction project that will be closely coordinated with a major storm sewer relief project initiated by the City of Madison in the same corridor. Design of the interceptor relief project is scheduled to begin in 2021, with construction commencing in 2022 and ending in The total project cost of $15.15 million is anticipated to be funded with a Clean Water Fund loan. B18. NEI-Truax Extension Rehab Phase 3 (lining project) Approximately two miles of the Truax Extension, from the end of the Pumping Station 13 Force Main to Lien Road, have been found to be deficient and in need of rehabilitation. Lining the Northeast Interceptor from Lien Road to the end of the Pumping Station 13 Force Main will correct existing condition defects and prolong the service life of the sewer. The first phase, scheduled for 2018, will cover approximately one-third of the distance. Design of the second phase of the project will occur in 2019, with construction scheduled for Design of Phase 3 is scheduled for 2021, with construction occurring in District staff anticipates funding the Phase 3 costs of $2.12 million with a Clean Water Fund loan. PUMPING STATIONS & FORCE MAINS PROJECTS C01. PS 18 Construction Pumping Station 18 and its force main will increase the capacity and reliability of the District s conveyance system. Pumping Station 7 is expected to reach firm capacity prior
90 to the year A new Pumping Station 18, located just off of East Broadway in Monona, will provide capacity relief for Pumping Station 7 and provide much needed redundancy for the east side of the District s collection system. Design of the project began in May 2011, and the pump station was placed into service in April of The Pumping Station 18 Force Main and Northeast Interceptor Relief (SEI Junction to FEI Junction) projects have been fully coordinated with the construction of the new Pumping Station 18. Total project costs, estimated at $14.8 million, are being financed with a Clean Water Fund loan. C02. PS 18 Force Main Construction The Pumping Station 18 Force Main will provide the means to convey raw wastewater from Pumping Station 18 to the Headworks Facility at the Nine Springs Wastewater Treatment Plant. Approximately 650 feet of 42-inch pipe was installed at the treatment plant during construction of the Plant s Tenth Addition in anticipation of this project. An additional 15,000 feet of 48-inch force main was constructed as part of this project. Design began in May 2011 in conjunction with the design of Pumping Station 18 and relief of the Northeast Interceptor between the Southeast Interceptor and the Far East Interceptor. Total project costs for the force main construction are estimated at $12.4 million. The project was substantially completed in December of 2014, and the force main was placed into service in April of The District is financing this project with a Clean Water Fund loan. C03. PS 11 & 12 Rehab Rehabilitating Pumping Stations 11 and 12 will bring older facilities to like-new condition. The District has identified many of its pumping facilities as needing rehabilitation and improvements to bring them up to proper standards. The District prioritized its needs in its updated Collection System Facilities Plan (approved by WDNR in July of 2012). The Plan determined that Pumping Stations 11 and 12 are both in need of rehabilitation and require a closer look at their long-term capacity needs. The District constructed Pumping Station 11, located on Clayton Road to the southwest of the Plant, in 1966 and constructed Pumping Station 12, located on Fitchrona Road, in A construction contract was awarded in September of 2014, and construction began in February of Final completion is anticipated in May The total project cost estimate of $10.66 million is being financed with a Clean Water Fund loan. C04. PS 15 Rehab Pumping Station 15 is another pumping facility that the District has identified as needing rehabilitation and improvement to bring it up to proper standards. Upgrading Pumping Station 15 will ensure that reliable sewer service continues. Pumping Station 15, located on Allen Boulevard on the west side of Lake Mendota, needs rehabilitation and a closer look at long-term capacity needs due to the proposed Bishops Bay development in the City of Middleton and Town of Westport. The District started up Pumping Station 15 in Design of the improvements began in February of 2015 and should be completed by the end of this year. Construction is scheduled for 2016 and The District 85
91 anticipates financing the total project cost of $4.68 million with a Clean Water Fund loan. C05. PS 7 Improvements Phase 1 (Phase 1 work deferred and likely integrated into Phase 2 C12) Improving Pumping Station 7 following the construction of Pumping Station 18 will ensure redundant and reliable service for the District s east side well into the future. Although a new Pumping Station 18 provided significant relief to Pumping Station 7 and the District s east-side conveyance system, Pumping Station 7 is still critical to the District s operation and in need of condition-based improvements. District staff identified several potential needs at Pumping Station 7 that include the following: replacement of existing controllers and the control system; replacement/upgrade of the electrical switchgear; installation of an odor control system and upgrades to the HVAC system; installation of screenings equipment; separating the control room from the garage area and screen room; installing variable speed drives to optimize pumping operations; firm capacity upgrade; and installation of electric valve actuators. Since the need and/or timing for many of the improvements is dependent on how Pumping Station 7 interacts with Pumping Station 18, staff initially proposed that the most pressing needs be addressed in a near term project, Phase 1, while assessing the remainder of the improvements following several years of operating Pumping Station 18 in parallel with Pumping Station 7. Phase 1 improvements for Pumping Station 7 originally included replacing controllers and the control system in Phase 2 improvements, tentatively scheduled to start in 2021, included the remaining improvements as determined from follow-up assessments. However, further evaluation in mid-2015 determined that the existing control system still works reasonably well and that the District has a relatively large inventory of spare controllers. Given that, staff feels that the existing control system is maintainable until the Phase 2 improvements are needed. Thus, all project costs have been included in Phase 2, and Phase 1 and Phase 2 will most likely be integrated into a single project. An allowance of $2.90 million for the Phase 2 improvements has been included in the CIP with funding anticipated from a Clean Water Fund loan. C06. PS 12 FM Relocation at Verona Road (formerly NSVI-Mineral Point Ext. Relocation at CTH PD) Due to major road improvements proposed by the Wisconsin Department of Transportation near the intersection of Verona Road and County Trunk Highway PD, a portion of the Pumping Station 12 Force Main requires relocation due to its current condition and future location underneath a busy highway. System capacity and safety will also be improved as part of the relocation. Staff anticipates that this relocation work will be required before road construction begins and is planning for design to begin in late 2015, with construction to be completed by the end of The total project cost of $2.58 million is anticipated to be funded through a Clean Water Fund loan. 86
92 C07. PS 17 Force Main Relief Phase 1 Relief of the Pumping Station 17 Force Main will provide additional capacity to serve the City of Verona and the far west side of Madison. With future completion of the Lower Badger Mill Creek Interceptor, Pumping Station 17 and its force main will need capacity relief. This project anticipates construction of the relief force main in two phases. In Phase 1, approximately 4,600 feet of force main will be constructed in 2017 in conjunction with the construction of the City of Verona s East Interceptor Relief sewer. Total project costs for Phase 1 are projected at $1.09 million. The plan anticipates construction of the remaining 9,400 feet of force main in Phase 2 in approximately Staff presently anticipates funding Phase 1 from Capital Fund reserves, subject to availability of funds. C08. PS 10 Force Main Rehab Rehabilitation of the Pumping Station 10 Force Main is needed to restore this critical piece of infrastructure to District standards. In 2014, the end of the 36 diameter force main was inspected by closed-circuit television and approximately 700 feet of concrete pipe upstream of Buckeye Road was found to be deficient due to corrosion. This type of defect is very similar to those seen in other portions of the Northeast Interceptor system which have been rehabilitated in the last ten years. Rehabilitation will require live tapping the force main and constructing a temporary bypass system to allow insertion of a cured-in-place liner into the defective piping. Design is scheduled to begin in 2017, and construction will occur in The total project cost of $900,000 is anticipated to be funded through a Clean Water Fund loan. C09. PS 13 & 14 Rehab Upgrading District Pumping Stations 13 and 14 will improve the north side of the District s conveyance system and bring both pumping stations up to present day standards. The District s Pumping Station 13, located at Amelia Earhart Drive near Truax Field, and Pumping Station 14, located near the corners of School and Wheeler Roads, have both been identified in the District s Collection System Facilities Plan as needing rehabilitation and improvements to bring them up to the proper standards. The District constructed Pumping Station 13 in 1970 and Pumping Station 14 in Preliminary costs for the project are estimated at $12.51 million, with design beginning in 2018, and construction occurring in 2019 and The District anticipates financing this project with a Clean Water Fund loan. C10. PS 4 Rehab Rehabilitation of this pumping station will improve conveyance system reliability and prevent backups. Constructed in 1967 along John Nolen Drive, Pumping Station 4 was identified in the Collection System Facilities Plan as requiring capacity upgrades, modifications to aging electrical equipment, and enhancements to the power supply system. Staff anticipates total project costs at $4.32 million with design beginning in 2019, and construction in The District anticipates financing this project with a Clean Water Fund loan. 87
93 C11. PS 17 Capacity Upgrade Capacity improvements at Pumping Station 17 will provide additional capacity to serve the City of Verona and the far west side of Madison. With future completion of the Lower Badger Mill Creek Interceptor, Pumping Station 17 and its force main will need capacity relief. This project anticipates construction to upgrade the capacity of Pumping Station 17 prior to the expected completion of the entire Lower Badger Mill Creek Interceptor in The plan also anticipates construction of the second phase of the Pumping Station 17 Force Main in Design of the pump station upgrade is anticipated to begin in 2020, with construction in 2021 and The District anticipates funding the $2.60 million project cost with a Clean Water Fund loan. C12. PS 7 Improvements Phase 2 (Refer to C05 for a summary of PS 7 Improvements) C13. PS 17 Force Main Relief Phase 2 Relief of the Pumping Station 17 Force Main will provide additional capacity to serve the City of Verona and the far west side of Madison. With future completion of the Lower Badger Mill Creek Interceptor, Pumping Station 17 and its force main will need capacity relief. This project anticipates construction of the relief force main in two phases. In Phase 1, approximately 4,600 feet of force main will be constructed in 2017 in conjunction with the construction of the City of Verona s East Interceptor Relief sewer. The plan anticipates construction of the remaining 9,400 feet of force main in Phase 2 in approximately The total project costs for Phase 2 are estimated at $2.52 million, with funding anticipated from a Clean Water Fund loan. Capital Budget Expenses D01. Asset Management Program Asset Management is a systematic, best appropriate practice approach to managing infrastructure more cost-effectively while maintaining levels of service and managing risk (the likelihood of failure and the consequence of such failure). The purpose of this program is to develop an integrated program that will achieve those objectives. To provide additional program support going forward, we have increased funding levels for ongoing program administration and projects related to it; $515,000 has been included for year Further details are included in the business case on the Asset Management Program found in the 2016 Budget Supplement Document located at 88
94 Appendix B: Completed Projects & Retainers 2014 Project Completions Eleventh Addition to Nine Springs WTP The Eleventh Addition to Nine Springs Wastewater Treatment Plant contract was completed in mid-2014 with final project costs totaling $47.5 million. The District received the final Clean Water Fund Loan disbursement in January The project included multi-faceted improvements to the Plant that: Increased the Plant s solids handling capacity to the year Improved biosolids handling with a higher temperature digestion process providing the District with Class A biosolid products and the ability to diversify its biosolids program. Harvests struvite from the District s biosolids processing stream, thereby decreasing the amount of phosphorous in its biosolids end products while improving Plant operations and allowing sale of the struvite back to the system vendor. Mitigated plant operational problems associated with grease and foaming. Design of the Eleventh Addition facilities, based on recommendations contained in the Solids Handling Facilities Plan, began in late 2009 and continued into fall Design phase costs totaled about $3.4 million. The project bid in fall 2011 and resulted in a $40 million construction contract awarded to C.D. Smith. Construction began in late 2011, with project completion in late Major work included construction of two acid digesters, two anaerobic digesters and related control building, a waste activated sludge thickening facility, a struvite harvesting facility, and other plant improvements. Lower Badger Mill Creek Int. - Phase 3 Construction of the interceptor for Phase 3 of the Lower Badger Mill Creek Interceptor was substantially completed in 2013, with documentation, follow-up televising, and several punch list items extending final project completion into This phase of the LBMC Interceptor included 900 feet of intercepting sewer extending northwards from the end of Phase 2 near Northern Lights Road in Verona. This section of interceptor was installed and paid for by Epic Systems of Verona and deeded to the District. NEI - Far East Int. to Southeast Int. Junction The Northeast Interceptor from its junction with the Far East Interceptor to its junction with the Southeast Interceptor consisted of approximately 5,600 feet of 48-inch concrete sewer that needed capacity relief. Design of the project began in May 2011 in close coordination with the Pumping Station 18 and Pumping Station 18 Force Main projects. Construction began in April 2013, with final project completion in July Final project costs totaled $8.0 million. The District financed the project with a Clean Water Fund loan. 89
95 West Int. Extension and West Point Extension (lining project) Final completion and acceptance of this project was in August 2014 at a final cost of $272,000. The project included lining a portion of the District s West Interceptor Extension and a portion of the West Point Extension, both in Middleton. The sewers were rehabilitated with installation of a cured-in-place liner. Annual Clarifier Coating The District coated Final Clarifiers 9 and 10 at a cost of $155,000. This is part of an ongoing project to upgrade and extend the life of the final clarifiers Project Completions/Anticipated Completions Engine Stacks & Oxidation Catalysts (for Air Permit) As part of the District s air permit, stacks were added to the District s combustion engines and boilers in In addition, an oxidation catalyst was added to Engine Generator 1. Over winter 2014 to 2015, two additional oxidation catalysts were installed on the remaining two combustion engines. The total project cost is roughly $255,000. Process Control System Upgrade The District s new process control system replaced a system that was installed in 1996 as part of the Ninth Addition to the Plant. Although fully functional, parts of the old system were obsolete and in need of new computers, software upgrades, and controller replacements. Facility planning took place during 2010 and 2011, with design beginning in late 2011, and implementation commencing in the fall of Implementation included replacement of the operations reporting system, purchase of a new development system, and construction to replace the process control system hardware and software. The installation contract is scheduled for completion in mid-2015 with final project completion by the end of Total project costs, anticipated at $5.0 million, were financed through a Clean Water Fund loan. NEI - Rehab West of Airport - Phase 1 (lining project) Lining of this section of the Northeast Interceptor, west of the Dane County Regional Airport, was substantially completed in 2014, with final completion in The total final project cost of roughly $1.1 million was funded from Capital Fund reserves. See project summary B01 for further details. Pumping Station 18 Construction Pumping Station 18, located just off Broadway in Monona, was fully completed and placed online in April, The new pumping facility provides capacity relief and redundancy for Pumping Station 7 and a major portion of the Southeast Interceptor. A more detailed description can be found in the related project summary C01. 90
96 PS 18 Force Main Construction The Pumping Station 18 Force Main was installed and tested by the end of Follow-up work, consisting primarily of landscaping and project clean-up, were generally complete by the first half of A more detailed description can be found in the related project summary C02. PS 16 Ventilation Modifications Ventilation modifications to Pumping Station 16 were underway in the spring of The changes include upgrading and improving the pumping station s existing ventilation system and addition of an odor control system. The project should be completed by the end of 2015 at an approximate cost of $200,000. Annual Clarifier Coating The District will coat Gravity Thickeners 1 and 2 in The cost to coat these two thickener tanks is estimated at $70,000 and is part of an ongoing project to upgrade and extend the life of the District s concrete tanks. Retainers The District often includes maintenance or performance retainers within its contracts. Following completion of the contract, and assuming satisfactory performance, the retainers are typically released to the contractor at the end of one year; in some cases, contracts include longer performance periods. The following are retainers that the District has released or are presently withholding: Pumping Station 6 & 8 Rehabilitation Released a $10,000, 3-year maintenance retainer to JF Ahern in March 2014, and released a $10,000, 3-year maintenance retainer to Forward Electric in April Operations Building HVAC Rehabilitation Released a $10,000, 1-year maintenance retainer to Mechanical Inc. in June NEI - Far East Int. to Southeast Int. Junction The District withheld a $20,000, 1-year maintenance retainer upon final project closeout. The retainer will be released to Merryman Excavation in 2015, pending satisfactory performance. West Int. Extension and West Point Extension (lining project) The District withheld a $5,000, 1-year maintenance retainer upon final project closeout. The retainer will be released to Terra Engineering & Construction Corporation in 2015, pending satisfactory performance. NEI - Rehab West of Airport - Phase 1 (lining project) The District will withhold a $10,000, 1-year maintenance retainer upon final project closeout. The retainer will be released one year after project closeout to Ric-Man Construction, Inc., pending satisfactory performance. 91
97 Pumping Station 18 Construction The District will withhold a $20,000, 1-year maintenance retainer upon final project closeout. The retainer will be released one year after project closeout to CD Smith Construction, Inc., pending satisfactory performance. PS 18 Force Main Construction The District will withhold a $30,000, 1-year maintenance retainer upon final project closeout. The retainer will be released one year after project closeout to S.J. Louis Construction, Inc., pending satisfactory performance. 92
98 Appendix C: Budget Summaries BUDGET SUMMARIES 2016 OPERATING BUDGET SUMMARY REVENUES Proposed Revenue Category 2015 Estimated Percent Thru June 2015 Total Budget Budget Change Sewer Service Charges $14,004,523 $28,372,000 $29,272,449 $31,590, % Servicing Pumping Stations 164, , , , % Rent 36,956 70,000 69,630 71, % Interest 7,387 12,000 12,000 13, % Annexation and Plan Review Fees 36,200 67,000 50,000 65, % Miscellaneous Income 38,095 70,000 45,000 55, % Septage Disposal Revenue 167, , , , % Pretreatment Monitoring - 18,000 18,000 18, % Struvite Fertilizer Sales 55, , , , % Cash Reserves , , % TOTAL REVENUES $14,509,925 $29,539,000 $30,883,079 $32,822, % EXPENDITURES Proposed Expenditure Category 2015 Estimated Percent Thru June 2015 Total Budget Budget Change Administration, Engineering & Commission $1,657,128 $3,453,000 $3,668,867 $3,901, % User Charge & PreTreatment Program 230, , , , % Wastewater Collection 803,710 2,100,000 2,273,971 2,334, % Wastewater Treatment 4,705,790 10,217,000 10,103,313 10,710, % Effluent Diversion 41, , , , % Metrogro Biosolids Reuse Program 503,660 1,545,000 1,585,584 1,516, % Capital Outlay 129, , , , % Servicing Pumping Stations Owned by Others 161, , , , % Contribution to Equipment Replacement Fund ,000 NMF Transfer to Debt Service Fund - 11,843,000 11,843,000 12,909, % TOTAL EXPENDITURES $8,233,462 $30,683,000 $30,883,079 $32,822, % OPERATING RESERVE BALANCE Proposed Operating Reserves 2015 Estimated Percent Thru June 2015 Total Budget Budget Change Beginning Balance $14,107,762 $14,107,762 $13,460,379 $12,964, % Ending Balance $20,384,225 $12,964,000 $12,856,379 $12,859, % NMF = No Meaningful Figure 93
99 94 CAPITAL PROJECTS BUDGET SUMMARY REVENUES Revenue Source 2015 Estimated Budgeted Budgeted Percent Thru June 2015 Total Amount Amount Change CWF Loan - Eleventh Addition 160, , NMF CWF Loan - Process Control System Upgrades 223,350 1,037, , % CWF Loan - Pumping Station ,450 1,447, , % CWF Loan - Pumping Station 18 FM 366, , NMF CWF Loan - Maintenance Facility/Space Needs Improvements 2,405,939 10,000,000 10,649,000 2,095, % CWF Loan - PS 11 & 12 Rehab 2,135,583 7,000,000 6,323,000 3,643, % CWF Loan - West Int. - West Randall to Near PS 2 (lining project) - - 1,333,000 1,372, % CWF Loan - Rimrock Int. Replacement/Relief - 267, , , % CWF Loan - Pumping Station 15 Rehabilitation ,985,000 NMF CWF Loan - PS 12 Force Main Relocation at Verona Road ,554,000 NMF CONNECTION CHARGE REVENUES 253, , ,000 1,050, % INTEREST ON INVESTMENTS & MISC. INCOME 18,307 34,000 34,000 38, % TOTAL SOURCES OF FUNDS $6,358,970 $21,741,000 $21,152,000 $14,309, % EXPENDITURES Project 2015 Estimated Budgeted Budgeted Percent Thru June 2015 Total Amount Amount Change NINE SPRINGS WASTEWATER TREATMENT PLANT PROJECTS Eleventh Addition ($16,811) $0 $20,000 $ % Engine Stacks and Oxidation Catalysts 18,459 19, NMF Process Control System Upgrade 206, , , % New Maintenance Facility/Space Needs Improvements 2,616,039 9,800,000 9,785,000 1,633, % Plant Energy Projects - 103, , , % Liquid Processing Facilities Plan - 50, , , % Struvite Harvesting Facility & W4 System Improvements ,000 NMF Metromix Facility Expansion ,000 NMF Capital City Recreational Trail Relocation at Vehicle Loading Bldg ,000 NMF Annual Clarifier Coating - 70, , , % Annual Pavement Improvements - 30,000 30,000 53, % Metrogro Applicators 150, , NMF INTERCEPTORS NEI - Far East Int. to Southeast Int. Junction 4,898 24,000 20, % West Int. Extension and West Point Extension (lining project) - 5,000 5, % NEI - Rehab West of Airport (lining project) - Phase I 68, ,000 13,000 10, % West Int. - West Randall to Near PS 2 (lining project) 7,970 50,000 1,288,000 1,313, % Rimrock Int. Replacement/Relief 25, , , , % NSVI-Morse Pond Extension 1,867 25, , , % NSVI - Mineral Pt. Ext. - Relocation at CTH PD (see PS 12 FM)* , % Northend Int. - Sherman Avenue (lining project) - 5,000 15, , % NEI - Rehab West of Airport (lining project) - Phase , % Lower Badger Mill Creek Int. - Phase ,000 NMF PUMPING STATIONS AND FORCE MAINS PS 16 Ventilation Modifications - 200, , % PS 18 Construction 647, , ,000 20, % PS 18 Force Main Construction 42, ,000 35,000 30, % PS 11 & 12 Rehab 2,090,785 7,052,000 5,377,000 3,022, % PS 15 Rehab 176, , ,000 2,421, % PS 7 Improvements - Phase 1 (deferred to Phase 2) , % PS 12 FM Relocation at Verona Rd. (renamed NSVI project)* 3,636 15,000-2,539,000 NMF PS 17 Force Main Relief - Phase ,000 62, % CAPITAL BUDGET EXPENSES Capital Budget Expenses 103, , , , % PS 14 Service Area I/I Study 16,282 18,000 5, % Chloride Study 56,158 66, NMF TOTAL EXPENDITURES $6,218,700 $20,735,000 $20,439,000 $14,949, % CAPITAL PROJECTS RESERVE BALANCE CAPITAL PROJECTS RESERVES 2015 Estimated Budgeted Budgeted Percent Thru June 2015 Total Amount Amount Change Beginning Reserve Balance $7,021,208 $7,021,000 $6,039,000 $8,027, % Ending Reserve Balance $7,161,478 $8,027,000 $6,752,000 $7,387, %
100 Revenue Category DEBT SERVICE BUDGET SUMMARY REVENUES Proposed 2015 Estimated Percent Thru June 2015 Total Budget Budget Change Transfer From Operating Fund $0 $11,843,000 $11,843,000 $12,909, % Interest 21,825 37,000 35,000 26, % TOTAL REVENUES $21,825 $11,880,000 $11,878,000 $12,935, % EXPENDITURES Expenditure Category Proposed 2015 Estimated Percent Thru June 2015 Total Budget Budget Change First half Interest $1,724,816 $1,724,816 $1,794,000 $1,852, % Principal 8,947,401 8,947,401 9,086,000 9,012, % Second Half Interest - 1,691,000 1,830,000 1,852, % TOTAL EXPENDITURES $10,672,217 $12,363,000 $12,710,000 $12,716, % DEBT SERVICE RESERVE BALANCE Proposed DEBT SERVICE RESERVES 2015 Estimated Percent Thru June 2015 Total Budget Budget Change Beginning Balance $18,352,581 $18,352,581 $18,356,563 $17,870, % Ending Balance $7,702,189 $17,870,000 $17,524,563 $18,089, % SCHEDULE OF PRINCIPAL AMOUNT OF INDEBTEDNESS Sewerage System Improvement Bonds January January January Series 1995 Verona Force Main and Pumping Station 186, Series 1996 Ninth Addition 1,082, Series 1997 Badger Mill Creek Effluent Return 932, , ,424 Series 2000 P.S. No. 2 Force Main Replacement - Phase 1 684, , ,250 Series 2001 P.S. No. 2 Force Main Replacement - Phase 2 871, , ,693 Series 2003A PS's 1, 2 and 10 Rehabilitation 4,151,730 3,740,119 3,316,885 Series 2003B Tenth Addition 20,105,625 18,110,042 16,058,662 Series 2005 PS's 1, 2 and 10 Rehabilitation 173, , ,861 Series 2006 Effluent Equalization Projects and AT's 1-6 1,135,156 1,052, ,367 Series 2007 West In Ext and PS Projects 1,928,775 1,801,816 1,671,613 Series 2008 PS's 6-8 Rehabilitation and NEI Truax Ext Liner 6,831,053 6,413,837 5,986,741 Series 2010A NEI-PS 10 to Lien Rd 7,429,295 7,042,003 6,645,537 Series 2012A Nine Springs Eleventh Addition 47,383,134 45,268,826 42,936,290 Series 2012B Operations Building HVAC Rehab 2,743,662 2,626,484 2,505,790 Series 2013A NEI-SEI to FEI - Replacement Project 7,717,587 7,404,229 7,082,113 Series 2013B Pumping Station No ,126,217 14,000,000 13,382,000 Series 2013C Process Control System Upgrade 3,709,120 4,747,000 4,537,000 Series 2014A Pumping Station No. 18 Force Main 10,864,519 11,316,000 10,820,000 Series 2015A PS 11 & 12 Rehabilitation - 7,000,000 10,242,000 Series 2015B Maintenance Facility Expansion - 10,000,000 11,646,000 Series 2015C Rimrock Interceptor Replacement/Relief - 839, ,000 Series 2016A West Interceptor-Randall St. to Near PS ,372,000 Series 2016B PS 12 FM Relocation at Verona Rd ,554,000 Series 2016C PS 15 Rehabilitation - - 2,985,000 Total Indebtedness $ 131,055,327 $ 143,489,000 $147,094,000 OVERALL BUDGET SUMMARY, NET OF TRANSFERS Proposed 2015 Estimated Percent Summarized Budget Items Thru June 2015 Total Budget Budget Change Total Revenues $56,163,442 $51,317,000 $51,466,079 $46,977, % Total Expenditures $52,692,354 $51,938,000 $52,189,079 $47,503, % Beginning Reserve Balance $39,481,551 $39,481,551 $37,856,000 $38,861, % Ending Reserve Balance $35,247,892 $38,861,000 $37,133,000 $38,335, % 95
101 Appendix D: 2016 Wage Schedule for Hourly Employees Classification Range Custodian & Grounds Worker Bi-Weekly 1, , , , , Hourly Administrative Secretary Bi-Weekly 1, , , , , Hourly Maintenance Worker 7 Bi-Weekly 1, , , , , Hourly Sr. Custodian & Grounds Worker 8 Bi-Weekly 1, , , , , Hourly Bi-Weekly 1, , , , , Hourly Monitoring Services Helper; Bi-Weekly 1, , , , , Utility II; Reuse Diesel Truck Hourly Driver I; Sr. Building & Grounds Worker Station Maintenance Worker, Relief Oper I; Oper I; Apprentice Mech; Asst MetroGro Mech; Apprentice Electrician; Reuse Diesel Truck Drive II; Reuse Relief Diesel Truck Driver; MS/SM Worker I Building & Grounds Crew Leader; Apprentice Mech II; Apprentice Elec II; Oper II; Relief Oper II, MS/SM Worker II MetroGro Mechanic; Journeyman Mech; Journeyman Electrician; HVAC Tech; Oper III; Relief Oper III; Sr. Building & Grounds Crew Leader Sr. Mechanic; Sr. Mech (MetroGro); Sr. Journeyman Mech; Sr. Journeyman Elect; MS/SM Crew Leader; Oper IV; Relief Oper IV Sr. Journeyman Mech II; Sr. Journeyman Elect II; Sr. Mech (Diesel & HE); Purchasing/Inventory Asst Schedule assumes a 2% increase Bi-Weekly 2, , , , , Hourly Bi-Weekly 2, , , , , Hourly Bi-Weekly 2, , , , , Hourly Bi-Weekly 2, , , , , Hourly Bi-Weekly 2, , , , , Hourly
102 Appendix E: 2016 Non-Represented Wage Schedule Grade Min $ Mid $ Max $ Schedule assumes a 2% increase 97
103 Appendix F: Statistical & Supplemental Data Governance Madison Metropolitan Sewerage District (the District) is a body corporate with the powers of a municipal corporation for the purpose of carrying out the provisions of Sections to of the State of Wisconsin statutes. It was created by judgment of the County Court for Dane County, entered on the 8th day of February, Its existence was validated and confirmed by Chapter 132 of the Laws of 1969, effective August 2, The constitutionality of that Law was sustained by the Wisconsin Supreme Court in Madison Metropolitan Sewerage District vs. Stein, 47 Wis. 2nd 349, 177 N.W. 2nd 131 (1969). As of October 15, 2015, the District is governed by nine Commissioners serving staggered terms: five Commissioners are appointed by the Mayor of the City of Madison, three are appointed by an executive council made up of elected officials from District cities and villages, and one is appointed by an executive council made up of by town-elected officials. The Commissioners meet once or twice each month at the District. Special meetings are held as required upon call of any member of the Commission. Service Area The District services 14.7% of the entire county by area and 71.8% of the county population (Table F-1). Areas served include the Cities of Madison, Fitchburg, Middleton, Monona and Verona as well as the Villages of Cottage Grove, Dane, De Forest, Maple Bluff, McFarland, Shorewood Hills, Waunakee and the Towns of Blooming Grove, Dunn, Madison, Middleton, Pleasant Springs, Verona, Vienna, Westport and Windsor (Map F-1). A complete list of District customer communities and their estimated wastewater contributions is shown in Table F-3. The largest taxpayers and employers in the county are shown in Tables F- 4 and F-5, respectively. The equalized property tax valuation for the District is shown in Table F- 2. Additional information regarding Dane County and the City of Madison can be found at: and 98
104 (As of August 31, 2015) Dane County and District Data Table F-1 Dane County District Total Square Miles 1, Estimated Population 516, , 800 Personal Income per capita $33,712 Avg. Daily Influent Flow (millions of gallons) 39 Equalized Property Valuation for the District (TID Out Values in Billions) Table F-2 Year Amount 2015 $ $ $ $ $ $ $ $ $ $ $
105 100 Estimated Wastewater Contributions Volume (gpd) CBOD (lbs/day) Solids (lbs/day) Nitrogen (lbs/day) Phosphorus (lbs/day) Equivalent Meters Table F-3 Actual Customers Community Cities Fitchburg 1,950,000 5,400 4, ,190 5,980 Madison 25,500,000 46,500 56,000 9,650 1,300 85,000 65,400 Middleton 1,930,000 4,300 3, ,210 5,565 Monona 800,000 1,400 1, ,040 2,985 Verona 920,000 2,100 2, ,400 4,110 Villages Cottage Grove 610, ,385 2,170 Dane 54, De Forest (including ABS) 715,000 8,200 2, ,015 3,375 Maple Bluff 190, McFarland 540,000 1,060 1, ,412 2,993 Shorewood Hills 142, , Waunakee 1,450,000 4,300 2, ,330 4,470 Town Sanitary and Utility Districts Blooming Grove 4, Blooming Grove S.D. No , Blooming Grove U.D. No , Burke U.D. No. 2 3, Burke U.D. No Dunn S.D. No , Dunn S.D. No. 3 65, Dunn S.D. No. 4 12, Dunn - Lake Kegonsa 160, Madison 690,000 1,225 1, ,907 1,000 Middleton S.D. No. 5 21, Pleasant Springs No. 1 61, Verona, Town of Verona U.D. No. 1 21, Vienna U.D. No. 1 65, Vienna U.D. No. 2 31, Westport - Cherokee Golf 5, Westport Utility District 540, ,847 1,587 Windsor S.D. No , ,365 1,145 Windsor U.D. No. 2 - Ill Foundation Seeds Windsor S.D. No Windsor - Hidden Springs S.D. 3, Windsor - Lake Windsor S.D. 24, Windsor - Morrisonville S.D. 50, Windsor - Oak Springs S.D. 28, Interceptor Infiltration 1,739,000 Daily Nine Springs Loadings 38,956,000 77,900 77,600 14,300 1, , ,689 Estimated 2015 Total 14,219 28,433,500 28,324,000 5,219, , , ,689 Loadings (Units) (MG) (Pounds) (Pounds) (Pounds) (Pounds) (Eq Mtrs) (Cstmrs)

106 Collection System Overview 2015 Map F-1 101
Proposed. Operating Budget & Capital Improvements Plan. Published September 10, 2015
 Proposed 2016 Operating Budget & Capital Improvements Plan Published September 10, 2015 1 2 GFOA Award The Government Finance Officers Association of the United States and Canada (GFOA) presented a Distinguished
ADOPTED OPERATING BUDGET & CAPITAL IMPROVEMENTS PLAN ADOPTED ON: OCTOBER 30, 2014
 ADOPTED 2015 OPERATING BUDGET & CAPITAL IMPROVEMENTS PLAN ADOPTED ON: OCTOBER 30, 2014 GFOA AWARD The Government Finance Officers Association of the United States and Canada (GFOA) presented a Distinguished
OPERATING BUDGET & CAPITAL IMPROVEMENTS PLAN. ADOPTED Oct. 25, 2018
 2019 OPERATING BUDGET & CAPITAL IMPROVEMENTS PLAN ADOPTED Oct. 25, 2018 Front cover: Network Technician Michael Bowman checks server connections that are essential to the district s operations. GFOA AWARD
OPERATING BUDGET & CAPITAL IMPROVEMENTS PLAN. DRAFT published September 13, 2018
 2019 OPERATING BUDGET & CAPITAL IMPROVEMENTS PLAN DRAFT published September 13, 2018 Front cover: Network Technician Michael Bowman checks server connections that are essential to the district s operations.
MADISON METROPOLITAN SEWERAGE DISTRICT Madison, Wisconsin. FINANCIAL STATEMENTS December 31, 2015 and 2014
 MADISON METROPOLITAN SEWERAGE DISTRICT Madison, Wisconsin FINANCIAL STATEMENTS TABLE OF CONTENTS PAGE INDEPENDENT AUDITOR S REPORT... 1 MANAGEMENT S DISCUSSION AND ANALYSIS... 3 BASIC FINANCIAL STATEMENTS
MADISON METROPOLITAN SEWERAGE DISTRICT Madison, Wisconsin. FINANCIAL STATEMENTS December 31, 2013 and 2012
 Madison, Wisconsin FINANCIAL STATEMENTS TABLE OF CONTENTS PAGE INDEPENDENT AUDITORS REPORT... 1 MANAGEMENT DISCUSSION AND ANALYSIS... 3 BASIC FINANCIAL STATEMENTS Statements of Net Position... 13 Statements
MADISON METROPOLITAN SEWERAGE DISTRICT Madison, Wisconsin. FINANCIAL STATEMENTS December 31, 2016 and 2015
 MADISON METROPOLITAN SEWERAGE DISTRICT Madison, Wisconsin FINANCIAL STATEMENTS TABLE OF CONTENTS PAGE INDEPENDENT AUDITORS REPORT... 1 MANAGEMENT S DISCUSSION AND ANALYSIS... 3 BASIC FINANCIAL STATEMENTS
FTE 1 Table Year (proposed) # Budgeted FTE s
 # Budgeted FTE s") P1 ENVIRONMENTAL SERVICES DEPARTMENT PROPOSED SERVICE PLAN 2019-2022 1. Mandate: Environmental Services (ENVS) provides leadership in environmental protection and sustainable service for the citizens of
P1 ENVIRONMENTAL SERVICES DEPARTMENT PROPOSED SERVICE PLAN 2019-2022 1. Mandate: Environmental Services (ENVS) provides leadership in environmental protection and sustainable service for the citizens of
OUR STRATEGIC INITIATIVES
 OUR STRATEGIC INITIATIVES EWA relies upon the strategic business planning process to align the Vision, Mission, Core Values, and Business Principles with the strategies, objectives, goals, and tasks everyday
Wastewater Utilities. FY Budget Presentation
 Utilities FY 2018-19 Budget Presentation 1 Volume Forecast Wastewater Customers by Class Fiscal Year Residential Commercial Wholesale Total Growth 2013 26,995 1.1% 3,091 0.8% 4 30,090 1.1% 2014 27,548
Strategic Business Plan Department of Water Resources. Gwinnett County Department of Water Resources
 g w i n n e t t c o u n t y Strategic Business Plan Department of Water Resources Gwinnett County Department of Water Resources A Message from the Director The Department of Water Resources Strategic Business
Environmental Improvement Fund
 Informational Paper 64 Environmental Improvement Fund Wisconsin Legislative Fiscal Bureau January, 2009 Environmental Improvement Fund Prepared by Kendra Bonderud Wisconsin Legislative Fiscal Bureau One
Revenue Plan. August 12, Dennis Davies Deputy Director of Public Works 200 Civic Center Way El Cajon, CA 92020
 1925 Palomar Oaks Way, Suite 3 Carlsbad, California 928 tel: 76 438 7755 fax: 76 438 7411 Dennis Davies Deputy Director of Public Works 2 Civic Center Way El Cajon, CA 922 Subject: Six Year Revenue Plan
City of Madison 2019 Operating Budget 296
 City of Madison 2019 Operating Budget 296 City of Madison 2019 Operating Budget 297 Agency: Sewer Proposed Budget Cost to Continue Proposed Change Revenue -$38,331,199 -$40,684,110 -$2,352,911 Expenditures
September 28, Yahara WINS Member:
 September 28, 2018 Yahara WINS Member: The Executive Committee is pleased to present the DRAFT 2019 Operating Budget for Yahara WINS. As we enter another full year of full implementation we are optimistic
Wastewater Rate Study. Villa Park, Illinois
 Wastewater Rate Study Villa Park, Illinois June 2013 Executive Summary General The Village of Villa Park s Wastewater Utility is responsible for operation and maintenance of the Village s separate sanitary
AREAWIDE WATER QUALITY MANAGEMENT PLAN AMENDMENT PROCESS
 AREAWIDE WATER QUALITY MANAGEMENT PLAN AMENDMENT PROCESS (Revised and Approved June 28, 2007) The Areawide Water Quality Management Plan (Regional Plan) adopted by the North Front Range Water Quality Planning
Glossary of Terms. ADOPTED BUDGET Is the financial plan for the fiscal year beginning July 1.
 Glossary of Terms ACCOUNT An entity for recording specific revenues or expenditures, or for grouping related or similar classes of revenues and expenditures and recording them within a fund or department.
PETERS TOWNSHIP SANITARY AUTHORITY. Audited Financial Statements and Required Supplementary Information
 Audited Financial Statements and Required Supplementary Information For The Years Ended TABLE OF CONTENTS PAGE NO.... Independent Auditors Report. i-xiv... Management Discussion and Analysis. 1... Statements
CITY OF ALHAMBRA UTILITIES DEPARTMENT SEWER SYSTEM MAINTENANCE PROGRAM (SSMP)
") CITY OF ALHAMBRA UTILITIES DEPARTMENT SEWER SYSTEM MAINTENANCE PROGRAM (SSMP) APRIL 2009 Table of Contents INTRODUCTION... 3 SECTION I: GOALS... 3 SECTION II: ORGANIZATION... 4 SECTION III: LEGAL AUTHORITY...
CITY OF ALHAMBRA UTILITIES DEPARTMENT SEWER SYSTEM MAINTENANCE PROGRAM (SSMP) APRIL 2009 Table of Contents INTRODUCTION... 3 SECTION I: GOALS... 3 SECTION II: ORGANIZATION... 4 SECTION III: LEGAL AUTHORITY...
September 28, Yahara WINS Member:
 September 28, 2017 Yahara WINS Member: The Executive Committee is pleased to present the DRAFT 2018 Operating Budget for Yahara WINS. As we enter the second full year of full implementation following the
City of Laramie Adjusted Budget FY - Wastewater Fund. 189 P age
 Wastewater Fund 189 P age Wastewater Fund The Water and Wastewater Funds are part of the Utility Fund, which is run as an enterprise fund, or businesstype activity. The Water and Wastewater Utilities are
DRAFT ORDINANCE NO. 656 ORDINANCE ESTABLISHING USER RATES. Rates Effective May 1, 2019 This Ordinance No. 656 Supersedes Ordinance No.
 DRAFT ORDINANCE NO. 656 ORDINANCE ESTABLISHING USER Rates Effective May 1, 2019 This Ordinance. 656 Supersedes Ordinance. 644 WHEREAS, the Board of Trustees (Board) of the Wheaton Sanitary District (the
TITLE 18. ENVIRONMENTAL QUALITY CHAPTER 14. DEPARTMENT OF ENVIRONMENTAL QUALITY PERMIT AND COMPLIANCE FEES ARTICLE 1. WATER QUALITY PROTECTION FEES
 Section R18-14-101. R18-14-102. Table 1. R18-14-103. R18-14-104. Table 2. Table 3. R18-14-105. R18-14-106. R18-14-107. R18-14-108. Table 4. Table 5. R18-14-109. Table 6. R18-14-110. Table 7. R18-14-111.
MADISON METROPOLITAN SEWERAGE DISTRICT. 1. Opening (8:00 AM 8:05 AM) A. Call to Order B. Welcome guests and visitors C.
 A. Call to Order B. Welcome guests and visitors C.") MADISON METROPOLITAN SEWERAGE DISTRICT 1610 Moorland Road Madison, WI 53713-3398 Telephone (608) 222-1201 Fax (608) 222-2703 D. Michael Mucha, P.E. Chief Engineer & Director COMMISSIONERS Caryl E. Terrell
MADISON METROPOLITAN SEWERAGE DISTRICT 1610 Moorland Road Madison, WI 53713-3398 Telephone (608) 222-1201 Fax (608) 222-2703 D. Michael Mucha, P.E. Chief Engineer & Director COMMISSIONERS Caryl E. Terrell
Wastewater Utility Enterprise
 Wastewater Utility Enterprise Wastewater Utility Operating Fund Summary Wastewater Utility Revenue (62) Wastewater Utility Collection Systems Operations (62-4510) Wastewater Treatment Operations (62-4515)
Posting Date LUC- WWTP Ultraviolet Disinfection System PID No. N/A City of Oregon Response Due Date: Communications Restrictions
 11-26-18 Posting Date LUC- WWTP Ultraviolet Disinfection System PID No. N/A City of Oregon Response Due Date: 12-21-18 Communications Restrictions Please note the following policy concerning communication
DATE: September 12, 2017 REPORT NO. PW Chair and Members Committee of the Whole Operations and Administration
 DATE: September 12, 2017 REPORT NO. PW2017-061 TO: FROM: Chair and Members Committee of the Whole Operations and Administration E. (Beth) Goodger, General Manager Public Works Commission 1.0 TYPE OF REPORT
NOTICE OF REGULAR MEETING
 NOTICE OF REGULAR MEETING PLEASE TAKE NOTICE that there will be a regular meeting of the Commission of the Madison Metropolitan Sewerage District at 8:00 a.m., on Thursday, January 15, 2015 in the Commission
GREEN BAY METROPOLITAN SEWERAGE DISTRICT PROCEEDINGS OF THE COMMISSION. Commissioners Hasselblad, Blumreich, Tumpach, and Meinz (via conference call)
") Regular meeting of the Commission held November 27, 2013. PRESENT: EXCUSED: Commissioners Hasselblad, Blumreich, Tumpach, and Meinz (via conference call) Commissioner Hoffmann ALSO PRESENT: T. Sigmund,
Regular meeting of the Commission held November 27, 2013. PRESENT: EXCUSED: Commissioners Hasselblad, Blumreich, Tumpach, and Meinz (via conference call) Commissioner Hoffmann ALSO PRESENT: T. Sigmund,
FINANCIAL PLAN WATER AND WASTEWATER LINES OF SERVICE
 UCS2018-0223 ATTACHMENT 1 FINANCIAL PLAN 2019-2022 WATER AND WASTEWATER LINES OF SERVICE 2018 MARCH 14 MAKING LIFE BETTER EVERY DAY UCS2018-0223 Financial Plan 2019-2022 - Water and Wastewater Lines of
PUBLIC HEARING ON FISCAL YEAR BUDGET
 PUBLIC HEARING ON FISCAL YEAR 2016-17 BUDGET Presenter: Greg Nyhoff, City Manager June 21, 2016 KEY MILESTONES TO DATE MILESTONES DATE Council and Executive team held a priority setting workshop October
F Ý ½ Y Ù 2018 BUDGET. Ä F ò -Y Ù C Ö ã ½ IÃÖÙÊò Ã Äã P½ Ä
 F Ý ½ Y Ù 2018 BUDGET Ä F ò -Y Ù C Ö ã ½ IÃÖÙÊò Ã Äã P½ Ä FY2018 Annual Budget In accordance with the passage of S.B. No 656, Local Government Code, Sec. 102.007, was amended to require that an adopted
COLE COUNTY MISSOURI
 COLE COUNTY MISSOURI Budget Officer Recommended Budget For Fiscal Year 2019 Prepared by: Auditor s Office Kristen Berhorst County Auditor Cole County, Missouri 2019 Budget Table of Contents Budget Message
REGIONAL EVALUATION FRAMEWORK 1.0 INTRODUCTION 2.0 PURPOSE 3.0 DEFINITIONS. Edmonton Metropolitan Region Planning Toolkit
 Edmonton Metropolitan Region Planning Toolkit Re-imagine. Plan. Build. Edmonton Metropolitan Region Growth Plan 1.0 INTRODUCTION On October 26, 2017, the Government of Alberta approved the Edmonton Metropolitan
DRAFT MULTI-YEAR Water and Wastewater & Treatment Budget December 17, ANNUAL UPDATE INVESTING IN OUR FUTURE. london.
 6 MULTI-YEAR BUDGET FOR THE 2019 ANNUAL UPDATE INVESTING IN OUR FUTURE london.ca/budget DRAFT 2019 Water and Wastewater & Treatment Budget December 17, 2018 Table of Contents Recommendations... 1 WATER
DESCRIPTIONS OF BUDGET TERMS
 DESCRIPTIONS OF BUDGET TERMS Ad Valorem Tax A tax based on the assessed value of a property. Adopted Budget Financial plan which forms the basis and limits for appropriations and is adopted by the City
FY18 SCHEDULE OF USER FEES October 1, 2017 September 30, UTILITIES - RECLAIMED WATER Adopted
 UTILITIES - RECLAIMED WATER I. New Service Connection Fees for Systems on Existing Mains A. Unmetered Service 1. Service connection - unmetered service 1" $790 2. Service connection - unmetered service
NOTICE OF COMMISSION MEETING
 MADISON METROPOLITAN SEWERAGE DISTRICT 1610 Moorland Road Madison, WI 53713-3398 Telephone (608) 222-1201 Fax (608) 222-2703 D. Michael Mucha, P.E. Chief Engineer & Director COMMISSIONERS Caryl E. Terrell
TO: CITY COUNCIL DATE: May 18,2009. THROUGH: MUNICIPAL SERVICES COMMITTEE (April 29,2009)
") TO: CITY COUNCIL DATE: May 18,2009 THROUGH: MUNICIPAL SERVICES COMMITTEE (April 29,2009) FROM: CITY MANAGER SUBJECT: ADOPTION OF THE SEWER SYSTEM MANAGEMENT PLAN (SSMP) RECOMMENDATION: It is recommended
TO: CITY COUNCIL DATE: May 18,2009 THROUGH: MUNICIPAL SERVICES COMMITTEE (April 29,2009) FROM: CITY MANAGER SUBJECT: ADOPTION OF THE SEWER SYSTEM MANAGEMENT PLAN (SSMP) RECOMMENDATION: It is recommended
GOLETA SANITARY DISTRICT BUDGET FISCAL YEAR
 GOLETA SANITARY DISTRICT BUDGET FISCAL YEAR 2014-15 BUDGET FOR FISCAL YEAR 2014-2015 Approved by the Governing Board Special Board Meeting June 13, 2014 MEMORANDUM TO: FROM: Members of the Governing Board
Strategic Plan of Work & Projections. Development of the Plan of Work
 Strategic Plan of Work & Projections The Strategic Plan of Work & Projections portion of this document provides a narrative discussion of the County s longterm planning process and links the policy making
WATER AND WASTEWATER FUND REVENUES
 WATER AND WASTEWATER FUND REVENUES Water revenues comprise $12.11 million, or 70.6% of total revenues of the fund, while wastewater (sewer) charges comprise $4.25 million, or 24.7% of total revenues. Water
SAUSALITO-MARIN CITY SANITARY DISTRICT 1 EAST ROAD SAUSALITO, CALIFORNIA Telephone: (415) Fax: (415)
 Fax: (415)") 1 EAST ROAD SAUSALITO, CALIFORNIA Telephone: (415) 332-0244 Fax: (415) 332-0453 Budget FY 2017/18 Adopted by Board on June 5, 2017 BUDGET EXECUTIVE SUMMARY FISCAL YEAR 2017/18 DISTRICT OVERVIEW The Sausalito-Marin
1 EAST ROAD SAUSALITO, CALIFORNIA Telephone: (415) 332-0244 Fax: (415) 332-0453 Budget FY 2017/18 Adopted by Board on June 5, 2017 BUDGET EXECUTIVE SUMMARY FISCAL YEAR 2017/18 DISTRICT OVERVIEW The Sausalito-Marin
F Y 2017 BUDGET F Y C I P
 F Y 2017 BUDGET F Y C I P FY C G A B In accordance with the passage of S.B. No 656, Local Government Code, Sec. 102.007, was amended to require that an adopted municipal budget must contain a cover page
ANNUAL BUDGET WORKSHOP. Operating and Capital Budget Fiscal Year Ending June 30, 2019
 ANNUAL BUDGET WORKSHOP Operating and Capital Budget Fiscal Year Ending June 30, 2019 BIG BEAR AREA REGIONAL WASTEWATER AGENCY BIG BEAR CITY, CALIFORNIA 92314 FY 2019 Budget Workshop March 7, 2018 1. Budget
Section III BUDGET PREPARATION
 Annual Budget Process Section III BUDGET PREPARATION Garfield County prepares a budget for the forthcoming fiscal year as required by Local Government Budget Law of Colorado. The Finance Department Director
Village of Baltimore Water & Wastewater Analysis. July 2018
 Village of Baltimore Water & Wastewater Analysis July 2018 Table of Contents Introductory Summary... 1 Data... 1 Water Treatment Plant (WTP)... 1 Production... 2 Costs & Debts... 2 Wastewater Treatment
Los Angeles 4th Regional Investors Conference March 19-20, Los Angeles Wastewater System
 City of Los Angeles Los Angeles 4th Regional Investors Conference March 19-20, 2018 Los Angeles Wastewater System Presented by: Lisa Mowery, Chief Financial Officer LA Sanitation Disclaimer This Investor
THREE LAKES WATER AND SANITATION DISTRICT 2019 BUDGET DOCUMENTS
 THREE LAKES WATER AND SANITATION DISTRICT 2019 BUDGET DOCUMENTS PO BOX 899 GRAND LAKE, CO 80447 970-627-3544 www.threelakesws.com THREE LAKES WATER AND SANITATION DISTRICT 1111 COUNTY ROAD 48 GRAND LAKE,
PINELLAS COUNTY, FLORIDA FY201 OPERATING AND CAPITAL BUDGET
 PINELLAS COUNTY, FLORIDA FY201 OPERATING AND CAPITAL BUDGET BOARD OF COUNTY COMMISSIONERS John Morroni, Chairman Charlie Justice, Vice-Chairman Karen Williams Seel, Commissioner Pat Gerard, Commissioner
Fiscal Year Budget Proposal
 Fiscal Year 20182019 Budget Proposal Board of Directors March 27, 2018 RIVANNA WATER & SEWER AUTHORITY FY 2019 Proposed Budget Table of Contents Budget Highlights Prepared: March 6, 2018 Adopted: Draft
TOWN OF CENTREVILLE, MARYLAND. Financial Statements Together with Report of Independent Public Accountants
 Financial Statements Together with Report of Independent Public Accountants For the Year Ended JUNE 30, 2010 TABLE OF CONTENTS Report of Independent Public Accountants 1 Management s Discussion and Analysis
SIGNIFICANT BUDGET CHANGES
 Department of Environmental Services Our Mission: To build and maintain water delivery, sanitary sewer collection, and wastewater treatment systems that provide high-quality water and sewer services and
SIGNIFICANT BUDGET CHANGES
 Department of Environmental Services Our Mission: To build and maintain water delivery, sanitary sewer collection, and wastewater treatment systems that provide high-quality water and sewer services and
MUNICIPALITY OF MISSISSIPPI MILLS. plan. December, 2016
 MUNICIPALITY OF MISSISSIPPI MILLS plan December, 2016 PREFACE This Asset Management Plan is intended to describe the infrastructure owned, operated and maintained by the Municipality of Mississippi Mills
RE:EX Toronto Water CAPITAL BUDGET NOTES CONTENTS CONTACTS CAPITAL BUDGET AND PLAN OVERVIEW. Overview
 RE:EX29.18 CAPITAL BUDGET NOTES CONTENTS Overview 1: Recommended 10-Year Capital Plan 5 2: Issues for Discussion 22 Appendices: 1. 2017 Performance 30 2. Recommended 10-Year Capital Plan Summary 32 Toronto
CITY OF LAKE ELMO, MINNESOTA COMPREHENSIVE ANNUAL FINANCIAL REPORT FOR THE FISCAL YEAR ENDED DECEMBER 31, 2017
 COMPREHENSIVE ANNUAL FINANCIAL REPORT FOR THE FISCAL YEAR ENDED DECEMBER 31, 2017 PREPARED BY: FINANCE DEPARTMENT CITY OF LAKE ELMO, MINNESOTA FINANCIAL STATEMENTS For the Fiscal Year Ended December 31,
Sanitation Rate Study Final Report
 Sanitation Rate Study Final Report City of Simi Valley April 24, 2015 Prepared by: Page 1 201 S. Lake Avenue Suite 301 Pasadena, CA 91101 Phone 626.583.1894 Fax 626.583.1411 www.raftelis.com April 24,
Issue. Background. Options and Recommendation
 Date: March 3, 2016 To: Public Works Commission Members From: Heather Buchanan, Support Systems Sr. Manager Subject: FY2017 O&M Budget Issue Public Works is proposing its FY 2017 operations and maintenance
COUNTY SANITATION. DISTRICTS OF LOS ANGELES COUNTY
 COUNTY SANITATION. DISTRICTS OF LOS ANGELES COUNTY 1955 Workman Mill Road, Whittier, CA 90601-1400 Mailing Address: P.O. Box 4998, Whittier, CA 90607-4998 Telephone: (562) 699-7411, FAX: (562) 699-5422
REPORT NO CALCULATION OF 2009 USER CHARGE RATES
 MONITORING AND RESEARCH DEPARTMENT REPORT NO. 09-13 CALCULATION OF 2009 USER CHARGE RATES NOVEMBER 2008 Metropolitan Water Reclamation District of Greater Chicago 100 East Erie Street Chicago, IL 60611-2803
VILLAGE OF LIBERTYVILLE SPECIAL MEETING. Tuesday, March 6, 2018 Village Hall 118 W. Cook Avenue Libertyville, IL :00 p.m.
 VILLAGE OF LIBERTYVILLE SPECIAL MEETING Tuesday, March 6, 2018 Village Hall 118 W. Cook Avenue Libertyville, IL 60048 6:00 p.m. 1) Roll Call 2) Continued Discussion of Draft 2018/2019 Budget 3) Executive
CITIZEN'S GUIDE TO BUDGETING IN ALEXANDRIA, VIRGINIA. Source. Reprinted by permission. City of Alexandria, Virginia, Proposed Budget, FYI
 CITIZEN'S GUIDE TO BUDGETING IN ALEXANDRIA, VIRGINIA Source. Reprinted by permission. City of Alexandria, Virginia, 2009. Proposed Budget, FYI 2010,, http://alexandriava.gov/uploadedfiles/budget/info/budget2010/fy10proposedbudget-
SUMMERLAND SANITARY DISTRICT
 SUMMERLAND SANITARY DISTRICT Financial Plan and Rate Study December 6, 2017 445 S. Figueroa Street Suite #2270 Los Angeles, CA 90071 Phone 213.262.9300 Fax 213.262.9303 www.raftelis.com December 6, 2017
Finance Committee Meeting
 Finance Committee Meeting FY16 Strategic Business and Operating Plan and Preliminary Budget Review April 8, 2015 Finance Committee Meeting FY16 Strategic Business Operating Plan and Preliminary Budget
Strategic Asset Management Policy
 Strategic Asset Management Policy Submission Date: 2018-04-24 Approved by: Council Approval Date: 2018-04-24 Effective Date: 2018-04-24 Resolution Number: Enter policy number. Next Revision Due: Enter
Capital Region Water. Water and Wastewater Rate Study Report. November 22, Capital Region Water Water and Wastewater Rate Study
 Capital Region Water Water and Wastewater Rate Study Report November 22, 2017 Capital Region Water Water and Wastewater Rate Study TABLE OF CONTENTS 1. INTRODUCTION...1 1.1 RATE STUDY SCOPE AND OBJECTIVES...1
West Valley Sanitation District FINANCIAL PLAN & RATE STUDY. January 2018
 West Valley Sanitation District FINANCIAL PLAN & RATE STUDY January 2018 BARTLE WELLS ASSOCIATES Independent Public Finance Consultants 1889 Alcatraz Avenue Berkeley, California 94703 www.bartlewells.com
FINAL BUDGET FOR FISCAL YEAR (And Preliminary Budget for Fiscal Year )
") FINAL BUDGET FOR FISCAL YEAR 2016-17 (And Preliminary Budget for Fiscal Year 2017-18) Adopted August 22, 2016 Honorable Board of Directors Novato Sanitary District 500 Davidson Street Novato, California
FINAL BUDGET FOR FISCAL YEAR 2016-17 (And Preliminary Budget for Fiscal Year 2017-18) Adopted August 22, 2016 Honorable Board of Directors Novato Sanitary District 500 Davidson Street Novato, California
City of San Carlos Sewer Financial Plan & Rate Update
 City of San Carlos Sewer Financial Plan & Rate Update Revised 06/13/16 1889 Alcatraz Avenue Berkeley, CA 94703 Tel: 510 653 3399 www.bartlewells.com June 13, 2016 City of San Carlos Department of Public
Memorandum. Background. February 1, 2019
 Memorandum February 1, 2019 TO: THRU: FROM: SUBJ: Chris Cummings, Assistant Director, Economic Development Ed Tabor, Programs & Incentives Manager Tawni Bean, Regional Project Manager Dennis Knight, Finance
STONY BROOK REGIONAL SEWERAGE AUTHORITY
 STONY BROOK REGIONAL SEWERAGE AUTHORITY HOPEWELL BOROUGH HOPEWELL TOWNSHIP PENNINGTON BOROUGH PRINCETON SOUTH BRUNSWICK TOWNSHIP WEST WINDSOR TOWNSHIP STONY BROOK REGIONAL SEWERAGE AUTHORITY Financial
CITY OF JACKSONVILLE, FLORIDA
 CENTRAL OPERATIONS DEPARTMENT DEPARTMENT VISION: The development of a centralized model for the standardization of processes, economics and efficiencies of scale, and cross-training necessary to eliminate
Eugene Water & Electric Board Adopted Budget. December 5, 2017
 Eugene Water & Electric Board 208 Adopted Budget December 5, 207 Eugene Water & Electric Board 500 East 4 th Avenue/Post Office Box 048 Eugene, Oregon 97440-248 54-685-7000 www.eweb.org Board of Commissioners
City of Penticton: Financial Plan Reporting Structure
 City of Penticton: Financial Plan Reporting Structure General Utilities General Government Transportation Services Recreation and Culture Environmental Health Services Public Health and Safety Protective
Thursday July 12, a.m. MMSD Maintenance Facility Training Room, 1610 Moorland Road, Madison, WI 53713
 Meeting of the Commissioners of the Madison Metropolitan Sewerage District Thursday July 12, 2018 8 a.m. MMSD Maintenance Facility Training Room, 1610 Moorland Road, Madison, WI 53713 Present: Commissioner
A loyal three made stronger in one. Loyalist Township Strategic Plan ( )
") A loyal three made stronger in one Loyalist Township Strategic Plan (2012-2015) Adopted by Council on August 13, 2012 Loyalist Township Strategic Plan I. Community Profile As prescribed by the Ministry
A loyal three made stronger in one Loyalist Township Strategic Plan (2012-2015) Adopted by Council on August 13, 2012 Loyalist Township Strategic Plan I. Community Profile As prescribed by the Ministry
CITY OF DETROIT, MICHIGAN_Sewage Disposal System Revenue
 CITY OF DETROIT, MICHIGAN_Sewage Disposal System Revenue MICHIGAN FINANCE AUTHORITY, Local Government Loan Program Revenue Bonds, Series 2014C 1 (Detroit Water and Sewerage Department Sewage Disposal System
FEASIBILITY STUDY FOR THE DEVELOPMENT OF A REGIONAL WATER PRODUCTION UTILITY
 FINAL REPORT FEASIBILITY STUDY FOR THE DEVELOPMENT OF A REGIONAL WATER PRODUCTION UTILITY Summary Report BLACK & VEATCH PROJECT NO. 184920 Black & Veatch Holding Company 2013. All rights reserved. PREPARED
CITY OF COLDWATER BRANCH COUNTY, MICHIGAN FINANCIAL STATEMENTS JUNE 30, 2006
 BRANCH COUNTY, MICHIGAN FINANCIAL STATEMENTS JUNE 30, 2006 CONTENTS Page Report Letter 1-2 Management s Discussion and Analysis 3-12 Basic Financial Statements Government-Wide Financial Statements: Statement
PLANNING DEPARTMENT ADMINISTRATION
 PLANNING DEPARTMENT ADMINISTRATION Long-Range Planning Zoning and Land Development Land Use and Design Community Improvement and Transportation Rezoning and Development Regulations Development Review Transit
GENERAL FUND REVENUES BY SOURCE
 BUDGET DETAIL BUDGET DETAIL The Budget Detail gives more information on the budget, than is shown in the Executive Summary. Detail information is provided on the General Fund, Special Revenue Funds, Enterprise
North Pecos Water & Sanitation District. Rates, Charges, Fees and Penalties Effective January 1, 2015
 North Pecos Water & Sanitation District Rates, Charges, Fees and Penalties Effective January 1, 2015 Updated : 1-1-2015 RATES, CHARGES, FEES AND PENALTIES OF THE NORTH PECOS WATER AND SANITATION DISTRICT
South Australian Water Corporation Fees and Charges Schedule Rates and Sales
 The following fees and charges are fixed for the period 1 July 2016 to 30 June 2017. s and Sales Annual Charge / s Charge / s Residential Tier 1 Use $2.27 first 0.3288kL Tier 2 Use $3.24 from 0.3288kL
Stormwater Utility Agency Overview
 Stormwater Utility Agency Overview Agency Mission The mission of the Stormwater Utility is to provide stormwater management services to the City of Madison with an equitable rate structure. Agency Overview
ORANGE WATER AND SEWER AUTHORITY SCHEDULE OF RATES, FEES, AND CHARGES APPLICABLE TO ALL BILLINGS AND SERVICES ON AND AFTER OCTOBER 1, 2017
 APPLICABLE TO ALL BILLINGS AND SERVICES ON AND AFTER OCTOBER 1, 2017 Page SECTION I: SCHEDULE OF WATER RATES AND FEES... 2 SECTION II: SCHEDULE OF SEWER RATES AND FEES... 8 SECTION III: SCHEDULE OF RECLAIMED
Stormwater Utility Agency Overview
 Agency Overview Agency Mission The mission of the Stormwater Utility is to provide stormwater management services to the City of Madison with an equitable rate structure. Agency Overview The Stormwater
2017 ENTERPRISE ASSET MANAGEMENT PLAN
 Corporate Asset Management 2017 ENTERPRISE ASSET MANAGEMENT PLAN Investments in Peel s Infrastructure We are all asset managers! Executive Summary The Region s infrastructure is a public investment with
1. Waste Water Treatment Plant Expansion/Capital Improvement Plan. 2. Catawba River Water Treatment Plant (CRWTP) Non-Capacity Costs
 Non-Capacity Costs") Table of Contents Agenda 2 Waste Water Treatment Plant Expansion/Capital Improvement Plan Staff Report 3 WWTP Capital Improvement Plan Update Report 6 Catawba River Water Treatment Plant (CRWTP) Non-Capacity
Table of Contents Agenda 2 Waste Water Treatment Plant Expansion/Capital Improvement Plan Staff Report 3 WWTP Capital Improvement Plan Update Report 6 Catawba River Water Treatment Plant (CRWTP) Non-Capacity
Budget Assumptions for FY 2013/14 and the 10 Year Forecast
 Budget Assumptions for FY /14 and the 10 Year Forecast Staff has begun the process for preparation of the FY /14 operating and capital budget, as well as year end projections for the current fiscal year.
DENVER SOUTHEAST SUBURBAN WATER AND SANITATION DISTRICT MANAGEMENT S DISCUSSION AND ANALYSIS
 The management of Denver Southeast Suburban Water and Sanitation District (the District) offers the readers of the District s financial statements this narrative overview and analysis of the financial
TABLE OF CONTENTS. Letter of Transmittal. i-viii Summary of Operating Fund & Capital Fund Balances... 1
 NOVATO SANITARY DISTRICT 2014-16 Final Budget TABLE OF CONTENTS SECTION I Letter of Transmittal. i-viii Summary of Operating Fund & Capital Fund Balances... 1 SECTION II Operating Budget - Revenue Summary...
Rate Schedule. Fiscal Year-2018 (July 1, 2017 June 30, 2018) P.O. Box 5911 Virginia Beach, Virginia
 P.O. Box 5911 Virginia Beach, Virginia") Rate Schedule Fiscal Year-2018 (July 1, 2017 June 30, 2018) P.O. Box 5911 Virginia Beach, Virginia 23471-0911 757.460.2491 www.hrsd.com HRSD Rate Schedule Fiscal Year-2018 (July 1, 2017 June 30, 2018)
Rate Schedule Fiscal Year-2018 (July 1, 2017 June 30, 2018) P.O. Box 5911 Virginia Beach, Virginia 23471-0911 757.460.2491 www.hrsd.com HRSD Rate Schedule Fiscal Year-2018 (July 1, 2017 June 30, 2018)
Official Minutes of MARION COUNTY BOARD OF COUNTY COMMISSIONERS. July 18, 2011
 Official Minutes of MARION COUNTY BOARD OF COUNTY COMMISSIONERS July 18, 2011 The Marion County Board of County Commissioners met in a workshop session in Commission Chambers at 1:10 p.m. on Monday, July
Ministry of Environment. Plan for saskatchewan.ca
 Ministry of Environment Plan for 2018-19 saskatchewan.ca Table of Contents Statement from the Minister... 1 Response to Government Direction... 2 Operational Plan... 3 Highlights... 9 Financial Summary...10
WATER POLLUTION CONTROL
 WATER POLLUTION CONTROL WATER POLLUTION CONTROL NARRATIVE City of Warrensburg Water Pollution Control Division is under the supervision of the Public Works Department. The Administration budget includes
Carroll County Maryland. Community Investment Plan Request Fiscal Years
 Carroll County Maryland Community Investment Plan Request Fiscal Years 2019-2024 PRODUCED BY The Department of Management and Budget Ted Zaleski... Director Deborah Effingham... Chief, Bureau of Budget
Rate Schedule. Fiscal Year-2015 (July 1, 2014 June 30, 2015) Amended July 22, 2014 Amended August 26, 2014
 Amended July 22, 2014 Amended August 26, 2014") Rate Schedule Fiscal Year-2015 (July 1, 2014 June 30, 2015) Amended July 22, 2014 Amended August 26, 2014 P.O. Box 5911 Virginia Beach, Virginia 23471-0911 757.460.2491 www.hrsd.com HRSD Rate Schedule
Rate Schedule Fiscal Year-2015 (July 1, 2014 June 30, 2015) Amended July 22, 2014 Amended August 26, 2014 P.O. Box 5911 Virginia Beach, Virginia 23471-0911 757.460.2491 www.hrsd.com HRSD Rate Schedule
ENGINEERING SERVICES
 ENGINEERING SERVICES Engineering Services group provides innovative, high-quality, and costeffective solutions to meet our customers needs and ensure the long-term reliability and successful operation