Economy. Fiscal policy has reached limits. Fiscal spending. Private investment. Private consumption. Thematic April 2018
|
|
|
- Gyles Long
- 6 years ago
- Views:
Transcription
; +91 22 3982 545 Rahul Agrawal - Research analyst (Rahul.Agrawal@motilaloswal.")
1 Private investment Fiscal spending Private consumption Thematic April 218 India Strategy Get on track please! Economy Fiscal policy has reached limits Nikhil Gupta - Research analyst (Nikhil.Gupta@MotilalOswal.com); Rahul Agrawal - Research analyst (Rahul.Agrawal@motilaloswal.com); Investors are advised to refer through important disclosures made at the last page of the Research Report. Motilal Oswal research is available on Bloomberg, Thomson Reuters, Factset and S&P Capital.
2 Contents: State Budgets - Fiscal policy has reached limits Fiscal policy has reached limits... 3 PART I. Five key macro implications for the financial markets PART II. Key highlights from states finances PART III. What do the combined budgets tell us? Appendix All states Andhra Pradesh Bihar Chhattisgarh Gujarat Haryana Himachal Pradesh Jammu & Kashmir Jharkhand Karnataka Kerala Madhya Pradesh Maharashtra Odisha Punjab Rajasthan Tamil Nadu Telangana Uttarakhand Uttar Pradesh West Bengal April 218 2


3 Fiscal policy has reached limits Combined analysis of center and states budgets suggests so Thematic State Budgets Economy Following our practice adopted last year, we analyze the budgets of 2 major states of the Indian economy, which account for ~93% of national GDP and ~95% of total spending by all states. Though every minute detail of the Union Budget is deciphered by the markets, state budgets don't receive their due share of attention. Together, state budgets are more than 16% of the Union Budget and the market borrowings by states will be similar to those of the center in FY19 for the first time in the history of liberalized India. To understand fiscal policy of the economy, thus, a combined analysis of the states and the center is required. Our key findings are: Notwithstanding general elections in 219, real spending of the general government (center + states) is budgeted to slow down to 6.6% YoY in FY19 versus an average growth of 9.1% in the previous three years. Historical analysis of the spending patterns during election years since late 199s suggests their linkages with election results. GST implementation has brought immense optimism to the general government, which has budgeted record-high taxes of 18.7% of GDP for FY19, better than 17.6% in FY8. Spending, however, is budgeted to grow moderately, due to which the combined fiscal deficit is budgeted at 5.7% for FY19. After a decline in capital spending in, fiscal capex is budgeted to grow 11.6% YoY in FY19, similar to 11.3% growth budgeted for core revenue spending. If so, the contribution of government spending (consumption + investment) to real GDP growth is set to fall further in FY19. Consequently, we peg our real GDP growth forecasts at 6.9% for FY19, better than 6.7% in FY18, but lower than the consensus of %. Economy Fiscal policy has reached limits Mr Nikhil Gupta Please click here for Video Link Why should one read this report? Apart from the Reserve Bank of India (RBI), we are not aware of any other private or official organization providing comprehensive research on pooled budget for states. The RBI s publication is also released with a lag of months (the new publication on State Finances will cover the state budgets for , while states have presented their budgets last month). Admittedly, while the RBI s publication covers all 29 states, our research covers 2 large states. There are at least six reasons why market participants would be interested in the combined analysis of the center and state finances: Along with general elections, as many as ten states accounting for ~4% of national GDP are also scheduled for elections in 219. FY19 budgets, thus, hold special importance, and a combined analysis of the center and states is recommended. The relevance of fiscal spending for real GDP growth has increased in the past few years. Government spending (consumption + investments) contributed as much as 22.5% (or 1.6 percentage points (pp)) to real GDP growth in, up from.2-.3pp in. An analysis of the finances of the general government helps us make better informed predictions regarding real GDP growth. April 218 3
 in 217, any appraisal of the performance of GST requires the analysis of the combined budgets.")
4 With the implementation of goods & services tax (GST) in 217, any appraisal of the performance of GST requires the analysis of the combined budgets With the implementation of goods & services tax (GST) in 217, any appraisal of the performance of GST requires the analysis of the combined budgets. States budgets account for more than 16% of the Union Budget, and the former s spending on India s rural sector (agriculture activities + rural development + irrigation) is more than 3% that of the latter s. Thus, it is important to understand the spending pattern of states, along with the center. With the implementation of the 7 th central pay commission in, states have also implemented pay revisions. The bill on salary & wages by the states is at least 3x that of the center, and thus, it is pertinent to understand the economic and fiscal impacts of pay revisions by states. For the first time in the history of the liberalized India, gross/net market borrowings of the states is budgeted to be similar to that of the center at INR5.5t/INR4.2t or ~3%/2.3% of GDP in FY19. This is because states are planning to finance as much as ~91% of their deficit via market borrowings as against ~66% by the center. Coverage of our report We have covered budgets of 2 states: Andhra Pradesh (AP), Bihar (BH), Chhattisgarh (CT), Gujarat (GJ), Haryana (HR), Himachal Pradesh (HP), Jammu & Kashmir (JK), Jharkhand (JH), Karnataka (KA), Kerala (KL), Madhya Pradesh (MP), Maharashtra (MH), Odisha (OR), Punjab (PB), Rajasthan (RJ), Tamil Nadu (TN), Telangana (TG), Uttar Pradesh (UP), Uttarakhand (UK), and West Bengal (WB). We have covered all non-special category states except Goa (GA). Of the 11 special category states (SCS), three Himachal Pradesh (HP), Jammu & Kashmir (JK) and Uttarakhand (UK) are covered. Our coverage of 2 states account for ~95% of total spending by all states, ~94% of total receipts by all states and ~97% of total state development loans (SDLs) issued. We have used these ratios to estimate the finances for all states. Framework of our report The report is divided into four parts. Part-I discusses five themes relevant for the financial markets after careful study of the combined budgets of the center and states. Part-II provides detailed analysis of the pooled budgets for all states. In part- III, we examine the combined budgets of the center and the states. Part-IV is an Appendix, which gives detailed finances of all states and 2 individual states covered in our report. April 218 4
5 Thematic States Budget PART I. FIVE KEY MACRO IMPLICATIONS FOR THE FINANCIAL MARKETS Theme #1: What does the analysis of combined budgets indicate about real GDP growth? Although accounting for ~14% of GDP, government spending (consumption + investment) contributed as much as 22.5% and 16.4% to real GDP growth in and FY18, respectively. With real core revenue spending budgeted to grow at the slowest pace in 4 years, the contribution of fiscal spending to real GDP growth is set to fall further in FY19. We project real GDP to grow 6.9% in FY19, better than 6.7% in FY18, but slower than the market consensus of 7.3% and RBI s forecast of 7.4%. Net market borrowings by the government will absorb 21.8% of non-government financial savings in FY19, lower than 23.2% in FY18 The general election results have been in line with movements in fiscal spending. Real rural spending by the general government is budgeted to grow only 6.6% in FY19, versus an average growth of 16.3% during the previous four years Although pay awards have been revised, the positive impact on macro economy, and the corresponding adverse impact on states finances, has been muted Theme #2: Higher fiscal borrowings unlikely to crowd out private sector Gross market borrowings by all states are budgeted to increase 28.5% to INR5.5t in FY19, similar to the center s borrowings. It means that gross market borrowings by the general government (center + states) will touch INR11t this year. With higher repayments, however, net market borrowings are budgeted at 4.5% of GDP (or INR8.4t) in FY19, marking the lowest level in 11 years. This, we believe, will not tighten the market liquidity because net borrowings will absorb 21.8% of nongovernment financial savings in the economy, lower than 23.2% in FY18. Theme #3: How does fiscal spending behave during election years? An analysis of trends in core revenue spending during election years since the late 199s confirms that while it grew faster in FY99 and FY9, it grew much slower in FY4 and. The incumbents restored power in FY99 and FY9 when spending grew faster, while lost elections when spending grew slowly. The general election results, thus, have been in line with movements in fiscal spending. Theme #4: How much fiscal support is budgeted for the rural sector? Notwithstanding the recent concerns regarding stress in the rural sector, real rural spending by the general government is budgeted to grow only 6.6% in FY19, versus an average growth of 16.3% during the previous four years. It must, however, be noted that the share of rural spending in total spending has increased sharply for both the center and states during the recent years to the highest level in almost two decades. Theme #5: Where is the expected boost from 7th pay revisions? Sixteen out of 18 states except Punjab and West Bengal due for pay revisions have done so between and FY19. As per states budgets, the growth in aggregate salary & wage bill for all states combined was 14.4% in and is budgeted at 16.6% in FY19, much lower than the average growth of 28% between FY9 and FY1. Although pay awards have been revised, the positive impact on macro economy, and the corresponding adverse impact on states finances, has been muted since the states have amortized the pay commission awards by 2-3 years in many cases. April 218 5
6 Notwithstanding the election year, states total spending is budgeted to grow 11.4% in FY19, marking the slowest pace in 13 years Governments are highly optimistic on the receipts front, as both the center and the states have budgeted record high taxto-gdp ratio in FY19 PART II. KEY HIGHLIGHTS FROM STATES FINANCES On an aggregate basis, states have budgeted a fiscal deficit of 2.5% of GDP in FY19, the lowest in five years. Aggregate debt of states crossed 25% of GDP in, from the recent low of 21.7% in and is budgeted to rise marginally to 25.3% of GDP in FY19. States have consistently increased their reliance on market borrowings to finance fiscal deficit in the past few years. On aggregate basis, states gross borrowings are budgeted to rise to INR5.5t or 2.9% of GDP, while net borrowings are expected to rise to INR4.2t or 2.3% of GDP in FY19. Following a record high growth of 22.3% in, total receipts of all states are budgeted to grow 13.5% in FY19. States have not provided GST data on uniform basis, and thus, it is difficult to estimate the budgeted growth or monthly run-rate expected in GST collection in FY19. As many as 1 states, accounting for ~4% of national GDP, will have elections in 219. Notwithstanding the election year, states total spending is budgeted to grow 11.4% in FY19, marking the slowest pace in 13 years. PART III. WHAT DO THE COMBINED BUDGETS TELL US? Aggregate fiscal deficit of the general government in India is budgeted at 5.7% of GDP in FY19, lower than the revised estimate (RE) of 6.3% of GDP in FY18 (higher than of 5.8%). Notably, fiscal deficit of the general government was above 6% of GDP for more than 9% of the time post liberalization. Governments are highly optimistic on the receipts front, as both the center and the states have budgeted record high tax-to-gdp ratio in FY19. India s tax-to- GDP ratio is budgeted to rise to an all-time high of 18.7% of GDP this year, primarily supported by higher indirect taxes (~63% of all taxes), which are budgeted to grow 17% in FY19. It confirms that the governments expect GST to boost tax receipts significantly. Total spending of the general government is budgeted to grow 11% in FY19, similar to that in. As % of GDP, however, total spending is budgeted to slow from 27.9% to 27.7% in FY19. April 218 6


7 DISCUSSION POINTS A Five key macro implications for the financial markets B Key highlights from pooled state budgets C What does the general government budget tell us? SECTION I: FIVE THEMES FOR THE FINANCIAL MARKETS Theme#3 Theme#1 Theme#2 Higher fiscal borrowings unlikely to crowd out private sector 2 How does fiscal spending behave during election years? 3 4 How much fiscal support is budgeted for the rural sector? Theme#4 Theme#5 What does the analysis of combined budgets indicate about real GDP growth? 1 FIVE THEMES FOR THE FINANCIAL MARKETS 5 Where is the expected boost from 7th pay revisions?


8 FIVE THEMES FOR THE FINANCIAL MARKETS What does the analysis of combined budgets indicate about real GDP growth? Theme#1 Contribution of fiscal spending to GDP growth will fall in FY19, as real spending growth at 4-yr slowest pace Higher fiscal borrowings unlikely to crowd out private sector Theme#2 Total borrowings by the government to absorb smaller share of domestic savings in FY19 How does fiscal spending behave during election years? Theme#3 During the past four elections, real fiscal spending growth has shown positive links with election results How much fiscal support is budgeted for the rural sector? Theme#4 Notwithstanding election year, real rural spending to grow at less than half the average growth in the past four years Where is the expected boost from 7th pay revisions? Theme#5??? 7 th pay commission awards to have muted economic and fiscal impact due to amortized payments
 (1")
 Contribution of fiscal spending to real GDP growth is set to fall further in FY19")
")
 % of GDP 4.5 4.1 4. 4. 3.9 4.2 3.")


9 ECONOMY STORY IN CHARTS Government Private Net exports Discrepancies GDP (.8) (1.4) (.8) (.2) Contribution of fiscal spending to real GDP growth is set to fall further in FY19 FY18E FY19F as real core spending of general government budgeted to grow slowly (% YoY) Real core spending of GG due to 14-yr slowest growth in states core spending 25 (% YoY) Core spending FY91 FY95 FY99 FY3 FY7 FY11 Fiscal deficit (INRb) % of GDP ,26 1, ,349 1,896 1,627 1,69 1,956 2,482 3,283 4,257 5,389 4,656 4,635 States have budgeted aggregate fiscal deficit to ease to 2.5% of GDP in FY19 FY91 FY92 FY93 FY94 FY95 FY96 FY97 FY98 FY99 FY FY1 FY2 FY3 FY4 FY5 FY6 FY7 FY8 FY9 FY1 FY11 FY12 However, combined net borrowings are budgeted to fall (% of GDP) despite states financing ~91% of deficit via market borrowings 11 (% of FD) States Centre FY1 FY4 FY7 FY1 FY9 FY11


 Direct taxes Indirect taxes 3 2 1 leading to higher share of indirect taxes in")

 in FY19 FY92 FY93 FY94 FY95 FY96 FY97 FY98 FY99")

10 (% of GDP) Center States Tax-to-GDP ratio budgeted at alltime high based on high optimism on GST regime FY92 FY93 FY94 FY95 FY96 FY97 FY98 FY99 FY FY1 FY2 FY3 FY4 FY5 FY6 FY7 FY8 FY9 FY1 FY11 FY12 as indirect taxes are expected to grow faster than direct taxes 4 (% YoY) Direct taxes Indirect taxes leading to higher share of indirect taxes in total taxes in more than a decade 1 Direct taxes Indirect taxes FY9 FY1 FY11 FY FY99 FY3 FY7 FY11 Total spending Total spending, however, is likely to moderate (as % of GDP) in FY19 FY92 FY93 FY94 FY95 FY96 FY97 FY98 FY99 FY FY1 FY2 FY3 FY4 FY5 FY6 FY7 FY8 FY9 FY1 FY11 FY (% YoY) NDA retained power in NDA lost in 24 Real core revenue spending of GG UPA retained power in 29 UPA lost in 214 Will history repeat in 219? FY97 FY99 FY1 FY3 FY5 FY7 FY9 FY11 Notwithstanding elections in 219, real core revenue spending of general government to grow at 4-yr slowest pace in FY19

 6.")

 2.")


11 (% YoY) Combined real spending on rural sector Rural spending budgeted to grow 6.6% 21.5 in FY19, after average FY99 FY1 FY3 FY5 FY7 FY9 FY11 (2.5) 6.6 Real rural spending by general government also to grow slowly in FY19 however, rural spending has grown faster during the past five years 25 Revenue Capital Total (% CAGR) due to which its share in total spending has increased to the highest level Rural spending by GG FY-4 FY5-9 FY BE FY98 FY99 FY FY1 FY2 FY3 FY4 FY5 FY6 FY7 FY8 FY9 FY1 FY11 FY12 Aggregare salary bill of 2 states th pay commission awards by states to have muted economic and fiscal impact vis-à-vis 6 th pay commission FY9 FY1 FY11 FY12 Where does the center spend? Where do states spend?, 34. Defense, 1.9, 36.6 Education etc, 15.5 Transport, 5.5 Housing, 1.8 Rural sector, 7.1 Pensions, 6.9 Interest payments, 23.6 Subsidies, 12.1 Pension, 9.2 Transport, 4.7 Interest payments, 9.8 Energy, 5.3 Rural sector, 17.2
12 GENERAL GOVERNMENT FINANCES INR b % YoY Total receipts 31,514 36,17 36,21 41, Revenue receipts 3,692 34,85 34,485 39, Total taxes 26,282 3,139 3,26 35, Direct 9,484 11,178 11,373 13, Center (gross) 8,344 9,8 1,3 11, States' own 1,141 1,378 1,343 1, Indirect 16,798 18,961 18,833 22, Center (gross) 8,815 9,316 9,431 11, States' own 7,984 9,645 9,41 1, Non-tax receipts 4,49 4,712 4,279 4, (3.) 9.1 Non-debt capital receipts 822 1,32 1,725 1, (13.1) Total spending 42,71 45,858 46,683 51, Revenue spending 34,89 37,711 38,963 43, Center# 13,115 12,84 13,959 15, States 2,974 24,97 25,4 27, S&W 8,33 9,43 9,37 1, Center 2,744 2,916 3,8 3, States 5,559 6,514 6,361 7, Interest payments 7,446 8,136 8,241 9, Center 4,927 5,231 5,38 5, States 2,519 2,95 2,933 3, Pension 3,53 4,18 4,241 4, Center 1,314 1,312 1,474 1, States 2,216 2,796 2,767 3, Subsidies* 2,348 2,723 2,66 2, Capital spending 7,982 8,147 7,72 8, (3.3) 11.6 Center 2,846 3,98 2,734 3, (3.9) 9.9 States 5,136 5,49 4,986 5, (2.9) 12.5 Agriculture, irrigation and rural development~ 1,267 1,575 1,446 1, Transport 1,817 2,1 1,965 2, Center@ 864 1, , States 953 1,8 1,56 1, Defense* Loans and advances 1, (59.6) (3.9) Fiscal deficit 1,557 9,688 1,473 1,586 % of GDP Revenue deficit 3,397 2,86 4,478 3,472 % of GDP Primary deficit 3,111 1,552 2,232 1,57 % of GDP GSDP (at current prices) 152, , , ,149 # adjusted for transfers to states * for Center includes railways also ~ for states only Source: States/Union budget documents, MOSL April
13 PART I. Five key macro implications for the financial markets Theme #1 What does the analysis of combined budgets indicate about real GDP growth? Although accounting for ~14% of GDP, government spending (consumption + investment) contributed as much as 22.5% and 16.4% to real GDP growth in and FY18, respectively. With states budgeting 14-year slowest growth in core spending (total spending excluding interest payments), the contribution of fiscal spending to real GDP growth is expected to fall further in FY19. We project real GDP to grow 6.9% in FY19, better than in FY18, but slower than the market consensus of 7.3% and RBI s forecast of 7.4%. The share of private spending in GDP has fallen sharply from ~92% in to 85.5% in A quick background: Share/contribution of private and government spending to GDP growth The Central Statistics Office (CSO), the official agency of the Government of India (GoI), provides GDP statistics regularly in two ways expenditure approach and output approach. As a regular in-house practice, we re-classify GDP statistics with a new approach, wherein we separate fiscal investments from the other sectors (including households, private corporate and public corporate sectors) investments. This re-classification helps us separate private spending (consumption + investments) from the fiscal (including central and state governments) spending. Our estimates suggest that the share of private spending in GDP has fallen sharply from ~92% in to 85.5% in, before improving to 86.5% in FY18E (Exhibit 1-2). Nevertheless, fiscal spending maintained its growth in such a manner that its share in GDP was broadly unchanged at close to 14% over the past five years. Net exports, as the exhibits show, narrowed sharply post, and added to real GDP growth between and. Exhibit 1: Private spending accounted for ~92% of GDP and government spending for 14% of GDP in Exhibit 2: In FY18, while the share of private sector fell to 86.5%, it remained unchanged for the government FY18E Private spending*, 92. General government#, 14. Net exports, (6.4) Discrepancy,.5 Private spending*, 86.5 General government#, 14.1 Net exports, (2.3) Discrepancy, 1.7 # Center + States * All sectors including public corporations except general government Source: Central Statistics Office (CSO), Union/State budget documents, CEIC, MOSL April
14 While real private spending grew at a CAGR of 6.7% between and FY18, government spending grew much faster at 8.6%. Re-classification on GDP statistics also confirms that while real private spending grew at a CAGR of 6.7% between and FY18, government spending grew much faster at 8.6%. Real GDP growth, thus, grew at a CAGR of 7.3% during this period (Exhibit 3). In FY18, however, growth in private and government spending was broadly similar at ~7.5% (Exhibit 4). It is also notable that fiscal support to real GDP growth began rising from, when crude oil prices started collapsing. Notwithstanding the mega bonanza from a ~75% decline in crude oil prices, fiscal deficit of the general government (GG) as discussed in detail later in the report was unchanged at 6.6% of GDP between and. Exhibit 3: Government spending has grown faster than private spending since (CAGR %) Exhibit 4: however, their spending growth was similar at ~7.5% each in FY18E (% YoY) Private spending Govt spending GDP Private Government FY18E Source: CEIC, RBI, CSO, MOSL Real core spending of the general government (center + states) is budgeted to grow 6.6% in FY19, slowest in the past four years What is to be expected for FY19? Our analysis of the budgets of 2 states, which account for ~93% of national GDP and ~95% of total spending by all states in the country, confirm that states have budgeted a 14-year slow growth of 11.4% in core total core spending (total spending less interest payments, relevant for GDP) in FY19 (Exhibit 5). Combining this with the Union Budget and using GFCE deflator, our calculations suggest that real core spending of the general government (center + states) is budgeted to grow 6.6% in FY19, slowest in the past four years (Exhibit 6). Exhibit 5: States core spending* in FY19 is budgeted to grow at the slowest pace in 14 years 25 2 (% YoY) Core spending Exhibit 6: due to which real core spending of general government is likely to grow more slowly (% YoY) Real core spending of GG FY91 FY95 FY99 FY3 FY7 FY11 * Total spending excluding interest payments Source: Union/State budget documents, CEIC, RBI, CSO, MOSL April
15 Consequently, we believe that slower fiscal spending and moderation in private investments (primarily due to very high base in FY18E) would offset a large part of the positive contributions from private consumption and net exports (the incremental drag on real GDP growth will be lower than in FY18) in FY19 (Exhibit 7). We, thus, expect India s real GDP to grow 6.9% in FY19, better than 6.7% estimated for FY18 but slower than the market consensus of 7.3% and 7.4% forecasted by the Reserve Bank of India (RBI). Exhibit 7: Key contributors to real GDP growth (percentage points) Government Private Net exports Discrepancies GDP (.8) (1.4) (.8) (.2) FY18E FY19F Source: CSO, Union/State budget documents, CEIC, MOSL April
16 Theme #2 Higher fiscal borrowings unlikely to crowd out private sector Our estimates suggest that gross market borrowings by all states are budgeted to grow 28.5% to INR5.5t in FY19, similar to the center s borrowings. It means that gross market borrowings by the general government (center + states) will touch INR11t this year. With higher repayments, however, net market borrowings are budgeted at INR4.2t for states and INR8.4t for the general government. This would imply net borrowings worth 4.5% of GDP in FY19, marking the lowest level in 11 years. This, we believe, will not tighten market liquidity because net borrowings will absorb 21.8% of non-government financial savings in the economy, lower than 23.2% in FY18. Our estimates suggest that gross borrowings by all states would be about INR5.5t in FY19, 28.5% higher than in FY18 Gross borrowings could touch INR11t in FY19 According to RBI data, our sample of 2 states accounted for ~97% of market borrowings by all states in the past many years. Assuming a similar ratio, our estimates suggest that gross borrowings by all states would be about INR5.5t in FY19, 28.5% higher than in FY18 (Exhibit 8). According to the indicative calendar of market borrowings by state governments released by the RBI this month, states are planning to borrow INR1,156b-1,281b in 1QFY19. As per our estimates, this would be 21-23% of gross market borrowings budgeted by the state governments for the full year. A look at the past trends reveals that states tend to borrow ~16% of their gross borrowings in the first quarter (Exhibit 9). Exhibit 8: States estimated to borrow INR5.5t in FY19 (INRb) Gross market borrowings by states 5,45 4,243 Exhibit 9: of which ~22% is planned in the first quarter# FY9 FY1 FY11 FY12 FY1 FY11 FY12 FY18 FY19 * Assuming our sample of 2 states account for 97% of borrowings by all states in FY19, same as in previous years #Based on our estimate of full-year borrowings by all states Source: States budgets, RBI, CEIC, MoSL A look at the 2 states individually shows that Gujarat (GJ) and Maharashtra (MH) have budgeted for the least net (gross) market borrowings worth 1.6% (2.2%) and 1.7% (2.3%) of GSDP, respectively, while Jammu & Kashmir (JK), Rajasthan (RJ), Telangana (TG) and West Bengal (WB) have budgeted for net borrowings of above 3% of GSDP the highest for FY19 (Exhibit 1). April
17 Exhibit 1: Budgeted net/gross borrowings by states for FY19 (% of GSDP) Net Repayments AP BH CT GJ HR HP JK JH KA KL MP MH OR PB RJ TN TG UP UK WB All Source: State Budgets, RBI, CEIC, MoSL It is also important to note that while aggregate fiscal deficit of states is budgeted to fall from INR4.65t in to INR4.63t in, gross market borrowings have increased to INR5.5t. During the last five years, while the states have increased their reliance on market borrowings, the center has reduced it (Exhibit 11). In FY19, while the states have budgeted to finance 91% of their deficit by market borrowings, the center has budgeted only 66%. (Of course, NSSF has shifted from the states to the center, which played an important role here.) Exhibit 11: States have increased their reliance on market borrowings, while the center has reduced it (% of FD) (% of FD) States Centre Exhibit 12: General government gross borrowings budgeted to be about INR11t in FY19 (INR b) 12, 9, 6, 3, Centre States 6 5 FY9 FY11 FY1 FY2 FY3 FY4 FY5 FY6 FY7 FY8 FY9 FY1 FY11 FY12 Source: Union/State Budgets, RBI, CEIC, MoSL Gross market borrowings of the general government are budgeted to fall from 6.1% of GDP in to 5.9% in, marking the lowest level in eleven years however, budgeted to fall to 11-year lowest level of 5.9% of GDP in FY19 Overall, the combined gross market borrowings of the center and states are budgeted to be about INR11t in FY19 (Exhibit 12), and states are budgeted to borrow similar amount as the center for the first time in India s economic history. Nevertheless, gross market borrowings of the general government (center + states) are budgeted to fall from 6.1% of GDP in to 5.9% in, marking the lowest level in eleven years (Exhibit 13). April
18 Exhibit 13: Gross market borrowings by the general government (% of GDP) (% of GDP) Centre All states FY91 FY92 FY93 FY94 FY95 FY96 FY97 FY98 FY99 FY FY1 FY2 FY3 FY4 FY5 FY6 FY7 FY8 FY9 FY1 FY11 FY12 Source: Union/State Budgets, RBI, CEIC, MoSL Net borrowings of the general government will absorb 21.8% of nongovernment financial savings in FY19, lower than 23.1% in the recently concluded year Fiscal borrowings unlikely to crowd out private sector As the government plans to borrow record-high amount from the markets in FY19, could it tighten market liquidity and potentially crowd out private investments? We don t think so. From a market liquidity perspective, net borrowings are more important than gross borrowings. And net market borrowings of GG are budgeted to fall from 4.8% of GDP in FY18 to 4.5% in FY19. While states have budgeted a rise in net borrowings from 2% of GDP in FY18 to 2.3% in FY19, the center has budgeted a sharp fall from 2.7% to 2.2% of GDP in FY19. Like other sectors, the government also borrows from the non-government financial savings of the domestic sector, which comprises corporate savings and households net financial savings. Our estimates/forecasts suggest that nongovernment financial savings of the economy fell from 22.6% of GDP in to 2.8% in FY18 and further to 2.5% in FY19 (Exhibit 14). If so, it implies that net borrowings of the general government will absorb 21.8% of non-government financial savings in FY19, lower than 23.1% in the recently concluded year (Exhibit 15). Accordingly, we don t expect record borrowings by the government to tighten liquidity in the economy or crowd out private investments. Nevertheless, gross borrowings, inflation prospects and the duration/maturity profile of bonds may play a more important role for bond yields, and thus, even though the liquidity situation is unlikely to turn tight this year, the benchmark yield could go either way. Exhibit 14: Domestic savings expected to be at 15-year lowest level in FY19 (% of GDP) 45 Government Physical savings Non-government financial savings Exhibit 15: of which ~22% - lower than ~23% in FY18 - is expected to be absorbed by general government (%) 4 (%) Absorption of domestic savings* by government (% of GDP) FY91 FY95 FY99 FY3 FY7 FY11 FY19F FY1 FY3 FY5 FY7 FY9 FY11 FY19F FY18 and FY19 are our forecasts * Non-government financial savings Source: Union/State Budgets, RBI, CEIC, MoSL April
19 Theme #3 How does fiscal spending behave during election years? Unlike commonly perceived, we don t find evidence of any extraordinary surge in fiscal spending (of the central or general government) in an election year. While core revenue spending (more relevant from election perspective) grew faster in FY99 and FY9, it grew slower in FY4 and. What, however, is interesting to note which could be entirely coincidental is that the election results have been in line with movements in fiscal spending. The incumbents restored power in FY99 and FY9 when spending grew faster, but lost elections when spending grew slowly. Fiscal spending is budgeted to grow slowly in FY19 also. We also didn t find any uniform trends in capital spending during election years. FY19 budgets hold more importance than other years because of general elections in May 219. Therefore, we have attempted to understand if fiscal spending witnesses any extraordinary movements during election years (FY99, FY4, FY9 and ). If yes, what have been their implications? And of course, what are the takeaways, if any, for the upcoming elections? Fiscal spending during election years and its influence on election results Instead of analyzing only the center s budget, we decided to analyze spending patterns of the general government (center and states) because a large number of states have their election schedules coinciding with the general elections. As many as ten states AP, AR, CT, HR, MP, MH, OD, RJ, SK and TG accounting for ~4% of national GDP, will have elections in 219. Therefore, we analyze the patterns in real core revenue spending (revenue spending less interest payments deflated by GFCE deflator) of the general government. We find that spending growth during the election year and the election results are linked Based on the past five elections since the late 199s, we find that spending growth during the election year and the election results are linked (Exhibit 16). In FY99, real core revenue spending grew sharply by ~18% and the Vajpayee government retained power in In FY4, however, fiscal spending growth was only 4.4% and the NDA lost elections in 24. In FY9, core revenue spending grew sharply by 2% and the UPA was re-elected in 29 but lost in 214, when spending growth was only 1.5% in. Our analysis of FY19 budgets confirms that real core revenue spending is budgeted to grow 6.6%, slower than 8.4% average growth in the previous three years (please see Exhibit 16). Will history repeat in 219? April
20 Exhibit 16: Real core revenue spending of general government during election years (% YoY) NDA retained power in 1999 NDA lost in 24 Real core revenue spending of GG UPA retained power in 29 UPA lost in 214 Will history repeat in 219? FY97 FY99 FY1 FY3 FY5 FY7 FY9 FY11 GG core revenue spending deflated by GFCE deflator Source: Union/State Budgets, RBI, CEIC, MoSL We also looked at the core revenue spending growth of the center and the states separately and noticed that the movements in the center s spending follow the spending pattern of the general government (Exhibit 17). States spending, however, has been more volatile, and in fact, grew faster in FY4, when the center s spending growth moderated (Exhibit 18). Exhibit 17: Core revenue spending of the center during election years follows the pattern in GG spending (% YoY) Core revenue spending of center Exhibit 18: however, core revenue spending of states is more volatile (% YoY) Core revenue spending of states FY95 FY99 FY3 FY7 FY11 FY95 FY99 FY3 FY7 FY11 Source: Union/State Budgets, RBI, CEIC, MoSL There is no apparent uniform pattern in the government s capital spending during election years What happens to capital spending during election years? While there are links between core revenue spending growth and elections results, there is no such apparent uniform pattern in the government s capital spending during election years (Exhibit 19). One important point, however, one can notice is that capex growth during NDA regimes (FY99 and FY4) was higher than that in UPA regimes (FY9 and ). For FY19 also, capital spending of the general government is budgeted to grow 11.6%, better than 1.8% in. April 218 2
21 Exhibit 19: Capital spending of general government during election years (% YoY) Capital spending of general government -4 FY97 FY99 FY1 FY3 FY5 FY7 FY9 FY11 Source: Union/State Budgets, RBI, CEIC, MoSL Here also, while the movements in center s capital spending follow the trends in GG s capex, states capital spending is more volatile (Exhibit 2-21). Further, capital spending of states in FY9 was much better than the sharp decline in the center s capital spending. In FY19, states capital spending is budgeted to grow 12.5%, better than ~1% growth budgeted by the center. Exhibit 2: Capital spending of the center has been more volatile than core revenue spending (% YoY) Capital spending of center Exhibit 21: as has been the capital spending of states versus their core revenue spending (% YoY) Capital spending of states FY95 FY99 FY3 FY7 FY11 FY95 FY99 FY3 FY7 FY11 Source: Union/State Budgets, RBI, CEIC, MoSL April
22 Theme #4 How much fiscal support is budgeted for the rural sector in FY19? Notwithstanding the recent concerns regarding stress in the rural sector, real rural spending by the general government is budgeted to grow only 6.6% in FY19, versus an average growth of 16.3% during the previous four years. For states, capital spending is budgeted to grow faster than revenue spending in the rural sector. It must, however, be noted that the share of rural spending in total spending has increased sharply for both the center and states during the recent years to the highest level in two decades. Real rural spending by the general government is also budgeted to grow only 6.6% in FY19, the slowest pace in five years The importance of rural sector for the economy and the government is unarguable. As discussed above, notwithstanding election year, there is no spike in real fiscal spending of the general government (center + states) in. It, then, does not come as a surprise that real rural spending by the general government is also budgeted to grow only 6.6% in FY19, the slowest pace in five years (Exhibit 22). Exhibit 22: Rural spending growth by 17 states (% YoY) 3 (% YoY) Combined real spending on rural sector Rural spending budgeted to grow 6.6% in FY19, after average growth of 16.4% in the past four years (7.) FY99 FY1 FY3 FY5 FY7 FY9 FY11 Deflated by CPI for Rural Laborers (RL) Highlighted areas are election years Source: Union/State Budgets, RBI, CEIC, MOSL Rural spending by both the center and states is budgeted to grow much slower than in the past few years. While the center has budgeted a growth of 8.6% in rural spending in FY19 as against an average growth of 25.6% in the past two years (Exhibit 23), states have budgeted 9.9% growth in rural spending versus an average growth of 23.5% in the past four years (Exhibit 24). April
23 Exhibit 23: Center has budgeted 8.6% growth in rural spending in FY (% YoY) Rural spending by center* Exhibit 24: and states have also budgeted 5-year slowest growth of 9.9% 4 3 (% YoY) Rural spending by states# (25) FY1 FY4 FY7 FY1 FY1 FY4 FY7 FY1 * Spending on Agriculture + Rural development Source: Union Budget documents, CEIC, MoSL # Spending on Agriculture + Rural development + Irrigation Source: State Budgets, CEIC, MoSL While revenue spending by states in the rural sector is budgeted to grow at 15- year lowest level of 5.3% in FY19, capital spending is budgeted to grow strongly at ~22% For states, although rural spending is budgeted to grow at 5-year slowest growth of 9.9%, it is entirely because of slower growth in the revenue spending in the rural sector. While revenue spending in the rural sector is budgeted to grow at 15-year slowest level of 5.3% in FY19, capital spending is budgeted to grow strongly at ~22% (Exhibit 25). Consequently, the share of capital spending in the total rural spending is budgeted to increase to above 3% in FY19 (Exhibit 26). Exhibit 25: Revenue and capital spending in the rural sector by states during the past decade (% YoY) (% YoY) Revenue Capital Exhibit 26: Share of revenue and capital spending in total rural spending by states (%) Revenue spending Capital spending FY9 FY11 FY4 FY7 FY1 Source: State Budgets, RBI, CEIC, MOSL During the past five years, capital spending in the rural sector has grown slightly faster than the growth in revenue spending in the rural sector Further, during the past five years (NDA-II period over -19), capital spending in the rural sector has grown slightly faster than the growth in revenue (or consumption) spending in the rural sector (Exhibit 27). This has been in stark contrast to the trend of the previous five years (UPA-II period over FY1-14), when capital spending in the rural sector was an abysmally low 3.4%, while revenue spending was strong at 14.1%. Another important observation is that while growth in capital spending in the rural sector was high at 21.5% during the NDA-II period, it was even higher at 23.6% during the UPA-I period (FY5-9). In comparison, revenue spending in the rural sector grew ~21% during NDA-II period, which was, by far, the highest growth seen during the past two decades. Consequently, rural spending growth was also the highest. This is also apparent from the fact that the share of rural spending by the April
24 general government crossed 14% of total spending for the first time since the late 199s (Exhibit 28). Notably, it was higher than 17% for states, while it was ~7% for the center. Exhibit 27: Revenue and capital spending in the rural sector by states during the past two decades (% CAGR) 25 Revenue Capital Total Exhibit 28: Share of rural spending in total spending has risen to the highest level since the late 199s (%) 2 Rural spending by GG FY-4 FY5-9 FY BE FY98 FY1 FY4 FY7 FY1 Source: Union/State Budgets, RBI, CEIC, MOSL A look at the rural spending by individual states confirms that Maharashtra (MH) and Uttar Pradesh (UP) the two largest states in terms of fiscal spending have budgeted a decline in rural spending in FY19, primarily because both the states had implemented a farm loan waiver in FY18 due to which rural spending grew ~6% and 8%, respectively in (Exhibit 29). Gujarat has also budgeted a decline in rural spending in FY19, while Punjab (PB) has budgeted the highest growth of 47.5% in FY19. Exhibit 29: Rural spending growth by 2 states (% YoY) (% YoY) Average growth in last two years (1.) (2.6) (19.4) AP BH CT GJ HR HP JK JH KA KL MP MH OR PB RJ TN TG UP UK WB All Source: State Budgets, RBI, CEIC, MOSL April
25 Theme #5 Where is the expected boost from 7th pay revisions? Sixteen out of 18 states except Punjab and West Bengal due for pay revisions have done so between and FY19. As per states budgets, the growth in aggregate salary & wage bill for all states combined was 14.4% in and budgeted at 16.6% in FY19, much lower than the average growth of 28% between FY9 and FY1. Although pay awards have been revised, the positive impact on the macro economy, and the corresponding adverse impact on states finances, has been muted since the states have amortized the pay commission awards by 2-3 years in many cases. Unlike during the previous pay revisions, states have spread the commission awards over 4-5 years beginning, which has diluted the impact of such revisions After implementation of the seventh central pay commission in, states have followed and implemented pay revisions for their employees. Nevertheless, unlike during the previous pay revisions, states have spread the commission awards over 4-5 years beginning, which has diluted the impact of such revisions. Many states including Bihar (BR), Odisha (OR) and Tamil Nadu (TN), implemented the pay revisions during the last year (FY18), while three more states Jammu & Kashmir (J&K), Karnataka (KA) and Maharashtra (MH) have provided for the pay revisions in FY19 (please see Exhibit 32 on the next page). Notably, Tamil Nadu (TN), which is known for its precarious financial situation, revised the pay and allowances of government employees and pension for pensioners with effect from October 1, 217. There has been a substantial increase in salaries and pension components in the Revised Estimates for and the Budget Estimates for , owing to the implementation of the Seventh Pay Commission recommendations, Deputy Chief Minister, Mr Thiru O Panneerselvam, stated in his speech on March 15, 218. Exhibit 3: Annual change in aggregate salary & wages (S&W) spending budgeted by 2 states (% YoY) Aggregare salary bill of 2 states FY9 FY11 Shaded regions represent periods of pay revisions Exhibit 31: Share of different states in salary and wages (S&W) expenditure in (% of total) UP, 14.7 PB, 3.1 WB, 6. TG, 3.1 TN, 7.4 RJ, 7. OR, 3.8 AP, 5. BH, CT, GJ, 4.2 UK, 2. HR, 2.9 HP, 1.6 MH, 14.7 JK, 3.4 JH, 1.8 KA, 4.7 KL, 4.7 MP, 4.6 As % of aggregate S&W of 2 states Source: State Budgets, RBI, CEIC, MOSL Aggregate salary & wage bill for all states combined grew 14.4% in and budgeted to grow 16.6% in FY19, much lower than the average growth of 28% between FY9 and FY1 Not surprisingly then, the growth in aggregate salary & wage bill for all states combined was 14.4% in and budgeted at 16.6% in FY19, much lower than the average growth of 28% between FY9 and FY1 (Exhibit 3). This is despite the fact that almost all states (except West Bengal (WB) and Punjab (PB)) have provided for the pay revisions. Lower growth this time, however, can be attributed to the fact that states have amortized the pay commission awards over many years. Gujarat (GJ), for example, implemented in, but announced to pay arrears in March 218, May 218 and July 218. Similarly, Maharashtra (MH) has provided for only INR1b in FY19 and the arrears are to be paid in 3-4 installments over subsequent April
26 years. As exhibit 31 shows, MH alone accounts for ~15% of the total budget on salary & wages (S&W), similar to Uttar Pradesh (UP), followed by Tamil Nadu (7.4%) and Rajasthan (7%). Exhibit 32: State-wise details of Pay Commission awards States Commentary States not due to announce/yet to implement pay revisions What do numbers say? # - (A)* Andhra Pradesh (AP) Tenth Pay Commission implemented in Next is due in 219 (4.1)~ Punjab (PB) No announcement yet Telangana (TG) Tenth Pay Commission implemented in Next is due in 219 ~ West Bengal (WB) Follows its own pay revisions time-table States which implemented Seventh Pay Commission in Gujarat (GJ) Implemented in w.e.f. January 216. Arrears to be paid in Haryana (HR) Implemented in with effect from January Himachal Pradesh (HP) Implemented in Kerala (KL) Provisions for 1 th Pay Commission spread over two years Uttar Pradesh (UP) Announced in December 216 and implemented in January 217. Arrears to be settled in two installments Uttarakhand (UK) Announced in December 216 and implemented in January States which made provisions for Seventh Pay Commission in Bihar (BH) Implemented in May 217 with effect from April Chhattisgarh (CT) Implemented in Jharkhand (JH) Implemented in with effect from January Higher salaries to be paid in July 217 with effect from January 216. Madhya Pradesh (MP) Arrears to be paid in three installments; May every year beginning FY19 Implemented in September 217 w.e.f. January 216. Government to clear Odisha (OR) arrears partially in FY Rajasthan (RJ) Sufficient provisions made in budget Tamil Nadu (TN) Implemented on October 1 st States which made provisions for Seventh Pay Commission in Jammu & Kashmir To be implemented from April 218 with effect from January Karnataka (KA) Pay Commission expected to be implemented from July 1 st, Maharashtra (MH) Implemented w.e.f. January 216. Arrears to be paid in 3-4 installments Total (2 states) # Change in salaries & wages spending bill for states Source: State Budgets, MOSL * Average of the three years up to ~ Since AP was bifurcated in 214. Data is not comparable April
27 A look at the growth in S&W bill for individual states confirms that J&K and KA have budgeted the highest growth of ~35% because of the pay revisions this year (Exhibit 33). Many other states such as OR, RJ and UP have also budgeted for high growth (of >2%) because the arrears are planned to be paid this year. MH has also budgeted for slower growth (than J&K and KA) because it has not provided for the arrears in FY19. Exhibit 33: Budgeted growth in salary & wages by 2 states (% YoY) All AP BH CT GJ HR HP JK JH KA KL MP MH OR PB RJ TN TG UP UK WB Source: State Budgets, RBI, CEIC, MOSL Salary & wages account for 22.2% of total spending by all states in FY19 and as much as ~27% of states revenue spending It is also interesting to note that salary & wages (excluding pensions) account for 22.2% of total spending by all states in FY19 (Exhibit 34) and as much as ~27% of states revenue spending. Among the 2 states, Uttar Pradesh (UP) has the highest share, with S&W accounting for about one-third of total spending in FY19, while the lowest share (~12%) is for Bihar (BH). The share of salary & wages is also high at ~3% in Maharashtra (MH). Exhibit 34: Share of salary & wages in total spending (%) BH WB KA JH MP GJ AP CT HR All TG OR RJ UK TN PB KL MH HP JK UP Source: State Budgets, RBI, CEIC, MOSL April
28 PART II. Key highlights from states finances In part II, we delve deeper into the results from the analysis of the pooled state budgets. This part is divided into three sections. Key highlights are: II.1. What do the headline numbers suggest? On an aggregate basis, states have budgeted a fiscal deficit of 2.5% of GDP in FY19, the lowest in five years. Notably, states deficit in was 2.8% of GDP, higher than 2.6% budgeted last year. For FY19, GJ and MH have budgeted the least deficit, while JK, HP and PB have budgeted the highest deficit. States have consistently increased their reliance on market borrowings to finance fiscal deficit in the past few years. On aggregate basis, states gross borrowings are budgeted to rise to INR5.5t or 2.9% of GDP, while net borrowings are expected to rise to INR4.2t or 2.3% of GDP in FY19. Aggregate gross debt of states crossed 25% of GDP in, from the recent low of 21.7% in. It is budgeted to rise marginally to 25.3% of GDP in FY19. States have not provided GST data on uniform basis, and thus, it is difficult to estimate the budgeted growth or monthly run-rate expected in GST collection in. Notwithstanding the election year, states total spending is budgeted to grow 11.4% in FY19, marking the slowest pace in 13 years II.2. What do receipt estimates tell us? Following a record high growth of 22.3% in, total receipts of all states are budgeted to grow 13.5% in FY19. For the first time in five years, states have budgeted a higher growth (of 14.7%) in own receipts, which account for ~53% of total receipts, in comparison to the support from the center (budgeted to grow 12.7%). States have not provided GST data on uniform basis, and thus, it is difficult to estimate the budgeted growth or monthly run-rate expected in GST collection in. However, on an aggregate basis, GST collections are expected to be ~43% of states own taxes in FY19, ranging from ~63% for J&K to ~15% for AP. II.3. Where are the states planning to spend? As many as 1 states, accounting for ~4% of national GDP, will have elections in 219. Notwithstanding the election year, states total spending is budgeted to grow 11.4% in FY19, marking the slowest pace in 13 years. Almost one-third of total spending is budgeted to be spent on the rural and education sectors, while interest payments account for ~1%. Within total spending, the states have budgeted 11.2% growth in revenue spending, as against record-high growth of 19.2% in and 12.5% in capital spending versus a decline of ~3% in. Although almost all states have implemented the pay revisions partly or fully, aggregate bill on salary & wages is budgeted to grow 16.6% in FY19 as against 14.4% in. In contrast, the average growth in S&W bill during the previous pay revisions was ~25% between FY9-11. April
29 II.1. What do the headline numbers suggest? On an aggregate basis, states have budgeted a fiscal deficit of 2.5% of GDP in FY19, lowest in the five years. Notably, states deficit in was 2.8% of GDP, higher than 2.6% budgeted last year. For FY19, GJ and MH have budgeted the least deficit of sub-2% of GSDP, while JK, HP and PB have budgeted the highest deficit of over 4% of GSDP. States have consistently increased their reliance on market borrowings to finance fiscal deficit in the past few years. On aggregate basis, states gross borrowings are budgeted to rise to INR5.5t or 2.9% of GDP, while net borrowings are expected to rise to INR4.2t or 2.3% of GDP in FY19. Aggregate gross debt of states crossed 25% of GDP in, from the recent low of 21.7% in. It is budgeted to rise marginally to 25.3% of GDP in FY19. While the states had overachieved their fiscal deficit targets for almost the entire decade up to (barring FY9), actual deficit has turned out to be higher than BEs during the past four successive years Fiscal deficit target missed for fourth consecutive year in FY18: Fiscal deficit targets are met during good periods, when the private sector is buoyant enough to take care of the economy. However, as economic growth weakens, the government has to support the economy by shedding its deficit targets. How long the government can support the economy depends on fiscal capacity. This is exactly what seems to have happened in the past many years. While the states had over-achieved their fiscal deficit budget estimates (BEs) for almost the entire decade up to (barring FY9), actual (and revised estimate (RE) for FY18) deficit has turned out to be higher than BEs during the past four successive years (Exhibit 35). In and, while states had budgeted deficit of 2.3% and 2.7% of GDP, respectively, the actual deficit was higher by.8pp each year (Exhibit 36). For FY18, states have revised their combined deficit from 2.5% of GDP to 2.8%. Exhibit 35: Comparison of BEs and REs/actual fiscal deficit of 2 states* since FY4 (% of GDP) Exhibit 36: One-off schemes led to serious underachievement of deficit targets in recent years 6 Budget estimates (BEs) Actual/REs Under/Over-achievement of GFD FY4 FY6 FY8 FY1 FY12 FY18 * Not for all states (.2) (.5) (.6) (.6) (.) (.1) (.3) (.5) (.5) FY4 FY6 FY8 FY1 FY12 FY18 Source: State Budgets, RBI, CEIC, MOSL However, the past few years were actually marred, with some exceptional schemes that burdened states finances However, to be fair, the past few years were actually marred, with some exceptional schemes that burdened states finances. The announcement of UDAY in December 215 and its implementation in subsequent years, and the approval of 7 th central pay commission in July 216 made states follow the center in mid-. Even in FY18, some states like BH, OR and TN had not budgeted for pay revisions in the BEs, but implemented 7 th pay commission during the year. April
30 States have budgeted aggregate deficit of 2.5% of GDP, the lowest in five years Fiscal deficit budgeted at 5-year lowest level in FY19 : As far as the aggregate fiscal deficit for FY19 is concerned, states have budgeted aggregate deficit of 2.5% of GDP, the lowest in five years (Exhibit 37). In absolute terms, however, states deficit declined in FY18 and is budgeted to remain broadly unchanged at INR4.64t in FY19 also. Exhibit 37: Long-run trend in states fiscal deficit Fiscal deficit (INRb) % of GDP FY91 FY92 FY93 FY94 FY95 FY96 FY97 FY98 FY99 FY FY1 FY2 FY3 FY4 FY5 FY6 FY7 FY8 FY9 FY1 FY11 FY ,26 1, ,349 1,896 1,627 1,69 1,956 2,482 3,283 4,257 5,389 4,656 4,635 Source: State Budgets, RBI, CEIC, MOSL with GJ budgeting lowest and JK budgeting highest deficit: A look at the FY19 budgeted fiscal deficit for individual states reveals that Gujarat (GJ) and Maharashtra (MH) are the only states that have budgeted deficit of sub-2% of GSDP. On the contrary, Jammu & Kashmir (JK), Himachal Pradesh (HP) and Punjab (PB) are the only three states that have budgeted FY19 deficit at over 4% of GSDP (Exhibit 38). Exhibit 38: fiscal deficit for individual states fiscal deficit GJ MH BH JH WB All KA UK AP TN HR UP RJ CT KL MP TG OR PB HP JK Source: State Budgets, RBI, CEIC, MOSL Further, while the aggregate fiscal deficit of all states was revised up from 2.5% of GDP to 2.8% of GDP in FY18, some states like JK, PB and GJ have actually overachieved their deficit targets. Nevertheless, the slippages from BH, HP, WB, RJ and AP were enough to drive the aggregate deficit higher (Exhibit 39). April 218 3
31 Exhibit 39: How did states fare in FY18? GJ (% of GDP) RE-BE MH (.3) 1.9 JH (.2) 2.5 UK (.1) 2.5 KA All TN (.1) (.2) (.) HR 2.8. UP WB (1.3) (.) TG KL CT MP OR RJ AP (.5) (.5) PB JK HP (1.4) 4.9 BH (4.6) 7.5 Source: State Budgets, RBI, CEIC, MOSL States are planning to finance as much as 91% of its aggregate fiscal deficit by market borrowings in FY19 States are more reliant on market borrowings now: While states aggregate fiscal deficit has contracted in absolute terms in FY18, gross/net market borrowings have continued to surge, as states are turning more dependent on market borrowings than other sources of financing. Gross/net market borrowings of states have risen from 1.8%/1.5% of GDP in FY12 to 2.5%/2.1% of GDP in FY18 and are budgeted to rise further to 2.9%/2.3% in FY19 (Exhibit 4). Our calculations suggest that states are planning to finance as much as 91% of its aggregate fiscal deficit by market borrowings in FY19 (Exhibit 41). April
32 Exhibit 4: Gross and net market borrowings by states (% of GDP) Gross borrowings Net borrowings Exhibit 41: Net market borrowings to account for ~9% of fiscal deficit in (%) (% of FD) 25 FY1 FY11 FY12 FY91 FY95 FY99 FY3 FY7 FY11 Source: Union/State Budgets, RBI, CEIC, MOSL A look at the individual states shows that Gujarat (GJ) and Maharashtra (MH) have budgeted for the least net (gross) market borrowings worth 1.6% (2.2%) and 1.7% (2.3%) of GSDP, respectively, while Jammu & Kashmir (JK), Rajasthan (RJ), Telangana (TG) and West Bengal (WB) have budgeted for net borrowings of above 3% of GSDP the highest for FY19 (Exhibit 42). Exhibit 42: Budgeted gross/net borrowings by individual states in FY19 (% of GDP) Net Repayments AP BH CT GJ HR HP JK JH KA KL MP MH OR PB RJ TN TG UP UK WB All Source: State Budgets, RBI, CEIC, MOSL States debt at 25.3% of GDP in FY19 highest in nine years: Finally, it is important to note that as states fiscal deficit widened during the past four years, states aggregate gross debt (or total liabilities) also turned unfavorable. From its twodecade low of 21.7% of GDP in, aggregate debt crossed 25% in for the first time since FY1. Aggregate debt is budgeted to increase to 25.3% of GDP in FY19 (Exhibit 43). April
33 Exhibit 43: Gross debt of states crossed 25% of GDP in (% of GDP) Total liabilities FY91 FY93 FY95 FY97 FY99 FY1 FY3 FY5 FY7 FY9 FY11 Source: State Budgets, RBI, CEIC, MOSL A look at the debt level for individual states confirms that while GJ and MH have the least leverage (<17% of GSDP), JK and PB have the highest debt-to-gsdp ratio in excess of 4% (Exhibit 44). Exhibit 44: Gross debt of individual states in FY19 (% of GSDP) Debt-to-GDP GJ MH CT KA OR TN TG HR UK All MP BH JH AP UP KL HP RJ WB PB JK Source: State Budgets, RBI, CEIC, MOSL April
34 II.2. What do aggregate receipt estimates tell us? Following a record high growth of 22.3% in, total receipts of all states are budgeted to grow 13.5% in FY19. For the first time in five years, states have budgeted a higher growth (of 14.7%) in own receipts, which account for ~53% of total receipts, in comparison to the support from the center (budgeted to grow 12.7%). States have not provided GST data on uniform basis, and thus, it is difficult to estimate the budgeted growth or monthly run-rate expected in GST collection in FY19. However, on an aggregate basis, GST collections are expected to be ~43% of states own taxes in FY19, ranging from ~63% for JK to ~15% for AP. As a percentage of GDP, states total receipts budgeted to rise further to 15.4% in FY19 Following a record high growth of 22.3% in, total receipts of all states are budgeted to grow 13.5% in FY19 (Exhibit 45). As a percentage of GDP, states total receipts are estimated to have risen to all-time high of 15.1% in and are budgeted to rise even further to 15.4% in FY19 (Exhibit 46). Exhibit 45: Total receipts of states are budgeted to grow 13.5% in FY (% YoY) Total receipts Exhibit 46: which will help total receipts to rise to a new high of 15.4% of GDP (% of GDP) (% of GDP) 1.9 Total receipts FY3 FY5 FY7 FY9 FY11 FY3 FY5 FY7 FY9 FY11 Source: Union/State Budgets, RBI, CEIC, MOSL A look at the composition of states total receipts (Exhibit 47) confirms that ~43% are the states own taxes, more than one-fourth (26.5%) are from share in central taxes, almost one-fifth (2.8%) are in the form of grants from the center, and the remaining are states own-non-tax receipts and non-debt capital receipts (NDCR). April
 3 2 States' own receipts Support from the center# Share in central taxes, 26.")

35 Exhibit 47: States own receipts account for more than half of total receipts (% of total receipts) Own nontax receipts, 7.7 Grants from center, 2.8 NDCR, 2. Exhibit 48: which is expected to grow faster than center s support for the first time in five years in FY19 (%) 3 2 States' own receipts Support from the center# Share in central taxes, 26.5 Own taxes, FY98 FY1 FY4 FY7 FY1 NDCR = Non-debt capital receipts # Share in central taxes + Grants from center Source: Union/State Budgets, RBI, CEIC, MOSL Share of states own receipts in their total receipts has fallen consistently from 58.5% in to 54.6% in and is budgeted to fall further to 52.7% in FY19 Although the center accepted to devolve a higher share of taxes with states in, it is important to note that support from the center (sum of share in central taxes + grants from center) has risen faster than states own receipts from (Exhibit 48). Not surprisingly then, the share of states own receipts in their total receipts has fallen consistently from more than 6% to its all-time low of 52.2% in ; it is, however, is budgeted to rise to 52.7% in FY19 (Exhibit 49). Exhibit 49: Share of own taxes and support from center in total receipts in FY19 Own taxes Own non-tax receipts Support from center* FY1 FY2 FY3 FY4 FY5 FY6 FY7 FY8 FY9 FY1 FY11 FY12 FY18 RE FY19 BE Source: State Budgets, RBI, CEIC, MOSL A look at the receipts growth by individual states confirms that Punjab (PB), Andhra Pradesh (AP) and Telangana (TG) have budgeted the highest growth of above 2% in total receipts for FY19, while Jharkhand (JH), Chhattisgarh (CT) and Gujarat (GJ) have budgeted the least growth of sub-7% in their total receipts for FY19 (Exhibit 5). April
36 Exhibit 5: Budgeted growth in states own taxes and total receipts in FY19 (% YoY) Total receipts Own taxes All AP BH CT GJ HR HP JK JH KA KL MP MH OR PB RJ TN TG UP UK WB Source: State Budgets, RBI, CEIC, MOSL While own receipts account for ~53% of states total receipts, they range from as low as 22.6% for Bihar (BH) and as high as ~8% for Haryana (HR) Further, while own receipts (own taxes + own non-tax receipts and NDCR) account for ~53% of states total receipts, they range from as low as 22.6% for Bihar (BH) and as high as ~8% for Haryana (HR). It means that BH is most dependent on the center (Exhibit 51). On the other hand, while Punjab (PB) is among the least dependent on the center, it has budgeted the highest growth of 28.9% in support from the center, higher than the average growth of 12.3% and 24.8% budgeted by BH. Exhibit 51: Share of own taxes and support from center in total receipts in FY19 Own receipts Support from center BH JK HP OR JH WB MP UP AP CT UK All RJ TG KA KL TN GJ PB MH HR Source: State Budgets, RBI, CEIC, MOSL April
37 What do the GST estimates tell us? Unfortunately, not much On an aggregate basis, states have budgeted 15% growth in own taxes, which account for ~43% of states total receipts, following 17.8% growth in (Exhibit 52-53). A detailed break-up of states own taxes reveals that SGST accounts for ~43% of states own taxes, while sales tax (which primarily includes GST exemptions such as selected fuel products and alcohol) accounts for almost a quarter of the states own taxes. Taxes on property and capital transactions (PCT) and excise taxes (almost entirely on alcohol) account for 11-12% of own taxes. Exhibit 52: States own taxes budgeted to grow 15% in FY19 32 (% YoY) Own taxes Exhibit 53: Detailed break-up of states own taxes,.9 Electricity, 3.3 Vehicles, 5.6 SGST, FY3 FY5 FY7 FY9 FY11 Tax on Sales,Trade etc, 24.7 Excise, 11.5 PCT, 11.1 Source: State Budgets, RBI, CEIC, MOSL With the implementation of goods & services tax (GST) from July 217, FY19 will be the first full-year budget with GST implementation. To gain better understanding of GST estimates by states, we have collected and presented all data provided by 2 states in Exhibit 54 for and. (Only three states Punjab (PB), Uttar Pradesh (UP) and Uttarakhand (UK) presented for GST also; however, we have ignored them here). Due to lack of uniformity in data reporting, however, it is difficult to make a credible estimate on GST expectations budgeted by states for FY19 Due to lack of uniformity in data reporting, however, it is difficult to make a credible estimate on GST expectations budgeted by states for FY19. There are at least four inconsistencies in GST data reporting by states: While all states have provided State GST (SGST) data for, BH and PB have not provided SGST for, when they have actually provided for CGST and IGST, Only three states AP, KA and TG have provided an amount of compensation cess separately, while all other states have presumed to have included in their SGST, Some states have provided the break-up of central share in the form of CGST and IGST, which get included in the states share in central taxes, while some states have not provided these details, and Three states CT, MH and WB have provided data for IGST shared by the center with the state, but not CGST, which must be devolved with the state. April
38 Exhibit 54: Data reported for GST by 2 states INR m CGST SGST IGST Total CGST SGST IGST Total AP 4,31 54,26* 29, ,564 19,191 94,92* 9,41 213,152 BH 89,873-65,72 155, ,141 15, 2, ,438 CT - 32,128 42,49 74,537-5,66 71, ,51 GJ 28,678 25, 2, ,648 78, ,5 6, ,198 HR - 125,2-125,2-237,6-237,6 HP 6,63 2,654 4,848 32,133 22,152 4,645 1,72 64,498 JK - 36,824-36,824-7,615-7,615 JH - 9, - 9, - 16, - 16, KA 43,825 32,175* 32,47 378,48 119,54 525,5* 9, ,936 KL 7 162, - 162,7 1 27,1-27,2 MP 7,187 98,2 51, , ,446 21,8 15,851 48,377 MH - 59,767 88,88 598,647-91,43 151,628 1,53,3 OR 43,165 59,5 31, ,23 117,739 12, 9, ,487 PB 14,664-1,723 25,388 39, ,46 3, ,716 RJ 51,97 117, 37,365 25, ,374 21, 11,54 36,914 TN 37,49 173,93 11, ,835 12,39 297, , ,82 TG 22, ,136* 16, ,368 61, ,4* 5, ,329 UP 9,782 63,735 7,153 8,671 26,683 73,9 2,29 12,792 UK - 286,27-286,27 437,39 494,22 35, ,842 WB - 82,7 45,92 128,62 159,458 13,94 99,66 39,58 Separate data for compensation cess is available Source: State Budgets, RBI, CEIC, MOSL One other way to analyze GST-related collection is to find out the share of GST in states own tax receipts (Exhibit 55). On an aggregate basis, ~43% of states own taxes are budgeted to be accounted for by GST. In this methodology also, however, as is apparent from Exhibit 55, AP and JK are two extreme states, with GST accounting for only ~15% in the former, and almost two-third in the latter. Exhibit 55: Share of SGST in states own taxes in FY19 (% of own taxes) State GST AP RJ MP TG TN UP WB OR All KL CT MH GJ HR BH HP UK KA PB JH JK Source: State Budgets, RBI, CEIC, MOSL April
39 II.3. Where are the states planning to spend? As many as 1 states, accounting for ~4% of national GDP, will have elections in 219. Notwithstanding the election year, states total spending is budgeted to grow 11.4% YoY in FY19, marking the slowest pace in 13 years. Almost one-third of total spending is budgeted to be on the rural and education sectors, while interest payments account for ~1%. Within total spending, the states have budgeted 11.2% growth in revenue spending, as against record-high growth of 19.2% in and 12.5% in capital spending versus a decline of ~3% in. Although almost all states have implemented the pay revisions partly or fully, aggregate bill on salary & wages is budgeted to grow 16.6% in FY19 as against 14.4% in. In contrast, the average growth in S&W bill during the previous pay revisions was ~25% between FY9-11. States have budgeted a growth of 11.4% in total spending for FY19, marking the slowest pace in 13 years Normally, the Union Budget is accorded high importance during the general election year. Nevertheless, as many as ten states, accounting for ~4% of national GDP are also scheduled for elections in 219, making state budgets as important as the Union Budget Our analysis of state budgets confirms that states have budgeted a growth of 11.4% in total spending for FY19, marking the slowest pace in 13 years and as against ~15% growth in (Exhibit 56). We also notice that spending growth will be the lowest in any election year during the past five elections. Exhibit 56: Total spending by states budgeted to grow at 13-year lowest level 25 2 (% YoY) Total spending FY95 FY99 FY3 FY7 FY11 Highlighted periods are general election years Source: State Budgets, RBI, CEIC, MoSL In narrow sense, the quality of states spending is better than that of the center Unlike the center, which spends ~3% of its total spending on interest payments giving a large portion to banks and RBI, interest payments account for less than 1% of total spending for states. Further, while capital spending accounts for 12-13% of the Union Budget, about 17% of states spending is on the capital account (Exhibit 57). In that narrow sense, therefore, the quality of states spending is better than that of the center. April
40 Exhibit 57: Almost three-fourth of total spending is related to consumption in (% of total spending) Exhibit 58: Almost one-third of total spending in FY19 is spent on the rural and education sectors , 36.6 Education etc, 15.5 Housing, Interest payments, 9.8 Rural sector, 17.2 FY9 FY1 FY11 FY12 Pension, 9.2 Transport, 4.7 Energy, 5.3 Source: State Budgets, MOSL Further, states spend about one-third of their total spending on the rural (sum of agriculture & allied activities, rural development, and irrigation and flood control) and education (including sports, art & culture) sectors (Exhibit 58). States also spend ~9% on pension, while transport (primarily roads & bridges) receive less than 5% of total spending by states. Total spending by states crossed 16% of GDP in for the first time since liberalization and continued to rise to touch ~18% in Since, states have implemented two major reforms UDAY scheme and pay revisions. Not surprisingly then, total spending by states crossed 16% of GDP in for the first time since liberalization and continued to rise to touch ~18% in (Exhibit 59). Due to slower growth budgeted for FY19, total spending is budgeted to fall slightly to 17.8% of GDP. Within total spending, while revenue spending is budgeted to grow at 3-year low of 11.2%, capital spending is budgeted to grow faster at 12.5% (Exhibit 6). Exhibit 59: States total spending crossed 16% of GDP in and has risen since then (% of GDP) Total spending Exhibit 6: Revenue spending is budgeted to grow slowly, while capital spending to grow faster in 45 3 (% YoY) Revenue spending Capital spending 15 FY7 FY8 FY9 FY1 FY11 FY12-15 FY7 FY11 Source: State Budgets, RBI, CEIC, MOSL Core revenue spending is also budgeted to grow 11.2% in FY19, marking the slowest growth in 14 years Core revenue spending (revenue spending excluding interest payments) is also budgeted to grow 11.2% in FY19, marking the slowest growth in 14 years (Exhibit 61). Details of revenue spending (Exhibit 62) reveal that more than half of revenue spending by states is on four areas education (17.9%), rural sector (14.4%), interest payments (11.7%), and pensions (11.1%). April 218 4
41 Exhibit 61: Core revenue spending is also budgeted to grow at the slowest pace in 14 years in FY19 Exhibit 62: More than half of revenue spending by states on education, rural sector, interest and pensions (% YoY) Core revenue spending Pension, 11.1, 28.1 (% of revenue spending) FY91 FY95 FY99 FY3 FY7 FY11 Police, 4.6 Interest payments, 11.7 Social security & welfare, 4.5 Transport, Energy, 4.6 Rural 1.8 sector, 14.4 Housing, 1.5 Education etc, 17.9 Source: State Budgets, RBI, CEIC, MOSL Details of capital spending (Exhibit 64) reveal that almost half of capital spending by states is on two areas rural sector (31.5% of which is on irrigation, the largest component (~2% of capital spending)) and transport sector (19.2%). Exhibit 63: Capital spending is budgeted to grow 12.5% in FY19, following a decline in Exhibit 64: Almost half of capital spending by states on rural sector and transport 75 5 (% YoY) Capital spending (% of capital spending) Transport, 19.2, 13.7 L&A, 6.7 Education etc, FY91 FY95 FY99 FY3 FY7 FY11 Energy, 8.6 Health, 3.4 Rural sector, 31.5 Sanitation, 5.9 Housing, 3.1 Urban devt, 4.5 Source: State Budgets, RBI, CEIC, MOSL April
42 Unlike the previous pay revisions, states have spread the commission awards this time over 4-5 years beginning, which has diluted the macro impact of such revisions Where is the expected boost from 7th pay revisions? After implementation of the seventh central pay commission in, states have followed and implemented pay revisions for their employees. Nevertheless, unlike the previous pay revisions, states have spread the commission awards this time over 4-5 years beginning, which has diluted the macro impact of such revisions. Seven states Bihar (BR), Chhattisgarh (CT), Jharkhand (JH), Madhya Pradesh (MP), Odisha (OR), Rajasthan (RJ) and Tamil Nadu (TN), implemented the pay revisions during the last year (FY18), while three more states Jammu & Kashmir (J&K), Karnataka (KA) and Maharashtra (MH) have provided for the pay revisions in FY19 (please see Exhibit 67 on next page). Notably, Tamil Nadu (TN), which is known for its precarious financial situation, revised the pay and allowances of government employees and pension for pensioners with effect from October 1, 217. There has been a substantial increase in salaries and pension components in the Revised Estimates for and the Budget Estimates for , owing to the implementation of the Seventh Pay Commission recommendations, Deputy Chief Minister, Mr Thiru O Panneerselvam, stated in his speech on March 15, 218. Exhibit 65: Annual change in aggregate salary & wages (S&W) spending budgeted by 2 states (% YoY) Aggregare salary bill of 2 states FY9 FY11 Shaded regions represent periods of pay revisions Exhibit 66: Share of different states in salary and wages (S&W) expenditure in (% of total) UP, 14.7 PB, 3.1 WB, 6. TG, 3.1 TN, 7.4 RJ, 7. OR, 3.8 AP, 5. BH, CT, GJ, 4.2 UK, 2. HR, 2.9 HP, 1.6 MH, 14.7 JK, 3.4 JH, 1.8 KA, 4.7 KL, 4.7 MP, 4.6 As % of aggregate S&W of 2 states Source: State Budgets, RBI, CEIC, MOSL Aggregate salary & wage bill for all states combined grew 14.4% in and budgeted to grow 16.6% in FY19, much lower than the average growth of 28% between FY9 and FY1 Not surprisingly then, the growth in aggregate salary & wage bill for all states combined was 14.4% in and budgeted at 16.6% in FY19, much lower than the average growth of 28% between FY9 and FY1 (Exhibit 65). This is despite the fact that almost all states (except West Bengal (WB) and Punjab (PB)) have provided for the pay revisions. Lower growth this time, however, can be attributed to the fact that states have amortized the pay commission awards over many years. Gujarat (GJ), for example, implemented in, but announced to pay arrears in March 218, May 218 and July 218. Similarly, Maharashtra (MH) has provided for only INR1b in FY19 and the arrears are to be paid in 3-4 installments over subsequent years. As exhibit 66 shows, MH alone accounts for ~15% of the total budget on salary & wages (S&W), similar to Uttar Pradesh (UP), followed by Tamil Nadu (7.4%) and Rajasthan (7%). April
43 Exhibit 67: State-wise details of Pay Commission awards States Commentary States not due to announce/yet to implement pay revisions - (A)* What do numbers say?# Andhra Pradesh (AP) Tenth Pay Commission implemented in Next is due in 219 (4.1)~ Punjab (PB) No announcement yet Telangana (TG) Tenth Pay Commission implemented in Next is due in 219 ~ West Bengal (WB) Follows its own pay revisions time-table States which implemented Seventh Pay Commission in Gujarat (GJ) Implemented in w.e.f. January 216. Arrears to be paid in Haryana (HR) Implemented in with effect from January Himachal Pradesh (HP) Implemented in Kerala (KL) Provisions for 1 th Pay Commission spread over two years Uttar Pradesh (UP) Announced in December 216 and implemented in January 217. Arrears to be settled in two installments Uttarakhand (UK) Announced in December 216 and implemented in January States which made provisions for Seventh Pay Commission in Bihar (BH) Implemented in May 217 with effect from April Chhattisgarh (CT) Implemented in Jharkhand (JH) Implemented in with effect from January Higher salaries to be paid in July 217 with effect from January 216. Madhya Pradesh (MP) Arrears to be paid in three installments; May every year beginning FY19 Implemented in September 217 w.e.f. January 216. Government to clear Odisha (OR) arrears partially in FY Rajasthan (RJ) Sufficient provisions made in budget Tamil Nadu (TN) Implemented on October 1 st States which made provisions for Seventh Pay Commission in Jammu & Kashmir To be implemented from April 218 with effect from January Karnataka (KA) Pay Commission expected to be implemented from July 1 st, Maharashtra (MH) Implemented w.e.f. January 216. Arrears to be paid in 3-4 installments Total (2 states) # Change in salaries & wages spending bill for states Source: State Budgets, MOSL; * Average of the three years up to ~ Since AP was bifurcated in 214. Data is not comparable A look at the growth in S&W bill for individual states confirms that JK and KA have budgeted the highest growth of ~35% because of the pay revisions this year (Exhibit 68). Many other states such as OR, RJ and UP have also budgeted for high growth (of >2%) because the arrears are planned to be paid this year. MH has also budgeted for slower growth (than JK and KA) because it has not provided for the arrears in FY19. April
44 Exhibit 68: Budgeted growth in salary & wages by 2 states (% YoY) All AP BH CT GJ HR HP JK JH KA KL MP MH OR PB RJ TN TG UP UK WB Source: State Budgets, RBI, CEIC, MOSL Salary & wages account for 22.2% of total spending by all states in FY19 and as much as ~27% of states revenue spending It is also interesting to note that salary & wages (excluding pensions) account for 22.2% of total spending by all states in FY19 (Exhibit 69) and as much as ~27% of states revenue spending. Among the 2 states, Uttar Pradesh (UP) has the highest share with S&W accounting for about one-third of total spending in FY19, while the lowest share (~12%) is for Bihar (BH). The share of salary & wages is also high at ~3% in Maharashtra (MH). Exhibit 69: Share of salary & wages in total spending (%) BH WB KA JH MP GJ AP CT HR All TG OR RJ UK TN PB KL MH HP JK UP Source: State Budgets, RBI, CEIC, MOSL April
45 PART III. What do the combined budgets tell us? Aggregate fiscal deficit of the general government in India is budgeted at 5.7% of GDP in FY19, lower than the revised estimate (RE) of 6.3% of GDP in FY18 (higher than of 5.8%). Notably, fiscal deficit of the general government was above 6% of GDP for more than 9% of the time post-liberalization. With states increasing reliance on market borrowings and the center reducing it, gross/net borrowings by states would be similar to the center in for the first time in the history of liberalized India. Governments are highly optimistic on the receipts front both the center and the states have budgeted record high tax-to-gdp ratio in FY19. Total taxes of the general government are budgeted to grow ~16% in FY19, better than ~15% growth in. India s tax-to-gdp ratio is budgeted to rise to an all-time high of 18.7% in FY19, primarily supported by higher indirect taxes, which are budgeted to grow 17% (~63% of all taxes). This confirms that the governments expect GST to boost tax receipts significantly. Total spending of the general government is budgeted to grow 11% in FY19, similar to that in. As % of GDP, however, total spending is budgeted to slow from 27.9% to 27.7% in FY19. Aggregate fiscal deficit budgeted at 5.7% of GDP for FY19 : With the central government budgeting a fiscal deficit of 3.3% of GDP in FY19, down from 3.5% in FY18, and the states budgeting 2.5%, the fiscal deficit of the general government is budgeted at 5.7% of GDP for FY19 (Exhibit 7-71). If so, this will be the third time in the past three decades that fiscal deficit will be below 6% of GDP. Notably, the aggregate deficit was revised upwards from BE of 5.8% of GDP to 6.3% of GDP in. Exhibit 7: Fiscal deficit of the center and the states since the 199s (% of GDP) 8 Center States Exhibit 71: Fiscal deficit of the general government since the 199s (% of GDP) 12 Fiscal deficit of general government FY91 FY95 FY99 FY3 FY7 FY11 FY91 FY95 FY99 FY3 FY7 FY11 Source: Union/State Budgets, RBI, CEIC, MOSL Although the aggregate fiscal deficit is budgeted to fall, market borrowings are budgeted to touch INR11t in FY19 but market borrowings set to rise further: Although the aggregate fiscal deficit is budgeted to fall (and remain broadly unchanged for the second consecutive year in absolute terms at INR1.6t), market borrowings of the general government are budgeted to touch INR11t (or 5.9% of GDP) in FY19. Due to higher repayments, net market borrowings of general government are budgeted to fall to 11-year lowest level of 4.5% of GDP in FY19 (Exhibit 72). April
46 Exhibit 72: Net market borrowings by the center and states (% of GDP) Net market loans (% of GDP) Centre States FY91 FY95 FY99 FY3 FY7 FY11 Source: Union/State Budgets, RBI, CEIC, MOSL For FY19, the states are planning to finance as much as ~9% of their deficit via market borrowings, while the center has budgeted to borrow only about twothird of its deficit Interestingly, during the past couple of years, the states have tremendously increased their dependence on market borrowings, while the center has reduced it. For FY19, the states are planning to finance as much as ~9% of their deficit via market borrowings (Exhibit 73), while the center has budgeted to borrow only about two-third of its deficit. Not surprisingly then, states are budgeting to borrow similar to that of the center in FY19 for the first time in the history of liberalized India (Exhibit 74). Exhibit 73: States have increased their reliance on market borrowings, while the center has reduced it (% of GDP) (% of FD) States Centre Exhibit 74: States market borrowings budgeted to match the center s for the first time in FY19 6, 4,5 3, (INRb) States Centre 65 1,5 5 FY9 FY11 FY91 FY95 FY99 FY3 FY7 FY11 Source: Union/State Budgets, RBI, CEIC, MOSL While the center has budgeted a record high taxto-gdp ratio of 12.1%, the states have also budgeted for a new all-time high of 6.6% this year Governments are highly optimistic on receipts : The general government (center + states) has budgeted a growth of 16.1% in total taxes in FY19, better than ~15% growth in and the highest in six years (Exhibit 75). It implies that while the center has budgeted a record high tax-to-gdp ratio of 12.1%, beating the previous high of 11.9% in FY8, the states have also budgeted for a new all-time high of 6.6% this year (Exhibit 76). Consequently, the combined tax-to-gdp ratio is budgeted at 18.7%, better than 18% in and previous record of 17.6% in FY8. April

.")

47 Exhibit 75: Total taxes of general government budgeted to grow ~16% in FY (% YoY) Total taxes Exhibit 76: Break-up of total taxes of general government (% of total taxes) States' indirect taxes, 3.8 Center's direct taxes, FY91 FY95 FY99 FY3 FY7 FY11 Center's indirect taxes, 32. States' direct taxes, 4.4 Source: State Budgets, RBI, CEIC, MOSL Interestingly, a break-up of total taxes of the general government confirms that ~63% of total taxes are indirect taxes, with direct taxes still remaining under 4%. Of course, most of the direct taxes are collected by the center, while the indirect taxes are roughly divided equally between the states and the center (Exhibit 77). Exhibit 77: Tax-to-GDP of the general government (% of GDP) (% of GDP) Center States FY92 FY93 FY94 FY95 FY96 FY97 FY98 FY99 FY FY1 FY2 FY3 FY4 FY5 FY6 FY7 FY8 FY9 FY1 FY11 FY Source: Union/State Budgets, RBI, CEIC, MOSL based primarily on GST: As we argued above, the information provided by states on GST collection is not sufficient to make credible conclusions. One of the key reasons making any analysis of GST complex and confusing is an attempt to understand GST through the narrow lens of the states or the center. To be sure, such analysis will create more confusion since the performance of GST must be analyzed from the broader lens of indirect taxes from an all-india perspective combined analysis of the center and the states. Nevertheless, since there is no detailed commodity-wise break-up of indirect taxes, to separate GST items from the GST-exempted products such as petroleum products, alcohol, etc, we have to analyse the performance of the entire indirect taxes. General government has pinned its hopes of collecting all-time high taxes in FY19, based on GST, which is a significant part of total indirect taxes Within total taxes, the general government has budgeted higher growth of ~17% in indirect taxes in FY19, higher than ~12% in (Exhibit 78). Direct taxes, however, are budgeted to grow slowly at 14.7% versus ~2% growth in the recently concluded year. It means that the general government has pinned its hopes of collecting all-time high taxes in FY19, based on GST, which is a significant part of April
48 total indirect taxes. The share of direct taxes in total taxes of the general government has fallen from a peak of ~42% in FY1 to ~37% in (Exhibit 79). As the theory goes, the more the direct tax collection, the more progressive the tax system is and the more developed the economy is. Exhibit 78: Indirect taxes are budgeted to grow faster than direct taxes in Exhibit 79: Share of direct taxes has fallen from its peak of ~42% of total taxes in FY1 to ~37% in 4 3 (% YoY) Direct taxes Indirect taxes Direct taxes Indirect taxes FY9 FY1 FY11 FY12 FY99 FY FY1 FY2 FY3 FY4 FY5 FY6 FY7 FY8 FY9 FY1 FY11 FY12 Source: State Budgets, RBI, CEIC, MOSL Further, while the states own indirect taxes were much higher than the center s between FY1 and, as oil prices crashed, the economy started losing momentum, the center hiked indirect tax rates, while the states suffered (Exhibit 8). Consequently, the center s collection of indirect taxes in was 5.8% of GDP, higher than 5.2% by states, while it was similar in. For FY19, the center has budgeted higher indirect taxes of 6% of GDP, while states have budgeted 5.8% of GDP. Exhibit 8: States have budgeted record high indirect taxes in FY19 Center (gross) States' own FY92 FY93 FY94 FY95 FY96 FY97 FY98 FY99 FY FY1 FY2 FY3 FY4 FY5 FY6 FY7 FY8 FY9 FY1 FY11 FY12 Source: Union/State Budgets, RBI, CEIC, MOSL Although the general government has budgeted a record high tax collection, total spending is budgeted to moderate to 27.7% of GDP in FY19 Total spending, however, budgeted to grow slowly: Although the general government has budgeted a record high tax collection, total spending is budgeted at 27.7% of GDP in FY19, slightly lower than 27.9% in and lower than its peak of 3.5% in FY4 (Exhibit 81). April
49 Exhibit 81: Total spending of the general government (% of GDP) Total spending FY92 FY93 FY94 FY95 FY96 FY97 FY98 FY99 FY FY1 FY2 FY3 FY4 FY5 FY6 FY7 FY8 FY9 FY1 FY11 FY Source: Union/State Budgets, RBI, CEIC, MOSL The general government has budgeted a growth of 11% in total spending in FY19, similar to that in (Exhibit 82). Within total spending, both core revenue spending (revenue spending excluding interest payments) and capital spending are budgeted to grow ~11.5% in FY19 (Exhibit 83). Interestingly, capital spending of the general government declined in. Exhibit 82: Total spending of the general government budgeted to grow 11% in FY (% YoY) Total spending Exhibit 83: of which the core revenue spending is budgeted to grow slowly (% YoY) Core revenue spending Capital spending FY91 FY95 FY99 FY3 FY7 FY11-1 FY9 FY11 Source: State Budgets, RBI, CEIC, MOSL Considering the fact, however, that general elections will be held in mid-219, spending pattern in FY19 is of added importance. Rather than total spending, core revenue spending in real terms is more important from the election perspective. Consequently, we deflate core revenue spending of the general government by the GFCE (government final consumption expenditure) deflator. Instead of analyzing only the center s budget, we decided to analyze spending patterns of the general government (center and states) because several states have their election schedules coinciding with general elections. As many as ten states AP, AR, CT, HR, MP, MH, OD, RJ, SK and TG accounting for ~4% of national GDP, will have elections in 219. We find that spending growth during the election year and the election results are highly linked Based on the past five elections held since the late 199s, we find that spending growth during the election year and the election results are highly linked (Exhibit 84). In FY99, real core revenue spending grew sharply at ~18% and the Vajpayee government retained power in In FY4, however, fiscal spending growth was April
50 only 4.4% and the NDA lost elections in 24. In FY9, core revenue spending grew again sharply at 2% and UPA was re-elected to power in 29 but lost in 214, when spending growth was only 1.5% in. Our analysis of FY19 budgets confirms that real core revenue spending is budgeted to grow 6.6%, slower than 8.5% average growth in the previous three years. Exhibit 84: Real core revenue spending of the general government (% YoY) 25 Real core revenue spending of GG NDA retained power in 1999 NDA lost in 24 UPA retained power in 29 UPA lost in 214 Will history repeat in 219? FY97 FY99 FY1 FY3 FY5 FY7 FY9 FY11 Source: Union/State Budgets, RBI, CEIC, MOSL Our analysis of FY19 budgets confirms that real core revenue spending is budgeted to grow 6.6%, slower than 8.5% average growth in the previous three years Finally, we present sector-wise spending of the center and states. Obviously, the emphasis of the center and the states are very different. While about a quarter of the center s total spending is taken up by interest payments, subsidies and defense take up almost another quarter of total spending (Exhibit 85). On the other hand, while interest payments take only ~1% of total spending by states, rural sector (sum of agriculture & allied activities, rural development, and irrigation & flood control) and education consume almost another one-third of states total spending (Exhibit 86). As we had discussed in Part I of the report, growth in rural spending is also nothing extraordinary in FY19. Exhibit 85: Where does the center spend? Exhibit 86: Where do the states spend? Rural sector, 7.1, 34. Defense, 1.9 Pensions, 6.9 Interest payments, 23.6 Transport, 5.5 Subsidies, 12.1 Pension, 9.2, 36.6 Education etc, 15.5 Transport, 4.7 Interest payments, 9.8 Rural sector, 17.2 Housing, 1.8 Energy, 5.3 Source: State Budgets, RBI, CEIC, MOSL April 218 5

51 Appendix All states* Population: 1,275m Nominal GSDP in FY19: INR 187.2t Fiscal deficit in FY19 at 2.5% of GSDP Total liabilities in FY19 at 25.3% of GSDP INR b % YoY Total receipts 2, , , , Revenue receipts 2, , , , Total taxes 15,8.2 17, , , States' own taxes 9, ,22.8 1, , SGST 2,84.6 5, Share in central taxes 5,956. 6, , , Non-tax revenue receipts: State 1,681. 1,92. 1, , Grants from the Centre 3,79.6 5, , , Non-debt capital receipts Total spending 26, , , , Revenue spending 2, ,97. 25,3.9 27, Education, sports, art & culture 3, ,48. 4, , Agriculture & allied activities 1, , , , Rural development 1, , ,427. 1, Interest payments 2, ,95. 2, , Pensions 2, , , , Police 99. 1, , , Capital spending 5, ,49.5 4, , Water supply & sanitation Agriculture Rural development Irrigation & flood control , , Energy Transport ,7.5 1,56.4 1, Fiscal deficit 5, , , , % of GDP Revenue deficit % of GDP Primary deficit 2, , , , % of GDP Gross market borrowings 3, , , , % of GDP Net market borrowings 3,375. 4,2. 3, , % of GDP Outstanding debt 37, , , , % of GDP GSDP (at current prices) 152, , , , * Data for all states derived from our analysis of 2 states, MOSL April
52 Exhibit 87: Break-up of total revenue receipts (% of GDP) Exhibit 88: Further details of tax receipts (% of total taxes) (% of GDP) Taxes Non-tax revenue Share in Property & central Capital taxes Transaction % 7% % Excise 7% SGST 27% Sales, trade etc 17% Exhibit 89: Change in key budget items (% YoY) (1) Rev receipts Rev spending Cap spending Exhibit 9: Share of SPI in revenue spending (% of total spending) (% YoY) Interest payments Pension Salary & wages (% of total spending) Exhibit 91: Key details of revenue spending by department Exhibit 92: Key details of capital spending by department (% of total) 42% Pension 11% Education etc 18% Interest 12% Social Security & welfare 4% Agriculture 7% Rural devt 6% (% of total) Transport 21% Energy 9% 34% Irrigation & flood control 21% Sanitation 6% Rural devt 9% Exhibit 93: Fiscal deficit and revenue balance (% of GDP) (% of GDP) (.1) Fiscal deficit (.4) 3.1 (.) Revenue Balance 3.5 (.3) (.1) Exhibit 94: Debt to GDP ratio (% of GDP) April
53 Andhra Pradesh Population: 5.2m (4% of India s population) Nominal GSDP in FY19: INR 8.7tn (4.7% of India s nominal GDP) Fiscal deficit in FY19 at 2.8% of GSDP Total liabilities in FY19 at 28.7% of GSDP INR b % YoY Total receipts 1,1.1 1, , , Revenue receipts ,255. 1, , Total taxes States' own taxes SGST Share in central taxes Non-tax revenue receipts: State Grants from the Centre Non-debt capital receipts Total spending 1, , ,513. 1, Revenue spending 1, , , , Education, sports, art & culture Agriculture & allied activities Rural development Interest payments Pensions Police Capital spending Water supply & sanitation Agriculture Rural development Irrigation & flood control Energy Transport Fiscal deficit % of GDP Revenue deficit % of GDP Primary deficit % of GDP Gross market borrowings % of GDP Net market borrowings % of GDP Outstanding debt 2,13.1 2,16.3 2, , % of GDP GSDP (at current prices) 6, , ,93.8 8, , MOSL April
54 Exhibit 95: Break-up of total revenue receipts (% of GDP) Exhibit 96: Further details of tax receipts (% of total taxes) Share of Taxes Non-tax revenue central (% of GDP) Property & taxes Capital % Transaction 1% 6% Excise 7% Vehicles 4% Sales, trade etc 47% Exhibit 97: Change in key budget items (% YoY) (25) (5) Rev. receipts Rev. spending Cap. spending Exhibit 98: Share of SPI in revenue spending (% of total spending) (% YoY) Interest payments Pension Salary & wages (% of total spending) Exhibit 99: Key details of revenue spending by department (% of total) 56% Pension 1% Education etc 17% Interest 1% Rural devt 7% Exhibit 1: Key details of capital spending by department (% of total) Irrigation & flood control 56% Transport 8% 28% Urban devt 3% Rural devt 5% Exhibit 11: Fiscal deficit and revenue balance (% of GDP) Exhibit 12: Debt to GDP ratio (% of GDP) Fiscal deficit Revenue balance (4.6) (1.2) (2.5) (.1) (.5) (% of GDP) April
55 Bihar Population: 11.1m (8.7% of India s population) Nominal GSDP in FY19: INR 5.2t (2.8% of India s nominal GDP) Fiscal deficit in FY19 at 2.2% of GSDP Total liabilities in FY19 at 26.7% of GSDP INR b % YoY Total receipts 1,56.1 1, , , Revenue receipts 1,55.8 1, , , Total taxes , States' own taxes SGST Share in central taxes Non-tax revenue receipts: State Grants from the Centre Non-debt capital receipts ,169.4 Total spending 1,22.9 1, ,68.9 1, Revenue spending ,226. 1, , Education, sports, art & culture Agriculture & allied activities Rural development Interest payments Pensions Police Capital spending Water supply & sanitation Agriculture Rural development Irrigation & flood control Energy Transport Fiscal deficit % of GDP Revenue deficit % of GDP Primary deficit % of GDP Gross market borrowings % of GDP Net market borrowings % of GDP Outstanding debt 1,61.7 1,25.7 1, , % of GDP GSDP (at current prices) 5,45.6 6, , , April
56 Exhibit 13: Break-up of total revenue receipts (% of GDP) Exhibit 14: Further details of tax receipts (% of total taxes) (% of GDP) Taxes Non-tax revenue Share in central taxes 71% 2% Property & Capital Transaction 5% Sales, trade etc 8% SGST 14% Exhibit 15: Change in key budget items (% YoY) Exhibit 16: Share of SPI in revenue spending (1) (2) Rev receipts Rev spending Cap spending (% YoY) Interest payments Pension Salary & wages (% of total spending) Exhibit 17: Key details of revenue spending by department Exhibit 18: Key details of capital spending by department (% of total) Education etc 24% 28% Rural devt 3% 46% Rural devt 1% Interest 8% Pension 12% Transport 17% Energy 17% Irrigation & flood control 8% Exhibit 19: Fiscal deficit and revenue balance (% of GDP) Fiscal deficit Revenue balance Exhibit 11: Debt to GDP ratio (% of GDP) (% of GDP) April
57 Chhattisgarh Population: ~27.1m (2.1% of India s population) Nominal GSDP in FY19: INR 3.3t (~1.7% of India s nominal GDP) Fiscal deficit in FY19 at 3.1% of GSDP Total liabilities in FY19 at 18.1% of GSDP INR b % YoY Total receipts Revenue receipts Total taxes States' own taxes SGST Share in central taxes Non-tax revenue receipts: State Grants from the Centre Non-debt capital receipts Total spending Revenue spending Education, sports, art & culture Agriculture & allied activities Rural development Interest payments Pensions Police Capital spending Water supply & sanitation Agriculture Rural development Irrigation & flood control Energy Transport Fiscal deficit % of GDP Revenue deficit % of GDP Primary deficit % of GDP Gross market borrowings % of GDP Net market borrowings % of GDP Outstanding debt % of GDP GSDP (at current prices) 2, , , , April
58 Exhibit 111: Break-up of total revenue receipts (% of GDP) Exhibit 112: Further details of tax receipts (% of total taxes) Taxes Non-tax revenue (% of GDP) (% of total taxes) Share in central taxes 47% Property & Capital Transaction 5% % Excise 9% SGST 25% Exhibit 113: Change in key budget items (% YoY) 5 Rev receipts Rev spending Cap spending (% YoY) Exhibit 114: Share of SPI in revenue spending (% of total spending) Interest payments Pension Salary & wages (% of total spending) (25) Exhibit 115: Key details of revenue spending by department (% of total) Education etc 21% Exhibit 116: Key details of capital spending by department (% of total) 3% 49% Pension 8% Interest 5% Agriculture 17% Transport 36% Irrigation & flood control 19% Education 7% Urban devt 8% Exhibit 117: Fiscal deficit and revenue balance (% of GDP) (% of GDP) Fiscal deficit Revenue balance (.4) (.7) Exhibit 118: Debt to GDP ratio (% of GDP) April
59 Gujarat Population: ~63.4m (5% of India s population) Nominal GSDP in FY19: INR 15.tn (~7.9% of India s nominal GDP) Fiscal deficit in FY19 at 1.7% of GSDP Total liabilities in FY19 at 16.% of GSDP. INR b % YoY Total receipts 1,12.5 1, , , Revenue receipts 1,98.4 1, , , Total taxes , States' own taxes SGST Share in central taxes Non-tax revenue receipts: State Grants from the Centre Non-debt capital receipts Total spending 1, ,55.3 1, , Revenue spending 1,38.9 1, , , Education, sports, art & culture Agriculture & allied activities Rural development Interest payments Pensions Police Capital spending Water supply & sanitation Agriculture Rural development Irrigation & flood control Energy Transport Fiscal deficit % of GDP Revenue deficit % of GDP Primary deficit % of GDP Gross market borrowings % of GDP Net market borrowings % of GDP Outstanding debt 1, , , , % of GDP GSDP (at current prices) 11, , , , April
60 Exhibit 119: Break-up of total revenue receipts (% of GDP) (% of GDP) Taxes Non-tax revenue Exhibit 12: Further details of tax receipts (% of total taxes) (% of total taxes) 12% Share in central taxes 22% Property & Capital Transaction 1% SGST 38% Sales, trade etc 18% Exhibit 121: Change in key budget items (% YoY) Rev receipts Rev spending Cap spending 6 (% YoY) 45 3 Exhibit 122: Share of SPI in revenue spending (% of total spending) 26.8 Interest payments Pension Salary & wages (% of total spending) (15) Exhibit 123: Key details of revenue spending by department Exhibit 124: Key details of capital spending by department (% of total) 52% Education etc 17% Interest 15% Agriculture 5% (% of total) Transport 14% 39% Rural devt 4% Pension 11% Energy 1% Irrigation & flood control 33% Exhibit 125: Fiscal deficit and revenue balance (% of GDP) Exhibit 126: Debt to GDP ratio (% of GDP) Fiscal deficit Revenue balance (% of GDP) April 218 6
61 Haryana Population: ~26.7m (2.1% of India s population) Nominal GSDP in FY19: INR 6.9t (~3.6% of India s nominal GDP) Fiscal deficit in FY19 at 2.8% of GSDP Total liabilities in FY19 at 23.4% of GSDP INR b % YoY Total receipts Revenue receipts Total taxes States' own taxes SGST Share in central taxes Non-tax revenue receipts: State Grants from the Centre Non-debt capital receipts Total spending , Revenue spending Education, sports, art & culture Agriculture & allied activities Rural development Interest payments Pensions Police Capital spending Water supply & sanitation Agriculture Rural development Irrigation & flood control Energy Transport Fiscal deficit % of GDP Revenue deficit % of GDP Primary deficit % of GDP Gross market borrowings % of GDP Net market borrowings % of GDP Outstanding debt 1,246. 1, , , % of GDP GSDP (at current prices) 5, , ,84.7 6, April
62 Exhibit 127: Break-up of total revenue receipts (% of GDP) Taxes Non-tax revenue (% of GDP) Exhibit 128: Further details of tax receipts (% of total taxes) Excise 1% 13% Share in central taxes 16% Sales, trade etc 2% SGST 41% Exhibit 129: Change in key budget items (% YoY) Rev receipts Rev spending Cap spending 375 (% YoY) (125) Exhibit 13: Share of SPI in revenue spending (% of total spending) Interest payments Pension Salary & wages (% of total spending) Exhibit 131: Key details of revenue spending by department (% of total) 49% Education etc 17% Energy 8% Exhibit 132: Key details of capital spending by department (% of total) Transport 14% 3% Sanitation 11% Pension 1% Interest 16% Energy 35% Irrigation & flood control 1% Exhibit 133: Fiscal deficit and revenue balance (% of GDP) Exhibit 134: Debt to GDP ratio (% of GDP) Fiscal deficit Revenue balance (1.3) (1.) (1.9) (2.2) (2.9) (1.8) (1.4) (1.2) (% of GDP) April
63 Himachal Pradesh Population: ~7.1m (~.6% of India s population) Nominal GSDP in FY19: INR 1.5t (~.8% of India s nominal GDP) Fiscal deficit in FY19 at 4.9% of GSDP Total liabilities in FY19 at 31.8% of GSDP INR b % YoY Total receipts Revenue receipts Total taxes States' own taxes SGST Share in central taxes Non-tax revenue receipts: State Grants from the Centre Non-debt capital receipts Total spending Revenue spending Education, sports, art & culture Agriculture & allied activities Rural development Interest payments Pensions Police Capital spending Water supply & sanitation Agriculture Rural development Irrigation & flood control Energy Transport Fiscal deficit % of GDP Revenue deficit % of GDP Primary deficit % of GDP Gross market borrowings % of GDP Net market borrowings % of GDP Outstanding debt % of GDP GSDP (at current prices) 1, , , , April
64 Exhibit 135: Break-up of total revenue receipts (% of GDP) (% of GDP) Taxes Non-tax revenue Exhibit 136: Further details of tax receipts (% of total taxes) Share in central taxes 43% Property & Capital Transaction 2% SGST 28% 17% Excise 1% Exhibit 137: Change in key budget items (% YoY) 45 Rev receipts Rev spending Cap spending 3 15 Exhibit 138: Share of SPI in revenue spending (% of total spending) Interest payments Pension Salary & wages (% of total spending) (15) (% YoY) Exhibit 139: Key details of revenue spending by department Exhibit 14: Key details of capital spending by department (% of total) 42% Pension 17% Education etc 21% Agriculture 7% Interest 13% (% of total) Transport 44% 38% Irrigation & flood control 12% Energy 6% Exhibit 141: Fiscal deficit and revenue balance (% of GDP) (% of GDP) Fiscal deficit Revenue balance (.8) (.7) (2.) (1.9) (1.9) (2.1) Exhibit 142: Debt to GDP ratio 31.8 (% of GDP) April
65 Jammu & Kashmir Population: ~13.2m (~1% of India s population) Nominal GSDP in FY19: INR 1.6t (~.8% of India s nominal GDP) Fiscal deficit in FY19 at 5.4% of GSDP Total liabilities in FY19 at 44.7% of GSDP INR b % YoY Total receipts Revenue receipts Total taxes States' own taxes SGST Share in central taxes Non-tax revenue receipts: State Grants from the Centre Non-debt capital receipts Total spending Revenue spending Education, sports, art & culture Agriculture & allied activities Rural development Interest payments Pensions Police Capital spending Water supply & sanitation Agriculture Rural development Irrigation & flood control Energy Transport Fiscal deficit % of GDP Revenue deficit % of GDP Primary deficit % of GDP Gross market borrowings % of GDP Net market borrowings % of GDP Outstanding debt % of GDP GSDP (at current prices) 1, , ,48.9 1, April
66 Exhibit 143: Break-up of total revenue receipts (% of GDP) Exhibit 144: Further details of tax receipts (% of total taxes) Taxes Non-tax revenue (% of GDP) (% of total taxes) 7% Share in central taxes 54% Excise 3% SGST 29% Property & Capital Transaction 1% Sales, trade etc 6% Exhibit 145: Change in key budget items (% YoY) Rev receipts Rev spending Cap spending 25 2 (% YoY) (5) Exhibit 146: Share of SPI in revenue spending (% of total spending) Interest payments Pension Salary & wages (% of total spending) Exhibit 147: Key details of revenue spending by department (% of total) 39% Pension 1% Education etc 16% Police 1% Energy 16% Interest 9% Exhibit 148: Key details of capital spending by department (% of total) 61% Transport 3% Agriculture 7% Energy 18% Rural devt 11% Exhibit 149: Fiscal deficit and revenue balance (% of GDP) Exhibit 15: Debt to GDP ratio Fiscal deficit Revenue balance (% of GDP) (.4) (.5) (% of GDP) April
67 Jharkhand Population: ~35m (2.8% of India s population) Nominal GSDP in FY19: INR 3.1t (~1.7% of India s nominal GDP) Fiscal deficit in FY19 at 2.4% of GSDP Total liabilities in FY19 at 25.8% of GSDP INR b % YoY Total receipts Revenue receipts Total taxes States' own taxes SGST Share in central taxes Non-tax revenue receipts: State Grants from the Centre Non-debt capital receipts Total spending Revenue spending Education, sports, art & culture Agriculture & allied activities Rural development Interest payments Pensions Police Capital spending Water supply & sanitation Agriculture Rural development Irrigation & flood control Energy.... Transport Fiscal deficit % of GDP Revenue deficit % of GDP Primary deficit % of GDP Gross market borrowings % of GDP Net market borrowings % of GDP Outstanding debt % of GDP GSDP (at current prices) 2,75.2 3,34.5 2, , April
68 Exhibit 151: Break-up of total revenue receipts (% of GDP) Taxes Non-tax revenue (% of GDP) Exhibit 152: Further details of tax receipts (% of total taxes) Share in central taxes 58% 6% SGST 23% Property & Capital Transaction 2% Sales, trade etc 11% Exhibit 153: Change in key budget items (% YoY) Exhibit 154: Share of SPI in revenue spending (% of total spending) (5) Rev receipts Rev spending Cap spending (% YoY) Interest payments Pension Salary & wages (% of total spending) Exhibit 155: Key details of revenue spending by department (% of total) 51% Education etc 17% Rural devt 14% Exhibit 156: Key details of capital spending by department (% of total) Transport 34% 22% Agriculture 5% Pension 9% Interest 9% Irrigation & flood control 17% Rural devt 22% Exhibit 157: Fiscal deficit and revenue balance (% of GDP) Exhibit 158: Debt to GDP ratio (% of GDP) Fiscal deficit Revenue balance (.1) (1.7) (% of GDP) April
69 Karnataka Population: ~63.5m (5% of India s population) Nominal GSDP in FY19: INR 14.1t (~7.8% of India s nominal GDP) Fiscal deficit in FY19 at 2.5% of GSDP Total liabilities in FY19 at 19.2% of GSDP. INR b % YoY Total receipts 1, ,45.3 1, , Revenue receipts 1, , ,46.3 1, Total taxes 1, , , , States' own taxes , SGST Share in central taxes Non-tax revenue receipts: State Grants from the Centre Non-debt capital receipts Total spending 1,62.1 1, ,815. 1, Revenue spending 1, , , , Education, sports, art & culture Agriculture & allied activities Rural development Interest payments Pensions Police Capital spending Water supply & sanitation Agriculture Rural development Irrigation & flood control Energy , Transport Fiscal deficit % of GDP Revenue deficit % of GDP Primary deficit % of GDP Gross market borrowings % of GDP Net market borrowings % of GDP Outstanding debt 2,11.7 2, , , % of GDP GSDP (at current prices) 11, , , , April
70 Exhibit 159: Break-up of total revenue receipts (% of GDP) Taxes Exhibit 16: Further details of tax receipts Non-tax revenue (% of total taxes) Share in (% of GDP) central taxes Property & 26% Capital Transaction 8% 23% Excise 13% SGST 3% Exhibit 161: Change in key budget items (% YoY) 5 Rev receipts Rev spending Cap spending (1) Exhibit 162: Share of SPI in revenue spending (% of total spending) Interest payments Pension Salary & wages (% of total spending) Exhibit 163: Key details of revenue spending by department Exhibit 164: Key details of capital spending by department (% of total) 59% Education etc 16% Energy 6% Pension 9% Interest 1% (% of total) Transport 19% Irrigation & flood control 41% 22% Urban devt 8% Welfare of SCs/STs 1% Exhibit 165: Fiscal deficit and revenue balance (% of GDP) (% of GDP) Fiscal deficit Revenue balance Exhibit 166: Debt to GDP ratio (% of GDP) (% of GDP) April 218 7
71 Kerala Population: ~34m (2.7% of India s population) Nominal GSDP in FY19: INR 7.7t (~4.1% of India s nominal GDP) Fiscal deficit in FY19 at 3.1% of GSDP Total liabilities in FY19 at 3.7% of GSDP INR b % YoY Total receipts , Revenue receipts , Total taxes States' own taxes SGST Share in central taxes Non-tax revenue receipts: State Grants from the Centre Non-debt capital receipts Total spending 1,23.8 1,196. 1, , Revenue spending ,96.3 1,13.5 1, Education, sports, art & culture Agriculture & allied activities Rural development Interest payments Pensions Police Capital spending Water supply & sanitation Agriculture Rural development Irrigation & flood control Energy Transport Fiscal deficit % of GDP Revenue deficit % of GDP Primary deficit % of GDP Gross market borrowings % of GDP Net market borrowings % of GDP Outstanding debt 1, ,7.3 2,17.9 2, % of GDP GSDP (at current prices) 6,17.4 7, ,865. 7, April
72 Exhibit 167: Break-up of total revenue receipts (% of GDP) (% of GDP) Taxes Non-tax revenue Exhibit 168: Further details of tax receipts (% of total taxes) 1% Share in central taxes 25% Property & Capital Transaction 5% SGST 35% Sales, trade etc 25% Exhibit 169: Change in key budget items (% YoY) 75 Rev receipts Rev spending Cap spending Exhibit 17: Share of SPI in revenue spending (% of total spending) Interest payments Pension Salary & wages (% of total spending) (25) Exhibit 171: Key details of revenue spending by department (% of total) 54% Pension 16% Education etc 17% Interest 13% Exhibit 172: Key details of capital spending by department 54% Transport 26% Agriculture 7% Rural devt 7% Irrigation & flood control 6% Energy % Exhibit 173: Fiscal deficit and revenue balance (% of GDP) Exhibit 174: Debt to GDP ratio (% of GDP) (% of GDP) Fiscal deficit Revenue balance (1.7) (2.3) (2.4) (2.7) (2.5) (2.1) (1.9) (1.7) (% of GDP) April
73 Madhya Pradesh Population: ~76.5m (6.% of India s population) Nominal GSDP in FY19: INR 8.3t (~4.2% of India s nominal GDP) Fiscal deficit in FY19 at 3.2% of GSDP Total liabilities in FY19 at 26.3% of GSDP INR b % YoY Total receipts 1,241. 1, ,42.1 1, Revenue receipts 1, , ,35.7 1, Total taxes , , States' own taxes SGST Share in central taxes Non-tax revenue receipts: State Grants from the Centre Non-debt capital receipts Total spending 1, , , , Revenue spending 1, , ,345. 1, Education, sports, art & culture Agriculture & allied activities Rural development Interest payments Pensions Police Capital spending Water supply & sanitation Agriculture Rural development Irrigation & flood control Energy Transport Fiscal deficit % of GDP Revenue deficit % of GDP Primary deficit % of GDP Gross market borrowings % of GDP Net market borrowings % of GDP Outstanding debt 1, , ,883. 2, % of GDP GSDP (at current prices) 6, , ,7.5 8, April
74 Exhibit 175: Break-up of total revenue receipts (% of GDP) (% of GDP) Taxes Non-tax revenue Exhibit 176: Further details of tax receipts (% of total taxes) (% of total) Share in central taxes 52% 16% Excise 8% Property & Capital Transaction 6% SGST 18% Exhibit 177: Change in key budget items (% YoY) Exhibit 178: Share of SPI in revenue spending (% of total spending) (2) (4) Rev receipts Rev spending Cap spending Interest payments Pension Salary & wages Exhibit 179: Key details of revenue spending by department (% of total) Education etc 18% Exhibit 18: Key details of capital spending by department (% of total) 32% 57% Pension 8% Energy 9% Interest 8% Transport 2% Energy 7% Irrigation & flood control 3% Rural devt 11% Exhibit 181: Fiscal deficit and revenue balance (% of GDP) (% of GDP) Fiscal deficit Revenue balance Exhibit 182: Debt to GDP ratio (% of GDP) (% of GDP) April
75 Maharashtra Population: ~117.2m (9.3% of India s population) Nominal GSDP in FY19: INR 28.t (~14.9% of India s nominal GDP) Fiscal deficit in FY19 at 1.8% of GSDP Total liabilities in FY19 at 16.5% of GSDP INR b % YoY Total receipts 2,64.4 2, , , Revenue receipts 2,46.9 2, ,576. 2, Total taxes 1,73.3 1,98.4 2,21.8 2, States' own taxes 1, , , , SGST Share in central taxes Non-tax revenue receipts: State Grants from the Centre Non-debt capital receipts Total spending 2,45.3 2, ,6.6 3, Revenue spending 2, , , , Education, sports, art & culture Agriculture & allied activities Rural development Interest payments Pensions Police Capital spending Water supply & sanitation Agriculture Rural development Irrigation & flood control Energy Transport Fiscal deficit % of GDP Revenue deficit % of GDP Primary deficit % of GDP Gross market borrowings % of GDP Net market borrowings % of GDP Outstanding debt 3, ,13.4 4,68.1 4, % of GDP GSDP (at current prices) 22, , , , April
76 Exhibit 183: Break-up of total revenue receipts (% of GDP) (% of GDP) Taxes Non-tax revenue Exhibit 184: Further details of tax receipts (% of total taxes) (% of total taxes) SGST 38% 9% Excise 6% Share in central taxes 19% Sales, trade etc 15% Property & Capital Transaction 13% Exhibit 185: Change in key budget items (% YoY) Rev receipts Rev spending Cap spending 4 3 Exhibit 186: Share of SPI in revenue spending (% of total spending) Interest payments Pension Salary & wages (% of total spending) 2 1 (1) (% YoY) Exhibit 187: Key details of revenue spending by department (% of total) Education etc 2% Exhibit 188: Key details of capital spending by department (% of total) Transport 24% 2% 54% Agriculture 8% Interest 11% Pension 7% Irrigation & flood control 26% Rural devt 13% Agriculture 17% Exhibit 189: Fiscal deficit and revenue balance (% of GDP) (% of GDP) Fiscal deficit Revenue balance Exhibit 19: Debt to GDP ratio (% of GDP) (% of GDP) April
77 Odisha Population: ~43.5m (3.4% of India s population) Nominal GSDP in FY19: INR 4.4t (~2.5% of India s nominal GDP) Fiscal deficit in FY19 at 3.5% of GSDP Total liabilities in FY19 at 2.7% of GSDP INR b % YoY Total receipts , Revenue receipts , Total taxes States' own taxes SGST Share in central taxes Non-tax revenue receipts: State Grants from the Centre Non-debt capital receipts Total spending ,35. 1,42.2 1, Revenue spending Education, sports, art & culture Agriculture & allied activities Rural development Interest payments Pensions Police Capital spending Water supply & sanitation Agriculture Rural development Irrigation & flood control Energy Transport Fiscal deficit % of GDP Revenue deficit % of GDP Primary deficit % of GDP Gross market borrowings % of GDP Net market borrowings % of GDP Outstanding debt % of GDP GSDP (at current prices) 3,772. 4, , , April
78 Exhibit 191: Break-up of total revenue receipts (% of GDP) (% of GDP) Taxes Non-tax revenue Exhibit 192: Further details of tax receipts (% of total taxes) Share in central taxes 56% Property & Capital Transaction 3% Sales, trade etc 11% 12% SGST 18% Exhibit 193: Change in key budget items (% YoY) 6 Rev receipts Rev spending Cap spending (% YoY) 4 2 Exhibit 194: Share of SPI in revenue spending (% of total spending) Interest payments Pension Salary & wages (% of total spending) Exhibit 195: Key details of revenue spending by department (% of total) 49% Education etc 19% Pension 13% Agriculture 9% Rural devt 1% Exhibit 196: Key details of capital spending by department Transport 29% 25% Energy 7% Rural devt 5% Irrigation & flood control 34% Exhibit 197: Fiscal deficit and revenue balance (% of GDP) Exhibit 198: Debt to GDP ratio (% of GDP) (% of GDP) Fiscal deficit Revenue balance (.) (% of GDP) April
79 Punjab Population: ~29.1m (2.3% of India s population) Nominal GSDP in FY19: INR 5.2t (~2.9% of India s nominal GDP) Fiscal deficit in FY19 at 3.8% of GSDP Total liabilities in FY19 at 4.8% of GSDP INR b % YoY Total receipts Revenue receipts Total taxes States' own taxes SGST Share in central taxes Non-tax revenue receipts: State Grants from the Centre Non-debt capital receipts Total spending 1, Revenue spending Education, sports, art & culture Agriculture & allied activities Rural development Interest payments Pensions Police Capital spending Water supply & sanitation Agriculture Rural development Irrigation & flood control Energy Transport Fiscal deficit % of GDP Revenue deficit % of GDP Primary deficit % of GDP Gross market borrowings % of GDP Net market borrowings % of GDP Outstanding debt 1, ,95. 1, , % of GDP GSDP (at current prices) 4, , , , April
80 Exhibit 199: Break-up of total revenue receipts (% of GDP) Taxes Non-tax revenue (% of GSDP) Exhibit 2: Further details of tax receipts (% of total taxes) 9% Excise 11% Share in central taxes 23% Property & Capital Transaction Sales, trade 5% etc 12% SGST 4% Exhibit 21: Change in key budget items (% YoY) 5 Rev receipts Rev spending Cap spending 4 (% YoY) (1) Exhibit 22: Share of SPI in revenue spending (% of total spending) Interest payments Pension Salary & wages (% of total spending) Exhibit 23: Key details of revenue spending by department Exhibit 24: Key details of capital spending by department (% of total) 38% Education etc 13% Agriculture 18% 34% Sanitation 14% Pension 12% Interest 19% Irrigation & Transport flood 17% control 13% Urban devt 22% Exhibit 25: Fiscal deficit and revenue balance (% of GDP) (% of GDP) Fiscal deficit Revenue balance 12.3 Exhibit 26: Debt to GDP ratio (% of GDP) (2.5) (2.) (2.1) (2.2) (1.7) (3.) (2.4) (% of GDP) 31. April 218 8
81 Rajasthan Population: ~72.2m (5.7% of India s population) Nominal GSDP in FY19: INR 9.4t (~5% of India s nominal GDP) Fiscal deficit in FY19 at 3.% of GSDP Total liabilities in FY19 at 32.8% of GSDP INR b % YoY Total receipts 1,17.4 1, , , Revenue receipts 1,9.3 1,31.6 1, , Total taxes , States' own taxes SGST Share in central taxes Non-tax revenue receipts: State Grants from the Centre Non-debt capital receipts Total spending 1,57.9 1,7.7 1, , Revenue spending 1, , , , Education, sports, art & culture Agriculture & allied activities Rural development Interest payments Pensions Police Capital spending Water supply & sanitation Agriculture Rural development Irrigation & flood control Energy Transport Fiscal deficit % of GDP Revenue deficit % of GDP Primary deficit % of GDP Gross market borrowings % of GDP Net market borrowings % of GDP Outstanding debt 2,55. 2, , , % of GDP GSDP (at current prices) 7, , ,42.6 9, April
82 Exhibit 27: Break-up of total revenue receipts (% of GDP) Exhibit 28: Further details of tax receipts (% of total taxes) Taxes Non-tax revenue (% of GDP) (% of total) Property & Capital Transaction 4.1 5% Share in central taxes 43% 22% Excise 9% SGST 21% Exhibit 29: Change in key budget items (% YoY) Exhibit 21: Share of SPI in revenue spending (% of total spending) Rev receipts Rev spending Cap spending (% YoY) Interest payments Pension Salary & wages (1) Exhibit 211: Key details of revenue spending by department Exhibit 212: Key details of capital spending by department (% of total) 42% Pension 12% Education etc 2% Interest 13% Energy 13% (% of total) Transport 2% Energy 18% 29% Irrigation & flood control 12% Sanitation 21% Exhibit 213: Fiscal deficit and revenue balance (% of GDP) (% of GDP) Fiscal deficit Revenue balance (.2) (.5) (.9) (1.6) (2.4) (2.4) (1.9) Exhibit 214: Debt to GDP ratio (% of GDP) April
83 Tamil Nadu Population: ~74.6m (5.9% of India s population) Nominal GSDP in FY19: INR 16.t (~8.6% of India s nominal GDP) Fiscal deficit in FY19 at 2.8% of GSDP Total liabilities in FY19 at 2.9% of GSDP INR b % YoY Total receipts 1, , , , Revenue receipts 1,42.3 1, , , Total taxes 1,14.8 1, , , States' own taxes , SGST Share in central taxes Non-tax revenue receipts: State Grants from the Centre Non-debt capital receipts Total spending 1, ,66.2 2,54.4 2, Revenue spending 1,532. 1, , , Education, sports, art & culture Agriculture & allied activities Rural development Interest payments Pensions Police Capital spending Water supply & sanitation Agriculture Rural development Irrigation & flood control Energy Transport Fiscal deficit % of GDP Revenue deficit % of GDP Primary deficit % of GDP Gross market borrowings % of GDP Net market borrowings % of GDP Outstanding debt 2,52.4 3, ,98.9 3, % of GDP GSDP (at current prices) 13, , , , April
84 Exhibit 215: Break-up of total revenue receipts (% of GDP) (% of GDP) Taxes Non-tax revenue Exhibit 216: Further details of tax receipts (% of total taxes) 15% Share in central taxes 23% Property & Capital Transaction 8% SGST 22% Sales trade etc 32% Exhibit 217: Change in key budget items (% YoY) 15 Rev receipts Rev spending Cap spending 1 (% YoY) 5 (5) Exhibit 218: Share of SPI in revenue spending (% of total spending) Interest payments Pension Salary & wages Exhibit 219: Key details of revenue spending by department (% of total) 48% Pension 14% Education etc 17% Interest 15% Agriculture 6% Exhibit 22: Key details of capital spending by department (% of total) Transport 34% 32% Agriculture 6% Rural devt 8% Irrigation & flood control 11% Exhibit 221: Fiscal deficit and revenue balance (% of GDP) (% of GDP) Fiscal deficit Revenue balance (.2) (.6) (1.) (1.) (1.1) (1.3) (1.1) Exhibit 222: Debt to GDP ratio (% of GDP) April
85 Telangana Population: ~36.8m (2.9% of India s population) Nominal GSDP in FY19: INR 8.4t (~4.4% of India s nominal GDP) Fiscal deficit in FY19 at 3.5% of GSDP Total liabilities in FY19 at 21.4% of GSDP INR b % YoY Total receipts , , , Revenue receipts ,13.8 1,81.5 1, Total taxes States' own taxes SGST Share in central taxes Non-tax revenue receipts: State Grants from the Centre Non-debt capital receipts , Total spending 1, , , , Revenue spending ,85.1 1,66. 1, Education, sports, art & culture Agriculture & allied activities Rural development Interest payments Pensions Police Capital spending Water supply & sanitation Agriculture Rural development Irrigation & flood control Energy , Transport Fiscal deficit % of GDP Revenue deficit % of GDP Primary deficit % of GDP Gross market borrowings % of GDP Net market borrowings % of GDP Outstanding debt 1, ,45.2 1, , % of GDP GSDP (at current prices) 6,542. 7, , , April
86 Exhibit 223: Break-up of total revenue receipts (% of GDP) Taxes Non-tax revenue (% of GDP) Exhibit 224: Further details of tax receipts (% of total taxes) SGST 31% Excise 12% Share in central taxes 22% Property & Capital Transaction 6% Sales, trade etc 29% Exhibit 225: Change in key budget items (% YoY) 1 Rev receipts Rev spending Cap spending Exhibit 226: Share of SPI in revenue spending (% of total spending) Interest payments Pension Salary & wages (% of total spending) (5) (% YoY) Exhibit 227: Key details of revenue spending by department (% of total) 65% Education etc 1% Irrigation 7% Interest 9% Pension 9% Exhibit 228: Key details of capital spending by department (% of total) Transport 8% Irrigation & flood control 43% 32% Sanitation 8% Rural devt 11% Exhibit 229: Fiscal deficit and revenue balance (% of GDP) (% of GDP) Fiscal deficit Revenue balance 5.4 Exhibit 23: Debt to GDP ratio (% of GDP) (% of GDP) April
87 Uttarakhand Population: ~1.6m (~.8% of India s population) Nominal GSDP in FY19: INR 2.4t (~1.3% of India s nominal GDP) Fiscal deficit in FY19 at 2.8% of GSDP Total liabilities in FY19 at 24.3% of GSDP INR b % YoY Total receipts Revenue receipts Total taxes States' own taxes SGST Share in central taxes Non-tax revenue receipts: State Grants from the Centre Non-debt capital receipts Total spending Revenue spending Education, sports, art & culture Agriculture & allied activities Rural development Interest payments Pensions Police Capital spending Water supply & sanitation Agriculture Rural development Irrigation & flood control Energy Transport Fiscal deficit % of GDP Revenue deficit % of GDP.2... Primary deficit % of GDP Gross market borrowings % of GDP Net market borrowings % of GDP Outstanding debt % of GDP GSDP (at current prices) 1, ,19.8 2, , April
88 Exhibit 231: Break-up of total revenue receipts (% of GDP) (% of GDP) Taxes Non-tax revenue Exhibit 232: Further details of tax receipts (% of total taxes) Excise 12% Share in central taxes 38% Property & Capital Transaction Sales, 6% trade etc 1% SGST 34% Exhibit 233: Change in key budget items (% YoY) 5 Rev receipts Rev spending Cap spending Exhibit 234: Share of SPI in revenue spending (% of total spending) Interest payments Pension Salary & wages (% of total spending) (25) (% YoY) Exhibit 235: Key details of revenue spending by department Exhibit 236: Key details of capital spending by department (% of total) 46% Education etc 21% Pension 15% Rural devt 4% Interest 14% (% of total) 38% Transport 23% Irrigation & flood control 7% Sanitation 9% Rural devt 23% Exhibit 237: Fiscal deficit and revenue balance (% of GDP) Fiscal deficit Revenue balance (% of GDP) (.2) (.6) (1.1) Exhibit 238: Debt to GDP ratio (% of GDP) (% of GDP) April
89 Uttar Pradesh Population: ~211m (16.7% of India s population) Nominal GSDP in FY19: INR 14.9t (~8.2% of India s nominal GDP) Fiscal deficit in FY19 at 3.% of GSDP Total liabilities in FY19 at 29.8% of GSDP INR b % YoY Total receipts 2, , ,53.1 3, Revenue receipts 2, ,194. 3,5.3 3, Total taxes 1, , , , States' own taxes , , SGST Share in central taxes 1,94.3 1, , , Non-tax revenue receipts: State Grants from the Centre Non-debt capital receipts ,717.5 Total spending 3, , , , Revenue spending 2, ,71.2 2, , Education, sports, art & culture Agriculture & allied activities Rural development Interest payments Pensions Police Capital spending Water supply & sanitation Agriculture Rural development Irrigation & flood control Energy Transport Fiscal deficit % of GDP Revenue deficit % of GDP Primary deficit % of GDP Gross market borrowings % of GDP Net market borrowings % of GDP Outstanding debt 3, ,14.9 4,64.7 4, % of GDP GSDP (at current prices) 12, , , , April
90 Exhibit 239: Break-up of total revenue receipts (% of GDP) Exhibit 24: Further details of tax receipts Taxes Non-tax revenue (% of total (% of GDP) taxes) Share in Property & central Capital 6.4 taxes Transaction 52% 8% % Excise 9% SGST 19% Exhibit 241: Change in key budget items (% YoY) 75 Rev receipts Rev spending Cap spending 5 25 (25) (% YoY) (5) Exhibit 242: Share of SPI in revenue spending (% of total spending) Interest payments Pension Salary & wages (% of total spending) Exhibit 243: Key details of revenue spending by department Exhibit 244: Key details of capital spending by department (% of total) 53% Education etc 17% Pension 14% Rural devt 6% Interest 1% (% of total) Transport 28% 39% Energy 17% Rural devt 5% Irrigation & flood control 11% Exhibit 245: Fiscal deficit and revenue balance (% of GDP) Fiscal deficit Revenue balance (% of GDP) Exhibit 246: Debt to GDP ratio (% of GDP) (% of GDP) April 218 9
91 West Bengal Population: ~92.4m (7.3% of India s population) Nominal GSDP in FY19: INR 1.5t (~5.9% of India s nominal GDP) Fiscal deficit in FY19 at 2.3% of GSDP Total liabilities in FY19 at 37.6% of GSDP INR b % YoY Total receipts 1,21.7 1, , , Revenue receipts 1, , ,33.3 1, Total taxes 9.9 1, , States' own taxes SGST Share in central taxes Non-tax revenue receipts: State Grants from the Centre Non-debt capital receipts Total spending 1, ,628. 1, , Revenue spending 1, , ,44.4 1, Education, sports, art & culture Agriculture & allied activities Rural development Interest payments Pensions Police Capital spending Water supply & sanitation , Agriculture Rural development , Irrigation & flood control Energy Transport Fiscal deficit % of GDP Revenue deficit % of GDP Primary deficit % of GDP Gross market borrowings % of GDP Net market borrowings % of GDP Outstanding debt 3, ,66.9 3,64.2 3, % of GDP GSDP (at current prices) 9,916. 9, , April
92 Exhibit 247: Break-up of total revenue receipts (% of GDP) Exhibit 248: Further details of tax receipts Taxes Non-tax revenue (% of total (% of GDP) Support Property & taxes) from Capital Centre* Transaction % 7% % Excise 1% SGST 21% Exhibit 249: Change in key budget items (% YoY) Rev receipts Rev spending Cap spending 8 (% YoY) (2) Exhibit 25: Share of SPI in revenue spending (% of total spending) Interest payments Pension Salary & wages (% of total spending) Exhibit 251: Key details of revenue spending by department Exhibit 252: Key details of capital spending by department (% of total) 32% Pension 11% Interest 25% Education etc 2% Rural devt 12% (% of total) 55% Transport 14% Rural devt 13% Energy 6% Irrigation & flood control 12% Exhibit 253: Fiscal deficit and revenue balance (% of GDP) Fiscal deficit Revenue balance (1.) (1.1) (2.3) (1.6) (2.7) (2.1) Exhibit 254: Debt to GDP ratio (% of GDP) (% of GDP) April

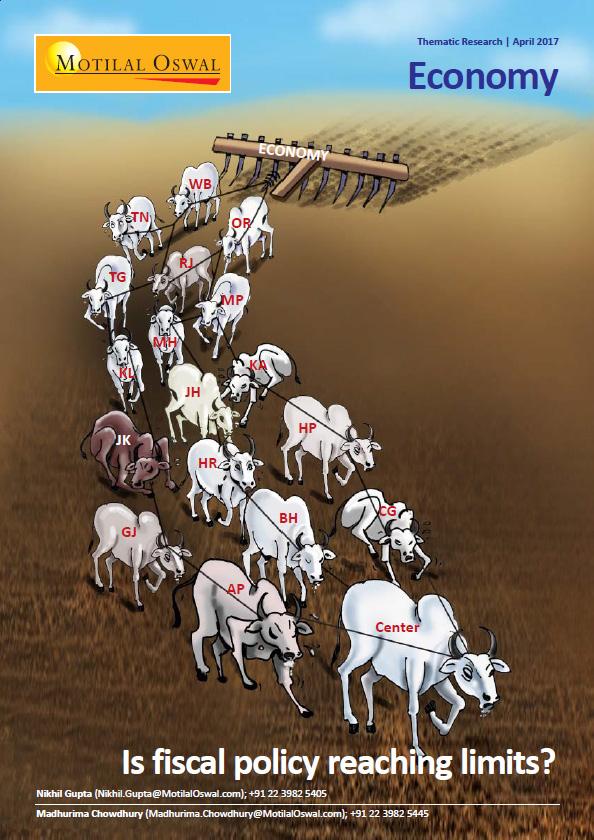
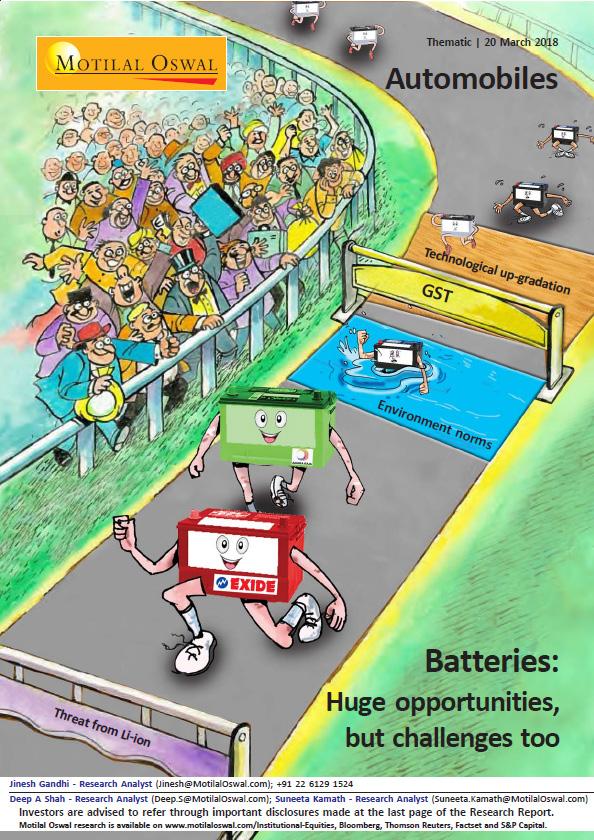
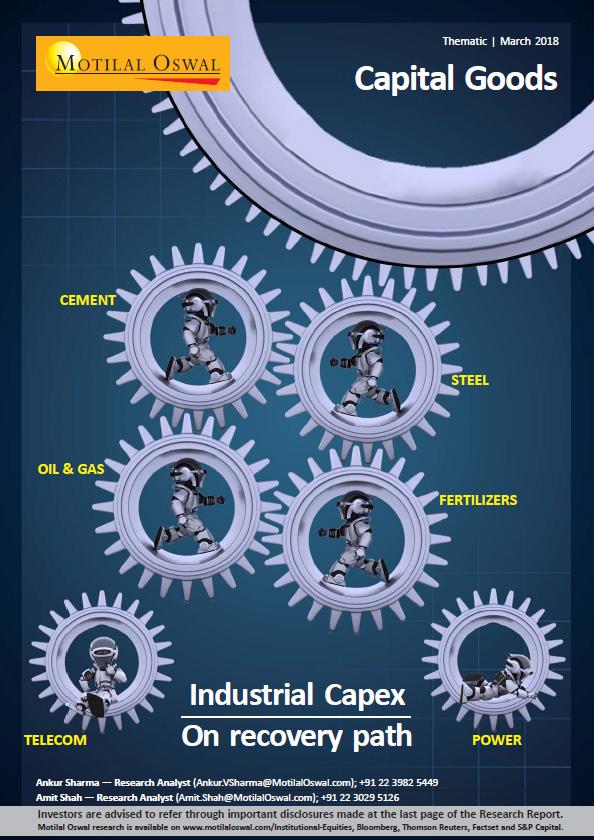
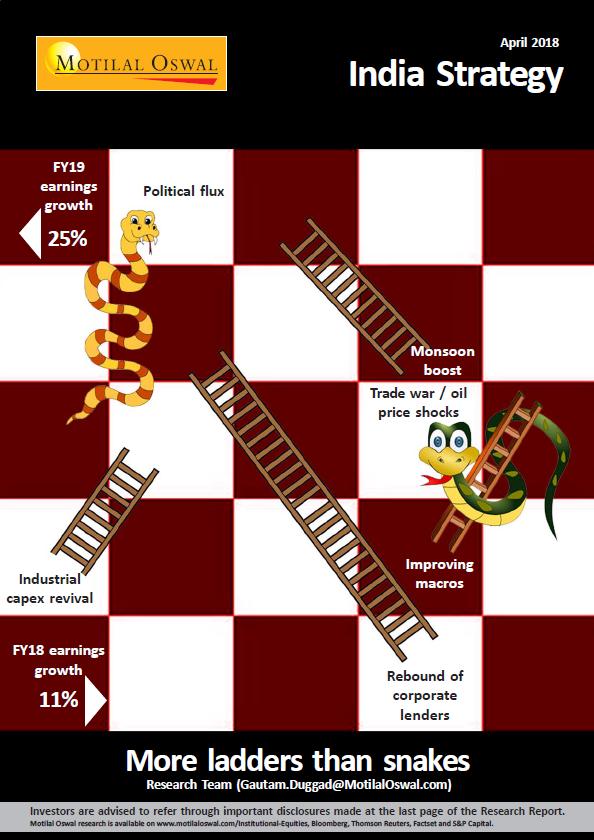
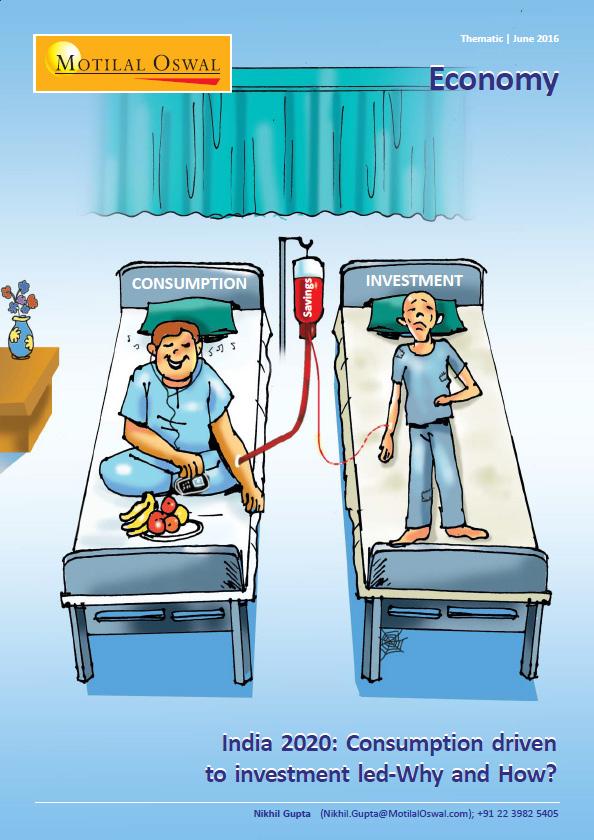
93 THEMATIC/STRATEGY RESEARCH GALLERY
Update April Indian Economy ECONOMY JK HR. Center
 Update April 217 Indian Economy ECONOMY WB TN OR TG RJ MP KL MH JH KA JK HR HP GJ BH CG AP Center Is fiscal policy reaching limits? Nikhil Gupta (Nikhil.Gupta@MotilalOswal.com); +91 22 3982 545 Madhurima
INDICATORS DATA SOURCE REMARKS Demographics. Population Census, Registrar General & Census Commissioner, India
 Public Disclosure Authorized Technical Demographics Public Disclosure Authorized Population Urban Share Child Sex Ratio Adults Population Census, Registrar General & Census Commissioner, India Population
State level fiscal policy choices and their impacts
 State level fiscal policy choices and their impacts Analysis using a regional social accounting matrix for India, 2011-12 A. Ganesh-Kumar 1 and Manoj Panda 2 1 Professor, Indira Gandhi Institute of Development
State Government Borrowing: April September 2015
 November 5, 2015 Economics State Government Borrowing: April September 2015 State Development Loans (SDL) are debt issued by state governments to fund their fiscal deficit. States in India like the centre,
Analysis of State Budgets :
 Analysis of State Budgets 2017-18: Emerging Issues policy brief on state finances 2017 Pinaki Chakraborty Manish Gupta Lekha Chakraborty Amandeep Kaur 1 Introduction While the Union Government finances
Dependence of States on Central Transfers: State-wise Analysis
 Dependence of States on Central : State-wise Analysis C. Bhujanga Rao and D. K. Srivastava Working Paper No. 2014-137 May 2014 National Institute of Public Finance and Policy New Delhi http://www.nipfp.org.in
STATE OF STATE FINANCES
 STATE OF STATE FINANCES Mandira Kala Vatsal Khullar January 2018 Low capacity to raise taxes makes some states depend on central transfers States see slow tax growth in recent years; may need GST compensation
Karnataka Budget Analysis
 -4. 3. 8.9% 7.7% 8.6% 7. 8. 10.3% 14. 19.7% 19.8% 15. 13.4% 13.6% 13.4% 11.8% 11. 11.8% 12. 17.4% Karnataka Budget Analysis The Chief Minister and Finance Minister, Mr. H. D. Kumaraswamy presented the
Bihar: What is holding back growth in Bihar? Bihar Development Strategy Workshop, Patna. June 18
 Bihar: What is holding back growth in Bihar? Bihar Development Strategy Workshop, Patna. June 18 Ejaz Ghani World Bank. Structure of Presentation How does Bihar compare with other states? What is constraining
Bihar Budget Analysis
 -1. -0. 1.6% 4. 6.6% 5. 4.9% 8. 7. 10. 10. 14. Bihar Budget Analysis The Finance Minister of Bihar, Mr. Sushil Kumar Modi, presented the Budget for financial year on February 27, 2018. Budget Highlights
Himachal Pradesh Budget Analysis
 -4.9% -3.2% 3.9% 9. 10.4% 7.2% 10.2% 10. 10.8% 7.5% 9.1% 6.9% Himachal Pradesh Budget Analysis The Finance Minister of Himachal Pradesh, Mr. Jai Ram Thakur, presented the Budget for financial year on March
REPORT ON THE WORKING OF THE MATERNITY BENEFIT ACT, 1961 FOR THE YEAR 2010
 REPORT ON THE WORKING OF THE MATERNITY BENEFIT ACT, 1961 FOR THE YEAR 2010 1. Scope and Objective 1.1 The Maternity Benefit Act, 1961 extends to the whole of the Indian Union and applies to every factory,
FOREWORD. Shri A.B. Chakraborty, Officer-in-charge, and Dr.Goutam Chatterjee, Adviser, provided guidance in bringing out the publication.
 FOREWORD The publication, Basic Statistical Returns of Scheduled Commercial Banks in India, provides granular data on a number of key parameters of banks. The information is collected from bank branches
Uttar Pradesh Budget Analysis
 -2. -0.1% -0.9% 2.8% 2.3% 4. 5.5% 5.1% 4.7% 5.8% 4. 6.8% 6.8% 7.1% 7.9% 9. 8. 7. 8. 7. Uttar Pradesh Budget Analysis The Finance Minister of Uttar Pradesh, Mr. Rajesh Agarwal, presented the Budget for
In the estimation of the State level subsidies, the interest rates that have been
 Subsidies of the State Governments s ubsidies provided by the State governments have been estimated for 15 major States for 1993-94. As explained earlier, the major data source is the Finance Accounts
Economy Watch. Monitoring India s macro-fiscal performance. July 2018
 Economy Watch Monitoring India s macro-fiscal performance July 218 Contents Foreword 3 1. Growth: IIP growth slips to a seven-month low in May 218 4 2. Inflation: CPI inflation increased to a five-month
Kerala Budget Analysis
 2.1% 4.3% 2.9% 5.2% 5.7% 4. 7.2% 6.7% 4.3% 6.6% 7.4% Kerala Budget Analysis The Finance Minister of Kerala, Dr. T.M. Thomas Isaac, presented the Budget for financial year on February 2, 2018. Budget Highlights
STATE DOMESTIC PRODUCT
 CHAPTER 4 STATE DOMESTIC PRODUCT The State Domestic Product (SDP) commonly known as State Income is one of the important indicators to measure the economic development of the State. In the context of planned
14 th Finance Commission: Review and Outcomes. Economics. February 25, 2015
 February 25, 2015 Economics 14 th Finance Commission: Review and Outcomes The 14th Finance Commission (FFC) was constituted on 2nd January, 2013 and submitted its report on 15 th December, 2014. The recommendations
ROLE OF PRIVATE SECTOR BANKS FOR FINANCIAL INCLUSION
 270 ROLE OF PRIVATE SECTOR BANKS FOR FINANCIAL INCLUSION ABSTRACT DR. BIMAL ANJUM*; RAJESHTIWARI** *Professor and Head, Department of Business Administration, RIMT-IET, Mandi Gobindgarh, Punjab. **Assistant
Banking Sector Liberalization in India: Some Disturbing Trends
 SPECIAL REPORT Banking Sector Liberalization in India: Some Disturbing Trends Kavaljit Singh In the first week of August 2005, Reserve Bank of India (RBI), country s central bank, issued a list of 391
TAMILNADU STATE FINANCES
 TAMILNADU STATE FINANCES Prof.K.R.Shanmugam 1 Dr.G.S.Ganesh Prasad 2 Dr. L. Venkatachalam 3 Report Submitted to The Fourteenth Finance Commission, New Delhi MADRAS INSTITUTE OF DEVELOPMENT STUDIES Chennai
Delhi Budget Analysis
 Delhi Budget Analysis The Minister of Finance of Delhi, Mr. Manish Sisodia, presented the Budget for financial year on March 22, 2018. Budget Highlights The Gross State Domestic Product (GSDP) of Delhi
Inclusive Development in Bihar: The Role of Fiscal Policy. M. Govinda Rao
 Inclusive Development in Bihar: The Role of Fiscal Policy M. Govinda Rao Introduction Fiscal policy is a means to achieving inclusive growth. Despite impressive growth performance, uneven regional spread.
Study-IQ education, All rights reserved
 Copyright @ Study-IQ education, All rights reserved TIRELESSSOUL GauravGarg888 Q1) The File cover chosen for 2018 economic survey report was pink because A) To support human rights B) To highlight gender
PORTFOLIO MICROMETER. Issue. 14 data as of 30 th June 2015
 PORTFOLIO i MICROMETER Issue 14 data as of 30 th June 2015 PORTFOLIO 1 MICROMETER data as of 30 th June 2015 All rights reserved. No part of this publication may be reproduced or transmitted in any form
Issue 24 MICROMETER Data as of 31st Dec 2017
 Issue 24 MICROMETER Data as of 31st Dec 2017 All rights reserved. No part of this publication may be reproduced or transmitted in any form or by any means without written permission from MFIN. However,
Employment and Inequalities
 Employment and Inequalities Preet Rustagi Professor, IHD, New Delhi. Round Table on Addressing Economic Inequality in India Bengaluru, 8 th January 2015 Introduction the context Impressive GDP growth over
Did Gujarat s Growth Rate Accelerate under Modi? Maitreesh Ghatak. Sanchari Roy. April 7, 2014.
 Did Gujarat s Growth Rate Accelerate under Modi? Maitreesh Ghatak Sanchari Roy April 7, 2014. The Gujarat economic model under Narendra Modi continues to dominate the media and public discussions as the
Note on ICP-CPI Synergies: an Indian Perspective and Experience
 2 nd Meeting of the Country Operational Guidelines Task Force March 12, 2018 World Bank, Washington, DC Note on ICP-CPI Synergies: an Indian Perspective and Experience 1. Meaning and Scope 1.1 International
UDAY and Power Sector Debt:
 UDAY and Power Sector Debt: DISCUSSION paper Assessing Efficiency Parameters and Impact on Public Finance Pinaki Chakraborty Lekha Chakraborty Manish Gupta Amandeep Kaur 1 1. Introduction With the introduction
Odisha Budget Analysis
 -6.7% -0.4% 4.4% 1.3% 3.1% 1.8% 4.7% 5.4% 7.8% 7.8% 8.1% 9.3% 11. 10.7% 12.4% 8.2% 10.4% 7.1% 15. 15.1% Budget Analysis The Finance Minister of, Mr. Sashibhusan Behera, presented the Budget for financial
Telangana Budget Analysis
 -5.8% -4.9% -2.9% 3.6% 6.8% 6. 6.1% 12.9% 6.2% 11. 8.6% 12.2% 10.2% 10.1% 11.1% 10.4% Budget Analysis The Finance Minister of, Mr. Eatala Rajender, presented the Budget for financial year on March 15,
Issue 26 MICROMETER Data as of 30 June 2018
 Issue 26 MICROMETER Data as of 30 June 2018 All rights reserved. No part of this publication may be reproduced or transmitted in any form or by any means without written permission from MFIN. However,
FY Ends with Lower Business Sentiments. Re-assessing the Macroeconomic Scene for
 APRIL 2013 MONTHLY REPORT VOL. XV NO. 4 HIGHLIGHTS Business Expectations FY 2012 13 Ends with Lower Business Sentiments Charu Jain and Purna Chandra Parida The 84th round of the BES carried out in March
Fiscal Responsibility Legislation in Indian States
 Fiscal Responsibility Legislation in Indian States State Perspectives-Kerala Experience Presentation by K. Jose Cyriac Principal Secretary (Finance) Government of Kerala 1 Revenue Expenditure Prelim BE
Trends in Central and State Finances
 Chapter 3 Trends in Central and State Finances 3.1 In this Chapter, we have looked at some of the salient trends in central and state finances, particularly for the period since the initiation of economic
Madhya Pradesh Budget Analysis
 Madhya Pradesh Budget Analysis The Finance Minister of Madhya Pradesh, Mr. Jayant Malaiya, presented the Budget for financial year on February 28, 2018. Budget Highlights The Gross State Domestic Product
Chhattisgarh Budget Analysis
 -0.2% -1.6% 2.7% 2.9% 1.8% 6.6% 6.5% 7.8% 5.8% 8.9% 3.6% 5.5% 6.8% 9.5% 6. 8.4% 6.7% 10. 13.8% 15.6% Chhattisgarh Budget Analysis The Finance Minister of Chhattisgarh, Dr. Raman Singh, presented the Budget
1,14,915 cr GoI allocations for Ministry of Rural Development (MoRD) in FY
 in FY") BUDGET BRIEFS Vol 1/ Issue 9 Mahatma Gandhi National Rural Employment Guarantee Scheme (MGNREGS), GoI, 218-19 HIGHLIGHTS Mahatma Gandhi National Rural Employment Guarantee Scheme (MGNREGS) is a flagship
BUDGET BRIEFS Vol 1/ Issue 9 Mahatma Gandhi National Rural Employment Guarantee Scheme (MGNREGS), GoI, 218-19 HIGHLIGHTS Mahatma Gandhi National Rural Employment Guarantee Scheme (MGNREGS) is a flagship
International Journal for Research in Applied Science & Engineering Technology (IJRASET) Status of Urban Co-Operative Banks in India
 Status of Urban Co-Operative Banks in India") Status of Urban Co-Operative Banks in India Siddhartha S Vishwam 1, Dr. B. S. Chandrashekar 2 1 Research Scholar, DOS in Economics and Co-operation, University of Mysore, Manasagangothri, Mysore 2 Assistant
Status of Urban Co-Operative Banks in India Siddhartha S Vishwam 1, Dr. B. S. Chandrashekar 2 1 Research Scholar, DOS in Economics and Co-operation, University of Mysore, Manasagangothri, Mysore 2 Assistant
West Bengal Budget Analysis
 0.3% 3. 2.3% 6.4% 5.9% 8.8% 8. 8. 11.4% 10.2% 11. 15. West Bengal Budget Analysis The Finance Minister of West Bengal, Dr. Amit Mitra presented the Budget for financial year on January 31, 2018. Budget
Debt Market Review: October 2018
 Apr-18 May-18 Jun-18 Jul-18 Aug-18 Sep-18 Oct-18 Debt Market Review: October 2018 Contact: Kavita Chacko Senior Economist kavita.chacko@careratings.com 91-22-67543687 Dr. Rucha Ranadive Economist rucha.ranadive@careratings.com
CHAPTER - 4 MEASUREMENT OF INCOME INEQUALITY BY GINI, MODIFIED GINI COEFFICIENT AND OTHER METHODS.
 CHAPTER - 4 MEASUREMENT OF INCOME INEQUALITY BY GINI, MODIFIED GINI COEFFICIENT AND OTHER METHODS. CHAPTER-4. MESUREMENT OF INCOME INEQUALITY BY GINI, MODIFIED GINI COEFFICIENT AND OTHER METHODS 4.1 Income
Forthcoming in Yojana, May Composite Development Index: An Explanatory Note
 1. Introduction Forthcoming in Yojana, May 2014 Composite Development Index: An Explanatory Note Bharat Ramaswami Economics & Planning Unit Indian Statistical Institute, Delhi Centre In May 2013, the Government
Renewable Energy in India: Getting to Targets
 Renewable Energy in India: Getting to Targets Gireesh Shrimali Director, Climate Policy Initiative Fellow, Stanford University BRAZIL CHINA EUROPE INDIA INDONESIA UNITED STATES 235 Montgomery St. 13th
Sarva Shiksha Abhiyan, GOI
 Sarva Shiksha Abhiyan, GOI 2012-13 The Sarva Shiksha Abhiyan (SSA) is the Government of India's (GOI) flagship elementary education programme. Launched in 2001, it aims to provide universal primary education
Fiscal Imbalances and Indebtedness across Indian States: Recent Trends
 Fiscal Imbalances and Indebtedness across Indian States: Recent Trends Tapas K. Sen and Santosh K. Dash Working Paper No. 2013-119 February 2013 National Institute of Public Finance and Policy New Delhi
Mending Power Sector Finances PPP as the Way Forward. Energy Market Forum
 Mending Power Sector Finances PPP as the Way Forward Energy Market Forum AF Mercados EMI 11 th February 2011 Structure of the Presentation Current Status of Power Sector Generation Transmission Distribution
`6,244 cr GOI allocations for Ministry of Drinking Water and Sanitation(MoDWS) in FY
 in FY") Accountability Initiative Research and Innovation for Governance Accountability The Swachh Bharat Mission (SBM), previously called the Nirmal Bharat Abhiyan (NBA), is the Government of India s (GOI) flagship
Accountability Initiative Research and Innovation for Governance Accountability The Swachh Bharat Mission (SBM), previously called the Nirmal Bharat Abhiyan (NBA), is the Government of India s (GOI) flagship
OUTSTANDING GOVERNMENT DEBT
 ISIN Security OUTSTANDING GOVERNMENT DEBT TABLE 3: OUTSTANDING GOVERNMENT DEBT (Previous Month) Mod V+ (for V- (for Modified for 100bps for 100 bps Expected price for a 100bps rise in yield due to and
MONTHLY UPDATE NOVEMBER 2018
 MONTHLY UPDATE NOVEMBER 2018 November 2018 A champion is defined not by their wins but by how they can recover when they fall. Equity markets - Serena Williams Indices 31 st Oct 2018 30 th Nov 2018 1 Month
1,07,758 cr GoI allocations for Ministry of Rural Development (MoRD) in FY
 in FY") BUDGET BRIEFS Vol 10/ Issue 9 Mahatma Gandhi National Rural Employment Guarantee Scheme (MGNREGS), GoI, 2017-18 HIGHLIGHTS Mahatma Gandhi National Rural Employment Guarantee Scheme (MGNREGS) is a flagship
BUDGET BRIEFS Vol 10/ Issue 9 Mahatma Gandhi National Rural Employment Guarantee Scheme (MGNREGS), GoI, 2017-18 HIGHLIGHTS Mahatma Gandhi National Rural Employment Guarantee Scheme (MGNREGS) is a flagship
OUTSTANDING GOVERNMENT DEBT
 48 CCIL ISIN Monthly Newsletter d OUTSTANDING GOVERNMENT DEBT TABLE 3: OUTSTANDING GOVERNMENT DEBT Yield Yield (Previous Month) Mod V+ ( V- ( Modified 100bps 100bps Expected price a 100bps rise in yield
Issue 06. MFIN micrometer. data as of 30 th June 2013
 Issue 06 MFIN micrometer data as of 30 th June 2013 All rights reserved. No part of this publication may be reproduced or transmitted in any form or by any means without written permission from MFIN. However,
Goods and Services Tax in India Current Update
 Goods and Services Tax in India Current Update Santosh Dalvi Partner and Deputy National Head Indirect tax, KPMG in India 8 December 2018 Setting the Context 50% increase in unique indirect taxpayers under
TRENDS IN SOCIAL SECTOR EXPENDITURE - AN INTER STATE COMPARISON
 TRENDS IN SOCIAL SECTOR EXPENDITURE - AN INTER STATE COMPARISON Mercy W.J Social sector public outlay and social development An inter state comparison Thesis. Department of Economics, Dr. John Matthai
Gujarat Budget Analysis
 Gujarat Budget Analysis The Finance Minister of Gujarat, Mr. Nitin Patel, presented the Budget for financial year on February 20, 2018. Budget Highlights The Gross State Domestic Product of Gujarat for
ECOSCOPE. Real GDP growth eases on lower net indirect taxes. The Economy Observer. Real GVA growth exactly as expected
 31 August 2016 ECOSCOPE The Economy Observer Real GDP growth eases on lower net indirect taxes Real GVA growth exactly as expected India s real gross domestic product (GDP) grew at the slowest pace in
Total Sanitation Campaign GOI,
 Total Sanitation Campaign GOI, 2012-13 Launched in 1999, the Total Sanitation Campaign (TSC) is the Government of India's (GOI) flagship programme for providing universal access to sanitation facilities.
Creating Jobs in India s Organised Manufacturing Sector
 Creating Jobs in India s Organised Manufacturing Sector Come, Make in India. Sell anywhere but come and manufacture here. Prime Minister, Narendra Modi, 15 th August, 2014 Stagnant Contribution of the
GST Concept and Design
 GST Concept and Design GST Understanding from the First discussion paper released by the Empowered Committee of State Finance Ministers on November 10, 2009 1 Understanding GST Brief History Need for GST
National Rural Employment Guarantee Act (NREGA 2005) Santosh Mehrotra Senior Adviser (Rural Development) Planning Commission Government of India
 Santosh Mehrotra Senior Adviser (Rural Development) Planning Commission Government of India") National Rural Employment Guarantee Act (NREGA 2005) Santosh Mehrotra Senior Adviser (Rural Development) Planning Commission Government of India 1 30 yr history of WEPs but Problems Low programme coverage
National Rural Employment Guarantee Act (NREGA 2005) Santosh Mehrotra Senior Adviser (Rural Development) Planning Commission Government of India 1 30 yr history of WEPs but Problems Low programme coverage
Issue 18. micrometer
 Issue 18 micrometer data as of 30 th June 2016 1 All rights reserved. No part of this publication may be reproduced or transmitted in any form or by any means without written permission from MFIN. However,
Haryana Budget Analysis
 -2. -2. 3.1% 3. 2.3% 5.7% 7. 7. 7.7% 6.1% 7.7% 8. 9. 9. 8.7% 10.5% 9.9% 10.3% 10.9% 10.8% Budget Analysis The Finance Minister of, Captain Abhimanyu, presented the Budget for financial year on March 9,
Post and Telecommunications
 Post and Telecommunications This section presents operating and financial data relating to the different branches of the Department of Posts including the Post Office Savings Banks. It comprises statistics
THE INDIAN HOUSEHOLD SAVINGS LANDSCAPE
 THE INDIAN HOUSEHOLD SAVINGS LANDSCAPE Cristian Badarinza National University of Singapore Vimal Balasubramaniam University of Oxford Tarun Ramadorai University of Oxford, CEPR and NCAER July 2016 Savings
Insolvency Professionals to act as Interim Resolution Professionals or Liquidators (Recommendation) Guidelines, 2018
 Guidelines, 2018") Insolvency Professionals to act as Interim Resolution Professionals or Liquidators (Recommendation) Guidelines, 2018 Provisions in the Insolvency and Bankruptcy Code, 2016 31 st May, 2018 1. Section 16(3)(a)
Insolvency Professionals to act as Interim Resolution Professionals or Liquidators (Recommendation) Guidelines, 2018 Provisions in the Insolvency and Bankruptcy Code, 2016 31 st May, 2018 1. Section 16(3)(a)
CONTENTS AT A GLANCE DIRECT TAX INDIRECT TAX CORPORATE LAWS
 November 2016 / Volume VIII / ASA The key amendments introduced in statutes, policies and procedures in respect of Direct Tax, Indirect Tax, Corporate Laws & Accounting Standards, Foreign Exchange Management
Private Corporate Investment: Growth in and Prospects for *
 Growth in 2016-17 and Prospects for 2017-18* This article attempts to capture investment intentions in fixed capital by private companies and joint business sectors, as a barometer of short-term business
Analysis of State Budgets :
 Analysis of State Budgets 2017-18: Emerging Issues policy brief on state finances 2017 Pinaki Chakraborty Manish Gupta Lekha Chakraborty Amandeep Kaur 1 Introduction While the Union Government finances
POPULATION PROJECTIONS Figures Maps Tables/Statements Notes
 8 POPULATION PROJECTIONS Figures Maps Tables/Statements 8 Population projections It is of interest to examine the variation of the Provisional Population Totals of Census 2011 with the figures projected
RBI s Overview of the State Finances. July 18, 2018 I ECONOMICS. Overview of state finances
 RBI s Overview of the State Finances Contact: Madan Sabnavis Chief Economist madan.sabnavis@careratings.com 91-22-67543489 Purnima M. Nair Associate Economist purnima.nair@careratings.com +91-22-6754 3568
Piyush Goyal, MoS (IC) for Power, Coal, RE & Mining
 for Power, Coal, RE & Mining") 7 September 2016 Utilities Piyush Goyal, MoS (IC) for Power, Coal, RE & Mining Takeaways from CEO track Mr Piyush Goyal Minister of State for Power, Coal & Mining We hosted Mr. Piyush Goyal, Minister of
7 September 2016 Utilities Piyush Goyal, MoS (IC) for Power, Coal, RE & Mining Takeaways from CEO track Mr Piyush Goyal Minister of State for Power, Coal & Mining We hosted Mr. Piyush Goyal, Minister of
79,686 cr GoI allocations for the Ministry of Human Resource Development (MHRD) in FY
 in FY") BUDGET BRIEFS Vol 10/ Issue 1 Sarva Shiksha Abhiyan (SSA) GoI, 2017-18 Sarva Shiksha Abhiyan (SSA) is the Government of India s (GoI) flagship elementary education programme. Launched in 2001, it aims
BUDGET BRIEFS Vol 10/ Issue 1 Sarva Shiksha Abhiyan (SSA) GoI, 2017-18 Sarva Shiksha Abhiyan (SSA) is the Government of India s (GoI) flagship elementary education programme. Launched in 2001, it aims
Preliminary: Please do not cite without permission. Economic Growth and Regional Inequality in India
 Draft: October 14, 2009 Preliminary: Please do not cite without permission. Economic Growth and Regional Inequality in India Douglas J. Young, Ph.D.* and Vinish Kathuria, Ph.D.** Visiting Professor* and
FINANCING EDUCATION IN UTTAR PRADESH
 FINANCING EDUCATION IN UTTAR PRADESH 1. The system of education finance in India is complicated both because of general issues of fiscal federalism and the specific procedures and terminology used in the
GOVERNMENT OF INDIA MINISTRY OF AGRICULTURE AND FARMERS WELFARE DEPARTMENT OF AGRICULTURE, COOPERATION AND FARMERS WELFARE
 GOVERNMENT OF INDIA MINISTRY OF AGRICULTURE AND FARMERS WELFARE DEPARTMENT OF AGRICULTURE, COOPERATION AND FARMERS WELFARE 748. PROF. SAUGATA ROY: LOK SABHA UNSTARRED QUESTION NO. 748 TO BE ANSWERED ON
Fiscal Performance Index Of The States in India An Empirical Model Based Evidences
 Centre of Excellence in Fiscal Policy and Taxation Fiscal Performance Index Of The States in India An Empirical Model Based Evidences S.R. No. 008 02/2016/CEFT 1 P a g e Table of Contents 1. Backdrop...
JOINT STOCK COMPANIES
 This section contains statistics relating to joint stock companies which are based on returns received from Registrars of Joint Stock Companies. Tables 25.1 (A) (B) to 25.4 These tables present data regarding
GOVERNMENT OF INDIA MINISTRY OF AGRICULTURE AND FARMERS WELFARE DEPARTMENT OF AGRICULTURE, COOPERATION AND FARMERS WELFARE
 GOVERNMENT OF INDIA MINISTRY OF AGRICULTURE AND FARMERS WELFARE DEPARTMENT OF AGRICULTURE, COOPERATION AND FARMERS WELFARE 425 SHRI VENKATESH BABU T.G.: SHRI KESHAV PRASAD MAURYA: DR. A. SAMPATH: ADV.
IJPSS Volume 2, Issue 9 ISSN:
 REGIONAL DISPARITY IN THE DISTRIBUTION OF AGRICULTURAL CREDIT DR.S.GANDHIMATHI* DR.P.AMBIGADEVI** V.SHOBANA*** _ ABSTRACT The Eleventh Five year plan makes specific focus on the inclusive growth of the
GOVERNMENT OF INDIA MINISTRY OF HOME AFFAIRS LOK SABHA UNSTARRED QUESTION NO. 2557
 GOVERNMENT OF INDIA MINISTRY OF HOME AFFAIRS LOK SABHA UNSTARRED QUESTION NO. 2557 TO BE ANSWERED ON THE 01 ST AUGUST, 2017 / SHRAVANA 10, 1939 (SAKA) PENSION TO FREEDOM FIGHTERS 2557. SHRI TAMRADHWAJ
Q4 FY 13. Investor Information
 Q4 FY 13 Investor Information Key Messages : FY 13 Retail Advance grew by 25.47% (12.58%) SME Advance grew by 22.44% (9.49%) Retail & SME Customer base increased by 79.8% in 12 months (32.90%) Other Income
Financial Results Q3/FY February 2019
 Financial Results Q3/FY18-19 08 February 2019 HIGHLIGHTS - DEC 2018 Total Business Total Deposit Gross Advance Operating Profit (Q-3) Rs. 291519 Crore Rs. 177906 Crore Rs.113610 Crore Rs. 381 Crore Basel
FY18 State Budgets. Analysis #3 Strong capex growth within FRBM barricade. 24 March 2017
 24 March 2017 India Strategy FY18 State Budgets Analysis #3 Strong capex growth within FRBM barricade In this report, we present seven state budgets, namely Haryana, Rajasthan, AP, Telangana, Karnataka,
Private Corporate Investment: Growth in and Prospects for *
 ARTICLE Growth in 2015-16 and Prospects for 2016-17* This article analyses the trend in investment intentions of private companies and joint business sectors, which provide a measure of short - term changes
Investor Presentation Q2 FY November 2017
 Investor Presentation Q2 FY 2017-18 November 2017 Disclaimer 2 This presentation is confidential and may not be copied, published, distributed or transmitted. The information in this presentation is being
(b) whether the Government has paid insurance claims as compensation for damage of crops due to floods and drought during the current year;
 whether the Government has paid insurance claims as compensation for damage of crops due to floods and drought during the current year;") O.I.H. GOVERNMENT OF INDIA MINISTRY OF AGRICULTURE AND FARMERS WELFARE DEPARTMENT OF AGRICULTURE, COOPERATION AND FARMERS WELFARE LOK SABHA UNSTARRED QUESTION NO.2026 TO BE ANSWERED ON THE 14 TH MARCH,
O.I.H. GOVERNMENT OF INDIA MINISTRY OF AGRICULTURE AND FARMERS WELFARE DEPARTMENT OF AGRICULTURE, COOPERATION AND FARMERS WELFARE LOK SABHA UNSTARRED QUESTION NO.2026 TO BE ANSWERED ON THE 14 TH MARCH,
6,908 cr GoI allocations for Ministry of Social Justice and Empowerment (MSJE) in FY
 in FY") BUDGET BRIEFS Vol 10/ Issue 5 Self Employment Scheme for Rehabilitation of Manual Scavengers (SRMS) GoI, 2017-18 The Self Employment Scheme for Rehabilitation of Manual Scavengers (SRMS) is a Central Sector
BUDGET BRIEFS Vol 10/ Issue 5 Self Employment Scheme for Rehabilitation of Manual Scavengers (SRMS) GoI, 2017-18 The Self Employment Scheme for Rehabilitation of Manual Scavengers (SRMS) is a Central Sector
Impact of VAT in Central and State Finances. An Assessment
 Impact of VAT in Central and State Finances An Assessment R. Kavita Rao Fellow, National Institute of Public Finance and Policy, New Delhi 1. Introduction After the 1994 report on the Reform of Domestic
GDP to grow at 7% in fiscal CRISIL Outlook September 2017
 GDP to grow at 7% in fiscal 2018 CRISIL Outlook September 2017 CRISIL has trimmed its fiscal 2018 growth forecast for India by 40 basis points to 7% from 7.4% earlier, after data for the first quarter
Private Corporate Investment: Growth in and Prospects for *
 Private Corporate Investment: Growth in 2014-15 and Prospects for 2015-16 ARTICLE Private Corporate Investment: Growth in 2014-15 and Prospects for 2015-16* This article endeavours to gauge business sentiments
Credit Penetration in Odisha Economy: A Comparative Analysis
 Credit Penetration in Odisha Economy: A Comparative Analysis 1. Backdrop Bank Credit plays a vital role in the economic development. Bank credit is the major source of financing in India. More than 60%
Session 1: Domestic resource mobilization. Presentation
 MINISTRY OF FINANCE REPUBLIC OF INDONESIA Asia-Pacific Outreach Meeting on Sustainable Development Financing 10-11 June 2014 Djuanda Hall, Ministry of Finance Complex, Jakarta Session 1: Domestic resource
Castor Seed &Oil Monthly Research Report
 Castor Seed &Oil Monthly Research Report Contents Outlook and Review Recommendations Seed Supply & Demand Oil Supply & Demand Domestic Market Fundamentals Technical Analysis (Futures Market) Castor Seed
No significant jump in retail electronic payments post demonetization
 No significant jump in retail electronic payments post demonetization Confirms a considerable dent in consumer demand in 4Q2016 29 December 2016 ECOSCOPE The Economy Observer The government s attempts
' Website: The National Stock Exchange of India Ltd. Corporate Communications Department
 Kurla 4 Avenue Supermarts Limited Plot No. 3-72 & B-72A, Wagle Industrial Estate, Thane (West), Maharashtra, India - 64 Tel.: 91 22 3345 Fax: 91 22 334599 ' e-mail: info@dmartindia.com ' Website: www.dmartindia.com
GST Update M.S. CHHAJED & CO. GST UPDATE 2/
 GST Update 02 2018-19 01st June 2018 FOR PRIVATE CIRCULATION ONLY M.S. CHHAJED & CO. GST UPDATE 2/18-19 1 E-way Bill Now E-way Bill shall be required to be generated for intra-state movement of goods in
CRISIL SME Ratings: Facilitating Growth and Access to Finance for MSMEs
 Presentation to ICAI Western India Regional Council, Mumbai CRISIL SME Ratings: Facilitating Growth and Access to Finance for MSMEs Yogesh Dixit Director-SME Ratings, CRISIL Somasekhar Vemuri Director-Criteria