Piecing Together Financial Puzzles tm. Copyright 2014 Forensic Accounting Services, LLC All Rights Reserved
|
|
|
- Alaina Boone
- 5 years ago
- Views:
Transcription

1
2 Physician s Computer Company PCC 2014 Users Conference Safeguarding Your Practice's Fiscal Health (from undetected fraud scheme) Burlington, Vermont Wednesday, July 16, 2014


 Startedfifth book - Employee Theft and")
3 Stephen Pedneault, CPA/CFF, CFE Founder of Forensic Accounting Services, LLC 26 years of fraud experience Investigated embezzlements and fraud ranging from a few thousand to over $6 million Frequent speaker and writer Adjunct Professor of Forensic Accounting, UConn MSA Program and Manchester Community College Member of AICPA, CSCPA, ACFE, NACVA Author of four books, Fraud 101; Anatomy of a Fraud Investigation; Preventing and Detecting Employee Theft and Embezzlement; and Forensic Accounting/Fraud Investigation for Non-Experts, 3rd. (Wiley) Startedfifth book - Employee Theft and Embezzlement Within A Medical Practice (MGMA)
4 Session Objective Medical practices continue to get victimized by someone working within the practice. Due to the volume and complexities of medical billing, schemes are frequently perpetrated within billing and collections, well concealed from detection within the volume of transactions.
5 Session Objective A scheme could go undetected for years, and amount to tens and hundreds of thousands. In this session we will focus the discussions on employee embezzlement schemes, and identify practical measures every practice can implement to minimize their risk of loss due to the dishonest actions of an employee.
6 Session Outline Headlines Outsider Threats Insider Threats Your Practice s Environment


7
8
9 How many cases of employee embezzlement ever appear in the media? 1 in 9cases and there is one in the media pretty much every day!
10 Session Outline Headlines Outsider Threats Insider Threats Your Practice s Environment

11 Outsider Threats Patient Identity Theft Insurance Fraud Patient Credit Card Theft Bank Account Theft Product Theft Vendor Schemes System Access

12 Vendors Thefts againstyour practices Returns? Credits? Overpayments?


13 Protecting Patient Information


14 See The Difference? Which one would you prefer to find in your practice?


15 Your Environment? What would I have access to in your office when no one was around?

16 Hopefully NotYour Environment


17 Even Your Shredding
18 Session Outline Headlines Outsider Threats Insider Threats Your Practice s Environment


19 Insider Threats Embezzlement Schemes Theft of Supplies Theft of Patient Information Billing Schemes System Access

20 What wasthe most common form of theft from a medical practice?

21 What has becomethe most common form of theft from a medical practice?
22 The Fraud Triangle Financial Pressure A Recipe for Embezzlement Opportunity Rationalization

23 Embezzlement Concerns Insurance Payments Patient Payments Patient Refunds Credit Card System Cash Disbursements Employee Reimbursements Payroll
24 3 Step Approach to Fraud: I. Prevent fraudfrom occurring II. Detect itas soon as possible III. Obtain adequateinsurance coverage - employee dishonesty or employee crime.
25 Session Outline Headlines Outsider Threats Insider Threats Your Practice s Environment
26 Effective Internal Controls Expectations Adherence Consequences
27 Embezzlement Theft Concealment Conversion
28 3 Step Approach to Fraud: I. Prevent fraudfrom occurring II. Detect itas soon as possible III. Obtain adequateinsurance coverage - employee dishonesty or employee crime.
29 Fraud Approach Triangle Prevention Detection Insurance
30 What can you do? Financial Pressure Opportunity Rationalization to the extent you can

31 Employees respect what you inspect and monitor.

32 Trust is notan internal control. Trust with verification.

33 Screen all new hires, especially individuals who will handle your money and finances Contact listed references Call all previous employers (would they re-hire the person?) Criminal check CREDIT CHECK (with their authorization)

34 Know Your Employees! What Else? What s going on in their lives? Where do they spend their nights and weekends? Living extravagantly? Never taking any vacation time? Facebook IT Manager

35 What To Look For To Determine If Someone Is Embezzling Funds Unusual Employee Behavior Unreconciled Accounts Missing Documents Unexplained Differences Unusual Behavior

36 In any medical practice where does the process start? Scheduling


37 Scheduling

38 Revenue Cycle Charges Collections Adjustments Aging
39 Revenue Cycle Charges Collections Adjustments Aging


40 Revenue Cycle Scheduling Arriving


41 Revenue Cycle Patient Seen Charting


42 Revenue Cycle Co-Payments Collected Billing Completed


43 Revenue Cycle Billing Submitted Payments Received


44 Revenue Cycle Payments/Adjustments Posted Bank Deposit


45 Revenue Cycle Patient Statements A/R Follow-up


46 Revenue Cycle Posting to Accounting System Reconciling Collections

47 Possible Scenarios Charges are captured completely and accurately in the billing system Posted as payment Adjusted Off Still on the Aging

48 Know Your Patients! What Else? Reconcile charges with schedules Account for No Shows, Missed Appointments and Walk-ins Gross Fee Schedule is Fixed Employees cannot override

49 Cash Receipts Who collects payments? Who makes the deposits? Who reconciles the receipts, deposits and postings?

50 Reconciling Payments $ Received $ Deposited $ Posted
51 Co-Pays and Patient Payments Collection Points Satellite Offices, Retail Products Any add-on charges?
52 Create Expectations $5.00 off your next visit if we fail to issue you a receipt
53 Every practice should have two prominently posted signs We expect your payment at the time of your visit
54 The sign we never see Expect a receipt for any payment you make today


55

56

57

58
59 Revenue Cycle Charges Collections Adjustments Aging
60 Co-Pays and Patient Payments Where are your collection points? Satellite offices? Retail sales? Non-billing receipts?
61 Processing Payments Lockbox? Who has access -payments and posting? Receipt books used? Pre-numbered, three-part?


62 Conversion of Checks

63 Remote Deposit Capture


64 Today s Deposit Method

65


66 High Tech Piecing Together Financial Puzzlestm

67 Credit Card Payments Who has accessto process credit card payments? Who reviews the credit card activity? How is your patient s credit card information protected?

68 Merchant Statement
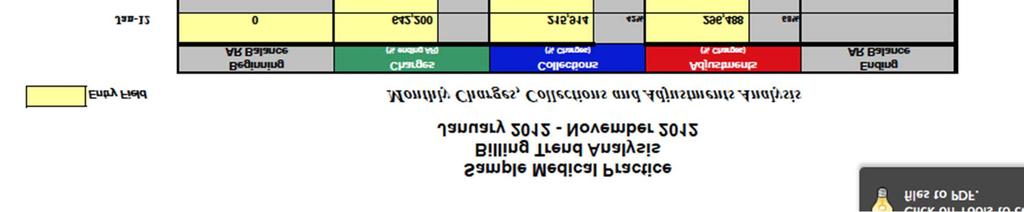
69 Revenue Cycle Charges Collections Adjustments Aging
70 Posting Adjustments Who has access -payments and posting? Adjustments Tracked and monitored? By reason, and by month?
71 Revenue Cycle Charges Collections Adjustments Aging
72 How do you find fraud or embezzlement within the billing cycle? Reviewing and reconciling Random audits Monthly trending
73 Excel Monthly Roll Trends S a m p le M e d ic a l P ra c tic e A c c o u n ts R e c e iv a b le A n a l y s is J a n u a r y D e c e m b e r S a m p le P ra c tic e M on th ly A /R R oll A n alysis B e g i n n i n g A R B a la n c e C h a rg e s (% e n d i n g A R ) C o l le c ti o n s (% C h a rg e s) A d j u s tm e n ts (% C h a r g e s) E n d i n g A R B a la n c e J a n F e b , % 1, % 2, % 1 1 0,3 8 0 M a r , , % 1 4, % 1 6, % 2 0 8,0 8 2 A p r , , % 4 3, % 5 7, % 2 2 2,8 0 1 M a y , , % 4 3, % 4 9, % 2 2 0,1 5 6 J u n , , % 8 0, % 1 0 2, % 1 6 1,1 8 4 J u l , , % 2 9, % 4 5, % 1 9 2,8 1 8 A u g , , % 3 1, % 3 0, % 2 7 0,9 1 2 S e p , , % 6 1, % 1 3 0, % 1 8 5,7 9 0 O c t , , % 6 3, % 8 0, % 1 8 5,6 6 6 N o v , , % 2 9, % 3 8, % 2 3 8,6 4 3 D e c , , % 8 6, % 9 2, % 2 2 9,5 2 2 J a n -0 1 # D IV /0! 0 F e b -0 1 # D IV /0! 0 M a r -0 1 # D IV /0! 0 A p r -0 1 # D IV /0! 0 M a y -0 1 # D IV /0! 0 Y T D A v e r a g e 4 4, % 2 0 2, ,8 6 4 # D IV /0! 5 8, % N u m b e r o f M o n t h s R e p o r t e d ,0 0 0 C h a r g e s, C o l l e c t i o n s & A d j u s t m e n t s 1 5 0,0 0 0 C h a rg e s 1 0 0,0 0 0 A d j u s tm e n ts 5 0,0 0 0 C o l le c ti o n s 0 J a n -0 0 F e b -0 0 M a r-0 0 A p r-0 0 M a y -0 0 J u n -0 0 J u l-0 0 A u g -0 0 S e p -0 0 O c t-0 0 N o v -0 0 D e c -0 0 J a n -0 1 F e b -0 1 M a r-0 1 A p r-0 1 M a y -0 1
74 Excel Monthly Aging Trends Sam p le M ed ical P rac tice Acc o u n ts Re ce iva b le A na l ysis F o r t he Pe ri o d Ju l y, Ju l y, Sa m p le P ra c tice A ging Trend A nalysis O ve r 120 T o ta l C u rre n t Da ys Da ys Da ys Da ys A/ R J u l y 1,485, % 506, % 330,438 7 % 240,076 5 % 1,859, % 4,423,040 A u g us t 1,285, % 549, % 322,611 8 % 229,110 6 % 1,511, % 3,897,754 Se p te m be r 1,285, % 550, % 423, % 263,352 6 % 1,588, % 4,111,799 O c t obe r 1,555, % 565, % 418,187 9 % 239,625 5 % 1,665, % 4,444,653 N ove m be r 1,284, % 591, % 464, % 333,284 8 % 1,504, % 4,179,126 De ce m be r 1,150, % 502, % 421, % 446, % 1,653, % 4,173, Ja n u a ry 1,563, % 383,470 8 % 357,905 8 % 344,882 7 % 2,016, % 4,666,100 F e b rua ry 1,402, % 596, % 226,219 5 % 322,946 7 % 2,225, % 4,773,713 M a rc h 1,412, % 554, % 357,108 7 % 199,631 4 % 2,251, % 4,775,538 Ap ri l 1,399, % 421,674 9 % 309,634 7 % 262,745 6 % 2,298, % 4,692,315 M a y 1,370, % 441, % 233,778 5 % 240,806 5 % 2,275, % 4,561,406 J u ne 1,351, % 453, % 253,774 6 % 187,375 4 % 2,325, % 4,571,615 J u l y 1,441, % 619, % 276,644 6 % 200,190 4 % 2,251, % 4,790,288 YTD A v e r a g e 1, 38 3, ,154 1, 9 5 5, , , A g in g T r e n d A n a ly s is Cu r re n t O v e r Ju ly A u g u s t Se p te m b e r O c to b e r No v e m b e r De c e m b e r Ja n u a ry Fe b ru a r y M a rc h A p ril M a y Ju n e Ju ly


75 How is Medical Billing Like An EKG?


76
77 Entry Field Sample Medical Practice Billing Trend Analysis January November 2012 Monthly Charges, Collections and Adjustments Analysis Beginning Charges Collections Adjustments Ending AR Balance (% ending AR) (% Charges) (% Charges) AR Balance Jan , ,914 42% 296,488 58% Feb , ,186 42% 299,364 58% Mar , ,304 47% 291,578 53% Apr , ,034 44% 318,746 56% May , ,500 43% 280,166 57% Jun , ,192 41% 395,849 59% Jul , ,299 43% 341,085 57% Aug , ,181 43% 327,823 57% Sep , ,828 41% 347,236 59% Oct , ,809 44% 324,167 56% Nov , ,216 41% 254,313 59% Dec , ,597 40% 291,086 60% Jan , ,668 48% 240,000 52% Feb , ,217 51% 239,137 49% Mar , ,188 48% 296,887 52% Apr , ,409 46% 284,083 54% May ,695 88,824 42% 121,492 58% YTD Average 162,966 43% Jan-May To be entered manually 393, ,301 57% 700,000 Charges, Collections & Adjustments 650, ,000 Charges 550, , , , , , , , , ,000 50,000 0 Jan-12 Feb-12 Mar-12 Apr-12 May-12 Jun-12 Jul-12 Aug-12 Sep-12 Oct-12 Nov-12 Dec-12 Jan-13 Feb-13 Mar-13 Apr-13
78 Entry Field Sample Medical Practice Billing Trend Analysis January November 2012 Monthly Charges, Collections and Adjustments Analysis Beginning Charges Collections Adjustments Ending AR Balance (% ending AR) (% Charges) (% Charges) AR Balance Jan , ,914 42% 296,488 58% Feb , ,186 42% 299,364 58% Mar , ,304 47% 291,578 53% Apr , ,034 44% 318,746 56% May , ,500 43% 280,166 57% Jun , ,192 41% 395,849 59% Jul , ,299 43% 341,085 57% Aug , ,181 43% 327,823 57% Sep , ,828 41% 347,236 59% Oct , ,809 44% 324,167 56% Nov , ,216 41% 254,313 59% Dec , ,597 40% 291,086 60% Jan , ,668 48% 240,000 52% Feb , ,217 51% 239,137 49% Mar , ,188 48% 296,887 52% Apr , ,409 46% 284,083 54% May ,695 88,824 42% 121,492 58% YTD Average 162,966 43% 393, ,301 57% Jan-May To be entered manually 700, , , , , , , , , ,000 Charges, Collections & Adjustments Charges Monthly charges are trending downward. Why? 200, , ,000 50,000 0 Jan-12 Feb-12 Mar-12 Apr-12 May-12 Jun-12 Jul-12 Aug-12 Sep-12 Oct-12 Nov-12 Dec-12 Jan-13 Feb-13 Mar-13 Apr-13
79 Entry Field Sample Medical Practice Billing Trend Analysis January November 2012 Monthly Charges, Collections and Adjustments Analysis Beginning Charges Collections Adjustments Ending AR Balance (% ending AR) (% Charges) (% Charges) AR Balance Jan , ,914 42% 296,488 58% Feb , ,186 42% 299,364 58% Mar , ,304 47% 291,578 53% Apr , ,034 44% 318,746 56% May , ,500 43% 280,166 57% Jun , ,192 41% 395,849 59% Jul , ,299 43% 341,085 57% Aug , ,181 43% 327,823 57% Sep , ,828 41% 347,236 59% Oct , ,809 44% 324,167 56% Nov , ,216 41% 254,313 59% Dec , ,597 40% 291,086 60% Jan , ,668 48% 240,000 52% Feb , ,217 51% 239,137 49% Mar , ,188 48% 296,887 52% Apr , ,409 46% 284,083 54% May ,695 88,824 42% 121,492 58% YTD Average 162,966 43% 393, ,301 57% Jan-May To be entered manually 700, , , , , , , , , , , , ,000 Charges, Collections & Adjustments Charges Nice, direct relationship between Collections and Adjustments. 50,000 0 Jan-12 Feb-12 Mar-12 Apr-12 May-12 Jun-12 Jul-12 Aug-12 Sep-12 Oct-12 Nov-12 Dec-12 Jan-13 Feb-13 Mar-13 Apr-13
80 Entry Field Sample Medical Practice Billing Trend Analysis January November 2012 Monthly Charges, Collections and Adjustments Analysis Beginning Charges Collections Adjustments Ending AR Balance (% ending AR) (% Charges) (% Charges) AR Balance Jan , ,914 42% 296,488 58% Feb , ,186 42% 299,364 58% Mar , ,304 47% 291,578 53% Apr , ,034 44% 318,746 56% May , ,500 43% 280,166 57% Jun , ,192 41% 395,849 59% Jul , ,299 43% 341,085 57% Aug , ,181 43% 327,823 57% Sep , ,828 41% 347,236 59% Oct , ,809 44% 324,167 56% Nov , ,216 41% 254,313 59% Dec , ,597 40% 291,086 60% Jan , ,668 48% 240,000 52% Feb , ,217 51% 239,137 49% Mar , ,188 48% 296,887 52% Apr , ,409 46% 284,083 54% May ,695 88,824 42% 121,492 58% YTD Average 162,966 43% 393, ,301 57% Jan-May To be entered manually 700, , , , , , , , , , , , ,000 Charges, Collections & Adjustments Charges Adjustments spiked in December, but not Collections. Why? 50,000 0 Jan-12 Feb-12 Mar-12 Apr-12 May-12 Jun-12 Jul-12 Aug-12 Sep-12 Oct-12 Nov-12 Dec-12 Jan-13 Feb-13 Mar-13 Apr-13
81 Entry Field Sample Medical Practice Billing Trend Analysis January November 2012 Monthly Charges, Collections and Adjustments Analysis Beginning Charges Collections Adjustments Ending AR Balance (% ending AR) (% Charges) (% Charges) AR Balance Jan , ,914 42% 296,488 58% Feb , ,186 42% 299,364 58% Mar , ,304 47% 291,578 53% Apr , ,034 44% 318,746 56% May , ,500 43% 280,166 57% Jun , ,192 41% 395,849 59% Jul , ,299 43% 341,085 57% Aug , ,181 43% 327,823 57% Sep , ,828 41% 347,236 59% Oct , ,809 44% 324,167 56% Nov , ,216 41% 254,313 59% Dec , ,597 40% 291,086 60% Jan , ,668 48% 240,000 52% Feb , ,217 51% 239,137 49% Mar , ,188 48% 296,887 52% Apr , ,409 46% 284,083 54% May ,695 88,824 42% 121,492 58% YTD Average 162,966 43% 393, ,301 57% Jan-May To be entered manually 700, , , , , , , , , , , , ,000 Charges, Collections & Adjustments Charges Adjustments down, yet Collections going upward. Why? 50,000 0 Jan-12 Feb-12 Mar-12 Apr-12 May-12 Jun-12 Jul-12 Aug-12 Sep-12 Oct-12 Nov-12 Dec-12 Jan-13 Feb-13 Mar-13 Apr-13
82 Samp le Medica l P rac tice Acc o u n ts Receivab le A na lysis Ja n ua ry Decembe r Samp le P rac tice Monthly A/R Roll Analysis Begin ning A R Ba la nce C ha rges (% ending AR) C o llectio ns (% C ha rges) Adjus tme n ts (% C ha rges) E nding A R Ba la nce Jan Feb , % 1,104 30% 2,541 70% 110,380 Mar , ,471 62% 14,651 48% 16,118 52% 208,082 Apr , ,906 52% 43,686 43% 57,500 57% 222,801 M ay ,801 90,688 41% 43,449 47% 49,884 53% 220,156 Jun , ,101 77% 80,802 44% 102,271 56% 161,184 Jul , ,044 56% 29,795 40% 45,615 60% 192,818 Aug , ,463 52% 31,619 51% 30,750 49% 270,912 Sep , ,351 57% 61,019 32% 130,454 68% 185,790 Oct , ,535 78% 63,861 44% 80,798 56% 185,666 Nov , ,304 51% 29,476 43% 38,851 57% 238,643 Dec , ,620 74% 86,350 48% 92,391 52% 229,522 Jan-01 #DIV/0! 0 Feb-01 #DIV/0! 0 Mar-01 #DIV/0! 0 Apr-01 #DIV/0! 0 M ay-01 #DIV/0! 0 YTD A v e ra g e 44,165 43% 202, ,864 #DIV/0! 58,834 57% N u m b e r o f M o n th s R e p o rte d ,000 C h a rg e s, C o lle c tio n s & A d ju s tm e n ts 150,000 C ha rges 100,000 Adjus tme n ts 50,000 C o llectio ns 0 Jan-00 Feb-00 M ar-00 A pr-00 May-00 Jun-00 Jul-00 A ug-00 Sep-00 Oct-00 Nov-00 Dec-00 Jan-01 Feb-01 M ar-01 Apr-01 M ay-01
83 Samp le Medica l P rac tice Acco u n ts Receivab le A na lysis Jan ua r y Decembe r Samp le P ractice Monthly A/R Roll Analysis Begin ning A R Ba la nce C ha rges (% ending AR) C o llec tio ns (% C ha rges) Adjus tme n ts (% C ha rges) E nding A R Ba la nce Jan Feb , % 1,104 30% 2,541 70% 110,380 Mar , ,471 62% 14,651 48% 16,118 52% 208,082 Apr , ,906 52% 43,686 43% 57,500 57% 222,801 May ,801 90,688 41% 43,449 47% 49,884 53% 220,156 Jun , ,101 77% 80,802 44% 102,271 56% 161,184 Jul , ,044 56% 29,795 40% 45,615 60% 192,818 Aug , ,463 52% 31,619 51% 30,750 49% 270,912 Sep , ,351 57% 61,019 32% 130,454 68% 185,790 Oct , ,535 78% 63,861 44% 80,798 56% 185,666 Nov , ,304 51% 29,476 43% 38,851 57% 238,643 Dec , ,620 74% 86,350 48% 92,391 52% 229,522 Jan-01 #DIV /0! 0 Feb-01 #DIV /0! 0 Mar-01 #DIV /0! 0 Apr-01 #DIV /0! 0 May-01 #DIV /0! 0 YTD A v e ra g e 44,165 43% 202, ,864 #DIV /0! 58,834 57% N u m b e r o f M o n th s R e p o r te d ,000 C h a rg e s, C o lle c tio n s & A d ju s tm e n ts 150, ,000 C ha rges Adjus tme n ts Why did Adjustments spike but not Collections? 50,000 C o llectio ns 0 Jan-00 Feb-00 Mar-00 A pr-00 M ay-00 Jun-00 Jul-00 A ug-00 S ep-00 Oct-00 Nov-00 Dec-00 Jan-01 Feb-01 M ar-01 Apr-01 M ay-01
84 Sample Medical Practice Billing Analysis September September 2010 Fields for entry Aging Trend Analysis Over 120 Total Current Days Days Days Days A/R Jul-12 1,484,209 42% 495,012 14% 385,571 11% 194,705 5% 1,006,263 28% 3,565,760 Aug-12 1,837,462 54% 603,254 18% 250,428 7% 338,230 10% 376,326 11% 3,405,700 Sep-12 1,489,441 41% 963,246 27% 311,945 9% 193,210 5% 650,313 18% 3,608,155 Oct-12 1,459,773 38% 538,716 14% 756,766 20% 245,845 6% 805,766 21% 3,806,866 Nov-12 1,404,324 34% 714,720 17% 390,927 10% 663,007 16% 932,664 23% 4,105,642 Dec-12 1,523,656 36% 613,620 14% 455,550 11% 243,791 6% 1,439,285 34% 4,275,902 Jan-13 1,551,543 37% 428,460 10% 355,634 8% 400,725 10% 1,458,885 35% 4,195,247 Feb-13 1,348,229 33% 544,551 13% 249,850 6% 296,801 7% 1,673,079 41% 4,112,510 Mar-13 1,981,272 42% 576,913 12% 343,493 7% 154,448 3% 1,658,040 35% 4,714,166 Apr-13 1,576,355 32% 1,123,422 23% 348,644 7% 276,204 6% 1,589,595 32% 4,914,220 May-13 1,742,115 34% 673,517 13% 800,677 16% 313,612 6% 1,625,254 32% 5,155,175 Jun-13 1,485,659 31% 785,963 17% 421,585 9% 419,863 9% 1,638,526 34% 4,751,596 Jul-13 1,685,742 36% 596,852 13% 489,653 10% 348,562 7% 1,574,886 34% 4,695,695 YTD Average 1,582,291 38% 427,748 10% 1,263,760 29% Number of Months in Analysis 13 To be entered manually 666,019 16% 314,539 7% 4,254,356 6,000,000 Accounts Receivable Aging Trend Analysis 5,000,000 4,000,000 Current 3,000, ,000, ,000,000 Over Jul-12 Aug-12 Sep-12 Oct-12 Nov-12 Dec-12 Jan-13 Feb-13 Mar-13 Apr-13 May-13 Jun-13 Jul-13
85 Sample Medical Practice Billing Analysis September September 2010 Fields for entry Aging Trend Analysis Over 120 Total Current Days Days Days Days A/R Jul-12 1,484,209 42% 495,012 14% 385,571 11% 194,705 5% 1,006,263 28% 3,565,760 Aug-12 1,837,462 54% 603,254 18% 250,428 7% 338,230 10% 376,326 11% 3,405,700 Sep-12 1,489,441 41% 963,246 27% 311,945 9% 193,210 5% 650,313 18% 3,608,155 Oct-12 1,459,773 38% 538,716 14% 756,766 20% 245,845 6% 805,766 21% 3,806,866 Nov-12 1,404,324 34% 714,720 17% 390,927 10% 663,007 16% 932,664 23% 4,105,642 Dec-12 1,523,656 36% 613,620 14% 455,550 11% 243,791 6% 1,439,285 34% 4,275,902 Jan-13 1,551,543 37% 428,460 10% 355,634 8% 400,725 10% 1,458,885 35% 4,195,247 Feb-13 1,348,229 33% 544,551 13% 249,850 6% 296,801 7% 1,673,079 41% 4,112,510 Mar-13 1,981,272 42% 576,913 12% 343,493 7% 154,448 3% 1,658,040 35% 4,714,166 Apr-13 1,576,355 32% 1,123,422 23% 348,644 7% 276,204 6% 1,589,595 32% 4,914,220 May-13 1,742,115 34% 673,517 13% 800,677 16% 313,612 6% 1,625,254 32% 5,155,175 Jun-13 1,485,659 31% 785,963 17% 421,585 9% 419,863 9% 1,638,526 34% 4,751,596 Jul-13 1,685,742 36% 596,852 13% 489,653 10% 348,562 7% 1,574,886 34% 4,695,695 YTD Average 1,582,291 38% 427,748 10% 1,263,760 29% Number of Months in Analysis 13 To be entered manually 666,019 16% 314,539 7% 4,254,356 6,000,000 5,000,000 4,000,000 3,000,000 2,000,000 1,000,000 Accounts Receivable Aging Trend Analysis Current Over 120 Aging is getting bigger and bigger over time. Why? 0 Jul-12 Aug-12 Sep-12 Oct-12 Nov-12 Dec-12 Jan-13 Feb-13 Mar-13 Apr-13 May-13 Jun-13 Jul-13
86 Sample Medical Practice Billing Analysis September September 2010 Fields for entry Aging Trend Analysis Over 120 Total Current Days Days Days Days A/R Jul-12 1,484,209 42% 495,012 14% 385,571 11% 194,705 5% 1,006,263 28% 3,565,760 Aug-12 1,837,462 54% 603,254 18% 250,428 7% 338,230 10% 376,326 11% 3,405,700 Sep-12 1,489,441 41% 963,246 27% 311,945 9% 193,210 5% 650,313 18% 3,608,155 Oct-12 1,459,773 38% 538,716 14% 756,766 20% 245,845 6% 805,766 21% 3,806,866 Nov-12 1,404,324 34% 714,720 17% 390,927 10% 663,007 16% 932,664 23% 4,105,642 Dec-12 1,523,656 36% 613,620 14% 455,550 11% 243,791 6% 1,439,285 34% 4,275,902 Jan-13 1,551,543 37% 428,460 10% 355,634 8% 400,725 10% 1,458,885 35% 4,195,247 Feb-13 1,348,229 33% 544,551 13% 249,850 6% 296,801 7% 1,673,079 41% 4,112,510 Mar-13 1,981,272 42% 576,913 12% 343,493 7% 154,448 3% 1,658,040 35% 4,714,166 Apr-13 1,576,355 32% 1,123,422 23% 348,644 7% 276,204 6% 1,589,595 32% 4,914,220 May-13 1,742,115 34% 673,517 13% 800,677 16% 313,612 6% 1,625,254 32% 5,155,175 Jun-13 1,485,659 31% 785,963 17% 421,585 9% 419,863 9% 1,638,526 34% 4,751,596 Jul-13 1,685,742 36% 596,852 13% 489,653 10% 348,562 7% 1,574,886 34% 4,695,695 YTD Average 1,582,291 38% 427,748 10% 1,263,760 29% Number of Months in Analysis 13 To be entered manually 666,019 16% 314,539 7% 4,254,356 6,000,000 5,000,000 4,000,000 3,000,000 2,000,000 Accounts Receivable Aging Trend Analysis Current Nice monthly trend for the most recent (current) receivables. 1,000,000 Over Jul-12 Aug-12 Sep-12 Oct-12 Nov-12 Dec-12 Jan-13 Feb-13 Mar-13 Apr-13 May-13 Jun-13 Jul-13
87 Sample Medical Practice Billing Analysis September September 2010 Fields for entry Aging Trend Analysis Over 120 Total Current Days Days Days Days A/R Jul-12 1,484,209 42% 495,012 14% 385,571 11% 194,705 5% 1,006,263 28% 3,565,760 Aug-12 1,837,462 54% 603,254 18% 250,428 7% 338,230 10% 376,326 11% 3,405,700 Sep-12 1,489,441 41% 963,246 27% 311,945 9% 193,210 5% 650,313 18% 3,608,155 Oct-12 1,459,773 38% 538,716 14% 756,766 20% 245,845 6% 805,766 21% 3,806,866 Nov-12 1,404,324 34% 714,720 17% 390,927 10% 663,007 16% 932,664 23% 4,105,642 Dec-12 1,523,656 36% 613,620 14% 455,550 11% 243,791 6% 1,439,285 34% 4,275,902 Jan-13 1,551,543 37% 428,460 10% 355,634 8% 400,725 10% 1,458,885 35% 4,195,247 Feb-13 1,348,229 33% 544,551 13% 249,850 6% 296,801 7% 1,673,079 41% 4,112,510 Mar-13 1,981,272 42% 576,913 12% 343,493 7% 154,448 3% 1,658,040 35% 4,714,166 Apr-13 1,576,355 32% 1,123,422 23% 348,644 7% 276,204 6% 1,589,595 32% 4,914,220 May-13 1,742,115 34% 673,517 13% 800,677 16% 313,612 6% 1,625,254 32% 5,155,175 Jun-13 1,485,659 31% 785,963 17% 421,585 9% 419,863 9% 1,638,526 34% 4,751,596 Jul-13 1,685,742 36% 596,852 13% 489,653 10% 348,562 7% 1,574,886 34% 4,695,695 YTD Average 1,582,291 38% 427,748 10% 1,263,760 29% Number of Months in Analysis 13 To be entered manually 666,019 16% 314,539 7% 4,254,356 6,000,000 5,000,000 4,000,000 3,000,000 2,000,000 1,000,000 Accounts Receivable Aging Trend Analysis Current Over 120 Good distribution of the receivables, with the most recent the largest portion. 0 Jul-12 Aug-12 Sep-12 Oct-12 Nov-12 Dec-12 Jan-13 Feb-13 Mar-13 Apr-13 May-13 Jun-13 Jul-13
88 Sample Medical Practice Billing Analysis September September 2010 Fields for entry Aging Trend Analysis Over 120 Total Current Days Days Days Days A/R Jul-12 1,484,209 42% 495,012 14% 385,571 11% 194,705 5% 1,006,263 28% 3,565,760 Aug-12 1,837,462 54% 603,254 18% 250,428 7% 338,230 10% 376,326 11% 3,405,700 Sep-12 1,489,441 41% 963,246 27% 311,945 9% 193,210 5% 650,313 18% 3,608,155 Oct-12 1,459,773 38% 538,716 14% 756,766 20% 245,845 6% 805,766 21% 3,806,866 Nov-12 1,404,324 34% 714,720 17% 390,927 10% 663,007 16% 932,664 23% 4,105,642 Dec-12 1,523,656 36% 613,620 14% 455,550 11% 243,791 6% 1,439,285 34% 4,275,902 Jan-13 1,551,543 37% 428,460 10% 355,634 8% 400,725 10% 1,458,885 35% 4,195,247 Feb-13 1,348,229 33% 544,551 13% 249,850 6% 296,801 7% 1,673,079 41% 4,112,510 Mar-13 1,981,272 42% 576,913 12% 343,493 7% 154,448 3% 1,658,040 35% 4,714,166 Apr-13 1,576,355 32% 1,123,422 23% 348,644 7% 276,204 6% 1,589,595 32% 4,914,220 May-13 1,742,115 34% 673,517 13% 800,677 16% 313,612 6% 1,625,254 32% 5,155,175 Jun-13 1,485,659 31% 785,963 17% 421,585 9% 419,863 9% 1,638,526 34% 4,751,596 Jul-13 1,685,742 36% 596,852 13% 489,653 10% 348,562 7% 1,574,886 34% 4,695,695 YTD Average 1,582,291 38% 427,748 10% 1,263,760 29% Number of Months in Analysis 13 To be entered manually 666,019 16% 314,539 7% 4,254,356 Accounts Receivable Aging Trend Analysis 6,000,000 5,000,000 4,000,000 Current 3,000, ,000, ,000,000 Over Jul-12 Aug-12 Sep-12 Oct-12 Nov-12 Dec-12 Jan-13 Feb-13 Mar-13 Apr-13 May-13 Jun-13 Jul-13 Oldest unpaid accounts are becoming large portion of the receivables. Why?

89 Weekly Summary Flash Reports Cash (Bank) Balances / Lines of Credit Balances Receivables: Insurance / Private / Credit Balances Charges, Collections, Adjustments Major Payables (Bills Due)
 Accounts Receivable credit balances Upcoming Payroll Supporting reports from")
90 Management Reports Monthly Summary Cash Balances Line of credit balances Accounts Receivable Aging Charges, Collections, Adjustments Major Unpaid Payables (Bills Due) Accounts Receivable credit balances Upcoming Payroll Supporting reports from billing system

91 Key Financial Indicators Cash Balances & Lines of Credit Accounts Receivables / Aging Charges Collections
92 3 Step Approach to Fraud: I. Prevent fraudfrom occurring II. Detect itas soon as possible III. Obtain adequateinsurance coverage - employee dishonesty or employee crime.
93 Patient Refunds Who prepares the requests? What is required to support each refund request? Who reviews the refunds? What account are refunds paid?
94 Product Sales & Cosmetic Procedures (Dermatology, Veins, Hair Removal ) What controls can be implemented for these retail areas?

95 Supplies For patients use only? Tracked? Access restricted to those authorized How are these safeguarded?

96 On-Line Banking? What are the controls? Where will you find the evidence?

97 On-Line Banking? How about now?

98 On-Line Banking? How about now?

99 Cash Disbursements Who writes the checks? Who signs the checks? Who reviews the bank statement? How secure is your check information?

100 Employee Expense Reimbursements What are your policies? Do you require original supporting receipts? Who reviews it? How can you be fooled?

101 CompensationStructure How do your employees get paid? How do your physicians and other providers get paid?


102 Payroll Who handles your payroll processing? Who reviews it? Who is on your payroll? Net versus Gross

103 Time Tracking How are employees paid? How do you track their days and time worked? Where are the weaknesses?


104 Fixed Assets Business use only? Tracked and monitored? What s on the hard drives?
105 In Summary: Know your employees Evaluate vulnerabilities to outsiders Evaluate vulnerabilities to employees Consider having an outside review of your internal controls and procedures Remain vigilant!


106


107 Fraud-Related Writing: Coming Early 20?? Preventing/Detecting Employee Theft and Embezzlement within a Medical Practice MGMA


108 Piecing Together Financial Puzzles Stephen Pedneault, CPA/CFF, CFE Forensic Accounting Services, LLC 2389 Main Street Glastonbury, CT Piecing Together Financial Puzzlestm
109 Physician s Computer Company PCC 2014 Users Conference Safeguarding Your Practice's Fiscal Health (from undetected fraud scheme) Questions / Discussion forensic accounting services, LLC 2389 main street glastonbury, ct (860) steve@fasman.com stephen a. pedneault
Business & Financial Services December 2017
 Business & Financial Services December 217 Completed Procurement Transactions by Month 2 4 175 15 125 1 75 5 2 1 Business Days to Complete 25 Jan Feb Mar Apr May Jun Jul Aug Sep Oct Nov Dec 217 Procurement
XML Publisher Balance Sheet Vision Operations (USA) Feb-02
 Feb-02") Page:1 Apr-01 May-01 Jun-01 Jul-01 ASSETS Current Assets Cash and Short Term Investments 15,862,304 51,998,607 9,198,226 Accounts Receivable - Net of Allowance 2,560,786
Page:1 Apr-01 May-01 Jun-01 Jul-01 ASSETS Current Assets Cash and Short Term Investments 15,862,304 51,998,607 9,198,226 Accounts Receivable - Net of Allowance 2,560,786
Management Reports. June for PREPARED BY POWERED BY
 Management Reports for June 217 PREPARED BY POWERED BY Contents 1. Management Reports Cashflow Forecast Actual vs Budget P&L Forecast Where Did Our Money Go? Net Worth 2. Understanding your Reports 3.
CORPORATE PERFORMANCE DASHBOARD. August 2010
 Quality care for you, with you CORPORATE PERFORMANCE DASHBOARD August 21 Approved by the Board of Directors on 3 th September 21 1 CONTENT: Page Introduction 3 Targets: 1 st OP Appointment 4 Diagnostic
Factor Leave Accruals. Accruing Vacation and Sick Leave
 Factor Leave Accruals Accruing Vacation and Sick Leave Factor Leave Accruals As part of the transition of non-exempt employees to biweekly pay, the UC Office of the President also requires standardization
QUARTERLY FINANCIAL REPORT June 30, 2017
 California Independent System Operator QUARTERLY FINANCIAL REPORT June 30, 2017 250 Outcropping Way Folsom, CA 95630 (916) 351-4000 CALIFORNIA INDEPENDENT SYSTEM OPERATOR CORPORATION QUARTERLY FINANCIAL
FOR RELEASE: MONDAY, MARCH 21 AT 4 PM
 Interviews with 1,012 adult Americans conducted by telephone by Opinion Research Corporation on March 18-20, 2011. The margin of sampling error for results based on the total sample is plus or minus 3
Understanding Benchmarking for Healthcare Organizations
 Understanding Benchmarking for Healthcare Organizations Melissa M. Meeker, CPA MSA, Accounting, Franklin University Tina R. Wright, CPA, CHBC BSBA, Accounting, The Ohio State University Benchmarking Basics
Financial Statements. Kit Carson County Health Service District. October 2018
 Financial Statements Kit Carson County Health Service District Kit Carson County Health Service District Rooted in excellence. Growing in trust. FINANCIAL STATEMENT SUMMARY Income Statement Summary Kit
QUARTERLY FINANCIAL REPORT December 31, 2017
 California Independent System Operator QUARTERLY FINANCIAL REPORT December 31, 2017 Preliminary and Unaudited 250 Outcropping Way Folsom, CA 95630 (916) 351-4000 CALIFORNIA INDEPENDENT SYSTEM OPERATOR
Current Employment Statistics
 Current Employment Statistics October 2017 If you have any questions or seek additional information, please contact: Vermont Department of Labor Economic and Labor Market Information Division 802-828-4202
Membership Report November 2018
 Membership Report November 2018 Agenda Financial Commentary 2018 Budget/Actual Net Income Actual/Budget Variance Total Managed Assets On- & Off-Balance Sheet Liquidity Commentary Historical Member Overnight
Mechanics of Cash Flow Forecasting
 Texas Association Of State Senior College & University Business Officers July 13, 2015 Mechanics of Cash Flow Forecasting Susan K. Anderson, CEO Anderson Financial Management, L.L.C. 130 Pecan Creek Drive
QUARTERLY FINANCIAL REPORT March 31, 2018
 California Independent System Operator QUARTERLY FINANCIAL REPORT March 31, 2018 250 Outcropping Way Folsom, CA 95630 (916) 351-4000 CALIFORNIA INDEPENDENT SYSTEM OPERATOR CORPORATION QUARTERLY FINANCIAL
Paul D. Vanchiere, MBA
 Paul D. Vanchiere, MBA Theft-Proof Your Practice PEDIATRIC MANAGEMENT INSTITUTE Disclosures Pediatric Management Institute Consulting services for Pediatric Practices PhysicianIntelligence.com Business
Review of Registered Charites Compliance Rates with Annual Reporting Requirements 2016
 Review of Registered Charites Compliance Rates with Annual Reporting Requirements 2016 October 2017 The Charities Regulator, in accordance with the provisions of section 14 of the Charities Act 2009, carried
To Receive CPE Credit
 Fraud Prevention Strategies for Financial Institutions: A Forensic Accountant s Top 20 List Presenter Photo Angela Morelock Partner amorelock@bkd.com 417.865.8701 August 15, 2013 To Receive CPE Credit
Credit Suisse Swiss Pension Fund Index Q3 2015
 Credit Suisse Swiss Pension Fund Index Q3 2015 YTD 2015: 1.47% Q3 2015: 1.31% Return on the Credit Suisse Pension Fund Index continues to fall, despite good July performance Annualized returns fall, while
Current Employment Statistics
 Current Employment Statistics December 2017 If you have any questions or seek additional information, please contact: Vermont Department of Labor Economic and Labor Market Information Division 802-828-4202
QUESTION 2. QUESTION 3 Which one of the following is most indicative of a flexible short-term financial policy?
 QUESTION 1 Compute the cash cycle based on the following information: Average Collection Period = 47 Accounts Payable Period = 40 Average Age of Inventory = 55 QUESTION 2 Jan 41,700 July 39,182 Feb 18,921
HIPIOWA - IOWA COMPREHENSIVE HEALTH ASSOCIATION Unaudited Balance Sheet As of July 31
 Unaudited Balance Sheet As of July 31 Total Enrollment: 407 Assets: Cash $ 9,541,661 $ 1,237,950 Invested Cash 781,689 8,630,624 Premiums Receivable 16,445 299,134 Prepaid 32,930 34,403 Assessments Receivable
Spheria Australian Smaller Companies Fund
 29-Jun-18 $ 2.7686 $ 2.7603 $ 2.7520 28-Jun-18 $ 2.7764 $ 2.7681 $ 2.7598 27-Jun-18 $ 2.7804 $ 2.7721 $ 2.7638 26-Jun-18 $ 2.7857 $ 2.7774 $ 2.7690 25-Jun-18 $ 2.7931 $ 2.7848 $ 2.7764 22-Jun-18 $ 2.7771
HIPIOWA - IOWA COMPREHENSIVE HEALTH ASSOCIATION Unaudited Balance Sheet As of January 31
 Unaudited Balance Sheet As of January 31 Total Enrollment: 371 Assets: Cash $ 1,408,868 $ 1,375,117 Invested Cash 4,664,286 4,136,167 Premiums Receivable 94,152 91,261 Prepaid 32,270 33,421 Assessments
Employers Compliance with the Health Insurance Act ANNUAL REPORT. Bermuda. Health Council
 Employers Compliance with the Health Insurance Act 1970 2016 ANNUAL REPORT Bermuda ea Health Council Employers Compliance with the Health Insurance Act 1970 2016 Annual Report Contact us: If you would
2009 Reassessment As Impacted by Senate Bill 711
 Saint Louis County 2009 Reassessment As Impacted by Senate Bill 711 Impacts of SB711 on the 2009 Reassessment Plan The County must notify property owners of changes in the projected tax liability resulting
Fiscal Year 2018 Project 1 Annual Budget
 Fiscal Year 2018 Project 1 Annual Budget Table of Contents Table Page Summary 3 Summary of Costs Table 1 4 Treasury Related Expenses Table 2 5 Summary of Full Time Equivalent Table 3 6 Positions Cost-to-Cash
Organization. 4 Health Texas Senior Centers. VP, Internal Audit Team of 11 Auditors
 Organization Regional Non-Profit Acute Care Hospital System 26 Owned/Operated/Ventured/Affiliated Hospitals 21 Joint Ventured Ambulatory Surgical Centers 41 Satellite Outpatient Facilities 136 Health Texas
Financial & Business Highlights For the Year Ended June 30, 2017
 Financial & Business Highlights For the Year Ended June, 17 17 16 15 14 13 12 Profit and Loss Account Operating Revenue 858 590 648 415 172 174 Investment gains net 5 162 909 825 322 516 Other 262 146
HUD NSP-1 Reporting Apr 2010 Grantee Report - New Mexico State Program
 HUD NSP-1 Reporting Apr 2010 Grantee Report - State Program State Program NSP-1 Grant Amount is $19,600,000 $9,355,381 (47.7%) has been committed $4,010,874 (20.5%) has been expended Grant Number HUD Region
Asset Manager Performance Comparison
 Cape Peninsula University of Technology Retirement Fund August 2017 DISCLAIMER AND WARNINGS: Towers Watson (Pty) Ltd, a Willis Towers Watson company, is an authorised financial services provider. Although
Asset Manager Performance Comparison
 Cape Peninsula University of Technology Retirement Fund September 2017 DISCLAIMER AND WARNINGS: Towers Watson (Pty) Ltd, a Willis Towers Watson company, is an authorised financial services provider. Although
Quarterly Performance Report
 w e a l t h Quarterly Performance Report Client Name Executive Summary REVENUE Revenue (Last quarter $381,226) Positive trend upwards. PROFITABILITY Profitability Ratio 9.83% (Last quarter 30%) Negative
Membership Report September 2018
 Membership Report September 2018 Agenda Financial Commentary 2018 Budget/Actual Net Income Actual/Budget Variance Total Managed Assets On- & Off-Balance Sheet Liquidity Commentary Historical Member Overnight
WESTWOOD LUTHERAN CHURCH Summary Financial Statement YEAR TO DATE - February 28, Over(Under) Budget WECC Fund Actual Budget
 Budget WECC Fund Actual Budget") WESTWOOD LUTHERAN CHURCH Summary Financial Statement YEAR TO DATE - February 28, 2018 General Fund Actual A B C D E F WECC Fund Actual Revenue Revenue - Faith Giving 1 $ 213 $ 234 $ (22) - Tuition $ 226
WESTWOOD LUTHERAN CHURCH Summary Financial Statement YEAR TO DATE - February 28, 2018 General Fund Actual A B C D E F WECC Fund Actual Revenue Revenue - Faith Giving 1 $ 213 $ 234 $ (22) - Tuition $ 226
TERMS OF REFERENCE FOR THE INVESTMENT COMMITTEE
 I. PURPOSE The purpose of the Investment Committee (the Committee ) is to recommend to the Board the investment policy, including the asset mix policy and the appropriate benchmark for both ICBC and any
Healthy Michigan Plan signing, September 2013
 Healthy Michigan Plan signing, September 2013 Richard Hirth, Ph.D. Professor & Chair Department of Health Management & Policy National Significance of Michigan Medicaid Expansion Model for compromise as
IMPROVING THE FINANCIAL HEALTH OF YOUR PRACTICE. D e b b i e R i c c i a n d D o n n a R u s s o
 IMPROVING THE FINANCIAL HEALTH OF YOUR PRACTICE D e b b i e R i c c i a n d D o n n a R u s s o Please silence or turn off all electronic devices at this time. THANK YOU Agenda Key Performance Indicators
LOUISVILLE GAS AND ELECTRIC COMPANY Gas Rates 2018 Monthly Billing Adjustments
 2018 Monthly Billing Adjustments GAS LINE TRACKER CHARGES GAS LINE TRACKER CHARGES DSM (2) PER MONTH PER METER PER MONTH PER CCF TAX CUTS AND JOBS ACT $ Per CCF Firm Trans. SURCREDIT ($ per ccf) (3) GAS
Common stock prices 1. New York Stock Exchange indexes (Dec. 31,1965=50)2. Transportation. Utility 3. Finance
2. Transportation. Utility 3. Finance") Digitized for FRASER http://fraser.stlouisfed.org/ Federal Reserve Bank of St. Louis 000 97 98 99 I90 9 9 9 9 9 9 97 98 99 970 97 97 ""..".'..'.."... 97 97 97 97 977 978 979 980 98 98 98 98 98 98 987 988
Digitized for FRASER http://fraser.stlouisfed.org/ Federal Reserve Bank of St. Louis 000 97 98 99 I90 9 9 9 9 9 9 97 98 99 970 97 97 ""..".'..'.."... 97 97 97 97 977 978 979 980 98 98 98 98 98 98 987 988
NR614: Foundations of Health Care Economics, Accounting and Financial Management
 NR614: Foundations of Health Care Economics, Accounting and Financial Management WEEK 7: Budgeting SLIDE 1: Week 7: Week Seven Sample Problem: Budgeting... There is one sample problem provided in week
Division of Bond Finance Interest Rate Calculations. Revenue Estimating Conference Interest Rates Used for Appropriations, including PECO Bond Rates
 Division of Bond Finance Interest Rate Calculations Revenue Estimating Conference Interest Rates Used for Appropriations, including PECO Bond Rates November 16, 2018 Division of Bond Finance Calculation
INCREASING INVESTIGATOR EFFICIENCY USING NETWORK ANALYTICS
 INCREASING INVESTIGATOR EFFICIENCY USING NETWORK ANALYTICS ACFE ANNUAL CONFERENCE ORLANDO, FL JUNE 20, 2012 DAN BARTA CPA, CFE DAVID STEWART CAMS Fraud & Financial Crimes Practice TOPICS INCREASING INVESTIGATOR
The Financial Reporting Checklists Every Firm should be Doing
 The Financial Reporting Checklists Every Firm should be Doing Presented by Rebecca Kelley, CPA Maggie Kennedy, CPA FM34 4/5/2017 3:00 PM - 4:15 PM The handouts and presentations attached are copyright
ICO Market Report December December Unlock your Crypto Potential. 1 P a g e
 December 2018 Unlock your Crypto Potential 1 P a g e Contents DISCLAIMER 3 ICO MARKET STATS (DECEMBER 18) 4 HARD CAP/SOFT CAP INFO 5 NOVEMBER VS DECEMBER STATISTICS 6 TOP 5 ICOS (DECEMBER 18) 7 AMOUNT
11 May Report.xls Office of Budget & Fiscal Planning
 Education and General Fund Actual Revenues and s by Month MTD YTD Change Revenue Jul Aug Sep Oct Nov Dec Jan Feb Mar Apr May Jun Per 14 Total over FY06 Enrollment Fees $ 8,211 $ 219 $ 41,952 ($ 818) $
Voya Indexed Universal Life-Protector
 calculation examples Values as of 07/28/2018 Voya ed Universal Life-Protector Issued by Security Life of Denver Insurance Company Required training! VFA Registered Representatives must review the Required
Exchange Rate Requirements
 C APPENDIX Foreign Currency Financial Reporting from Euro to Yen to Yuan: A Guide to Fundamental Concepts and Practical Applications By Robert Rowanc Copyright 2011 by SAS Institute, Inc. Exchange Rate
REAL EARNINGS DECEMBER 2018
 Transmission of material in this release is embargoed until 8:30 a.m. (EST), Friday, January 11, 2019 USDL-19-0019 Technical Information: (202) 691-6555 cesinfo@bls.gov www.bls.gov/ces Media Contact: (202)
Isle Of Wight half year business confidence report
 half year business confidence report half year report contents new company registrations closed companies (dissolved) net company growth uk company share director age director gender naming trends sic
Employee Dishonesty Lessons Learned: Internal Controls
 Employee Dishonesty Lessons Learned: Internal Controls Presented by: Doug Roossien, CRM, CFE Business Protection Risk Management CUNA Mutual Group CUNA Mutual Group Proprietary Reproduction, Adaptation
Financial Exploitation Investigations Protocols for APS. State Perspective: PA s Aging Population
 Financial Exploitation Investigations Protocols for APS National Adult Protective Services Association Conference 2013 Denise Getgen, RN, Pennsylvania Department of Aging Linda Mill, CFE, Temple University
Credit Suisse Swiss Pension Fund Index Q2 2017
 Credit Suisse Swiss Pension Fund Index Q2 217 YTD 217: 3.94% Q2 217: 1.15% Positive second quarter, with slowdown in June Significant positive contribution from Swiss equities in reporting quarter Sharp
9/15/2017. RSA ESS vs Harris School Solutions ESS
 RSA Reporting NextGen RSA ESS vs Harris School Solutions ESS RSA ESS Employer Self Service a portal that will be used by districts to submit RSA enrollment and contribution files as well as make online
Using Computers to Adapt to Changing Markets
 Using Computers to Adapt to Changing Markets By Dr. Robert C. Smithson Anava Capital Management LLC Cupertino, CA 408-918-9333 Please Note: Individual companies shown or discussed in this presentation
Second Quarter 2016 Earnings Presentation. July 29, 2016
 Second Quarter 2016 Earnings Presentation July 29, 2016 Agenda Strategic Review Financial Review Questions and Answers Edward Tilly Chief Executive Officer Alan Dean Executive Vice President, CFO and Treasurer
Balance Sheet - Consolidated August 31, 2018
 1 ASSETS Current Assets - Funds Total Operating Total KVFD Reserve Total Restricted Total Capital Reserve Total Snow Removal Reserve Total COP Reserve Fund Total Current Assets - Funds Current Assets -
Beginning Date: January 2016 End Date: June Managers in Zephyr: Benchmark: Morningstar Short-Term Bond
 Beginning Date: January 2016 End Date: June 2018 Managers in Zephyr: Benchmark: Manager Performance January 2016 - June 2018 (Single Computation) 11200 11000 10800 10600 10400 10200 10000 9800 Dec 2015
SURVEY OF BUSINESSES INFLATION EXPECTATIONS JULY 2018 RESEARCH SERVICES DEPARTMENT RESEARCH AND ECONOMIC PROGRAMMING DIVISION
 SURVEY OF BUSINESSES INFLATION EXPECTATIONS JULY 2018 RESEARCH SERVICES DEPARTMENT RESEARCH AND ECONOMIC PROGRAMMING DIVISION Jul-15 Nov-15 Jan-16 Mar-16 Jul-16 Nov-16 Jan-17 Jan-18 Annual point to point
Questions to Consider When You Implement Oracle Assets
 Questions to Consider When You Implement Oracle Assets Cindy Cline Cline Consulting and Training Solutions, LLC During the implementation of Oracle Assets, several issues will arise and numerous decisions
Foundations of Investing
 www.edwardjones.com Member SIPC Foundations of Investing 1 5 HOW CAN I STAY ON TRACK? 4 HOW DO I GET THERE? 1 WHERE AM I TODAY? MY FINANCIAL NEEDS 3 CAN I GET THERE? 2 WHERE WOULD I LIKE TO BE? 2 Develop
SURVEY OF BUSINESSES INFLATION EXPECTATIONS JULY 2017 RESEARCH SERVICES DEPARTMENT RESEARCH AND ECONOMIC PROGRAMMING DIVISION
 SURVEY OF BUSINESSES INFLATION EXPECTATIONS JULY 217 RESEARCH SERVICES DEPARTMENT RESEARCH AND ECONOMIC PROGRAMMING DIVISION The Statistical Institute of Jamaica (STATIN) undertakes surveys of businesses
Its Not About If, Its About When! Learning how to protect your organization.
 Learning how to protect your organization. Presentation Overview Summary off FFraud S d St Statistics ti ti Definitions of Fraud How and Why Fraud Happens Fraud Prevention and Deterrence Steps to Reducing
Effective Revenue Cycles Are No Accident
 Effective Revenue Cycles Are No Accident Physician Leadership Institute March 7,2015 Jerrie K. Weith, MBA, FHFMA, CMPE, CMOM Learning Objectives Characteristics of Best Performers Efficient Encounters
What do they investigate
 What is Forensic Accounting & What do they investigate Presented by: Doug Cash MBA, CFE, CFI, CFCI Manager Forensic Accounting & Investigative Services Specialization i What is Forensic Accounting? What
Beginning Date: January 2016 End Date: September Managers in Zephyr: Benchmark: Morningstar Short-Term Bond
 Beginning Date: January 2016 End Date: September 2018 Managers in Zephyr: Benchmark: Manager Performance January 2016 - September 2018 (Single Computation) 11400 - Yorktown Funds 11200 11000 10800 10600
Economic Activity Index ( GDB-EAI ) For the month of May 2013 G O V E R N M E N T D E V E L O P M E N T B A N K F O R P U E R T O R I C O
 For the month of May 2013 G O V E R N M E N T D E V E L O P M E N T B A N K F O R P U E R T O R I C O") Economic Activity Index ( GDB-EAI ) For the month of May 2013 General Commentary May 2013 GDB-EAI for the month of May registered a 3.4% year-over-year ( YOY ) reduction May 2013 EAI was 126.7, a 3.4%
Economic Activity Index ( GDB-EAI ) For the month of May 2013 General Commentary May 2013 GDB-EAI for the month of May registered a 3.4% year-over-year ( YOY ) reduction May 2013 EAI was 126.7, a 3.4%
Credit Suisse Swiss Pension Fund Index Q1 2017
 Credit Suisse Swiss Pension Fund Index Q1 217 YTD 217: 2.76% Q1 217: 2.76% Credit Suisse Pension Fund Index starts year at all-time high Allocation to foreign equities at all-time high; allocation to Swiss
Survey of Businesses Inflation Expectations. September 2018 RESEARCH SERVICES DEPARTMENT RESEARCH AND ECONOMIC PROGRAMMING DIVISION
 Survey of Businesses Inflation Expectations September 2018 RESEARCH SERVICES DEPARTMENT RESEARCH AND ECONOMIC PROGRAMMING DIVISION The Statistical Institute of Jamaica (STATIN) undertakes surveys of businesses
Arkansas Works Overview. Work And Community Engagement Requirement
 1 Arkansas Works Overview Work And Community Engagement Requirement Arkansas Works Populations & Work and Community Engagement Requirement 2 Arkansas Works enrollees will fall into three categories for
Big Walnut Local School District
 Big Walnut Local School District Monthly Financial Report for the month ended September 30, 2013 Prepared By: Felicia Drummey Treasurer BIG WALNUT LOCAL SCHOOL DISTRICT SUMMARY OF YEAR TO DATE FINANCIAL
Survey of Businesses Inflation Expectations. December 2018 RESEARCH SERVICES DEPARTMENT RESEARCH AND ECONOMIC PROGRAMMING DIVISION
 Survey of Businesses Inflation Expectations December 2018 RESEARCH SERVICES DEPARTMENT RESEARCH AND ECONOMIC PROGRAMMING DIVISION The Statistical Institute of Jamaica (STATIN) undertakes surveys of businesses
EFFECTIVE REVENUE CYCLE MANAGEMENT IN YOUR NETWORK
 EFFECTIVE REVENUE CYCLE MANAGEMENT IN YOUR NETWORK 1 INTRODUCTION Revenue Cycle Management has become an even more complex issue with declining reimbursements, implementation of Electronic Health Records,
Describe Fraud in the Context of Financial
 Misappropriation of Assets and Fraudulent Financial Reporting Loscalzo s September 24, 2014 2012 Template for PowerPoint Slides A SmartPros Ltd. Company www.loscalzo.com (732) 741 1600 1 CPE Instructions
FOR RELEASE: MONDAY, JANUARY 11 AT NOON
 Interviews with 1,021 adult Americans, including 955 registered voters, conducted by telephone by Opinion Research Corporation on January 8-10,. The margin of sampling error for results based on the total
General Fund Revenue
 Millions Percent of Kathy Steinert, Director of Fiscal Services Phone: 541.923.8927 145 SE Salmon Ave Redmond, OR 97756 kathy.steinert@redmond.k12.or.us Date: May 23, 2014 To: Redmond School District Board
Status of the Unemployment Trust Fund and Related Issues. Commission on Unemployment Compensation. Ellen Marie Hess, Commissioner.
 Status of the Unemployment Trust Fund and Related Issues Commission on Unemployment Compensation August 8, 2018 Ellen Marie Hess, Commissioner 2 Trust Fund Data Standard Forecast (Millions of Dollars)
BANK OF GUYANA. BANKING SYSTEM STATISTICAL ABSTRACT Website:
 BANK OF GUYANA BANKING SYSTEM STATISTICAL ABSTRACT Website: www.bankofguyana.org.gy RESEARCH DEPARTMENT November 2010 STATISTICAL ABSTRACT TABLES CONTENTS 1. MONETARY AUTHORITY 1.1 Bank of Guyana: Assets
ADDENDUM NO. 4 REQUEST FOR PROPOSAL NO. R BANKING AND MERCHANT SERVICES FOR HIGHER EDUCATION
 Attention to Proposers: This constitutes Addendum No. 4 to the referenced Request for Proposals (RFP), and consists of: This eight (8) page cover letter, which provides responses to questions raised by
Full file at CHAPTER 3
 CHAPTER 3 Adjusting the Accounts ASSIGNMENT CLASSIFICATION TABLE Study Objectives Questions Brief Exercises Exercises A Problems B Problems *1. Explain the time period assumption. 1, 2 *2. Explain the
EMBARGOED FOR RELEASE: Thursday, March 19 at 6:00 a.m. ET
 Interviews with 1,009 adult Americans conducted by telephone by ORC International on March 13-15, 2015. The margin of sampling error for results based on the total sample is plus or minus 3 percentage
Big Walnut Local School District
 Big Walnut Local School District Monthly Financial Report for the month ended September 30, 2012 Prepared By: Felicia Drummey Treasurer BIG WALNUT LOCAL SCHOOL DISTRICT SUMMARY OF YEAR-TO-DATE FINANCIAL
Financial Year End Procedures 2012/13
 1. Introduction The University's financial year ends on the 31st July. Each year the Finance Office must publish a set of audited accounts for the whole University which give a true and fair view of the
NH Community Behavioral Health Association Workforce Challenges and Opportunities
 NH Community Behavioral Health Association Workforce Challenges and Opportunities January 10, 2018 Prepared by Patrick Miller, Founder and Principal Pero Consulting Group, LLC 1 Topics of Discussion 1.
Fraud & Forensic Accounting Update for CPAs
 Fraud & Forensic Accounting Update for CPAs Presented by: Brett A. Johnson CPA/CFF, CFE, CFI Forensic Accounting Manager Background Eide Bailly LLP Top 25 CPA firm in the nation (Est. 1917) More than 49,000
Inflation Education. September Spear Street, Suite 950 San Francisco, CA Phone:
 Inflation Education September 2014 150 Spear Street, Suite 950 San Francisco, CA 94105 Phone: 866-627-6984 DISCLAIMER The charts in this presentation are for illustrative purposes only. Individual clients
Reduce Your Risk: Understanding Internal Controls and Fraud Risks and Prevention
 Reduce Your Risk: Understanding Internal Controls and Fraud Risks and Prevention Michigan Municipal Treasurers Association June 16, 2017 Scott Sternhagen, CPA Manager Ryan Ritchay, CPA, CFE Senior Accountant
Second Quarter 2013 Earnings Presentation. August 2, 2013
 Second Quarter 2013 Earnings Presentation August 2, 2013 Agenda Strategic Review Financial Review Questions and Answers Edward Tilly Chief Executive Officer Alan Dean Executive Vice President, CFO and
R o l l i n g F o r e c a s t i n g :
 R o l l i n g F o r e c a s t i n g : A S t r a t e g y f o r E f f e c t i v e F i n a n c i a l M a n a g e m e n t Debra Miller Vice President Client Success January 22, 2016 Discussion Topics Overview
REAL EARNINGS AUGUST 2018
 Transmission of material in this release is embargoed until 8:30 a.m. (EDT), Thursday, September 13, 2018 USDL-18-1454 Technical Information: (202) 691-6555 cesinfo@bls.gov www.bls.gov/ces Media Contact:
22 June To the Chair and Members of the AUDIT COMMITTEE ANNUAL PAYROLL OVERPAYMENTS UPDATE REPORT 2015/2016
 22 June 2016 To the Chair and Members of the AUDIT COMMITTEE ANNUAL PAYROLL OVERPAYMENTS UPDATE REPORT 2015/2016 EXECUTIVE SUMMARY 1. This report provides the Audit Committee with an annual update on progress
ESTABLISHING A CASH FLOW MODEL
 Government Finance Officers Association of Texas Fall Conference 2017 ESTABLISHING A CASH FLOW MODEL EMILY A. UPSHAW, CPA VALLEY VIEW CONSULTING, LLC Objectives: Understand the importance of developing
PAYROLL STANDARDIZATION. Transitioning from Monthly to Biweekly Pay on January 1, 2019
 PAYROLL STANDARDIZATION Transitioning from Monthly to Biweekly Pay on January 1, 2019 Why? There are several reason why the University decided to standardize their payroll processes: System Security Administrative
World Meteorological Organization Working together in weather, climate and water
 WMO World Meteorological Organization Working together in weather, climate and water Existing Flood Management Guidance Materials, Databases and Training Materials Joachim Saalmüller WMO Sectretariat Commission
REAL EARNINGS JUNE 2018
 Transmission of material in this release is embargoed until 8:30 a.m. (EDT), Thursday, July 12, 2018 USDL-18-1144 Technical Information: (202) 691-6555 cesinfo@bls.gov www.bls.gov/ces Media Contact: (202)
BANK OF GUYANA. BANKING SYSTEM STATISTICAL ABSTRACT Website:
 BANK OF GUYANA BANKING SYSTEM STATISTICAL ABSTRACT Website: www.bankofguyana.org.gy RESEARCH DEPARTMENT March 2010 STATISTICAL ABSTRACT TABLES CONTENTS 1. MONETARY AUTHORITY 1.1 Bank of Guyana: Assets
2nd Quarter 2018 Webcast
 2nd Quarter 2018 Webcast Classic Large Cap Value Equity Presented by James J. Clarke Director of Fundamental Research & Portfolio Manager This material may not be reproduced or used in any form or medium
University System of Georgia s 2016 Georgia Summit Fraud in Higher Education
 University System of Georgia s 2016 Georgia Summit Fraud in Higher Education How to Protect your Institutions! September 14 2016 Jeff Fucito, CPA Aleisa Howell, CPA Jon Schultz, CPA Augusta Marriott at
Section 6621 of the Internal Revenue Code establishes the interest rates on
 Part 1 Section 6621.--Determination of Rate of Interest 26 CFR 301.6621-1: Interest rate. Rev. Rul. -32 Section 6621 of the Internal Revenue Code establishes the interest rates on overpayments and underpayments
Cost Estimation of a Manufacturing Company
 Cost Estimation of a Manufacturing Company Name: Business: Date: Economics of One Unit: Manufacturing Company (Only complete if you are making a product, such as a bracelet or beauty product) Economics
Raymond James The 35 th Annual Institutional Investors Conference
 Raymond James The 35 th Annual Institutional Investors Conference Edward Tilly, CEO March 4, 2014 1 Forward-Looking Statements This presentation may contain forward-looking statements, within the meaning