Fiscal Performance Index Of The States in India An Empirical Model Based Evidences
|
|
|
- Cathleen Alaina Barber
- 5 years ago
- Views:
Transcription


1 Centre of Excellence in Fiscal Policy and Taxation Fiscal Performance Index Of The States in India An Empirical Model Based Evidences S.R. No /2016/CEFT 1 P a g e
2 Table of Contents 1. Backdrop Motivation and Objective Methodology Composite Index of Fiscal Performance Relative Distance Method Z Score (Standard Normal) Method Data Sources Estimation of FPI for States Conclusion Policy Interventions References P a g e
3 Fiscal Performance Index: A State wise Comparison ABSTRACT Composite Fiscal Performance Index (FPI) is constructed for seventeen non special category states for four different time periods, FY to (P1), to (P2), FY to (P3), and FY to (P4). FPI is a comprehensive index as it is multi-dimensional in nature and covers various aspects of fiscal performance of the states. This research study has taken a comprehensive approach to measure the Fiscal Performance Index of the states through composite index which consists of five Level 1 indices. These indices are Deficit Index, Revenue Efficiency Index, Expenditure Quality Index, Debt Index and Debt Sustainability Index. Each Level 1 index is mapped to two different Level 2 Indices.Level 2 indices are Revenue Deficit Index (RDI), Fiscal Deficit Index (FDI),Tax Revenue Index (SOTRI),Non Tax Revenue Index (SONTRI),Developmental Revenue Expenditure Index (DREI),Developmental Capital Expenditure Index (DCEI),Interest Payment to Revenue Receipt Index (IPRRI),Outstanding Debt Ratio Index (DRI), Debt Spread Index (DSI) and Rate Spread Index(RSI). Both Relative Distance Model and Z Score Model are used to construct this Index. The position of Odisha is 11 th in period 1, 5 th in Period 2, 3 rd in Period 3 and 1 st in Period 4.To continue as the best performer in fiscal sphere, Revenue Efficiency Index of Odisha needs to be improved. 1. Backdrop In India the Union Finance has drawn a great deal of attention by researchers and policy makers. However, the importance of state finance could not be neglected. It is essential for a country to have good fiscal prudence, both at the Centre as well as the State level. The Eleventh Finance Commission adopted a measure of fiscal discipline by constructing the Fiscal Self Reliance and Improvement Index (FSRII). It is estimated by taking the improvement of the ratio of Own Revenue Receipt to total Revenue Expenditure of an individual state relative to the average ratio across all the states. This index was used as criteria for devolution. The succeeding Twelfth Finance Commission also retained the same index a measure of fiscal discipline. Besides, tax Effort Index measured by the ratio of per capita own tax revenue of a State to its per capita 3 P a g e
4 income as a criteria of horizontal devolution by Tenth Finance Commission. Since the fiscal discipline index captures the tax effort index, Thirteenth Finance Commission removed the tax effort index and retained only fiscal discipline measure to determine inter se shares of taxes. Dholakia (2005) criticized the single indicator based fiscal discipline measure as a criterion for tax devolution and developed a composite index of having eight indicators to measure fiscal performance of states. Das & Baig (2014) have also attempted to measure the fiscal performance of states by considering four indicators. Bhide & Panda (2002) evaluated the quality of Union Budget using composite index consisting of five indicators. Subsequently the fiscal discipline as a measure of horizontal devolution wasscrapped by the Fourteenth Finance Commission. 2. Motivation and Objective Presently fiscal discipline as criteria for central transfer to the states is abolished. But, it is still important to diagnose the fiscal health of the states. Taking cognizance of this issue the present study aims to measure the fiscal discipline of seventeen non-special category states of India by developing a composite Fiscal Performance Index (FPI) consisting of ten diverse fiscal indicators. The FPI is constructed for seventeen non special category states. 3. Methodology The fiscal performance of the states is measured by a composite index. The composite index is measured by five Level 1 indices and ten Level 2 indices.each of these Level 1 is mapped to two Level 2 indices. 3.1 Composite Index of Fiscal Performance The fiscal performance of the states is measured by composite Fiscal Policy Index. Composite index is a comprehensive index as it is multi-dimensional in nature and covers various aspects of fiscal performance of the states. This research study has taken a comprehensive approach to measure the Fiscal Performance Index of the states through composite index which consists of five Level 1 indices. These indices are 1. Deficit Index, 2.Revenue Efficiency Index, 3.Expenditure Quality Index, 4.Debt Index and 5.Debt 4 P a g e
5 Sustainability Index. These five major indices are combined to shape the Fiscal Performance Index (FPI). The composition of FPI is described below (Table 1). Table 1: Composition of Fiscal Performance Index Fiscal Performance Index (FPI) Level 1 Index 1. Deficit Index (DI) 2. Revenue Efficiency Index (REI) 3. Expenditure Quality Index (EQI) 4. Debt Index (DBI) 5. Debt Sustainability Index(DSI) Level 2 Index Revenue Deficit Index (RDI) Fiscal Deficit Index (FDI) Tax Revenue Index (SOTRI) Non Tax Revenue Index (SONTRI) Developmental Revenue Expenditure Index (DREI) Developmental Capital Expenditure Index (DCEI) Interest Payment to Revenue Receipt Index (IPRRI) Outstanding Debt Ratio Index (DRI) Debt Spread Index (DSI) Rate Spread Index(RSI) (a) Deficit Index (DI) is made up following level 2 indices. (i) (ii) Revenue Deficit Index (RDI) : Revenue Deficit as a proportion of Gross State Domestic Product (RD/GSDP) Fiscal Deficit Index (FDI): Fiscal Deficit as a proportion of Gross State Domestic Product (FD/GSDP) (b) Revenue Efficiency Index (REI) constitutes of the following level 2 indices. (i) Tax Revenue Index (SOTRI) : State Own Tax Revenue as a proportion of GSDP (SOTR/GSDP) 5 P a g e
6 (ii) Non Tax Revenue Index (SONTRI) : State Own Non-Tax Revenue as a proportion of Revenue Expenditure (SONTR/RE) (c) Expenditure Quality Index (EQI) consists of the following level 2 indices. (i) Developmental Revenue Expenditure Index (DREI): Revenue Expenditure in developmental sector as a proportion of Revenue Receipts (DRE/RR) (ii) Developmental Capital Expenditure Index (DCEI): Capital outlay in developmental sector as a proportion of Revenue Receipts (DCE/RR). (d) Debt Index (DBI) is made up of the following level 2 indices. (i) (ii) Interest Payment to Revenue Receipt Index (IPRRI): Interest Payments as a proportion of Revenue Receipts Outstanding Debt Ratio Index (DRI) : Outstanding Debt as a proportion of GSDP (e) Debt Sustainability Index is based on the following level 2 indices. (i) (ii) Debt Spread Index (DSI): The difference of Growth Rate of nominal GSDP and growth rate in outstanding debt (g gsdp g od ). Rate Spread Index (RSI): The difference of Growth Rate of nominal GSDP and cost of borrowing (g gsdp r). 6 P a g e
7 3.2 Relative Distance Method Relative Distance method is used to construct all ten level 2 indices. The level 2 index is categorized into Deprivation Index and Improvement Index. The deprivation index includes RDI, FDI, IPRRI and DRI. As higher RD/GSDP, FD/GSDP, IP/RR and Debt Stock/GSDP indicate negative (worse) fiscal performances. The Deprivation Index is constructed in such a way that,lower the ratio for a state; higher is the index value assigned to it. Therefore, the design of Deprivation Index is given below (Equation 1)...EQ (1) The Improvement Index consists of SOTRI, SONTRI, DREI, DCEI, DSI and RSI. As higher ratios in these indices indicates better fiscal performance. The Improvement Index is constructed in such a way that higherthe ratio for a state; higher is its index value. Therefore, the design of Improvement Index is given below (Equation 2)..EQ (2) Where, X refers to the actual value of the indicator for a given state. Max (X) and Min (X) are maximum and minimum value of the particular indicator across the states in a specified period. Similarly Y can be interpreted like X with the condition The value of D & I will lie ona 0 to 100 scale where 0 depicts worst performance and 100 implies the best performance. These Level 2 indices are made so as to make them unidirectional and combining them horizontally (averaging) will give the corresponding Level 1 index. Again averaging the Level 1 indices gives the composite Fiscal Performance Index for each of the state. Equal weights are given at both level 1 and level 2 indices. 7 P a g e
8 3.3 Z Score (Standard Normal) Method The Z-score (Standard Normal) is as an alternative method to arrive at the FPI of the states. The Z-score is estimated from the following equations. EQ (3)..EQ (4) The higher the Z-score better is the fiscal performance of the state. The difference between the mean value and the actual value is normalized with respect to the standard deviation. The estimation of the standard deviation is based upon the assumption that the data points follow normal distribution. The Z Score (Standard Normal) Method is adopted so as to validate the results of Relative Distance Method. 4. Data Sources All the data pertaining to Level 2 Index is collected for FY to FY from EPWRF (Economic and Political Weekly Research Foundation) 1 for all the states except for Odisha. Relevant data for Odisha is sourced from Finance Accounts, Government Odisha. Level 2 Index, Level 1 Index and composite Fiscal Performance Index are computed for the period FY to (P1), to (P2), FY to (P3), and FY to (P4). Therefore, FPI for the respective states is calculated for four different time periods in order to examine the migration in FPI for these 17 states over the period. Since the data for debt stock is not available for the states other than Odisha, the outstanding liability is taken as proxy for the debt stock for rest of the states. 1 EPWRF Data is source from Finance Accounts of the respective states. 8 P a g e
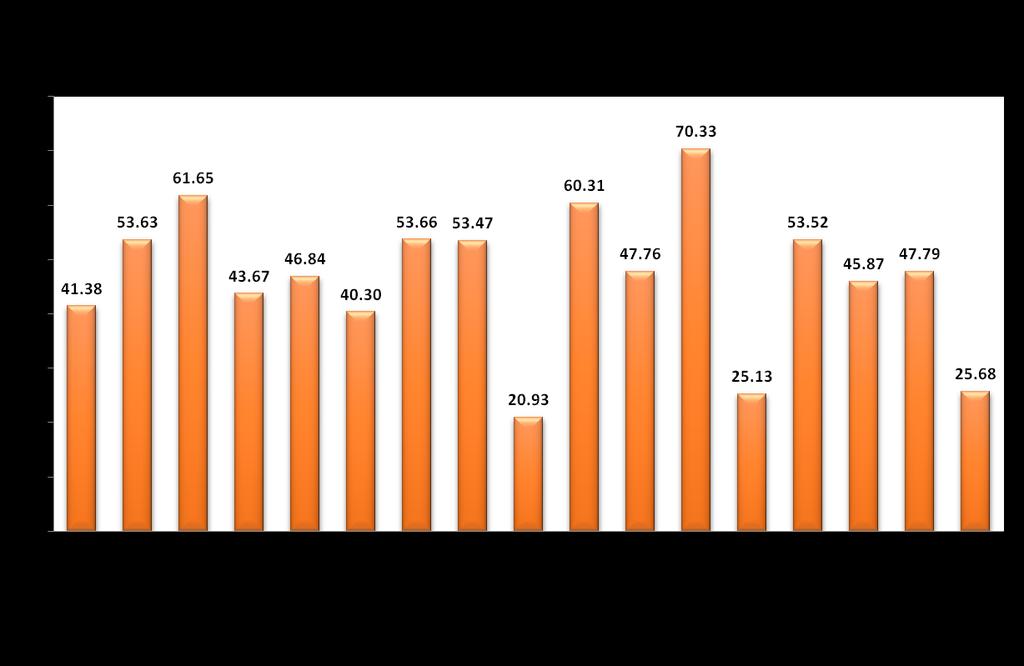
9 For each time period, simple average of three years for all the relevant variables is taken to arrive at Level 2 index. Then the average of two relevant level 2 index (Table 1) is taken to construct the corresponding level 1 index. The average of these five level 1 indices is taken to arrive at the composite Fiscal Performance Index of a particular state for a particular period. This process is repeated to arrive at the FPIs of allthe states under consideration. The maximum and minimum values of each relevant ratio pertaining to the level 1 index across the states in a specified time period are identified. Depending on the type of ratio, either deprivation index or improvement index methodology is applied. 5. Estimation of FPI for States 9 P a g e Theestimated Level 1 indices for seventeen non special category states of India for four identified time periods is given in the Appendix 1. The composite FPI for all the states over the four time periods is given Table 2. Table 2. Composite Fiscal Performance Index (FPI) Relative Distance Method States to to to to Index Rank (R1) Index Rank (R2) Index Rank (R3) Index Rank (R4) A.P Bihar Chhattisgargh Goa Gujarat Haryana Jharkhand Karnataka Kerala MP Maharashtra Odisha Punjab Rajasthan Tamil Nadu UP WB
10 There is large variation in the FPI because of variations in level 2 indices, which justifies the use of multiple indicators in assessing fiscal performance of states. During to , Goa, Chhattisgarh and Karnataka were in the top positions in terms of the FPI index with 1, 2 and 3 rank respectively. Punjab, Bihar and West Bengal were the worst performers. In to , Chhattisgarh took the first position followed by Haryana and Goa, while Punjab, Kerala and West Bengal were at the bottom. Goa, Chhattisgarh and Odisha were placed in top three during to , whereas Kerala, Punjab and West Bengal were positioned at the bottom. During to , Odisha is number 1in position followed by Chhattisgarh and MP, while Kerala, Punjab and West Bengal are the worst performers. Table-3 shows the improvement (+) or deterioration (-) of rank of states in FPI. It is observed that the Rank of Odisha has improved to 5 th position in Period-2 from Rank 11 in Period-1. This is due to significant improvement in DI, DBI and DSI followed by improvement in REI and mild improvement in EQI. Thereafter, despite a decline in REI and DSI, due to significant rise in other Level 1 indices, the rank of Odisha improved to 3 rd position in Period-3. In Period-4,Odisha in 1 st position. All four Level 1 indices have contributed to this improvement. However, the most important contributing level1 indices are DI and DBI. 10 P a g e
11 Table 3. Improvement/Deterioration of Rank States Period 2 Period 3 Period 4 A.P Bihar Chhattisgargh Goa Gujarat Haryana Jharkhand Karnataka Kerala MP Maharashtra Odisha Punjab Rajasthan Tamil Nadu UP WB Note: Positive value indicates improvement in Rank. The result of Z-score (Standard Normal) Model is presented in Table-4.The Z-score index suggests that the FPI rank of Odisha has improved to 5 in period-2 from 10 in period-1. The rank has further improved to 3 in Period 3. In the recent period that is during to , Odisha took the No. 1 spot in terms of fiscal performance. 11 P a g e
12 Therefore, Z-score (Standard Normal) Model validates the Relative Distance Model. States Table 4. Composite Composite Fiscal Performance Index (FPI) Z-Score (Standard Normal Method) to to to to Index Rank (R1) Index Rank (R2) Index Rank (R3) Index Rank (R4) A.P Bihar Chhattisgargh Goa Gujarat Haryana Jharkhand Karnataka Kerala MP Maharashtra Odisha Punjab Rajasthan Tamil Nadu UP WB Conclusion This research analysis basically attempts to measure the composite fiscal performance index of seventeen major non-special category states of India with a special focus on Odisha. The FPI is constructed by taking five level 1 indices wherein each level 1 index is mapped to two different level 2 indices. It is observed that the FPI of Odisha has improved during to , due to significant improvement in deficit index, debt index and debt sustainability index, and a 12 P a g e
13 mild increase in rest indices. Prudent management in improving both deficit indicators and public debt along with quality of expenditure has contributed to the robust fiscal performance of the Odisha during FY to FY Policy Interventions However, to continue as the best performer in fiscal sphere, Revenue Efficiency Index of Odisha needs to be improved as it is just at the average level. Though efficiency in both tax and non-tax revenue is need to be improved further, relatively, the efficiency in the State Own Tax Revenue (SOTR) needs to addressed on priority basis. 13 P a g e
14 References Dholakia, A. (2005), Measuring Fiscal Performance of States, An Alternative Approach, Economic and Political Weekly, July 30. Das &Baig (2014), India s state finances; declining debtbut weak fundamentals, Deutsche Bank Research, January 30. Bhide, S. and Panda, M. (2002), Evaluating Quality of Budgets with a Composite Index, Economic and Political Weekly, March 30. GoI (2000), Report of the Eleventh Finance Commission, Ministry of Finance, Government of India, July. GoI (2004), Report of the Twelfth Finance Commission, Ministry of Finance, Government of India, Nov. GoI (2009), Report of the Thirteenth Finance Commission, Ministry of Finance, Government of India, Dec. GoI (2014), Report of the Fourteenth Finance Commission, Ministry of Finance, Government of India, Dec. 14 P a g e
15 Appendix 1 Relative Distance Method Level 1 INDEX States to to DI REI EQI DBI DSI DI REI EQI DBI DSI A.P Bihar Chhattisgargh Goa Gujarat Haryana Jharkhand Karnataka Kerala MP Maharashtra Odisha Punjab Rajasthan Tamil Nadu UP WB to to States DI REI EQI DBI DSI DI REI EQI DBI DSI A.P Bihar Chhattisgargh Goa Gujarat Haryana Jharkhand Karnataka Kerala MP Maharashtra Odisha Punjab Rajasthan Tamil Nadu UP WB Notes: 1. DI- Deficit Index, REI- Revenue Efficiency Index, EQI-Expenditure Quality Index, DBI- Debt Index, DSI- Debt Sustainability Index. 2. Basic data for Odisha is collected from Finance Accounts, Govt. of Odisha. For other states the source is EPWRF. 15 P a g e
16 Appendix 2 Appendix 3 Relative Distance Method Z Score (Standard Normal Model) Deficit Index Revenue Efficiency Index Expenditure Quality Index Debt Index Debt Sustainability Index Composite Index Rank Year A.P Bihar Chhattisgargh Goa Gujarat Haryana Jharkhand Karnataka Kerala MP Maharashtra Odisha Punjab RajasthanTamil Nadu UP WB to to to to to to to to to to to to to to to to to to to to to to to to to Year A.P Bihar Chhattisgargh Goa Gujarat Haryana Jharkhand Karnataka Kerala MP Maharashtra Odisha Punjab RajasthanTamil Nadu UP WB to to to to to to to to
17
18
Dependence of States on Central Transfers: State-wise Analysis
 Dependence of States on Central : State-wise Analysis C. Bhujanga Rao and D. K. Srivastava Working Paper No. 2014-137 May 2014 National Institute of Public Finance and Policy New Delhi http://www.nipfp.org.in
Analysis of State Budgets :
 Analysis of State Budgets 2017-18: Emerging Issues policy brief on state finances 2017 Pinaki Chakraborty Manish Gupta Lekha Chakraborty Amandeep Kaur 1 Introduction While the Union Government finances
TRENDS IN SOCIAL SECTOR EXPENDITURE - AN INTER STATE COMPARISON
 TRENDS IN SOCIAL SECTOR EXPENDITURE - AN INTER STATE COMPARISON Mercy W.J Social sector public outlay and social development An inter state comparison Thesis. Department of Economics, Dr. John Matthai
Sharing of Union Tax Revenues
 CHAPTER 8 Sharing of Union Tax Revenues 8.1 One of the core tasks of a Finance Commission as stipulated in Article 280 (3) (a) of the Constitution is to make recommendations regarding the distribution
State level fiscal policy choices and their impacts
 State level fiscal policy choices and their impacts Analysis using a regional social accounting matrix for India, 2011-12 A. Ganesh-Kumar 1 and Manoj Panda 2 1 Professor, Indira Gandhi Institute of Development
14 th Finance Commission: Review and Outcomes. Economics. February 25, 2015
 February 25, 2015 Economics 14 th Finance Commission: Review and Outcomes The 14th Finance Commission (FFC) was constituted on 2nd January, 2013 and submitted its report on 15 th December, 2014. The recommendations
Inclusive Development in Bihar: The Role of Fiscal Policy. M. Govinda Rao
 Inclusive Development in Bihar: The Role of Fiscal Policy M. Govinda Rao Introduction Fiscal policy is a means to achieving inclusive growth. Despite impressive growth performance, uneven regional spread.
State Government Borrowing: April September 2015
 November 5, 2015 Economics State Government Borrowing: April September 2015 State Development Loans (SDL) are debt issued by state governments to fund their fiscal deficit. States in India like the centre,
Bihar: What is holding back growth in Bihar? Bihar Development Strategy Workshop, Patna. June 18
 Bihar: What is holding back growth in Bihar? Bihar Development Strategy Workshop, Patna. June 18 Ejaz Ghani World Bank. Structure of Presentation How does Bihar compare with other states? What is constraining
TAMILNADU STATE FINANCES
 TAMILNADU STATE FINANCES Prof.K.R.Shanmugam 1 Dr.G.S.Ganesh Prasad 2 Dr. L. Venkatachalam 3 Report Submitted to The Fourteenth Finance Commission, New Delhi MADRAS INSTITUTE OF DEVELOPMENT STUDIES Chennai
REPORT ON THE WORKING OF THE MATERNITY BENEFIT ACT, 1961 FOR THE YEAR 2010
 REPORT ON THE WORKING OF THE MATERNITY BENEFIT ACT, 1961 FOR THE YEAR 2010 1. Scope and Objective 1.1 The Maternity Benefit Act, 1961 extends to the whole of the Indian Union and applies to every factory,
1,14,915 cr GoI allocations for Ministry of Rural Development (MoRD) in FY
 in FY") BUDGET BRIEFS Vol 1/ Issue 9 Mahatma Gandhi National Rural Employment Guarantee Scheme (MGNREGS), GoI, 218-19 HIGHLIGHTS Mahatma Gandhi National Rural Employment Guarantee Scheme (MGNREGS) is a flagship
BUDGET BRIEFS Vol 1/ Issue 9 Mahatma Gandhi National Rural Employment Guarantee Scheme (MGNREGS), GoI, 218-19 HIGHLIGHTS Mahatma Gandhi National Rural Employment Guarantee Scheme (MGNREGS) is a flagship
INDICATORS DATA SOURCE REMARKS Demographics. Population Census, Registrar General & Census Commissioner, India
 Public Disclosure Authorized Technical Demographics Public Disclosure Authorized Population Urban Share Child Sex Ratio Adults Population Census, Registrar General & Census Commissioner, India Population
Sarva Shiksha Abhiyan, GOI
 Sarva Shiksha Abhiyan, GOI 2012-13 The Sarva Shiksha Abhiyan (SSA) is the Government of India's (GOI) flagship elementary education programme. Launched in 2001, it aims to provide universal primary education
Fiscal Responsibility Legislation in Indian States
 Fiscal Responsibility Legislation in Indian States State Perspectives-Kerala Experience Presentation by K. Jose Cyriac Principal Secretary (Finance) Government of Kerala 1 Revenue Expenditure Prelim BE
STATE DOMESTIC PRODUCT
 CHAPTER 4 STATE DOMESTIC PRODUCT The State Domestic Product (SDP) commonly known as State Income is one of the important indicators to measure the economic development of the State. In the context of planned
1,07,758 cr GoI allocations for Ministry of Rural Development (MoRD) in FY
 in FY") BUDGET BRIEFS Vol 10/ Issue 9 Mahatma Gandhi National Rural Employment Guarantee Scheme (MGNREGS), GoI, 2017-18 HIGHLIGHTS Mahatma Gandhi National Rural Employment Guarantee Scheme (MGNREGS) is a flagship
BUDGET BRIEFS Vol 10/ Issue 9 Mahatma Gandhi National Rural Employment Guarantee Scheme (MGNREGS), GoI, 2017-18 HIGHLIGHTS Mahatma Gandhi National Rural Employment Guarantee Scheme (MGNREGS) is a flagship
1,07,758 cr GoI allocations for Ministry of Rural Development (MoRD) in FY
 in FY") BUDGET BRIEFS Vol 10/ Issue 8 Pradhan Mantri Awaas Yojana Gramin (PMAY G) GoI, 2017-18 Pradhan Mantri Awaas Yojana - Gramin (PMAY - G) ) is Government of India s (GoI) flagship Housing for All scheme.
BUDGET BRIEFS Vol 10/ Issue 8 Pradhan Mantri Awaas Yojana Gramin (PMAY G) GoI, 2017-18 Pradhan Mantri Awaas Yojana - Gramin (PMAY - G) ) is Government of India s (GoI) flagship Housing for All scheme.
Economy. Fiscal policy has reached limits. Fiscal spending. Private investment. Private consumption. Thematic April 2018
 Private investment Fiscal spending Private consumption Thematic April 218 India Strategy Get on track please! Economy Fiscal policy has reached limits Nikhil Gupta - Research analyst (Nikhil.Gupta@MotilalOswal.com);
Session 1: Domestic resource mobilization. Presentation
 MINISTRY OF FINANCE REPUBLIC OF INDONESIA Asia-Pacific Outreach Meeting on Sustainable Development Financing 10-11 June 2014 Djuanda Hall, Ministry of Finance Complex, Jakarta Session 1: Domestic resource
ROLE OF PRIVATE SECTOR BANKS FOR FINANCIAL INCLUSION
 270 ROLE OF PRIVATE SECTOR BANKS FOR FINANCIAL INCLUSION ABSTRACT DR. BIMAL ANJUM*; RAJESHTIWARI** *Professor and Head, Department of Business Administration, RIMT-IET, Mandi Gobindgarh, Punjab. **Assistant
Total Sanitation Campaign GOI,
 Total Sanitation Campaign GOI, 2012-13 Launched in 1999, the Total Sanitation Campaign (TSC) is the Government of India's (GOI) flagship programme for providing universal access to sanitation facilities.
Forthcoming in Yojana, May Composite Development Index: An Explanatory Note
 1. Introduction Forthcoming in Yojana, May 2014 Composite Development Index: An Explanatory Note Bharat Ramaswami Economics & Planning Unit Indian Statistical Institute, Delhi Centre In May 2013, the Government
Note on ICP-CPI Synergies: an Indian Perspective and Experience
 2 nd Meeting of the Country Operational Guidelines Task Force March 12, 2018 World Bank, Washington, DC Note on ICP-CPI Synergies: an Indian Perspective and Experience 1. Meaning and Scope 1.1 International
Planning commission (Financial Resources Division)
") Planning commission (Financial Resources Division) A. Economic Profile of Maharashtra State: Maharashtra Annex-I contains Tables 1 to 5. Table 1 compares the growth performance of Maharashtra with its
Planning commission (Financial Resources Division) A. Economic Profile of Maharashtra State: Maharashtra Annex-I contains Tables 1 to 5. Table 1 compares the growth performance of Maharashtra with its
Himachal Pradesh Budget Analysis
 -4.9% -3.2% 3.9% 9. 10.4% 7.2% 10.2% 10. 10.8% 7.5% 9.1% 6.9% Himachal Pradesh Budget Analysis The Finance Minister of Himachal Pradesh, Mr. Jai Ram Thakur, presented the Budget for financial year on March
`6,244 cr GOI allocations for Ministry of Drinking Water and Sanitation(MoDWS) in FY
 in FY") Accountability Initiative Research and Innovation for Governance Accountability The Swachh Bharat Mission (SBM), previously called the Nirmal Bharat Abhiyan (NBA), is the Government of India s (GOI) flagship
Accountability Initiative Research and Innovation for Governance Accountability The Swachh Bharat Mission (SBM), previously called the Nirmal Bharat Abhiyan (NBA), is the Government of India s (GOI) flagship
Fiscal Imbalances and Indebtedness across Indian States: Recent Trends
 Fiscal Imbalances and Indebtedness across Indian States: Recent Trends Tapas K. Sen and Santosh K. Dash Working Paper No. 2013-119 February 2013 National Institute of Public Finance and Policy New Delhi
The achievement of the Annual Plans for the Eleventh Plan is shown below: Achievement of Plan outlay
 Planning Commission (Financial Resources Division) State: Karnataka A. Economic Profile of Karnataka Annex-I contains Tables 1 to 5. Table 1 compares the growth performance of Karnataka with its neighboring
Analysis of State Budgets :
 Analysis of State Budgets 2017-18: Emerging Issues policy brief on state finances 2017 Pinaki Chakraborty Manish Gupta Lekha Chakraborty Amandeep Kaur 1 Introduction While the Union Government finances
International Journal for Research in Applied Science & Engineering Technology (IJRASET) Status of Urban Co-Operative Banks in India
 Status of Urban Co-Operative Banks in India") Status of Urban Co-Operative Banks in India Siddhartha S Vishwam 1, Dr. B. S. Chandrashekar 2 1 Research Scholar, DOS in Economics and Co-operation, University of Mysore, Manasagangothri, Mysore 2 Assistant
Status of Urban Co-Operative Banks in India Siddhartha S Vishwam 1, Dr. B. S. Chandrashekar 2 1 Research Scholar, DOS in Economics and Co-operation, University of Mysore, Manasagangothri, Mysore 2 Assistant
Banking Sector Liberalization in India: Some Disturbing Trends
 SPECIAL REPORT Banking Sector Liberalization in India: Some Disturbing Trends Kavaljit Singh In the first week of August 2005, Reserve Bank of India (RBI), country s central bank, issued a list of 391
Mid-Day Meal Scheme, GOI,
 Mid-Day Meal Scheme, GOI, 2012-13 The Mid-Day Meal (MDM) scheme is the world's largest school-based feeding programme aimed at promoting universalisation of elementary education and improving the nutritional
Update April Indian Economy ECONOMY JK HR. Center
 Update April 217 Indian Economy ECONOMY WB TN OR TG RJ MP KL MH JH KA JK HR HP GJ BH CG AP Center Is fiscal policy reaching limits? Nikhil Gupta (Nikhil.Gupta@MotilalOswal.com); +91 22 3982 545 Madhurima
Bihar Budget Analysis
 -1. -0. 1.6% 4. 6.6% 5. 4.9% 8. 7. 10. 10. 14. Bihar Budget Analysis The Finance Minister of Bihar, Mr. Sushil Kumar Modi, presented the Budget for financial year on February 27, 2018. Budget Highlights
All households across the country - both rural and urban are to be covered under the scheme. Bank accounts will be opened for 15 crore poor persons.
 A Critical Review of Progress of Prdhaan Mantri Jan Dhan Yojnaa (PMJDY) : State Level Variation (Yogesh Kumar, Joint Director, Institute of Applied Manpower Research, Planning Commission, Govt of India)
FOREWORD. Shri A.B. Chakraborty, Officer-in-charge, and Dr.Goutam Chatterjee, Adviser, provided guidance in bringing out the publication.
 FOREWORD The publication, Basic Statistical Returns of Scheduled Commercial Banks in India, provides granular data on a number of key parameters of banks. The information is collected from bank branches
Mending Power Sector Finances PPP as the Way Forward. Energy Market Forum
 Mending Power Sector Finances PPP as the Way Forward Energy Market Forum AF Mercados EMI 11 th February 2011 Structure of the Presentation Current Status of Power Sector Generation Transmission Distribution
GOVERNMENT FINANCING OF HEALTH CARE IN INDIA SINCE 2005 WHAT WAS ACHIEVED, WHAT WAS NOT, AND WHY
 GOVERNMENT FINANCING OF HEALTH CARE IN INDIA SINCE 2005 WHAT WAS ACHIEVED, WHAT WAS NOT, AND WHY OUTLINE 1 Key takeaways 2 Total Government Health Expenditure (TGHE): A flow of funds view 3 TGHE in 29
OUTSTANDING GOVERNMENT DEBT
 ISIN Security OUTSTANDING GOVERNMENT DEBT TABLE 3: OUTSTANDING GOVERNMENT DEBT (Previous Month) Mod V+ (for V- (for Modified for 100bps for 100 bps Expected price for a 100bps rise in yield due to and
Issues in Health Care Financing and Provision in India. Peter Berman The World Bank New Delhi
 Issues in Health Care Financing and Provision in India Peter Berman The World Bank New Delhi Financing and Provision of Health Care: Some Introductory Concepts Consider whole system Government and non-government,
10+ Years of PETS What We Have Learned. Ritva Reinikka The World Bank June 19, 2008
 10+ Years of PETS What We Have Learned Ritva Reinikka The World Bank June 19, 2008 Principal Agent: Relationships of accountability have five features Delegating Actors (principals) including clients,
Credit Penetration in Odisha Economy: A Comparative Analysis
 Credit Penetration in Odisha Economy: A Comparative Analysis 1. Backdrop Bank Credit plays a vital role in the economic development. Bank credit is the major source of financing in India. More than 60%
February 08, 2017 I Research
 Uttarakhand Uttar Pradesh Delhi Haryana Rajasthan Maharashtra Punjab Madhya Pradesh India Karnataka Gujarat Kerela Chhattisgarh Jharkhand West Bengal Tamil Nadu Demonetization: A pause for sustainable
79,686 cr GoI allocations for the Ministry of Human Resource Development (MHRD) in FY
 in FY") BUDGET BRIEFS Vol 10/ Issue 1 Sarva Shiksha Abhiyan (SSA) GoI, 2017-18 Sarva Shiksha Abhiyan (SSA) is the Government of India s (GoI) flagship elementary education programme. Launched in 2001, it aims
BUDGET BRIEFS Vol 10/ Issue 1 Sarva Shiksha Abhiyan (SSA) GoI, 2017-18 Sarva Shiksha Abhiyan (SSA) is the Government of India s (GoI) flagship elementary education programme. Launched in 2001, it aims
OUTSTANDING GOVERNMENT DEBT
 48 CCIL ISIN Monthly Newsletter d OUTSTANDING GOVERNMENT DEBT TABLE 3: OUTSTANDING GOVERNMENT DEBT Yield Yield (Previous Month) Mod V+ ( V- ( Modified 100bps 100bps Expected price a 100bps rise in yield
Did Gujarat s Growth Rate Accelerate under Modi? Maitreesh Ghatak. Sanchari Roy. April 7, 2014.
 Did Gujarat s Growth Rate Accelerate under Modi? Maitreesh Ghatak Sanchari Roy April 7, 2014. The Gujarat economic model under Narendra Modi continues to dominate the media and public discussions as the
National Level Government Health Sector Expenditure Analysis - 29 states ( )
") National Level Government Health Sector Expenditure Analysis - 29 states (2005-2013) What follows Study objectives Scope Process Methods - data sources & constraints Expenditure trends and comparisons
National Level Government Health Sector Expenditure Analysis - 29 states (2005-2013) What follows Study objectives Scope Process Methods - data sources & constraints Expenditure trends and comparisons
Post and Telecommunications
 Post and Telecommunications This section presents operating and financial data relating to the different branches of the Department of Posts including the Post Office Savings Banks. It comprises statistics
Issue 06. MFIN micrometer. data as of 30 th June 2013
 Issue 06 MFIN micrometer data as of 30 th June 2013 All rights reserved. No part of this publication may be reproduced or transmitted in any form or by any means without written permission from MFIN. However,
POPULATION PROJECTIONS Figures Maps Tables/Statements Notes
 8 POPULATION PROJECTIONS Figures Maps Tables/Statements 8 Population projections It is of interest to examine the variation of the Provisional Population Totals of Census 2011 with the figures projected
6,908 cr GoI allocations for Ministry of Social Justice and Empowerment (MSJE) in FY
 in FY") BUDGET BRIEFS Vol 10/ Issue 5 Self Employment Scheme for Rehabilitation of Manual Scavengers (SRMS) GoI, 2017-18 The Self Employment Scheme for Rehabilitation of Manual Scavengers (SRMS) is a Central Sector
BUDGET BRIEFS Vol 10/ Issue 5 Self Employment Scheme for Rehabilitation of Manual Scavengers (SRMS) GoI, 2017-18 The Self Employment Scheme for Rehabilitation of Manual Scavengers (SRMS) is a Central Sector
Chhattisgarh Budget Analysis
 -0.2% -1.6% 2.7% 2.9% 1.8% 6.6% 6.5% 7.8% 5.8% 8.9% 3.6% 5.5% 6.8% 9.5% 6. 8.4% 6.7% 10. 13.8% 15.6% Chhattisgarh Budget Analysis The Finance Minister of Chhattisgarh, Dr. Raman Singh, presented the Budget
STATE OF STATE FINANCES
 STATE OF STATE FINANCES Mandira Kala Vatsal Khullar January 2018 Low capacity to raise taxes makes some states depend on central transfers States see slow tax growth in recent years; may need GST compensation
Insolvency Professionals to act as Interim Resolution Professionals or Liquidators (Recommendation) Guidelines, 2018
 Guidelines, 2018") Insolvency Professionals to act as Interim Resolution Professionals or Liquidators (Recommendation) Guidelines, 2018 Provisions in the Insolvency and Bankruptcy Code, 2016 31 st May, 2018 1. Section 16(3)(a)
Insolvency Professionals to act as Interim Resolution Professionals or Liquidators (Recommendation) Guidelines, 2018 Provisions in the Insolvency and Bankruptcy Code, 2016 31 st May, 2018 1. Section 16(3)(a)
Madhya Pradesh Budget Analysis
 Madhya Pradesh Budget Analysis The Finance Minister of Madhya Pradesh, Mr. Jayant Malaiya, presented the Budget for financial year on February 28, 2018. Budget Highlights The Gross State Domestic Product
TI FINANCIAL HOLDINGS LIMITED (TIFHL) Corporate Presentation FY18
 Corporate Presentation FY18") TI FINANCIAL HOLDINGS LIMITED (TIFHL) Corporate Presentation FY18 1 SPIRIT OF MURUGAPPA The fundamental principle of economic activity is that no man you transact with will lose, then you shall not." 2
TI FINANCIAL HOLDINGS LIMITED (TIFHL) Corporate Presentation FY18 1 SPIRIT OF MURUGAPPA The fundamental principle of economic activity is that no man you transact with will lose, then you shall not." 2
Delhi Budget Analysis
 Delhi Budget Analysis The Minister of Finance of Delhi, Mr. Manish Sisodia, presented the Budget for financial year on March 22, 2018. Budget Highlights The Gross State Domestic Product (GSDP) of Delhi
National Rural Employment Guarantee Act (NREGA 2005) Santosh Mehrotra Senior Adviser (Rural Development) Planning Commission Government of India
 Santosh Mehrotra Senior Adviser (Rural Development) Planning Commission Government of India") National Rural Employment Guarantee Act (NREGA 2005) Santosh Mehrotra Senior Adviser (Rural Development) Planning Commission Government of India 1 30 yr history of WEPs but Problems Low programme coverage
National Rural Employment Guarantee Act (NREGA 2005) Santosh Mehrotra Senior Adviser (Rural Development) Planning Commission Government of India 1 30 yr history of WEPs but Problems Low programme coverage
Commercial Banks, Financial Inclusion and Economic Growth in India
 International Journal of Business and Management Invention ISSN (Online): 2319 8028, ISSN (Print): 2319 801X Volume 2 Issue 5 ǁ May. 2013ǁ PP.01-06 Commercial Banks, Financial Inclusion and Economic Growth
UDAY Scheme: Perspective and Progress
 UDAY Scheme: Perspective and Progress Contact: Madan Sabnavis Chief Economist 91-022-67543489 Darshini Kansara Research Associate Darshini.Kansara@careratings.com 91-022-67543679 Mradul Mishra (Media Contact)
BUDGET BRIEFS Vol 9/Issue 3 Mahatma Gandhi National Rural Employment Guarantee Scheme (MGNREGS) GOI, ,07,758 cr
 GOI, ,07,758 cr") BUDGET BRIEFS Vol 9/Issue 3 Mahatma Gandhi National Rural Employment Guarantee Scheme (MGNREGS) GOI, 2017- HIGHLIGHTS 1,07,758 cr Mahatma Gandhi National Rural Employment Guarantee Scheme (MGNREGS) is
BUDGET BRIEFS Vol 9/Issue 3 Mahatma Gandhi National Rural Employment Guarantee Scheme (MGNREGS) GOI, 2017- HIGHLIGHTS 1,07,758 cr Mahatma Gandhi National Rural Employment Guarantee Scheme (MGNREGS) is
JOINT STOCK COMPANIES
 This section contains statistics relating to joint stock companies which are based on returns received from Registrars of Joint Stock Companies. Tables 25.1 (A) (B) to 25.4 These tables present data regarding
SOLAR ENERGY CORPORATION OF INDIA LIMITED DRAFT 1000 MW GRID CONNECTED ROOF TOP SOLAR PV SCHEME FOR GOVERNMENT BUILDINGS UNDER CAPEX AND RESCO MODELS
 SOLAR ENERGY CORPORATION OF INDIA LIMITED DRAFT 1000 MW GRID CONNECTED ROOF TOP SOLAR PV SCHEME FOR GOVERNMENT BUILDINGS UNDER CAPEX AND RESCO MODELS 1000 MW GRID CONNECTED ROOF TOP SOLAR PV SYSTEM SCHEME
9,000cr GOI allocation for SBM in FY
 BUDGET BRIEFS Vol 8/Issue 2 Swachh Bharat Mission-Gramin (SBM) GOI, 2016-17 Using government data, this brief reports on trends for SBM-Gramin along the following parameters: Allocations and expenditures
Employment and Inequalities
 Employment and Inequalities Preet Rustagi Professor, IHD, New Delhi. Round Table on Addressing Economic Inequality in India Bengaluru, 8 th January 2015 Introduction the context Impressive GDP growth over
CHAPTER-3 DETERMINANTS OF FINANCIAL INCLUSION IN INDIA
 CHAPTER-3 DETERMINANTS OF FINANCIAL INCLUSION IN INDIA Indian economy has changed a lot over the past 60 years. Over the next 40 years the changes could be dramatic. Using the latest demographic projection
RAJASTHAN. Tracking Public Investments for Children. Budgeting for Change Series, 2011
 RAJASTHAN Tracking Public Investments for Children Budgeting for Change Series, 2011 i This report is the product of a collaboration between the Centre for Budget and Governance Accountability (CBGA),
Study-IQ education, All rights reserved
 Copyright @ Study-IQ education, All rights reserved TIRELESSSOUL GauravGarg888 Q1) The File cover chosen for 2018 economic survey report was pink because A) To support human rights B) To highlight gender
Karnataka Budget Analysis
 -4. 3. 8.9% 7.7% 8.6% 7. 8. 10.3% 14. 19.7% 19.8% 15. 13.4% 13.6% 13.4% 11.8% 11. 11.8% 12. 17.4% Karnataka Budget Analysis The Chief Minister and Finance Minister, Mr. H. D. Kumaraswamy presented the
LABOUR PRODUCTIVITY IN SMALL SCALE INDUSTRIES IN INDIA: A STATE-WISE ANALYSIS
 The Indian Journal of Labour Economics, Vol. 49, No. 3, 2006 LABOUR PRODUCTIVITY IN SMALL SCALE INDUSTRIES IN INDIA: A STATE-WISE ANALYSIS R.K. Sharma and Abinash Dash* Based on the latest available NSS
BUDGET BRIEFS Volume 9, Issue 4 National Health Mission (NHM) GOI,
 GOI,") BUDGET BRIEFS Volume 9, Issue 4 National Health Mission (NHM) GOI, 217-18 HIGHLIGHTS The National Health Mission is the Government of India s (GOI) largest public health programme. It consists of two sub-missions:
BUDGET BRIEFS Volume 9, Issue 4 National Health Mission (NHM) GOI, 217-18 HIGHLIGHTS The National Health Mission is the Government of India s (GOI) largest public health programme. It consists of two sub-missions:
Fiscal Landscape of Odisha: An analysis of Deficits and Expenditures ABSTRACT
 Available online at : http://euroasiapub.org, pp. 1~20, Thomson Reuters ID: L-5236-2015 Fiscal Landscape of Odisha: An analysis of Deficits and Expenditures Dr. Asit Ranjan Mohanty 1, Professor in Finance,
STUDY REPORT ON. Estimating True Fiscal Capacity of States and Devising a Suitable Rule for Granting Debt Relief based on Optimal Growth Requirement
 STUDY REPORT ON Estimating True Fiscal Capacity of States and Devising a Suitable Rule for Granting Debt Relief based on Optimal Growth Requirement December 5, 2013 Sponsored by : 14 th Finance Commission,
Gram Panchayat Development Plan(GPDP) Ministry of Panchayati Raj
 Ministry of Panchayati Raj") Gram Panchayat Development Plan(GPDP) Ministry of Panchayati Raj 1 Panchayat Statistics Avg. population per GP National Average population per GP: 3,416 No. of PRIs in the country : 2,56,103 No. of Gram
Gram Panchayat Development Plan(GPDP) Ministry of Panchayati Raj 1 Panchayat Statistics Avg. population per GP National Average population per GP: 3,416 No. of PRIs in the country : 2,56,103 No. of Gram
Kerala Budget Analysis
 2.1% 4.3% 2.9% 5.2% 5.7% 4. 7.2% 6.7% 4.3% 6.6% 7.4% Kerala Budget Analysis The Finance Minister of Kerala, Dr. T.M. Thomas Isaac, presented the Budget for financial year on February 2, 2018. Budget Highlights
West Bengal Budget Analysis
 0.3% 3. 2.3% 6.4% 5.9% 8.8% 8. 8. 11.4% 10.2% 11. 15. West Bengal Budget Analysis The Finance Minister of West Bengal, Dr. Amit Mitra presented the Budget for financial year on January 31, 2018. Budget
Review of performance of Pradhan Mantri Mudra Yojana
 Review of performance of Pradhan Mantri Mudra Yojana (An analysis on the performance of PMMY during FY 2015-16) hetbpeer meheàuelee keàer kegbàpeer 2 MUDRA/PMMY Micro Units Development & Refinance Agency
PORTFOLIO MICROMETER. Issue. 14 data as of 30 th June 2015
 PORTFOLIO i MICROMETER Issue 14 data as of 30 th June 2015 PORTFOLIO 1 MICROMETER data as of 30 th June 2015 All rights reserved. No part of this publication may be reproduced or transmitted in any form
In the estimation of the State level subsidies, the interest rates that have been
 Subsidies of the State Governments s ubsidies provided by the State governments have been estimated for 15 major States for 1993-94. As explained earlier, the major data source is the Finance Accounts
Measuring Outreach of Microfinance in India Towards A Comprehensive Index
 From the SelectedWorks of Dr. Arindam Laha January, 2012 Measuring Outreach of Microfinance in India Towards A Comprehensive Index Dr. Arindam Laha Prof. Pravat Kumar Kuri Available at: https://works.bepress.com/arindam_laha/8/
UDAY and Power Sector Debt:
 UDAY and Power Sector Debt: DISCUSSION paper Assessing Efficiency Parameters and Impact on Public Finance Pinaki Chakraborty Lekha Chakraborty Manish Gupta Amandeep Kaur 1 1. Introduction With the introduction
Private Corporate Investment: Growth in and Prospects for *
 Private Corporate Investment: Growth in 2014-15 and Prospects for 2015-16 ARTICLE Private Corporate Investment: Growth in 2014-15 and Prospects for 2015-16* This article endeavours to gauge business sentiments
The Effect of Intergovernmental Transfers on Public Services in India
 NIPFP Working paper series Working NIPFP Working Paper No. paper 218 series The Effect of Intergovernmental Transfers on Public Services in India No. 218 28-Dec-2017 M. Govinda Rao National Institute of
Growth Powered by Technology, Driven by Customers. Financial Results 31 st March 2017
 Financial Results 31 st March 2017 Performance Highlights Q4 FY 2016-17 NET INTEREST INCOME ` 989.49 cr NON INTEREST INCOME ` Rs.450.16 cr OPERATING PROFIT ` Rs.703.12 cr NET PROFIT ` 203.99 cr NET INTEREST
Telangana Budget Analysis
 -5.8% -4.9% -2.9% 3.6% 6.8% 6. 6.1% 12.9% 6.2% 11. 8.6% 12.2% 10.2% 10.1% 11.1% 10.4% Budget Analysis The Finance Minister of, Mr. Eatala Rajender, presented the Budget for financial year on March 15,
Rich-Poor Differences in Health Care Financing
 Rich-Poor Differences in Health Care Financing Role of Communities and the Private Sector Alexander S. Preker World Bank October 28, 2003 Flow of Funds Through the System Revenue Pooling Resource Allocation
UTTAR PRADESH. Tracking Public Investments for Children. Budgeting for Change Series, 2011
 UTTAR PRADESH Tracking Public Investments for Children Budgeting for Change Series, 2011 i This report is the product of a collaboration between the Centre for Budget and Governance Accountability (CBGA),
CHAPTER IV INTER STATE COMPARISON OF TOTAL REVENUE. and its components namely, tax revenue and non-tax revenue. We also
 CHAPTER IV INTER STATE COMPARISON OF TOTAL REVENUE This chapter deals with the inter state comparison of total revenue and its components namely, tax revenue and non-tax revenue. We also examine the growth
IJMIE Volume 2, Issue 8 ISSN:
 FINANCIAL INCLUSION PLANS (FIPs) Growing Roots in the light of good governance of RBI Pawan Sharma* Richa Tuli* Abstract: This study is an effort to investigate the status of financial inclusion in India.
Tally.ERP 9 Series A Release 1.5 Stat.900 Version 89. Release Notes
 Tally.ERP 9 Series A Release 1.5 Stat.900 Version 89 Release Notes August 15, 2009 The information contained in this document is current as of the date of publication and subject to change. Because Tally
-Empanelment of Chartered Accountant Firms for post-sanction monitoring and follow up for assistance provided by MUDRA to various lending institutions
 -Empanelment of Chartered Accountant Firms for post-sanction monitoring and follow up for assistance provided by MUDRA to various lending institutions Micro Units Development & Refinance Agency Ltd. (MUDRA)
Impact of VAT in Central and State Finances. An Assessment
 Impact of VAT in Central and State Finances An Assessment R. Kavita Rao Fellow, National Institute of Public Finance and Policy, New Delhi 1. Introduction After the 1994 report on the Reform of Domestic
GST Update M.S. CHHAJED & CO. GST UPDATE 2/
 GST Update 02 2018-19 01st June 2018 FOR PRIVATE CIRCULATION ONLY M.S. CHHAJED & CO. GST UPDATE 2/18-19 1 E-way Bill Now E-way Bill shall be required to be generated for intra-state movement of goods in
The Revenue Impact of VAT in Madhya Pradesh: Empirical Evidence from India
 International Journal of Economics and Finance; Vol. 8, No. 5; 2016 ISSN 1916-971X E-ISSN 1916-9728 Published by Canadian Center of Science and Education The Revenue Impact of VAT in Madhya Pradesh: Empirical
Financial Results Q3/FY February 2019
 Financial Results Q3/FY18-19 08 February 2019 HIGHLIGHTS - DEC 2018 Total Business Total Deposit Gross Advance Operating Profit (Q-3) Rs. 291519 Crore Rs. 177906 Crore Rs.113610 Crore Rs. 381 Crore Basel
National Rural Health Mission, GOI,
 National Rural Health Mission, GOI, 2011-12 Launched in 2005, the National Rural Health Mission (NRHM) is the Government of India's (GOI) largest public health programme. Using government data, this brief
GOVERNMENT OF INDIA MINISTRY OF AGRICULTURE AND FARMERS WELFARE DEPARTMENT OF AGRICULTURE, COOPERATION AND FARMERS WELFARE
 GOVERNMENT OF INDIA MINISTRY OF AGRICULTURE AND FARMERS WELFARE DEPARTMENT OF AGRICULTURE, COOPERATION AND FARMERS WELFARE 425 SHRI VENKATESH BABU T.G.: SHRI KESHAV PRASAD MAURYA: DR. A. SAMPATH: ADV.
Performance of RRBs Before and after Amalgamation
 Performance of RRBs Before and after Amalgamation DR. MINAXI M. JARIWALA Lecturer, Vivekanand College for B.Ed. Gujarat (India) DR. MARTINA R. NORONHA Vice-Principle S.P.B. English Medium College of Commerce
Study of Revenue Implications of 14 th Finance Commission Recommendations and Union Budget FY on Odisha
 S.R. No. 005 11/2015/CEFT Study of Revenue Implications of 14 th Finance Commission Recommendations and Union Budget FY 2015-16 on Odisha 1. Recommendations of Fourteenth Finance Commission The recommendation