Canadian Tire Corporation, Limited. November 2007
|
|
|
- Emerald Daniel
- 5 years ago
- Views:
Transcription

1 Canadian Tire Corporation, Limited November 2007
2 Forward-looking Statements This disclosure contains statements that are forward-looking. Actual results or events may differ materially from those forecasted in this disclosure because of the risks and uncertainties associated with Canadian Tire s business and the general economic environment. Risks and uncertainties outlined here are disclosed in other public filings by the Company, such as Management s Discussion and Analysis in the 2006 Annual Report and include, but are not limited to: changes in interest, currency exchange and tax rates, the ability of Canadian Tire to attract and retain quality employees, Associate Dealers, Petroleum agents and PartSource and Mark s Work Wearhouse store operators and franchisees; and the willingness of customers to shop at the Company s stores or access financial products and services. 2

3 Unique Business Model, Delivering Long-term Shareholder Value Canadian Tire offers a range of goods and services that meet life s everyday needs, including general merchandise, clothing, petroleum and financial services Synergies between our five businesses enhance our customer value proposition while increasing overall operating effectiveness Delivering value for our shareholders through sustainable double-digit earnings growth 3
4 Five Distinct, Yet Interrelated, Businesses CTR 468 stores Financial Services >4 million MasterCard accounts Mark s 348 stores Petroleum 265 gas bars PartSource 68 stores Canadian Tire Retail is Canada s most shopped general merchandise retailer and a leader in each of its three core product categories Automotive, Leisure, and Home. Canadian Tire Financial Services offers Canadian Tire-branded credit cards, personal loans, insurance and warranty products, as well as residential mortgages and high-rate savings accounts, and is the 2 nd largest MasterCard franchise in Canada. Mark s Work Wearhouse is a leading clothing and footwear retailer the largest Canadian casual pant and jean retailer and the 2 nd largest outerwear retailer in Canada. Canadian Tire Petroleum is one of Canada s largest independent gasoline retailers, creating customer loyalty to drive growth for Canadian Tire Retail and Canadian Tire Financial Services. PartSource is a chain of specialty automotive stores catering to serious do-it-yourselfers and professional installers. Canadian Tire s products and services provide the essentials of everyday living for people of all ages 4
5 Business Models CTR - Unique Franchise Model CTR stores are operated by Associate Dealers who are independent business owners CTC owns or leases land and building; Dealer owns store inventory and fixtures CTC benefits from Dealer Mobility - Dealer drives growth & success of store to acquire bigger/better store Petroleum - Agency Model Substantially all Petroleum sites operated by independent Agents CTC owns the site; Agent operates the site and sells gasoline and convenience items for the corporation Mark s - Primarily Corporate Model 297 Corporate stores; 51 Franchise stores Corporate model due to smaller store size/land requirements; Franchises run by most capable Franchisees PartSource - Initially Franchise but moving to primarily Corporate Model 43 Franchise stores; 25 Corporate stores and growing Increased rollout of corporate stores to benefit from improved consistency of execution and +50% EBIT Financial Services Canadian Tire Corporation owns and finances all receivables 5
6 THE POWER OF INTERRELATEDNESS Sum is Greater than the Parts Gross Operating Revenue 1 Earnings Before Taxes 1, 2 Petroleum 18% Financial Services 9% CTR 64% Financial Services 30% CTR 54% Mark's 9% Mark's 16% 1) As of year-end ) Petroleum incurred a loss in fiscal

7 Canadian Tire Enjoys Distinct Competitive Advantages Platform of interrelated businesses Brand recognition and trust Canadian Tire Money Marketing/advertising reach and scale Innovative formats, products and services Real estate Competitive advantage is created through trust in the Canadian Tire brand, market leadership, deep-rooted customer relationships and our integrated business model 7
8 Enterprise Marketing and Operational Synergies Brand equity National reach and scale Real estate Supply chain Marketing and advertising Merchandising Canadian Tire Retail Mark s Work Wearhouse Petroleum Financial Services PartSource We are leveraging each of our customer relationships to firmly entrench our brand in the everyday lives of Canadians 8


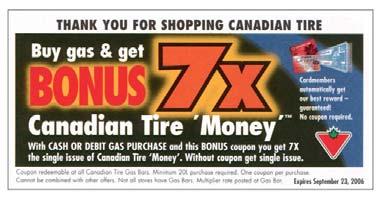
9 Loyalty, Cross-marketing Synergies Increase Customer Value Proposition Multiplier coupons Spend and Save coupons Flyer-within-a-flyer Merchandise discount coupons Money on the Card 9
10 Interrelationships Generate Higher Overall Sales and Profits 30% of Petroleum (CTP) purchases are made on Canadian Tire credit cards CTR shopping frequency increases more than 25% when customers gas up at Petroleum OMC2 customers who shop at CTR and fill-up at Petroleum are Canadian Tire s best customers Indexed share of spending at CTR Indexed share of wallet at CTR Average CTR customer CTR only CTR/CTP CTR/OMC CTR/OMC/CTP 1) Universe of all CTR customers (based on customer survey data) 2) Options MasterCard 10
11 Strong Track Record: Consolidated Financial Performance Gross Operating Revenue ($ Billions) Canadian Tire s performance has been consistent through many economic cycles due to its everyday needs offering '97 '98 '99 '00 '01 '02 '03 '04 '05 '06 Basic EPS from Continuing Operations ($) Cash Generated from Operations 1 ($ Millions) '97 '98 '99 '00 '01 '02 '03 '04 '05 '06 '97 '98 '99 '00 '01 '02 '03 '04 '05 '06 1) Cash generated from operating activities before changes in other working capital components 11
12 Strong Track Record Share Price versus EPS $80 10 yr. TRS 231% $5 $60 $4 CTC.a share price ($) $40 $20 EPS CAGR 11.3% Share Price CAGR 12.0% $3 $2 $1 Earnings per share $0 '97 '98 '99 '00 '01 '02 '03 '04 '05 '06 $0 12
13 Strong Track Record Store Network Growth CTR Stores Petroleum Sites PartSouce Stores Mark s Stores '97 '98 '99 '00 '01 '02 '03 '04 '05 '06 13
14 A Bigger Canadian Tire Growth Runway Current Network Size Growth Available Completion of Concept 20/20 rollout new stores Development of next version of CTR store Potential for 70+ new sites Refurbish 100 older sites Room for 100+ new stores Ongoing relocations, concept renewal and store expansions 100+ new stores, including 22 Hub Stores >4 million MasterCard accounts New credit cards and other financial services 14
15 Strategic Aspirations 5-year average Store network growth +5% Revenue growth 6-8% Productivity EPS + Double-digit ROIC +10% 15
 16")
16 Canadian Tire Retail (CTR) 16 16

17 CTR: Canada s Most Shopped General Merchandise Retailer 85-year-old retail chain 468 CTR Stores 80% of Canadians have shopped at Canadian Tire in the last year, 50% 60% every month Flyer distributed to 10 million homes every week, making it the most widely read advertising in Canada Annual catalogue since 1928 #1 seller of bikes, camping, hockey and fire safety equipment Iconic brand in Canada CTR 17
 160 189 154 169 162 180 197 256 283 279 '97 '98 '99 '00 '01 '02 '03 '04 '05 '06 '97 '98 '99 '00 '01 '02 '03 '04 '05 '06 CTR s")
18 Historical Performance CTR s Retail Sales ($ Billions) CTR s Earnings Before Income Taxes and Minority Interest 1 ($ Millions) '97 '98 '99 '00 '01 '02 '03 '04 '05 '06 '97 '98 '99 '00 '01 '02 '03 '04 '05 '06 CTR s Store Count '97 '98 '99 '00 '01 '02 '03 '04 '05 '06 1) Excluding non-operating items (gain on disposal of property and equipment, stock option modification and loss on MTN redemption) for 2001 and onwards CTR 18


19 Three Broad Product Categories Retail Sales by Product Category Automotive Leisure 30% 28% 42% Home CTR 19
20 Bigger More stores Concept 20/20 rollout Network expansion in small markets Concept renewal New concept testing and refinement Higher volume per store New categories and updated product lines Innovative and exclusive products > demand creation More browsing; cross shopping Higher transaction value CTR 20


21 Bigger 20/20 Showcases Full Breadth and Depth of CTR s Offering CTR 21
22 Bigger 20/20 Stores are 50% Bigger Average Retail Store Square Footage No. of Stores 2007F Concept 20/20 Store 52, New Format Store (Class-of/Next Gen.) 34, Traditional CTR Store 16, CTR 22
23 Bigger 20/20 Stores Perform Better Concept 20/20 Stores Year 1 1 Sales Growth Replacement 69% Internal Retrofit 10% Retrofit Expansion 18% 1) As of end of Q CTR 23
24 Bigger 20/20 Stores Perform Better Average Transaction Value 1 * ($) Average Increase in Customer Count* 1 (Index) +13% +22% Year 0 (pre 20/20) Year 1 (post 20/20) Year 0 (pre 20/20) Year 1 (post 20/20) 1) Includes new stores (total of 93 stores); excluding new stores, increase is 13% * As of end of Q CTR 24
25 Significant Opportunity for Future Growth Store Network Growth Traditional Stores New Format Stores Concept 20/ New Concept Network Expansion Strategy '94 '95 '96 '97 '98 '99 '00 '01 '02 '03 '04 '05 '06 '07F '08F '09F '10F '11F '12F CTR 25

26 Bigger Concept Renewal: Unique Combo Store Format CTR 26
27 Bigger Network Expansion Strategy Identified over 100 markets (trade areas) which: Are under serviced by existing stores Have sufficient population base Represent acceptable sales transfer risk Can make smaller market economics work with three retail concepts (CTR, Mark s, Petroleum whenever possible) supported by credit card returns Four pilot stores opening in 2008: Low-cost design (pre-engineered building) Sales potential of $5 to $9 million 18,000 to 20,000 retail square feet Assortment tailored to the market New markets/traditional store opportunities CTR 27


28 Bigger Innovative and Exclusive Products Create new customer demand Introduce new products Create excitement using innovative marketing Utilizing global sourcing capabilities to grow ENE products Store displays and in-store TV demos designed to support growth CTR 28
29 Better Focused on Getting Better Leverage for Future Growth New Dealer agreement Revitalized automotive infrastructure Growing global sourcing Improved customer experience People - Process - Technology CTR 29
30 Better New Dealer Contract 2008 $15 million - $20 million in pre-tax earnings 2014 $80 million - $100 million in pre-tax earnings + 7 Years of Relationship Certainty We expect to improve pre-tax earnings by $400 million through the new Dealer agreement CTR 30
31 Better - Principles of Dealer Agreement Sharing in Dealer profits (over 2008 base level) Shifted the balance of cost of marketing expenses Sharing of energy and lighting costs and savings Agreement to invest in Automotive Infrastructure CTR 31
32 Better - Revitalized Automotive Infrastructure Total investment of approximately $120 million $75 million in fixed assets $45 million in working capital Will generate an estimated $120-$130 million in incremental auto parts sales by 2010, increasing to over $200 million by 2014 Pre-tax earnings are estimated to be $15 to $20 million by 2010, growing to $45 to $50 million by 2014 Growth in our automotive business will also benefit Dealers High rate of return project CTR 32
33 Better Revitalized Automotive Infrastructure Assortment Management Supply Chain Technology Broader Faster Better Increasing CTR in-store assortments 10-15% on average (7,500-8,550 SKUs) More than doubling our assortment in regional distribution centres from 35,000 to 75,000 SKUs Building at least 22 PartSource Hub stores across Canada in support of 75-80% of Canadian Tire stores Building out the PartSource chain to over 200 stores New Automotive Management System to improve Canadian Tire s auto service capabilities New industry standard data catalogue New warehouse management technology to enhance distribution capabilities CTR 33
34 Future Operating Model Prime Distribution Centres 3 Primes 75,000 SKUs Overnight Deliveries Hubs 35,000 SKUs 15,000 SKUs PartSource Routed and Shotgun Deliveries CTR Stores 8,500 SKUs Third Party Customers CTR 34
35 Better Global Sourcing CTR is a North American leader Provides margin protection 2006 Percentage of Products Sourced Offshore Provides stronger retail sales results Breakthrough price points 2009F Access to innovative products Promotional program Domestic 63% Offshore 37% 50% (Increased from 35% in 2005) CTR 35
36 Better Customer Service Better Understanding Customer service tracking; all stores, monthly Customer segmentation analysis a key driver of category strategies Better Experience New product lines Better stores (brighter, wider isles) More convenient (better locations) CTR 36
37 Better Improved Productivity Improved marketing and merchandising processes Energy savings Technology renewal Streamlined organizational design and internal processes CTR 37

38 Canadian PartSourceTire Retail (CTR) 38 38

39 PartSource Chain of Specialty Automotive Stores Unique business model in Canada Opportunity to leverage Canadian Tire infrastructure: real-estate, buying, technology and supply chain Emergency parts supplier for CTR stores Strong customer response 85% of customers very satisfied with level of service 91% of customers very likely to recommend the store PARTSOURCE 39

40 Appeals to Automotive Do-It-Yourselfers and Professional Installers PARTSOURCE 40


41 Our Business Today The Parts National brands Industry leading guarantees More than 15,000 SKUs in store The Pros Employees are trained automotive professionals The Price Competitively priced, 10% price guarantee PARTSOURCE 41


42 A Bigger and Better PartSource Continued high single-digit same store sales, particularly in commercial sector Further acquisitions of competitors Further rollout of corporate stores Grow network by 100+ stores Significant investments planned in technology and supply chain to: Enhance parts assortment Improve supply chain delivery to CTR and PartSource stores Provide better customer service PARTSOURCE 42
43 Bigger Potential to Grow to 200+ Stores Currently represents only 2.4% of Canadian outlets Operate with limited coverage from Ontario to Alberta Opportunity to grow via Adding new builds Acquisition of independents as consolidation occurs Hub Stores Canadian Auto Part Store Mix Auto Parts Outlets 2,750 Locations PartSource PARTSOURCE 43
44 Bigger Network Expansion Plans PartSource Stores Corporate Franchise '98 '99 '00 '01 '02 '03 '04 '05 '06 '07F '08F '09F '10F '11F '12F PARTSOURCE 44

45 Petroleum 45
 / Money on the Card Cross-merchandising Gas Advantage MasterCard $40 million in CTM issued, redeemable at CTR PETROLEUM")
46 Petroleum: Largest Independent Gasoline Retailer in Canada Pumps double industry average litres per site 265 gas bars, 257 convenience stores, and 75 car washes Petroleum s interrelated benefits Canadian Tire Money (CTM) / Money on the Card Cross-merchandising Gas Advantage MasterCard $40 million in CTM issued, redeemable at CTR PETROLEUM 46

47 Historical Performance Petroleum s Gasoline Sales Volume (Billions of Litres) Petroleum s Number of Gas Bars '97 '98 '99 '00 '01 '02 '03 '04 '05 '06 '97 '98 '99 '00 '01 '02 '03 '04 '05 '06 Petroleum s Earnings Before Income Taxes 1 ($ Millions) '97 '98 '99 '00 '01 '02 '03 '04 '05 '06 1) Excluding non-operating items (gain on disposal of property and equipment) for 2001 and onwards PETROLEUM 47


48 A Bigger and Better Petroleum Selected investment in new sites at store locations Significant commitment to renovate up to 100 sites to improve customer experience and increase revenues Key focus is to drive traffic to CTR and Financial Services Emphasis on driving higher margin convenience store sales Emphasis on reducing expenses to lower breakeven point in the event of any future margin volatility PETROLEUM 48
49 Bigger Grow Network and Drive Growth to SBUs Mandate is to: Build loyalty to Canadian Tire branded businesses Drive traffic to CTR stores Grow Financial Services card usage and receivables Add 10+ new sites per year in high-potential, strategic markets Modernize older existing sites (20-25 per year) PETROLEUM 49
50 Bigger Network Expansion Plans Petroleum Sites '97 '98 '99 '00 '01 '02 '03 '04 '05 '06 '07F '08F '09F '10F '11F '12F PETROLEUM 50


51 Better Rebuild, Renew, Grow Before Modernization Strathroy, Ont Portage, Man Kirkland, Que After Modernization Strathroy, Ont Portage, Man Kirkland, Que PETROLEUM 51

52 Canadian Tire Financial Services 52 52

 Sophisticated credit risk management systems Award-winning Call Centre FINANCIAL")
53 Financial Services: 2nd Largest MasterCard Franchise in Canada In business for more than 40 years 2nd largest MasterCard franchise in Canada Own a chartered bank Low cost acquisition through CTR stores One in five households has a Canadian Tire MasterCard CTR marketing channels (in-store, flyer, online) Sophisticated credit risk management systems Award-winning Call Centre FINANCIAL SERVICES 53

54 Financial Services has Significant Competitive Advantages Low-cost acquisition channel World class call centres In-store marketing Sophisticated credit risk management systems Operating leverage through scale Extensive customer database Brand trust and loyalty FINANCIAL SERVICES 54
55 Historical Performance Gross Average Receivables Growth ($ Millions) 10 Yr. GAR Growth +15.6% CAGR '97 '98 '99 '00 '01 '02 '03 '04 '05 '06 FINANCIAL SERVICES 55
56 Historical Performance Operating EBT Growth ($ Millions) 10 Yr. CAGR +13.9% '97 '98 '99 '00 '01 '02 '03 '04 '05 '06 Excluding non-operating items [gain on disposal of property and equipment, gains (and losses) on sales of loans receivables, stock option modification and redemption of MasterCard shares] for 2005 and onwards, and excluding non-operating items [gains (and losses) on sales of loans receivables and gain on sale of subsidary] for 2001 and onwards FINANCIAL SERVICES 56


57 Our Business Today Canadian Tire Options MasterCard Gas Advantage Card Credit insurance Extended warranties Life / accident / disability insurance Canadian Tire Roadside Assistance Personal loans and lines of credit One-and-Only account FINANCIAL SERVICES 57
58 Bigger Average Balances Have Room to Grow $/Card 1,736 2,525 Growth Opportunity Including Premium Cards Balance Transfer Offers and New Product Introductions Including Premium Cards CTFS Industry Rolling 12 months as of December ) Source: Canadian Bankers Association (CBA), November Includes gold, platinum, low rate and standard cards FINANCIAL SERVICES 58
59 Bigger Increasing Share of a Large, Growing Market Bank and Market Size 1 ($ Billion) % CAGR 5.1% Market Share '02 '03 '04 '05 '06 Ending Receivables $ Volume 1) Source: Canadian Bankers Association (CBA) FINANCIAL SERVICES 59

60 Bigger - Retail Banking is a Potential New Channel for Growth Leveraging strong customer relationships to grow into retail banking Pilot in three markets for up to two years High interest savings accounts 3.8% interest no minimum deposit, no monthly fees bonus Canadian Tire gift card for new accounts GICs varying interest rates and terms, competitive offering Residential mortgages variety of traditional terms and competitive rates prime and super-prime customers first mortgages; owner-occupied no 35-year terms or interest-only One-and-Only account Combines mortgage, chequing/savings account, loans or credit card balances into one account FINANCIAL SERVICES 60


61 Bigger New Card Tests Higher balances More customers FINANCIAL SERVICES 61
62 CTC Competitive Advantages vs. Mainstream Banks Trust in the Canadian Tire brand Loyalty program Store network very low account acquisition costs physical branch network Quality of customer service: Named Best Call Centre in North America 5 of last 7 years Innovative marketing approach to dealing with our customers Slightly higher up risk curve Canadians have a high propensity to deal with a non-traditional bank FINANCIAL SERVICES 62
63 Risk Management Expertise managing higher risk credit from 40 years of experience as a exproprietary card issuer Innovative approaches to better understand customer risk profiles i.e. SKUbased scorecards Higher credit utilization than most other credit card portfolios, due to tighter credit limits Over the past two years, we have taken approximately 500 bps out of our higher risk category to reduce volatility through: Better upfront scorecards Tight credit line management Enhanced collections procedures Write-off rates are now declining vs. previous year s performance FINANCIAL SERVICES 63
64 Financial Services Funding Financial Services financed through a combination of: Corporate financing % Securitized debt % Securitized debt through Glacier Credit Card Trust A single purpose trust only containing Financial Services receivables Structure was established in 1995 very stable history Securitization in an important funding program, in the past and future, but we do have alternatives FINANCIAL SERVICES 64
65 Financial Services Funding Glacier Credit Card Trust Attributes: Transparency of assets and performance (Canadian Tire branded credit card receivables) Liquidity (not restricted to market disruption ) Long successful track record in underwriting management and collection of credit card receivables since 1961 Have done 12 term deals (6 matured and paid out) Commercial paper issuance used to bridge to term deals Term deal, typically for 5 years, currently executed once per year High percentage of funding cost is fixed, so exposure to increasing interest rates is low in the short to mid term FINANCIAL SERVICES 65
66 Financial Services Funding Glacier Credit Card Trust Attributes: Canadian Tire Bank is a Schedule I Canadian Chartered Bank governed by the Bank Act (Canada) and is engaged primarily in the financing and managing credit card accounts CTFS is a wholly owned subsidiary of CTC and Canadian Tire Bank is an indirect wholly owned subsidiary of Canadian Tire Corporation Excess Spread and Enhancement Account will provide credit support for all classes of notes Excess Spread average over 9% Traditional Enhancement Amount of 5.5% (represents enhancement provided by CT Bank so that losses are first allocated to the retained interest rather than the coownership interest) Subordinated Notes issued to serve as credit support for Senior Notes Subordinated Notes were 5.5% of total notes issued in 2006 FINANCIAL SERVICES 66
67 Financial Services Funding Glacier Credit Card Trust Update November 2007: Commercial paper currently represents less than 7% of total Glacier funding Glacier Commercial paper continues to roll over at bank conduit spreads CTC will conform liquidity credit line to DBRS and S&P Global Style standard by end of 2007, with no major changes expected based upon DBRS press release FINANCIAL SERVICES 67
68 Better Decreasing Operating Expense Percentage Operating Expenses as a Percentage of Gross Average Receivables 1 (%) '01 '02 '03 '04 '05 '06 1) Excludes gains (losses) on sales of loans receivable on the total managed portfolio and the impact of a stock option modification in Q Calculated on a rolling 12-month basis and includes total managed portfolio of loans receivable FINANCIAL SERVICES 68
69 Attractive Return on Receivables of 4.5% to 5.0% Net Write-Off Rates (%) Target: 5.0% - 6.0% Return on Receivables 1 (%) Target: 4.5% - 5.0% '02 '03 '04 '05 '06 '02 '03 '04 '05 '06 1) Earnings before income taxes, gains (losses) on sales of loans receivable, the impact of a stock option modification (2006) and redemption of an investment (2006), as a percentage of gross average loans receivable FINANCIAL SERVICES 69

70 Mark s Work Wearhouse 70 70

71 Mark s was Acquired in 2002 and has Grown Significantly Scale: #1 Industrial apparel and footwear* 1 #2 Men s casual apparel* 1 #1 Casual pants and jeans* 1 #5 Ladies apparel* 2 80% private label merchandise Customer service: 75% very satisfied Leverage Canadian Tire s capabilities: real estate, cross promotions, co-locations Mark s offers business casual, weekend, work wear and accessories for men and women, ages * ) Retail sales in dollars 1) Trendex ) NPD 2006 MARK S 71
72 Historical Performance Mark s Retail Sales ($ Millions) % CAGR Mark s Earnings Before Income Taxes and Minority Interest 1 ($ Millions) % CAGR '02 '03 '04 '05 '06 '02 '03 '04 '05 '06 1) Excluding non-operating items (gain on disposal of property and equipment and stock option modification) for 2005 and onwards MARK S 72
73 Gain Operating Leverage from Growth Earnings as a Percentage of Sales (%) Mark s Same Store Sales Growth 1 (%) '02 '03 '04 '05 '06 '02 '03 '04 '05 '06 1) Figures for 2002 and 2003 are comparable store sales MARK S 73


74 Our Business Today 2006 Sales Blend Industrial 39% Men s 36% Women s 25% MARK S 74
75 Focus on Quality and Functionality at Reasonable Prices MARK S 75


76 Our Strengths Clothes that Work Armour-Flex Industrial Footwear Flex-Tech Collar, Pant and Belt Curvetec Shape Enhancing Designs MARK S 76
77 Bigger Network Expansion Plans More Mark s Work Wearhouse Stores Mark s Other Formats '02 '03 '04 '05 '06 '07F '08F '09F '10F '11F '12F MARK S 77


78 Bigger More Formats Expand existing stores Larger stores Smaller stores Evolved combo and integrated stores Mobile Mark s MARK S 78


79 Better Broader Enhanced Assortments Clothes That Work Women s Wear Imagewear Super Branding Evolving Mark s Brand Clothes That Work Private Labels MARK S 79
80 Better Enhanced margins via: Offshore sourcing Clothes That Work and private label margin opportunities More precise pricing management Investment in infrastructure to support growth Inventory management Assortment optimization IT Infrastructure investment Supply chain MARK S 80

81 Key Highlights 81
82 Funding Requirements Funding requirements over Credit card / loan receivables growth $1.6 Billion Capital expenditures (PP&E) $2.7 Billion Canadian Tire Retail Bank Still to be determined: Requires minimal commitment initially Corporate debt maturities $0.6 Billion Securitization debt maturities $1.9 Billion Net funding requirements after securitization are minimal Forecasted activity Securitization $3.5 Billion Sales/leaseback of DC s and urban centres $300 Million - $320 Million 82
83 Debt Maturities are Manageable Corporate Debt Glacier Credit Card Trust ($ Millions) Long Term Debt Maturities: $300 Million Corporate MTN due 2014 $252.5 Million Glacier MTN due 2014 $150 Million Corporate MTN due 2028 $200 Million Corporate MTN due 2034 $200 Million Corporate MTN due '07F '08F '09F '10F '11F '12F 83
84 Real Estate Continued commitment to owning core real estate holdings to support CTR store growth Book value in excess of $2 billion Sale/Leaseback opportunities over next 2 years Montreal distribution centre Urban properties in Toronto, Vancouver and Ottawa $300 to $320 million of inflows Continue to dispose of redundant property - $10 to $15 million of gains, $30 to $35 million of proceeds Strategic site at Dundas and Kipling 1 million square feet yet to be developed 84
85 Cash Flow Utilization Main focus remains investment in growth agenda Anti-dilutive share buy back program continues Dividend policy in place 2003: 40 per share 2007: 74 per share Growth based on 15-20% of prior year s normalized basic net earnings per share During the later years of the plan, opportunities may exist to enhance the share buy back and/or dividend policy as free cash flow grows 85

86 2007 Plan for EPS of $4.65 $4.85 More than 135 retail store projects planned across three retail banners Test larger-format combination Canadian Tire Mark s store Begin development of CTR s next retail concept Expansion of Gas Advantage Card pilot into additional markets Introduction of at least one new credit card product Continued investment in retail banking pilot, with new products to be launched in late 2007 Targeted investments in productivity-enhancing initiatives Balanced plan for growth and enhanced productivity 86 86
87 Contact Information Karen Meagher Manager, Investor Relations Telephone: (416)
Canadian Tire Corporation, Limited. April 2008
 Canadian Tire Corporation, Limited April 2008 Forward-looking Statements This disclosure contains statements that are forward-looking. Actual results or events may differ materially from those forecasted
Management s Discussion and Analysis. Canadian Tire Corporation, Limited Third Quarter 2014
 Management s Discussion and Analysis Canadian Tire Corporation, Limited Third Quarter 2014 1 1.0 Preface 1.1 Definitions In this document, the terms we, us, our, Company, Canadian Tire Corporation, CTC
Management s discussion and analysis (MD&A)
") Canadian Tire Corporation, Limited to Shareholders 13 Weeks Ended September 28, 2013 Management s discussion and analysis (MD&A) Forward-looking statements... 1 1.0 Preface... 2 1.1 Definitions... 2 1.2
Canadian Tire Corporation, Limited to Shareholders 13 Weeks Ended September 28, 2013 Management s discussion and analysis (MD&A) Forward-looking statements... 1 1.0 Preface... 2 1.1 Definitions... 2 1.2
2008 Third Quarter Financial Results. Conference Call November 6, 2008
 2008 Third Quarter Financial Results Conference Call November 6, 2008 Forward-looking Information This disclosure contains statements that are forward-looking. Actual results or events may differ materially
Management s Discussion and Analysis. Canadian Tire Corporation, Limited First Quarter 2017
 Management s Discussion and Analysis Canadian Tire Corporation, Limited First Quarter 2017 1.0 Preface 1.1 Definitions In this document, the terms we, us, our, Company, Canadian Tire Corporation, CTC,
2009 Fourth Quarter and Year-End Financial Results*
 2009 Fourth Quarter and Year-End Financial Results* Conference Call February 11, 2010 * Unaudited Quarterly & Annual Comparisons Unless otherwise indicated, all comparisons of results for the fourth quarter
Management s Discussion and Analysis
 Management s Discussion and Analysis Canadian Tire Corporation, Limited First Quarter 2016 1 of 47 1.0 Preface 1.1 Definitions In this document, the terms we, us, our, Company, Canadian Tire Corporation,
Management s Discussion and Analysis. Canadian Tire Corporation, Limited Second Quarter 2017
 Management s Discussion and Analysis Canadian Tire Corporation, Limited Second Quarter 2017 1.0 Preface 1.1 Definitions In this document, the terms we, us, our, Company, Canadian Tire Corporation, CTC,
Management s Discussion and Analysis (MD&A)
") Canadian Tire Corporation, Limited 2016 First Quarter Report to Shareholders 13 Weeks Ended April 2, 2016 Management s Discussion and Analysis (MD&A) 1.0 Preface... 1 1.1 Definitions... 1 1.2 Forward-looking
Canadian Tire Corporation, Limited 2016 First Quarter Report to Shareholders 13 Weeks Ended April 2, 2016 Management s Discussion and Analysis (MD&A) 1.0 Preface... 1 1.1 Definitions... 1 1.2 Forward-looking
Management s Discussion and Analysis. Canadian Tire Corporation, Limited Third Quarter 2017
 Management s Discussion and Analysis Canadian Tire Corporation, Limited Third Quarter 2017 1.0 Preface 1.1 Definitions In this document, the terms we, us, our, Company, Canadian Tire Corporation, CTC,
Management s Discussion and Analysis Canadian Tire Corporation, Limited First Quarter 2015
 Management s Discussion and Analysis Canadian Tire Corporation, Limited First Quarter 2015 1 1.0 Preface 1.1 Definitions In this document, the terms we, us, our, Company, Canadian Tire Corporation, CTC
Management s Discussion and Analysis
 Management s Discussion and Analysis Canadian Tire Corporation, Limited First Quarter 2014 Page 1 1.0 Preface 1.1 Definitions In this document, the terms we, us, our, Company, Canadian Tire Corporation,
This Management s Discussion and Analysis (MD&A) provides management s perspective on our Company, our performance and our strategy for the future.
 provides management s perspective on our Company, our performance and our strategy for the future.") Management s discussion and analysis (MD&A) Introduction This Management s Discussion and Analysis (MD&A) provides management s perspective on our Company, our performance and our strategy for the future.
Management s discussion and analysis (MD&A) Introduction This Management s Discussion and Analysis (MD&A) provides management s perspective on our Company, our performance and our strategy for the future.
Management s Discussion and Analysis. Canadian Tire Corporation, Limited Third Quarter 2018
 Management s Discussion and Analysis Canadian Tire Corporation, Limited Third Quarter 208 .0 Preface. Definitions In this document, the terms we, us, our, Company, Canadian Tire Corporation, CTC, and Corporation
This Management s Discussion and Analysis (MD&A) provides management s perspective on our Company, our performance and our strategy for the future.
 provides management s perspective on our Company, our performance and our strategy for the future.") Management s discussion and analysis (MD&A) Introduction This Management s Discussion and Analysis (MD&A) provides management s perspective on our Company, our performance and our strategy for the future.
Management s discussion and analysis (MD&A) Introduction This Management s Discussion and Analysis (MD&A) provides management s perspective on our Company, our performance and our strategy for the future.
Canadian Tire Financial Services. Tom Gauld President. Business Overview September 20, 2005
 Canadian Tire Financial Services Tom Gauld President Business Overview September 20, 2005 Forward-looking Information This presentation contains certain forward-looking statements that are subject to risks
Management s discussion and analysis (MD&A) Forward-looking statements
 Forward-looking statements") Management s discussion and analysis (MD&A) Forward-looking statements This MD&A contains statements that are forward-looking. Actual results or events may differ materially from those forecasted in this
Management s discussion and analysis (MD&A) Forward-looking statements This MD&A contains statements that are forward-looking. Actual results or events may differ materially from those forecasted in this
2006 First Quarter Financial Results Conference Call May 11, 2006
 26 First Quarter Financial Results Conference Call May 11, 26 Canadian Tire Corporation, Limited Forward-looking Information This disclosure contains statements that are forward-looking. Actual results
Management s Discussion and Analysis. Canadian Tire Corporation, Limited Second Quarter 2018
 Management s Discussion and Analysis Canadian Tire Corporation, Limited Second Quarter 208 .0 Preface. Definitions In this document, the terms we, us, our, Company, Canadian Tire Corporation, CTC, and
Management s Discussion and Analysis. Canadian Tire Corporation, Limited Fourth Quarter and Full Year 2017
 Management s Discussion and Analysis Canadian Tire Corporation, Limited Fourth Quarter and Full Year 2017 1.0 Preface 1.1 Definitions In this document, the terms we, us, our, Company, Canadian Tire Corporation,
Canadian Tire Corporation Investor Presentation
 Canadian Tire Corporation 2018 Investor Presentation Forward Looking Information Caution regarding forward-looking statements: This document contains forward-looking statements that reflect Management
Presentation on Canadian Tire Corp. by William A. Ackman, Pershing Square Capital Management, L.P.
 Presentation on Canadian Tire Corp. by William A. Ackman, Pershing Square Capital Management, L.P. Given May 23, 2006 at The Ira W. Sohn Investment Research Conference in New York City. This edited transcript
CANADIAN TIRE CORPORATION, LIMITED 2000 ANNUAL REPORT. a new era
 Canadian Tire 2000 Annual Report CANADIAN TIRE CORPORATION, LIMITED 2000 ANNUAL REPORT a new era FINANCIAL HIGHLIGHTS (Dollars in thousands except for per share amounts) 2000 1999 Percent (52 weeks) (52
Financial Highlights (1)
") Loblaw Companies limited 2013 Annual Report Financial review Financial Highlights (1) As at or for the periods ended December 28, 2013 and December 29, 2012 2013 2012 (2) 2011 (3) (millions of Canadian
Loblaw Companies limited 2013 Annual Report Financial review Financial Highlights (1) As at or for the periods ended December 28, 2013 and December 29, 2012 2013 2012 (2) 2011 (3) (millions of Canadian
SAFE HARBOR STATEMENT
 1 SAFE HARBOR STATEMENT Forward Looking Statements This press release, and the above referenced conference call, contains or may contain forward-looking statements made pursuant to the safe harbor provisions
Hudson's Bay Company Reports Fourth Quarter and Fiscal 2014 Financial Results
 April 7, 2015 Hudson's Bay Company Reports Fourth Quarter and Fiscal 2014 Financial Results Strategic Initiatives Continue to Drive Sales and Earnings Growth Company Provides Sales and Capex Outlook for
Canadian Tire Corporation Announces Strong Fourth Quarter and Full Year Results
 Canadian Tire Corporation Announces Strong Fourth Quarter and Full Year Results Consolidated same store sales up 3.9% in the fourth quarter: o Canadian Tire up 3.5%; Mark s up 3.4%; FGL up 5.8% Financial
Cautionary Statement Regarding Forward-Looking Statements
 January 2018 Cautionary Statement Regarding Forward-Looking Statements Forward Looking Statements: Certain statements are forward-looking statements made pursuant to the safe harbor provisions of the Private
our purpose: 2016 Annual Report Financial Review Live Life Well
 our purpose: 2016 Annual Report Financial Review Live Life Well 2016 Annual Report Financial Review Financial Highlights Management s Discussion and Analysis Financial Results Notes to the Consolidated
GAP INC. REPORTS FOURTH QUARTER AND FISCAL YEAR 2018 RESULTS. Company outlines plans to restructure specialty fleet and revitalize Gap brand health
 GAP INC. REPORTS FOURTH QUARTER AND FISCAL YEAR 2018 RESULTS Company outlines plans to restructure specialty fleet and revitalize Gap brand health SAN FRANCISCO February 28, 2019 Gap Inc. (NYSE: GPS) today
Group Strategy. Claus-Dietrich Lahrs, Chief Executive Officer. November 8, 2011
 Group Strategy Claus-Dietrich Lahrs, Chief Executive Officer November 8, 2011 HUGO BOSS Investor Day 2011 // Group Strategy HUGO BOSS November 8, 2011 2 / 37 AGENDA INTRODUCTION HUGO BOSS A PREMIUM BUSINESS
SAFE HARBOR STATEMENT
 1 SAFE HARBOR STATEMENT Forward Looking Statements This press release contains or may contain forward-looking statements made pursuant to the safe harbor provisions of the Private Securities Litigation
Management s Discussion and Analysis
 1. 2. 3. 4. 5. 6. 7. 8. 9. 10. 11. 12. 13. 14. 15. 16. 17. 18. 19. 20. 21. 22. 23. Forward-Looking Statements Overview Strategic Framework Key Financial Performance Indicators Overall Financial Performance
ICR Conference January 2019
 ICR Conference January 209 IMPORTANT INFORMATION Forward Looking Statements This presentation contains forward looking statements that are subject to risks and uncertainties. All statements other than
GAP INC. REPORTS SECOND QUARTER RESULTS. Reaffirmed Full-Year Earnings Per Share Guidance Range of $2.55 to $2.70
 GAP INC. REPORTS SECOND QUARTER RESULTS Reaffirmed Full-Year Earnings Per Share Guidance Range of $2.55 to $2.70 Delivered Seventh Consecutive Quarter of Positive Comparable Sales Growth Distributed $388
TRUE RELIGION APPAREL INC
 TRUE RELIGION APPAREL INC FORM 8-K (Current report filing) Filed 02/06/13 for the Period Ending 02/06/13 Address 2263 EAST VERNON AVENUE VERNON, CA, 90058 Telephone 323.266.3072 CIK 0001160858 SIC Code
2014 Annual Report. George Weston Limited
 2014 Annual Report George Weston Limited Footnote Legend (1) See non-gaap financial measures beginning on page 52. (2) For financial definitions and ratios refer to the Glossary beginning on page 138.
Canadian Tire Annual Report For days like today. and tomorrow
 Canadian Tire Annual Report 2008 For days like today and tomorrow 2008 Highlights (Dollars in millions, except per share amounts) 2008 1 2007i 2,5 % change Consolidated Retail sales $ 10,614.4 $ 10,084.5
SAFE HARBOR STATEMENT
 1 SAFE HARBOR STATEMENT Forward Looking Statements This press release contains or may contain forward-looking statements made pursuant to the safe harbor provisions of the Private Securities Litigation
AUDITED RESULTS for the year ended 30 September 2017
 AUDITED RESULTS for the year ended 30 September 2017 0 Introductory video WELCOME Jayendra Naidoo CHAIRMAN LISTING 20 September 2017 Ben la Grange CEO 3 STAR LISTING JSE main board listing completed on
A N N UA L R E PORT 2 012
 ANNUAL REPORT 2012 CORPORATE PROFILE Le Château is a leading Canadian specialty retailer offering contemporary fashion apparel, accessories and footwear to style-conscious women and men. Our brand s success
Raymond James Annual Institutional Investors Conference March 7, 2012
 Raymond James Annual Institutional Investors Conference March 7, 2012 Safe Harbor Statement The following information contains forward-looking statements. These forwardlooking statements are based on management
FIRST QUARTER REPORT TO SHAREHOLDERS
 eady Q1 FIRST QUARTER REPORT TO SHAREHOLDERS 12 WEEKS ENDING MARCH 24, 2018 2018 First Quarter Report to Shareholders Management s Discussion and Analysis Financial Results Notes to the Unaudited Interim
Interim Report For the three months ended April 28, 2012
 Interim Report For the three months ended April 28, 2012 To Our Shareholders Sales for the first quarter ended April 28, 2012 decreased 1% to $217,094,000 as compared with $219,296,000 for Reitmans is
MW Report. Getting it Right
 MW Report M E N S W E A R H O U S E 2 0 0 4 A N N U A L R E P O R T Getting it Right Largest specialty retailer of men s tailored apparel Earnings per share rise 53 percent Leader in the national tuxedo
On behalf of the Board of Directors, I am pleased to provide the results of Le Château Inc. for the third quarter ended October 30, 2010.
 interim report For the nine months ended October 30, 2010 MESSAGE TO SHAREHOLDERS On behalf of the Board of Directors, I am pleased to provide the results of Le Château Inc. for the third quarter ended
Making Loblaw the Best Again Annual Report
 Making Loblaw the Best Again 2007 Annual Report 2007 Annual Report (1) : Contents Report to Shareholders 44 Financial Results 1 Management s Discussion and Analysis 85 Glossary of Terms Financial Highlights
GAP INC. REPORTS THIRD QUARTER RESULTS. Delivers Fourth Consecutive Quarter of Positive Comparable Sales Growth, with Positive 3 Percent.
 GAP INC. REPORTS THIRD QUARTER RESULTS Delivers Fourth Consecutive Quarter of Positive Comparable Sales Growth, with Positive 3 Percent. Increases Reported EPS Guidance to a Range of $2.18 to $2.22 for
Investor Presentation
 Investor Presentation Cautionary Note Regarding Forward-Looking Statements This presentation contains forward-looking information, including the Company s statements regarding its future outlook. In addition,
Transformation Update & Financial Results. Q Earnings May 31, 2018
 Transformation Update & Financial Results Q1 2018 Earnings May 31, 2018 Cautionary Statement Regarding Forward-Looking Information This presentation contains forward-looking statements intended to qualify
INVESTOR PRESENTATION
 INVESTOR PRESENTATION Fourth Quarter 2018 Conference call December 5, 2018 at 11:00 am lbcfg.ca1 Caution Regarding Forward-Looking Statements In this document and in other documents filed with Canadian
Investor Presentation
 Investor Presentation Cautionary Note Regarding Forward-Looking Statements This presentation contains forward-looking information, including the Company s statements regarding its future outlook. In addition,
Unless otherwise noted, tabular amounts are in thousands of Canadian dollars.
 MANAGEMENT S DISCUSSION AND ANALYSIS The following management s discussion and analysis ( MD&A ) of financial condition and results of operations is prepared as of February 27, 2018. This discussion should
American Eagle Outfitters Inc.
 March 19, 2015 American Eagle Outfitters Inc. (AEO-NYSE) Current Recommendation SUMMARY DATA NEUTRAL Prior Recommendation Underperform Date of Last Change 06/19/2014 Current Price (03/18/15) $17.04 Target
BLUESTEM GROUP INC Flying Cloud Drive Eden Prairie, Minnesota 55344
 BLUESTEM GROUP INC. 6509 Flying Cloud Drive Eden Prairie, Minnesota 55344 Bluestem Group Inc. Report as of and for the 13- and 26-weeks ended July 31, 2015 and August 1, 2014 This report is issued September
GAP INC. REPORTS THIRD QUARTER RESULTS. Third Quarter Diluted Earnings Per Share Up 11 Percent to $0.80, Including $0.
 GAP INC. REPORTS THIRD QUARTER RESULTS Third Quarter Diluted Earnings Per Share Up 11 Percent to $0.80, Including $0.06 Tax Benefit Net Sales were $3.97 Billion in the Third Quarter; Up 1 Percent on a
UNITED STATES SECURITIES AND EXCHANGE COMMISSION Washington, D.C FORM 8-K
 UNITED STATES SECURITIES AND EXCHANGE COMMISSION Washington, D.C. 20549 FORM 8-K CURRENT REPORT Pursuant to Section 13 or 15(d) of the Securities Exchange Act of 1934 Date of Report (Date of earliest event
SECOND QUARTER REPORT TO SHAREHOLDERS
 eady Q2 SECOND QUARTER REPORT TO SHAREHOLDERS 24 WEEKS ENDING JUNE 16, 2018 2018 Second Quarter Report to Shareholders Management s Discussion and Analysis Financial Results Notes to the Unaudited Interim
Forward-Looking Statements
 Goldman Sachs 13 th Annual Global Retailing Conference 2006 September 6 th, 2006 Forward-Looking Statements Certain statements contained in this presentation are forward-looking statements. Forward-looking
CARA OPERATIONS LIMITED Management s Discussion and Analysis For the years ended December 25, 2016 and December 27, 2015
 CARA OPERATIONS LIMITED Management s Discussion and Analysis For the years ended December 25, 2016 and December 27, 2015 The following Management s Discussion and Analysis ( MD&A ) for Cara Operations
Investment Considerations
 Investment Considerations Schools Specialty s unique attributes provide significant earnings stability and predictability Clear market leader in attractive, fragmented industry Largest product offering
CARA OPERATIONS LIMITED Management s Discussion and Analysis For the years ended December 31, 2017 and December 25, 2016
 CARA OPERATIONS LIMITED Management s Discussion and Analysis For the years ended December 31, 2017 and December 25, 2016 The following Management s Discussion and Analysis ( MD&A ) for Cara Operations
Canadian Tire Corporation, Limited For the year ending January 1, 2005
 Canadian Tire Corporation, Limited For the year ending January 1, 2005 TSX/S&P Industry Class = 25 2004 Annual Revenue = Canadian $7,153.6 million 2004 Year End Assets = Canadian $5,218.6 million Web Page
Forward Looking Statement
 as of 9/15/15 Forward Looking Statement Statements and information included in this presentation that are not purely historical are forward-looking statements within the meaning of the Private Securities
DOLLARAMA REPORTS STRONG RESULTS FOR FOURTH QUARTER AND FULL YEAR FISCAL 2017
 For immediate distribution DOLLARAMA REPORTS STRONG RESULTS FOR FOURTH QUARTER AND FULL YEAR FISCAL 24% increase in quarterly diluted net earnings per common share 10% increase in quarterly cash dividend
GAP INC. REPORTS FIRST QUARTER RESULTS. Reaffirmed Full-Year Earnings per Share Guidance Range of $2.75 to $2.80
 GAP INC. REPORTS FIRST QUARTER RESULTS Reaffirmed Full-Year Earnings per Share Guidance Range of $2.75 to $2.80 Old Navy Delivered Positive 3 Percent Comparable Sales Growth During the First Quarter Distributed
MANAGEMENT S DISCUSSION AND ANALYSIS FOR THE 13 AND 26 WEEKS ENDED NOVEMBER 4, 2017
 MANAGEMENT S DISCUSSION AND ANALYSIS FOR THE 13 AND 26 WEEKS ENDED NOVEMBER 4, 2017 Forward-Looking Information... 1 Overview of the Business... 3 Food Retailing... 3 Summary Results Second Quarter...
Forward Looking Statement
 as of 2/26/2015 Forward Looking Statement Statements and information included in this presentation that are not purely historical are forward-looking statements within the meaning of the Private Securities
Q Quarterly Report
 Q1 2015 Quarterly Report Casper, WY Management s Discussion and Analysis of Financial Condition and Results of Operations of Ritchie Bros. Auctioneers Incorporated for the quarter ended March 31, 2015
CARA OPERATIONS LIMITED Management s Discussion and Analysis For the 13 and 39 weeks ended September 24, 2017
 CARA OPERATIONS LIMITED Management s Discussion and Analysis For the 13 and 39 weeks ended September 24, 2017 The following Management s Discussion and Analysis ( MD&A ) for Cara Operations Limited ( Cara
MAISONS DU MONDE: FULL-YEAR 2018 RESULTS
 PRESS RELEASE MAISONS DU MONDE: FULL-YEAR 2018 RESULTS Strong performance in line with targets Continued solid momentum in online and international sales Focus on strategic pillars to deliver further profitable
Gildan Investor Presentation
 Gildan Investor Presentation National Bank Financial Markets 7 th Annual Quebec Conference Toronto June 7, 2017 Rhodri J. Harries Executive Vice-President, Chief Financial & Administrative Officer Forward-looking
Q3 FISCAL 2019 EARNINGS PRESENTATION. January 18, 2019
 Q3 FISCAL 2019 EARNINGS PRESENTATION January 18, 2019 SAFE HARBOR STATEMENT Certain statements included in this presentation are "forward-looking statements" within the meaning of the federal securities
Investor Overview. March 2019
 Investor Overview March 2019 CAUTIONARY STATEMENT Information included in this presentation may contain statements, including earnings projections, that are forward-looking in nature and, accordingly,
Q4 Report. Three and Twelve Months Ended December 31, 2018
 Q4 Report Three and Twelve Months Ended December 31, 2018 Forward-Looking Statements Certain forward-looking statements may be made in this presentation, including statements regarding possible future
A bold vision of transformation
 A bold vision of transformation SECOND QUARTER REPORT 26 WEEKS ENDING NOVEMBER 4, 2017 QUARTERLY REPORT TO SHAREHOLDERS Empire Company Limited ( Empire or the Company ) is a Canadian company headquartered
FULL YEAR RESULTS 26 TH APRIL 2018
 1 FULL YEAR RESULTS 26 TH APRIL 2018 2 Overview Profit growth in a challenging market Simply Be standout performance Strategic momentum: UK market share gains USA +21% in H2 New partnerships announced
Q4 & Full Year Transformation Update & Financial Results February 2015
 Q4 & Full Year 2014 Transformation Update & Financial Results February 2015 a Agenda Introduction Opening Remarks Financial Results Rob Schriesheim Chief Financial Officer Eddie Lampert Chairman & Chief
W.W. Grainger, Inc. Standard IR Presentation. As of March 1, 2018
 W.W. Grainger, Inc. Standard IR Presentation As of March 1, 2018 Safe Harbor Statement And Non-GAAP Financial Measures Safe Harbor Statement All statements in this communication, other than those relating
Transformation Update & Financial Results. Q Earnings September 13, 2018
 Transformation Update & Financial Results Q2 2018 Earnings September 13, 2018 Cautionary Statement Regarding Forward-Looking Information This presentation contains forward-looking statements intended to
901 S. Central Expressway, Richardson, TX 75080
 901 S. Central Expressway, Richardson, TX 75080 Contact: Investor Relations: Mike Kovar Chief Financial Officer Fossil, Inc. (972) 699-6811 Allison Malkin ICR, Inc. (203) 682-8225 FOSSIL, INC. REPORTS
ONTARIO - SCARBOROUGH TOWN CENTRE ONTARIO - SCARBOROUGH TOWN CENTRE QUEBEC - CARREFOUR LAVAL LADIES QUEBEC - PROMENADES ST-BRUNO
 ANNUAL REPORT 2014 CORPORATE PROFILE Le Château is a leading Canadian specialty retailer offering contemporary fashion apparel, accessories and footwear to style-conscious women and men. Our brand s success
THE POWER OF FIRST QUARTER REPOR T S ENDED AUGU
 THE POWER OF FIRST QUARTER REPOR T S ENDED AUGU QUARTERLY REPORT TO SHAREHOLDERS Empire Company Limited ( Empire or the Company ) is a Canadian company headquartered in Stellarton, Nova Scotia. Empire
HUGO BOSS Investor Day 2013 Financial Strategy. Mr. Mark Langer, Chief Financial Officer November 26, 2013
 HUGO BOSS Investor Day 2013 Financial Strategy Mr. Mark Langer, Chief Financial Officer November 26, 2013 Investor Day 2013 // Financial Strategy HUGO BOSS November 26, 2013 2 / 30 Agenda HUGO BOSS committed
Sears Holdings First Quarter 2018 Pre-Recorded Conference Call Transcript May 31, 2018
 Sears Holdings First Quarter 2018 Pre-Recorded Conference Call Transcript May 31, 2018 Operator: Good day, ladies and gentlemen, and welcome to the Sears Holdings Corp. first quarter 2018 earnings conference
GAP INC. REPORTS FIRST QUARTER RESULTS. Company outlines measures to drive long-term success
 GAP INC. REPORTS FIRST QUARTER RESULTS Company outlines measures to drive long-term success SAN FRANCISCO May 19, 2016 Gap Inc. (NYSE: GPS) today reported first quarter fiscal year 2016 results and provided
Tailored Brands, Inc. Reports Fiscal 2017 Fourth Quarter And Year End Results
 March 14, 2018 Tailored Brands, Inc. Reports Fiscal 2017 Fourth Quarter And Year End Results - Fourth quarter retail segment comparable sales increase 2.5% - FY 2017 GAAP diluted EPS grows 282% Y-o-Y;
INTERIM REPORT RAPPORT INTERMÉDIAIRE
 INTERIM REPORT RAPPORT INTERMÉDIAIRE POUR LES FOR NEUFS THE NINE MOIS MONTHS TERMINÉS ENDED LE 27 OCTOBER OCTOBRE 27, 2018 2018 MESSAGE TO SHAREHOLDERS Dear shareholders, Sales for the third quarter ended
Forward-Looking Statements and Non-GAAP disclosures
 1 Forward-Looking Statements and Non-GAAP disclosures Forward-Looking Statements: Certain information contained in this presentation constitute forward-looking statements under the federal securities laws
Management s Discussion and Analysis
 1. Forward Looking Statements 5 2. Overview 6 3. Vision 6 4. Operating and Financial Strategies 7 5. Key Performance Indicators 8 6. Overall Financial Performance 9 6.1 Business Developments 9 6.2 Consolidated
For personal use only. Investor Presentation November 2012
 Investor Presentation November 2012 Page 2 Cash Converters Overview 28 Years in Business. Deep, experienced management team. MD, Peter Cumins joined in 1990 Network of 708 stores across 18 countries. 106
Investor Update Q1 2015
 Investor Update Q1 2015 Caution re: Forward Looking Statements This presentation provides management with the opportunity to discuss the financial performance and condition of Home Capital Financial Group
Nordstrom Second Quarter 2017 Earnings Achieved Expectations Results Reflected Positive Anniversary Sale, Inventory and Expense Execution
 EX-99.1 2 jwnq22017ex991.htm EX-99.1 Exhibit 99.1 FOR RELEASE: August 10, 2017 at 1:05 PM PDT INVESTOR CONTACT: MEDIA CONTACT: Trina Schurman Nordstrom, Inc. (206) 303-6503 Gigi Ganatra Duff Nordstrom,
ONTARIO - SCARBOROUGH TOWN CENTRE BRITISH COLUMBIA - GUILDFORD TOWN CENTRE ONTARIO - YORKDALE SHOPPING CENTRE QUEBEC - FAIRVIEW POINTE-CLAIRE
 ANNUAL REPORT 20 15 CORPORATE PROFILE Le Château is a leading Canadian specialty retailer offering contemporary fashion apparel, accessories and footwear to style-conscious women and men. Our brand s success
Management s Discussion and Analysis of Financial Condition and Results of Operations of Sleep Country Canada Holdings Inc.
 Management s Discussion and Analysis of Financial Condition and Results of Operations of Sleep Country Canada Holdings Inc. 1 B a s is of P re se nt ation... 1 2 F o r w a r d - l o o ki n g I n f o r
2018 Jefferies Consumer Conference June 19, Trevor Lang EVP and Chief Financial Officer
 2018 Jefferies Consumer Conference June 19, 2018 Trevor Lang EVP and Chief Financial Officer Forward-Looking Statements This presentation and the associated webcast contain forward-looking statements,
SEARS HOLDINGS REPORTS FIRST QUARTER 2018 RESULTS
 Exhibit 99.1 NEWS MEDIA CONTACT: Holdings Public Relations (847) 286-8371 FOR IMMEDIATE RELEASE: May 31, 2018 SEARS HOLDINGS REPORTS FIRST QUARTER 2018 RESULTS HOFFMAN ESTATES, Ill. - Holdings Corporation
INVESTOR UPDATE First Quarter 2016 May 4, 2016
 INVESTOR UPDATE First Quarter 2016 May 4, 2016 Caution re: Forward-looking Statements This presentation provides management with the opportunity to discuss the financial performance and condition of Home
INVESTOR PRESENTATION
 INVESTOR PRESENTATION Fourth Quarter 2017 Conference call December 5, 2017 at 3:30 pm lbcfg.ca 1 Caution Regarding Forward-Looking Statements In this document and in other documents filed with Canadian
W.W. Grainger, Inc. Standard IR Presentation. As of July 18, 2018
 W.W. Grainger, Inc. Standard IR Presentation As of July 18, 2018 Safe Harbor Statement And Non-GAAP Financial Measures Safe Harbor Statement All statements in this communication, other than those relating