Student Loans: Is it Time for Employers to Step In?
|
|
|
- Gilbert Jones
- 5 years ago
- Views:
Transcription


1 Student Loans: Is it Time for Employers to Step In? Michael Doshier, Global Head of Retirement Marketing, Franklin Templeton Investments Cindy Silva, Head of Financial Wellness Strategy, Fidelity Investments Kate Winget, Chief Sales Officer, Gradifi Rachel Collins, Counsel, Congressman Rodney Davis Craig Copeland, Senior Research Associate, EBRI #ebripf83 #CollegeDebt 1
2 Trends in Student Loan Debt, Craig Copeland, EBRI EBRI Policy Forum May 10,
3 Student Loan Debt Overview Incidence Amounts Payments Specific Assets and Student Loan Debt Data Source Survey of Consumer Finances Federal Reserve s triennial survey on family wealth Most comprehensive government survey on American families total wealth Contains all types of wealth including detailed data on all asset and debt types Employee Benefit Research Institute
4 Percentage of Families With Student Loan Debt and Percentage With Student Loan Debt in Repayment Status, % 22.3% 20.0% 19.1% 19.9% 15.0% 10.0% 10.5% 11.6% 11.6% 13.0% 13.4% 8.6% 5.0% 5.8% 0.0% Total Repayment Source: Employee Benefit Research Institute estimates from the 1992, 2001, 2010, 2013, and 2016 Survey of Consumer Finances. Employee Benefit Research Institute
5 Percentage of Families With Student Loan Debt, by Age of Family Head, % 40.0% 40.0% 41.4% 44.8% 35.0% 34.3% 30.0% 25.0% 24.4% 26.0% 26.2% 28.7% 23.7% 20.0% 17.5% 18.4% 15.0% 10.0% 5.0% 0.0% 11.7% 11.9% 12.0% 12.9% 10.7% 9.3% 5.7% 5.2% 2.9% 2.7% 2.1% 2.4% 1.2% 0.4% < or Older Source: Employee Benefit Research Institute estimates from the 1992, 2001, 2010, 2013, and 2016 Survey of Consumer Finances. Employee Benefit Research Institute
6 Percentage of Families With Student Loan Debt, by Family Income Quartile, % 25.8% 24.0% 23.0% 22.9% 23.4% 22.0% 22.4% 20.0% 20.2% 21.6% 18.0% 16.9% 16.0% 15.6% 16.9% 17.4% 14.0% 12.0% 10.0% 8.0% 6.0% 13.1% 13.4% 15.0% 12.6% 12.6% 10.4% 9.5% 9.1% 7.7% Lowest Second Third Highest Source: Employee Benefit Research Institute estimates from the 1992, 2001, 2010, 2013, and 2016 Survey of Consumer Finances. Employee Benefit Research Institute
7 Student Loan Debt Amounts 7
8 Distribution of Student Loan Balances for Families Having Student Loans, by Various Demographic Categories, $80,000 $70,000 $66,318 $72,177 $80,000 $60,000 $50,000 $40,000 $30,000 $20,000 $10,000 $0 $41,984 $41,500 $37,120 $32,054 $34,293 $30,016 $23,463 $23,024 $28,589 $17,529 $19,000 $18,706 $14,369 $11,731 $10,835 $11,751 $6,632 $8,300 $6,187 $5,363 $4,063 $2, th Percentile Median 75th Percentile 90th Percentile Average Source: Employee Benefit Research Institute estimates from the 1992, 2001, 2010, 2013, and 2016 Survey of Consumer Finances. All dollar values are in 2016 dollars. Employee Benefit Research Institute
9 Median Monthly Required Student Loan Debt Payments and Percentage of Income the Debt Payments Represent 9
10 Distribution of Reported Required Family Monthly Student Loan Debt Payments and Distribution of the Percentage of Family Income That the Debt Payments Represent, 2016 $ % Monthly Debt Payment Percentage of Income $ % 10.0% $ % $400 $ % $ % 6.0% $200 $ % 3.1% $200 $350 $ % 2.0% $100 $0 25th Percentile Median 75th Percentile 90th Percentile Average Source: Employee Benefit Research Institute estimates of the 2016 Survey of Consumer Finances. 0.0% Employee Benefit Research Institute
11 $250 Required Median Monthly Student Loan Debt Payments and Percentage of Income That the Debt Payments Represented, by Family Head Age, % 4.0% Median Monthly Payment Percentage of Family Income 4.0% $ % 2.9% 3.1% 3.5% 3.0% $ % $100 $200 $200 $200 $ % 2.0% 1.5% $50 $ % 0.5% $0 < or Older Source: Employee Benefit Research Institute estimates of the 2016 Survey of Consumer Finances. 0.0% Employee Benefit Research Institute
12 Specific Assets and Student Loan Debt Home Ownership DC Plans 12
13 Percentage of Families Who Own a Home and Have a Positive DC Balance, by Student Loan Incidence and Age of Family Head, % 70.0% With Student Loan Without Student Loan 65.8% 69.7% 60.0% 52.7% 50.0% 40.0% 30.0% 35.2% 31.5% 40.4% 28.6% 44.8% 20.0% 10.0% 0.0% Home Ownership Positive DC Balance Home Ownership Positive DC Balance Younger than Age 35 Ages Source: Employee Benefit Research Institute estimates from the 2016 Survey of Consumer Finances. Employee Benefit Research Institute
14 $500,000 Distribution of DC Plan Balances for Families With and Without Student Loans, Families With Heads of Specific Ages, 2016 $500,000 $450,000 $400,000 $410,000 $350,000 $300,000 $250,000 $227,000 $200,000 $150,000 $100,000 $50,000 $0 $148,100 $90,000 $80,000 $62,000 $46,000 $38,000 $16,000 $18,000 $24,000 $2,400 $3,000 $8,000 $11,000 25th Percentile Median 75th Percentile 90th Percentile Younger than Age 35 with Student Loan Age with Student Loan Younger than Age 35 without Student Loan Age without Student Loan Source: Employee Benefit Research Institute estimates from the 2016 Survey of Consumer Finances. Employee Benefit Research Institute
15 Percentage of Families With Heads Younger Than Age 35 and Having Some College That Own a Home and Have a Positive Defined Contribution Balance, by Student Loan Incidence, % 35% With Student Loan No Student Loan 36.3% 30% 25% 27.3% 26.5% 24.9% 20% 15% 10% 5% 0% Home Ownership Positive Defined Contribution Balance Source: Employee Benefit Research Institute estimates of the 2016 Survey of Consumer Finances. Employee Benefit Research Institute
16 $25,000 Distribution of Defined Contribution Balances for Families With Heads Ages Younger Than 35 and Some College, by Student Loan Incidence, 2016 With Student Loan No Student Loan $23,200 $21,490 $20,000 $15,000 $15,300 $16,667 $10,000 $10,000 $5,000 $1,600 $3,000 $4,700 $0 25th Percentile Median 75th Percentile Average Source: Employee Benefit Research Institute estimates of the 2016 Survey of Consumer Finances. Employee Benefit Research Institute
17 Takeaways The incidence of student loan debt has been growing significantly (nearly doubling since 2001), particularly among families with heads younger than age 35 and ages The average student loan debt amount increased in real amounts by 20% from 2010 to 2016, and the median increased 32%. The required median debt payment was $200 in 2016, which represented 3.1% of family income. However, these payments reach 10 percent and above of family income for those with the highest debt payments. DC balances are lower for those with student loan debt than for those without it. Employee Benefit Research Institute
18 th Street NW Washington, D.C Employee Benefit Research Institute
19 EBRI-ERF Policy Forum #83 Retirement, Health and Financial Wellbeing Thursday, May 10, 2018 Wireless Network: DCCTR Wireless Password: meeting2015dc Tweet: #ebripf83 Employee Benefit Research Institute

20 EBRI Policy Forum K AT E W I NG ET
21 Debt directly impacts your employees and their performance 80% of working professionals with student debt consider their student debt to be a source of significant or very significant stress. Four out of five employers report that their employee s personal financial issues impact their job performance resulting in: Which translates to real costs for employers: H o u r s a month are utilized by an estimated 80% of employees who try to deal with their financial worries at work % of millennials that like their job are still planning to leave in the next three years % Turnover costs up to % of an employee s annual salary $30.5B Millennial turnover alone is estimated to cost the U.S. economy $30.5 billion Corporate culture and benefits packages must be tailored to engage the needs of Millennials and give them reasons to stay
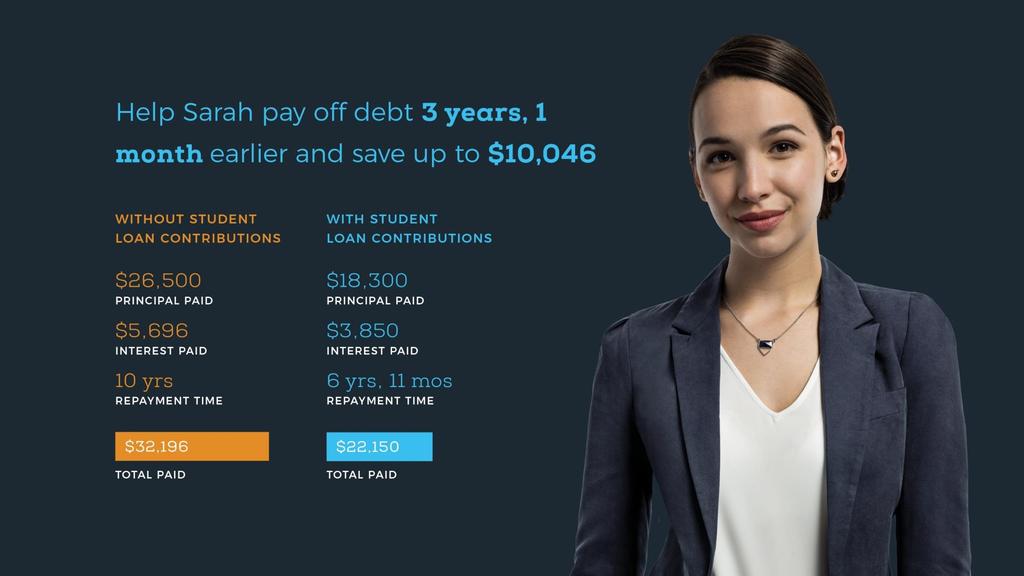
22 Debt is not a one size fits all problem, and our solutions shouldn t be either Budget: $7.500/employee Goal Target Plan Retention Attraction Diversity Competitive Talent Hire Millennials Mid-level management Master s preferred Women & Minorities High value employees with specialized training $100/month benefit 6 years $200/month benefit 3 years $100/month benefit Increase of $100/year 3 years One time hiring bonus of $7,200 after 1 year of employment
23
IRA SPENDDOWN. Craig Copeland, EBRI EBRI Policy Forum December 13, 2018
 IRA SPENDDOWN Craig Copeland, EBRI EBRI Policy Forum December 13, 2018 EBRI IRA DATABASE Annual data from 2010-2016 Cross sectional and longitudinal data (accounts are linked across years for those that
Individual Account Retirement Plans: An Analysis of the 2016 Survey of Consumer Finances
 March 13, 2018 No. 445 Individual Account Retirement Plans: An Analysis of the 2016 Survey of Consumer Finances By Craig Copeland, Employee Benefit Research Institute A T A G L A N C E Individual account
Perceived Helpfulness of Financial Well-being Programs: Results From the 2017 and 2018 Retirement Confidence Surveys
 September 2010 No. 346 August 20, 2018 No. 457 Perceived Helpfulness of Financial Well-being Programs: Results From the 2017 and 2018 Retirement Confidence Surveys By Craig Copeland, Ph.D., Employee Benefit
Debt of the Elderly and Near Elderly,
 March 5, 2018 No. 443 Debt of the Elderly and Near Elderly, 1992 2016 By Craig Copeland, Ph.D., Employee Benefit Research Institute A T A G L A N C E Much of the attention to retirement preparedness focuses
SPECIAL CONSIDERATIONS WOMEN FACE IN RETIREMENT SECURITY
 SPECIAL CONSIDERATIONS WOMEN FACE IN RETIREMENT SECURITY 2019 EBRIEFING SERIES FEBRUARY 6, 2019 SPECIAL CONSIDERATIONS WOMEN FACE IN RETIREMENT SECURITY Jack VanDerhei Research Director, EBRI The Cost
Individual Retirement Account Balances, Contributions, Withdrawals, and Asset Allocation Longitudinal Results : The EBRI IRA Database
 September Jan. 10, 2018 2010 No. No. 346 440 Individual Retirement Account Balances, Contributions, Withdrawals, and Asset Allocation Longitudinal Results 2010 2015: The EBRI IRA Database By Craig Copeland,
Individual Retirement Account Balances, Contributions, Withdrawals, and Asset Allocation Longitudinal Results : The EBRI IRA Database
 September 2010 No. 346 September 2010 No. 346 October 22, 2018 No. 462 Individual Retirement Account Balances, Contributions, Withdrawals, and Asset Allocation Longitudinal Results 2010 2016: The EBRI
Total Individual Account Retirement Plan Assets, by Demographics, 2004, p. 2 New Publications and Internet Sites, p. 9
 NOTES Total Individual Account Retirement Plan Assets, by Demographics, 2004, p. 2 New Publications and Internet Sites, p. 9 Executive Summary: March 2008, Vol. 29, No. 3 Total Individual Account Retirement
IRA Withdrawals, 2011, p. 2 Employer and Worker Contributions to Health Reimbursement Arrangements and Health Savings Accounts, , p.
 February 2014 Vol. 35, No. 2 IRA Withdrawals, 2011, p. 2 Employer and Worker Contributions to Health Reimbursement Arrangements and Health Savings Accounts, 2006 2013, p. 12 A T A G L A N C E IRA Withdrawals,
RETIREMENT PLAN COVERAGE AND SAVING TRENDS OF BABY BOOMER COHORTS BY SEX: ANALYSIS OF THE 1989 AND 1998 SCF
 PPI PUBLIC POLICY INSTITUTE RETIREMENT PLAN COVERAGE AND SAVING TRENDS OF BABY BOOMER COHORTS BY SEX: ANALYSIS OF THE AND SCF D A T A D I G E S T Introduction Over the next three decades, the retirement
IRA Balances and Contributions: An Overview of the EBRI IRA Database TM
 September 2010 No. 346 IRA Balances and Contributions: An Overview of the EBRI IRA Database TM By Craig Copeland, Employee Benefit Research Institute E X E C U T I V E S U M M A R Y NEW IRA DATABASE: The
The State of Employee Benefits: Findings From the 2018 Health and Workplace Benefits Survey
 January 10, 2019 No. 470 The State of Employee Benefits: Findings From the 2018 Health and Workplace Benefits Survey By Lisa Greenwald, Greenwald & Associates, and Paul Fronstin, Ph.D., Employee Benefit
EBRI Retirement Security Projection Model (RSPM) Analyzing Policy and Design Proposals
 Analyzing Policy and Design Proposals") May 31, 2018 No. 451 EBRI Retirement Security Projection Model (RSPM) Analyzing Policy and Design Proposals By Jack VanDerhei, Ph.D., Employee Benefit Research Institute A T A G L A N C E At various times,
May 31, 2018 No. 451 EBRI Retirement Security Projection Model (RSPM) Analyzing Policy and Design Proposals By Jack VanDerhei, Ph.D., Employee Benefit Research Institute A T A G L A N C E At various times,
A T A G L A N C E. Workers with employee-only coverage did not increase their own contributions, but those with family coverage did.
 February 2013 Vol. 34, No. 2 Debt of the Elderly and Near Elderly, 1992 2010, p. 2 Employer and Worker Contributions to Health Reimbursement Arrangements and Health Savings Accounts, 2006 2012, p. 16 A
Minority Workers Remain Confident About Retirement, Despite Lagging Preparations and False Expectations
 Issue Brief No. 306 June 2007 Minority Workers Remain Confident About Retirement, Despite Lagging Preparations and False Expectations by Ruth Helman, Mathew Greenwald & Associates; Jack VanDerhei, Temple
The distribution of wealth in the United States and implications for a net worth tax
 The distribution of wealth in the United States and implications for a net worth tax March 2019 By Greg Leiserson, Will McGrew, and Raksha Kopparam Wealth inequality in the United States is high and has
February 2007, Vol. 28, No. 2. Retirement Plan Participation and Asset Allocation, 2004, p. 2 New Publications and Internet Sites, p.
 NOTES Retirement Plan Participation and Asset Allocation, 2004, p. 2 New Publications and Internet Sites, p. 9 Executive Summary: February 2007, Vol. 28, No. 2 Updating previous EBRI research: This article
Funding Savings Needed for Health Expenses For Persons Eligible for Medicare
 December 2010 No. 351 Funding Savings Needed for Health Expenses For Persons Eligible for Medicare By Paul Fronstin, Dallas Salisbury, and Jack VanDerhei, Employee Benefit Research Institute E X E C U
Estimating the Value of Changes in OASI Benefits Under Social Security Reforms, p. 2 New Publications and Internet Sites, p. 11
 NOTES Estimating the Value of Changes in OASI Benefits Under Social Security Reforms, p. 2 New Publications and Internet Sites, p. 11 Executive Summary: June 2006, Vol. 27, No. 6 Estimating the Value of
Collective Investment Trusts The Fastest Growing Investment Vehicle Within 401(k) Plans Alex Kahn, Investment Analyst
 Plans Alex Kahn, Investment Analyst") August 2018 Collective Investment Trusts The Fastest Growing Investment Vehicle Within 401(k) Plans Alex Kahn, Investment Analyst For almost a century, collective investment trusts (CITs) have played an
August 2018 Collective Investment Trusts The Fastest Growing Investment Vehicle Within 401(k) Plans Alex Kahn, Investment Analyst For almost a century, collective investment trusts (CITs) have played an
IRA Withdrawals in 2013 and Longitudinal Results , p. 2
 July 2015 Vol. 36, No. 7 IRA Withdrawals in 2013 and Longitudinal Results 2010 2013, p. 2 A T A G L A N C E IRA Withdrawals in 2013 and Longitudinal Results 2010 2013, by Craig Copeland, Ph.D., EBRI Just
Labor Force Participation Rates by Age and Gender and the Age and Gender Composition of the U.S. Civilian Labor Force and Adult Population
 May 8, 2018 No. 449 Labor Force Participation Rates by Age and Gender and the Age and Gender Composition of the U.S. Civilian Labor Force and Adult Population By Craig Copeland, Employee Benefit Research
IN THE RED: SOCIAL WORKERS AND EDUCATIONAL DEBT
 [REPORT] National Association of Social Workers MEMBERSHIP WORKFORCE STUDY IN THE RED: SOCIAL WORKERS AND EDUCATIONAL DEBT NASW NATIONAL ASSOCIATION OF SOCIAL WORKERS Elvira Craig de Silva, DSW, ACSW NASW
$40K $35K $30K $25K $20K $15K $10K $5K $K
 Net Spenders: 25th Percentile of Investable Assets (Average of $2,786 in investable wealth at age 65 69.9) $40K $35K $30K $25K $20K $15K $10K $5K $K 55-59.9 60-64.9 65-69.9 70-74.9 75-79.9 80-84.9 85+
Retirement Savings 2.0: Updating Savings Policy for the Modern Economy
 T-181 United States Senate Committee on Finance Hearing on: Retirement Savings 2.0: Updating Savings Policy for the Modern Economy Tuesday, September 16, 2014, 10:00 AM 215 Dirksen Senate Office Building
Testimony Submission for the Record. House Ways and Means Committee
 Testimony Submission for the Record House Ways and Means Committee Hearing on: Economic Challenges Facing Middle Class Families Jan. 31, 2007, 2 p.m. 1100 Longworth HOB Submitted by: Dallas Salisbury,CEO
Trends. o The take-up rate (the A T A. workers. Both the. of workers covered by percent. in Between cent to 56.5 percent.
 April 2012 No o. 370 Employment-Based Health Benefits: Trends in Access and Coverage, 1997 20100 By Paul Fronstin, Ph.D., Employeee Benefit Research Institute A T A G L A N C E Since 2002 the percentage
Use of Target-Date Funds in 401(k) Plans, 2007
 Plans, 2007") March 2009 No. 327 Date Funds in 401(k) Plans, 2007 By Craig Copeland, EBRI E X E C U T I V E S U M M A R Y WHAT THEY ARE: Target-date funds (also called life-cycle funds) are a type of mutual fund that
March 2009 No. 327 Date Funds in 401(k) Plans, 2007 By Craig Copeland, EBRI E X E C U T I V E S U M M A R Y WHAT THEY ARE: Target-date funds (also called life-cycle funds) are a type of mutual fund that
KEY FINDING: COUPLES AND DEBT
 TOP FINDINGS FROM THE 2018 FIDELITY INVESTMENTS A FEW WORDS ABOUT THE STUDY The 2018 Fidelity Investments Couples & Money Study analyzes retirement and financial expectations and preparedness among 1,662
Building Wealth for Families and Employees
 Building Wealth for Families and Employees Grow Our Own Summit Marshall, MN November 8, 2018 Ray Boshara* Senior Advisor; Director, Center for Household Financial Stability Federal Reserve Bank of St.
Student Debt. A huge burden that may be weighing down your workforce. August Fidelity Benefits Consulting. What s Inside
 Fidelity Benefits Consulting Student Debt A huge burden that may be weighing down your workforce. August 2018 What s Inside You may think that student loan debt is a problem that affects only younger workers,
IRA Withdrawals: How Much, When, and Other Saving Behavior, p. 9
 May 2013 Vol. 34, No. 5 Trends in Health Coverage for Part-Time Workers, p. 2 IRA Withdrawals: How Much, When, and Other Saving Behavior, p. 9 A T A G L A N C E Trends in Health Coverage for Part-Time
2018 Retirement Confidence Survey
 2018 Retirement Confidence Survey April 24, 2018 Employee Benefit Research Institute 1100 13 th Street NW, Suite 878 Washington, DC 20005 Phone: (202) 659-0670 Fax: (202) 775-6312 Greenwald & Associates
Retirement Age Expectations of Older Americans Between 2006 and 2010, p. 2
 December 2011 Vol. 32, No. 12 Retirement Age Expectations of Older Americans Between 2006 and 2010, p. 2 Variation in Public Opinion on the Future of Employment- Based Health Benefits: Findings From the
STABILITY AMID CHANGE Benefits in State and Local Government. Insights from MetLife s 14th Annual. U.S. Employee Benefit Trends Study
 STABILITY AMID CHANGE Benefits in State and Local Government Insights from MetLife s 14th Annual U.S. Employee Benefit Trends Study 14th Annual U.S. Employee Benefit Trends Study PEACE OF MIND IN TIMES
Savings Medicare Beneficiaries Need for Health Expenses: Some Couples Could Need as Much as $400,000, Up From $370,000 in 2017
 September 2010 No. 346 October 8, 2018 No. 460 Savings Medicare Beneficiaries Need for Health Expenses: Some Couples Could Need as Much as $400,000, Up From $370,000 in 2017 By Paul Fronstin, Ph.D., and
INCREASING FINANCIAL SECURITY WITH WORKPLACE EMERGENCY SAVINGS
 INCREASING FINANCIAL SECURITY WITH WORKPLACE EMERGENCY SAVINGS Phil Waldeck President Prudential Retirement Snezana Zlatar Senior Vice President Full Service Solutions Product & Business Management Prudential
How Retirement Readiness Varies by Gender and Family Status: A Retirement Savings Shortfall Assessment of Gen Xers
 January 17, 2019 No. 471 How Retirement Readiness Varies by Gender and Family Status: A Retirement Savings Shortfall Assessment of Gen Xers By Jack VanDerhei, Ph.D., Employee Benefit Research Institute
2017 Workplace Benefits Report
 RETIREMENT & BENEFIT PLAN SERVICES 2017 Workplace Benefits Report Insight for employers to drive employee engagement and empower them to pursue their best financial lives 2017 WORKPLACE BENEFITS REPORT
Student debt: Everyone s concern
 PAGE 1 Student debt: Everyone s concern cross the workforce, employees are struggling to make education-related financial decisions. Whether it s repaying debt they have accumulated for themselves or trying
Lump-Sum Distributions at Job Change, Distributions Through 2012, p. 2
 November 2013 Vol. 34, No. 11 Lump-Sum Distributions at Job Change, Distributions Through 2012, p. 2 A T A G L A N C E Lump-Sum Distributions at Job Change, Distributions Through 2012, by Craig Copeland,
TOP FINDINGS FROM THE
 TOP FINDINGS FROM THE 2018 Fidelity Investments New Year Financial Resolutions Study A FEW WORDS ABOUT THE STUDY The Fidelity Investments New Year Financial Resolutions Study was designed to explore attitudes
Retiree health savings
 Addressing workforce challenges and employee concerns Healthcare costs in retirement are a top concern for Americans. Unfortunately, overall employer benefit offerings haven t kept pace with employee and
2005 Survey of Owners of Non-Qualified Annuity Contracts
 2005 Survey of Owners of Non-Qualified Annuity Contracts Conducted by The Gallup Organization and Mathew Greenwald & Associates for The Committee of Annuity Insurers 2 2005 SURVEY OF OWNERS OF NON-QUALIFIED
Savings Needed for Health Expenses for People Eligible for Medicare: Some Rare Good News, p. 2 IRA Asset Allocation, 2010, p. 8
 October 2012 Vol. 33, No. 10 Savings Needed for Health Expenses for People Eligible for Medicare: Some Rare Good News, p. 2 IRA Asset Allocation, 2010, p. 8 A T A G L A N C E Savings Needed for Health
US Household Ownership of Mutual Funds in Most Mutual Fund Owners Are Educated and in Their Prime Earning Years
 ICI RESEARCH PERSPECTIVE 1401 H STREET, NW, SUITE 1200 WASHINGTON, DC 20005 202-326-5800 WWW.ICI.ORG OCTOBER 2016 VOL. 22, NO. 7 WHAT S INSIDE 2 US Household Ownership of Mutual Funds in 2016 2 Most Mutual
Savings Medicare Beneficiaries Need for Health Expenses: Some Couples Could Need as Much as $370,000, Up from $350,000 in 2016
 Dec. 20, 2017 Vol. 38, No. 10 Savings Medicare Beneficiaries Need for Health Expenses: Some Couples Could Need as Much as $370,000, Up from $350,000 in 2016 by Paul Fronstin, Ph.D., and Jack VanDerhei,
ACFAS Compensation and Benefits Survey Results Spring 2012
 ACFAS Compensation and Benefits Survey Results Spring 2012 The 2012 ACFAS Compensation and Benefits Survey was conducted in Spring 2012 as part of the College s triennial Practice Economics Survey. The
NOTES. June 2008, Vol. 29, No. 6. Executive Summary:
 NOTES Benefit Cost Comparisons Between State and Local Governments and Private-Sector Employers, p. 2 The Number of Individual Account Retirement Plans Owned by American Families, p. 6 New Publications
State Profile: Michigan
 State Perspectives Michigan Indicators: Aging & Work State Profile Series March, 2008 By: Michelle Wong with Tay McNamara, Sandee Shulkin, Chelsea Lettieri and Vanessa Careiro Sponsored by: Quick Fact
The State of Employee Benefits: Findings from the 2017 Health and Workplace Benefits Survey
 April 10, 2018 No. 448 The State of Employee Benefits: Findings from the 2017 Health and Workplace Benefits Survey By Paul Fronstin, Employee Benefit Research Institute, and Lisa Greenwald, Greenwald &
How long will Baby Boomers and Gen Xers need to work for a 50, 70, and 80 percent probability of adequate retirement income?
 How long will Baby Boomers and Gen Xers need to work for a 50, 70, and 80 percent probability of adequate retirement income? Jack VanDerhei and Craig Copeland, EBRI Is There a Future for Retirement? EBRI-ERF
The Impact of Auto- enrollment and Automatic Contribution Escalation on Retirement Income Adequacy
 The Impact of Auto- enrollment and Automatic Contribution Escalation on Retirement Income Adequacy By Jack VanDerhei, Employee Benefit Research Institute, and Lori Lucas, Callan Associates New Simulation
A T A G L A N C E. The Gap Between Expected and Actual Retirement: Evidence From Longitudinal Data, by Sudipto Banerjee, Ph.D.
 November 2014 Vol. 35, No. 11 Views on the Value of Voluntary Workplace Benefits: Findings from the 2014 Health and Voluntary Workplace Benefits Survey, p. 2 The Gap Between Expected and Actual Retirement:
2016 In-House Counsel Compensation Report
 2016 In-House Counsel Compensation Report Building World-Class Legal & Compliance Departments Table of Contents Introduction 2 Key Compensation Trends 3 Survey Design 4 Data Methods & Analysis 5 Survey
Aging Seminar Series:
 Aging Seminar Series: Income and Wealth of Older Americans Domestic Social Policy Division Congressional Research Service November 19, 2008 Introduction Aging Seminar Series Focus on important issues regarding
FINANCIAL WELLNESS: A PRIORITY FOR FINANCIAL SERVICES. January 18, 2018
 FINANCIAL WELLNESS: A PRIORITY FOR FINANCIAL SERVICES January 18, 2018 Boston Research Technologies conducted an online survey with a national sample of 1,242 employees who responded between September
Social Security, Pensions and Politics: National Directions
 Social Security, Pensions and Politics: National Directions Dallas L. Salisbury Employee Benefit Research Institute www.ebri.org EBRI Mission To contribute to, to encourage, and to enhance the development
Characteristics of Low-Wage Workers and Their Labor Market Experiences: Evidence from the Mid- to Late 1990s
 Contract No.: 282-98-002; Task Order 34 MPR Reference No.: 8915-600 Characteristics of Low-Wage Workers and Their Labor Market Experiences: Evidence from the Mid- to Late 1990s Final Report April 30, 2004
Employee Tenure Trends, , p. 2
 Sept. 20, 2017 Vol. 38, No. 9 Employee Tenure Trends, 1983 2016, p. 2 A T A G L A N C E This study examines employee-tenure data of American workers. It uses U.S. Census Bureau data from the Current Population
IMPROVING EMPLOYEE ENGAGEMENT THROUGH FINANCIAL WELLNESS
 IMPROVING EMPLOYEE ENGAGEMENT THROUGH FINANCIAL WELLNESS W H I T E P A P E R 3% Have financial well-being strategy but no physical well-being strategy 27% Physical well-being initiative but no financial
Trends in Health Coverage for Part-Time Workers, ,
 May 2014 Vol. 35, No. 5 Trends in Health Coverage for Part-Time Workers, 1999 2012, p. 2 Take it or Leave it? The Disposition of DC Accounts: Who Rolls Over into an IRA? Who Leaves Money in the Plan and
Defined Contribution Plan Participants Activities, 2017
 ICI RESEARCH REPORT Defined Contribution Plan Participants Activities, 2017 MAY 2018 The Investment Company Institute (ICI) is the leading association representing regulated funds globally, including mutual
Increasing Challenges in Workforce Dynamics
 Trend: A large segment of the workforce is approaching retirement in the near future and there is a gap in attracting and retaining new talent and transferring institutional knowledge and expertise. There
MOVING THE NEEDLE ON EMPLOYEE FINANCIAL WELLNESS
 HEALTH WEALTH CAREER FINDINGS FROM MERCER CANADA'S INSIDE EMPLOYEES' MINDS SURVEY MOVING THE NEEDLE ON EMPLOYEE PRACTICAL STEPS FOR CANADIAN EMPLOYERS 2 THE CHALLENGE OF EMPLOYEE A GROWING NUMBER OF EMPLOYERS
Challenges to Successful Later Retirement
 ANNA RAPPAPORT CONSULTING STRATEGIES FOR A SECURE RETIREMENT SM Challenges to Successful Later Retirement EBRI Policy Forum Anna Rappaport May 2011 Agenda Disability benefit issues Findings from research
The Impact of the Recession on Employment-Based Health Coverage
 May 2010 No. 342 The Impact of the Recession on Employment-Based Health Coverage By Paul Fronstin, Employee Benefit Research Institute E X E C U T I V E S U M M A R Y HEALTH COVERAGE AND THE RECESSION:
Work in the New Retirement
 Work in the New Retirement Society of Actuaries Building the Foundation for New Retirement Systems A Retirement 20/20 Conference September 28-29, 29, 2006 Sara E. Rix, Ph.D. AARP Public Policy Institute
The 2011 Retirement Confidence Survey: Confidence Drops to Record Lows, Reflecting the New Normal
 March 2011 No. 355 The 2011 Retirement Confidence Survey: Confidence Drops to Record Lows, Reflecting the New Normal By Ruth Helman, Mathew Greenwald & Associates, and Craig Copeland and Jack VanDerhei,
More & More Americans Having to Work Past Age 70
 More & More Americans Having to Work Past Age 70 July 18, 2017 by Gary Halbert of Halbert Wealth Management 1. Almost One-Fifth of Americans Are Working Past Age 70 2. Seniors, There s No Guarantee of
State Perspectives. Kansas Indicators: Aging & Work years 23.2% 41.6 years 66.3% 25.1% 3.0%
 State Perspectives Kansas Indicators: Aging & Work State Profile Series February, 2008 By: Michelle Wong with Tay McNamara, Sandee Shulkin, Chelsea Lettieri and Vanessa Careiro Sponsored by: Quick Fact
State Profile: South Carolina
 State Perspectives State Profile Series South Carolina Indicators: Aging & Work April, 2008 By: Michelle Wong with Tay McNamara, Sandee Shulkin, Chelsea Lettieri and Vanessa Careiro Sponsored by: Quick
EBRI EMPLOYEE BENEFIT RESEARCH INSTITUTE
 EBRI EMPLOYEE BENEFIT RESEARCH INSTITUTE T-119 Statement Before the Committee on Ways and Means Subcommittee on Health U.S. House of Representatives Hearing on Uninsured Americans by Paul Fronstin, Ph.D.
2017 Gender Pay. 4 April 2018
 2017 Gender Pay 4 April 2018 2017 Gender pay gap: Summary The statutory Gender Pay Gap Reporting analysis, which is provided in accordance with statutory reporting requirements, illustrates the gap between
U.S. Household Savings for Retirement in 2010
 U.S. Household Savings for Retirement in 2010 John J. Topoleski Analyst in Income Security April 30, 2013 CRS Report for Congress Prepared for Members and Committees of Congress Congressional Research
2015 Retirement Webinar Series. Prepared by Aon Hewitt Retirement and Investment
 2015 Retirement Webinar Series Prepared by Aon Hewitt Retirement and Investment 2015 Hot Topics in Retirement Results Rob Austin, Director of Retirement Research Byron Beebe, US Retirement Market Leader
The Impact of Repealing PPACA on Savings Needed for Health Expenses for Persons Eligible for Medicare, p. 2
 August 2011 Vol. 32, No. 8 The Impact of Repealing PPACA on Savings Needed for Health Expenses for Persons Eligible for Medicare, p. 2 The Importance of Defined Benefit Plans for Retirement Income Adequacy,
Rethinking Retirement:
 Rethinking Retirement: Moving Ahead Without Leaving Anyone Behind EVENT SUMMARY National Press Club Washington, D.C. July 26, 2013 Randy Johnson, senior vice president of Labor, Immigration & Employee
The Benefits of Building a Financially Savvy Workforce
 The Benefits of Building a Financially Savvy Workforce Leveraging the Power of Fidelity for Your Financial Wellness Programs FIDELITY DESIGNATED B R O KERA GE S E R VIC ES A 2012 survey on financial literacy
Written Statement for the. Subcommittee on Long-Term Growth and Debt Reduction. Senate Committee on Finance
 T-146 Written Statement for the Subcommittee on Long-Term Growth and Debt Reduction Senate Committee on Finance Hearing on: Small Business Pension Plans: How Can We Increase Worker Coverage? Thursday,
Gen Y Insights and Engagement. Mike Noetzel, Managing Director, Relationship Management Betsy Palmer, Senior Vice President, Corporate Communications
 Gen Y Insights and Engagement Mike Noetzel, Managing Director, Relationship Management Betsy Palmer, Senior Vice President, Corporate Communications July 17, 2013 TIAA-CREF: Who we are TIAA-CREF is a leading
Percentiles One way to look at quartile points is to say that, for a sorted list of values, Q 1 is the value that has 25% of the rest of the values
 Percentiles One way to look at quartile points is to say that, for a sorted list of values, Q 1 is the value that has 25% of the rest of the values that are less than it, Q 2 is the value that has 50%
By Jack VanDerhei, Ph.D., Employee Benefit Research Institute
 June 2013 No. 387 Reality Checks: A Comparative Analysis of Future Benefits from Private-Sector, Voluntary-Enrollment 401(k) Plans vs. Stylized, Final-Average-Pay Defined Benefit and Cash Balance Plans
ICI RESEARCH PERSPECTIVE
 ICI RESEARCH PERSPECTIVE 1401 H STREET, NW, SUITE 1200 WASHINGTON, DC 20005 202-326-5800 WWW.ICI.ORG OCTOBER 2017 VOL. 23, NO. 8 WHAT S INSIDE 2 US Household Ownership of Mutual Funds in 2017 2 Most Mutual
State Profile: Iowa. Iowa Indicators: Aging & Work. State Perspectives. State Profile Series. Quick Fact Check for Iowa.
 State Perspectives Iowa Indicators: Aging & Work State Profile Series January, 2008 By: Michelle Wong with Tay McNamara, Sandee Shulkin, Chelsea Lettieri and Vanessa Careiro Sponsored by: Quick Fact Check
Research fundamentals
 Research fundamentals 1401 H Street, NW, Suite 1200 Washington, DC 20005 202/326-5800 www.ici.org January 2008 Vol. 17, No. 1 The Role of IRAs in U.S. Households Saving for Retirement Key Findings Four
Insights: Financial Capability. Gender, Generation and Financial Knowledge: A Six-Year Perspective. Women, Men and Financial Literacy
 Insights: Financial Capability March 2018 Author: Gary Mottola, Ph.D. FINRA Investor Education Foundation What s Inside: Women, Men and Financial Literacy 1 Gender Differences in Investor Literacy 4 Self-Assessed
Are Your Employees Ready for Retirement?
 Are Your Employees Ready for Retirement? March 2019 Prepared by Aon Presentation to Financial Executives International Aon s Innovative Thought Leadership 2018 Retirement Income Adequacy Study Measures
9/4/2018. Start with Why. Financial Wellbeing. The reasons employers are investing in wellbeing are shifting. Rebecca Kruske September 2018
 Rebecca Kruske September 2018 Financial Wellbeing 2 Start with Why The reasons employers are investing in wellbeing are shifting 1. Reducing healthcare costs (60%) 2. Creating a desirable culture (43%)
Paying Bills Late. Health Coverage Getting it, Paying for it, Administering it
 Opinion Research Corporation Consumer Economic Survey Commissioned by ehealthinsurance Summary of Results and Observations Date of Survey: March 14-17, 2008 Paying Bills Late Respondents under the age
Entry Form 2017 Annual Awards for Program Excellence
 Entry Form 2017 Annual Awards for Program Excellence Entry Deadline: Thursday, June 15, 2017, Midnight ET Each entry must include a completed entry form. Please complete a form for each entry your HFA
CHAPTER 16 INDIVIDUAL RETIREMENT ACCOUNTS
 CHAPTER 16 INDIVIDUAL RETIREMENT ACCOUNTS Introduction Through the enactment of the Employee Retirement Income Security Act of 1974 (ERISA), Congress established individual retirement accounts (IRAs) to
United States Senate Committee on Finance Subcommittee on Social Security, Pensions, and Family Policy
 T-176 United States Senate Committee on Finance Subcommittee on Social Security, Pensions, and Family Policy Hearing on: Retirement Savings for Low-Income Workers Wednesday, February 26, 2014, 10:00 AM
EBRI EMPLOYEE BENEFIT RESEARCH INSTITUTE
 T-107 EBRI EMPLOYEE BENEFIT RESEARCH INSTITUTE Testimony of Dallas L. Salisbury President, Employee Benefit Research Institute (EBRI) Chairman, American Savings Education Council (ASEC) Before The House
The Growing Impact of Student Loan Debt on Retirement Security
 The Growing Impact of Student Loan Debt on Retirement Security Women s Institute for a Secure Retirement June 28, 2016 James Mahaney, Vice President Strategic Initiatives Younger Households Already at
The Ryan Medicare Plan: Winners and Losers
 The Ryan Medicare Plan: Winners and Losers Dean Baker and David Rosnick April 2011 Center for Economic and Policy Research 1611 Connecticut Avenue, NW, Suite 400 Washington, D.C. 20009 202 293 5380 www.cepr.net
THE COLLEGE DEBT/ RETIREMENT SAVINGS BIND
 THE COLLEGE DEBT/ RETIREMENT SAVINGS BIND INVESTOR PROTECTION INSTITUTE SEPTEMBER 17, 2015 Overview of Key Findings (1) Key findings of the Investor Protection Institute College Debt/Retirement Savings
Retirement Security: What s Working and What s Not? James Poterba MIT, NBER, & TIAA-CREF. Bipartisan Policy Center 30 July 2014
 Retirement Security: What s Working and What s Not? James Poterba MIT, NBER, & TIAA-CREF Bipartisan Policy Center 30 July 2014 Retirement Support: A Three Legged Stool? Three Legs: Social Security, Private
Missouri local government. Missouri LAGERS
 local government Local Government Employees employees Retirement retirement System system Local Government Employees Retirement System 700 participating employers 34,000 participating workers 22,000 retirees/beneficiaries
Current Population Survey: Issues Continue for Retirement Plan Participation and Retiree Income Estimates
 June 12, 2018 No. 452 Current Population Survey: Issues Continue for Retirement Plan Participation and Retiree Income Estimates By Craig Copeland, Ph.D., Employee Benefit Research Institute A T A G L A