Welcome. Huntington Bancshares Incorporated 2017 Fourth Quarter Earnings Review. January 23, 2018
|
|
|
- Godwin Evans
- 6 years ago
- Views:
Transcription
 Disclaimer CAUTION REGARDING FORWARD-LOOKING STATEMENTS This communication contains certain forward-looking statements, including, but not limited to, certain plans, expectations,")
1 Welcome Huntington Bancshares Incorporated 2017 Fourth Quarter Earnings Review January 23, Huntington Bancshares Incorporated. All rights reserved. (NASDAQ: HBAN) Disclaimer CAUTION REGARDING FORWARD-LOOKING STATEMENTS This communication contains certain forward-looking statements, including, but not limited to, certain plans, expectations, goals, projections, and statements, which are not historical facts and are subject to numerous assumptions, risks, and uncertainties. Statements that do not describe historical or current facts, including statements about beliefs and expectations, are forward-looking statements. Forward-looking statements may be identified by words such as expect, anticipate, believe, intend, estimate, plan, target, goal, or similar expressions, or future or conditional verbs such as will, may, might, should, would, could, or similar variations. The forward-looking statements are intended to be subject to the safe harbor provided by Section 27A of the Securities Act of 1933, Section 21E of the Securities Exchange Act of 1934, and the Private Securities Litigation Reform Act of While there is no assurance that any list of risks and uncertainties or risk factors is complete, below are certain factors which could cause actual results to differ materially from those contained or implied in the forward-looking statements: changes in general economic, political, or industry conditions; uncertainty in U.S. fiscal and monetary policy, including the interest rate policies of the Federal Reserve Board; volatility and disruptions in global capital and credit markets; movements in interest rates; competitive pressures on product pricing and services; success, impact, and timing of our business strategies, including market acceptance of any new products or services implementing our Fair Play banking philosophy; the nature, extent, timing, and results of governmental actions, examinations, reviews, reforms, regulations, and interpretations, including those related to the Dodd-Frank Wall Street Reform and Consumer Protection Act and the Basel III regulatory capital reforms, as well as those involving the OCC, Federal Reserve, FDIC, and CFPB; and other factors that may affect our future results. Additional factors that could cause results to differ materially from those described above can be found in our Annual Report on Form 10-K for the year ended December 31, 2016, and Quarterly Reports on Form 10-Q for the quarters ended March 31, 2017, June 30, 2017, and September 30, 2017, which are on file with the Securities and Exchange Commission (the SEC ) and available in the Investor Relations section of our website, under the heading Publications and Filings and in other documents we file with the SEC. All forward-looking statements speak only as of the date they are made and are based on information available at that time. We do not assume any obligation to update forward-looking statements to reflect circumstances or events that occur after the date the forwardlooking statements were made or to reflect the occurrence of unanticipated events except as required by federal securities laws. As forward-looking statements involve significant risks and uncertainties, caution should be exercised against placing undue reliance on such statements. 2
2 2017 Full Year Financial Highlights Completed FirstMerit integration and continue to realize deal economics EPS TBVPS ROA ROTCE +43% Y/Y +8% Y/Y 1.17% 15.7% Financial Highlights Y/Y Balance Sheet Y/Y EPS $ % Net Interest Margin 3.30% +14 bp Net Interest Income (FTE) $3,052 27% Noninterest Income $1,307 14% Total Revenue (FTE) $4,359 22% Noninterest Expense $2,714 13% Net Income $1,186 67% Avg diluted shares 1,136 24% Efficiency Ratio 60.9% -590 bp NCOs / Avg Loans 0.23% +4 bp TBVPS $6.97 8% Avg Assets ($B) $ % Avg Earning Assets ($B) $ % Avg Loans and Leases ($B) $ % Avg Deposits ($B) $ % Avg Core Deposits ($B) $ % Avg Tang. Common Equity ($B) $7.3 17% TCE Ratio 7.34% +18 bp CET1 Ratio 9.89% +33 bp NPA Ratio 0.55% -17 bp Note: $ in millions, except per share or otherwise noted; results were impacted by Significant Items primarily related to benefit of federal tax reform partially offset by FirstMerit acquisition-related expenses Fourth Quarter Financial Highlights Delivered top tier performance EPS TBVPS ROA ROTCE +85% Y/Y +8% Y/Y 1.67% 22.7% Financial Highlights Y/Y Balance Sheet Y/Y EPS $ % Net Interest Margin 3.30% +5 bp Net Interest Income (FTE) $782 5% Noninterest Income $340 2% Total Revenue (FTE) $1,122 4% Noninterest Expense $633-7% Net Income $432 81% Avg diluted shares 1,130 2% Efficiency Ratio 54.9% -670 bp NCOs / Avg Loans 0.24% -2 bp TBVPS $6.97 8% Avg Assets ($B) $ % Avg Earning Assets ($B) $93.9 3% Avg Loans and Leases ($B) $68.9 4% Avg Deposits ($B) $77.7 1% Avg Core Deposits ($B) $73.9 3% Avg Tang. Common Equity ($B) $7.4 4% TCE Ratio 7.34% +18 bp CET1 Ratio 9.89% +33 bp NPA Ratio 0.55% -17 bp Note: $ in millions, except per share or otherwise noted; results were impacted by Significant Items primarily related to benefit of federal tax reform partially offset by FirstMerit acquisition-related expenses 4
3 4Q17 YoY Summary Income Statement Quarterly comparisons significantly impacted by FirstMerit integration efforts Fourth Third Second First Fourth Change (in millions) Quarter Quarter Quarter Quarter Quarter LQ YOY Net interest income - FTE $ 782 $ 771 $ 757 $ 742 $ % 5 % Total noninterest income $ 340 $ 330 $ 325 $ 312 $ Total Revenue - FTE $ 1,122 $ 1,101 $ 1,082 $ 1,054 $ 1, Total noninterest expense $ 633 $ 680 $ 694 $ 707 $ 681 (7) (7) Provision for credit losses $ 65 $ 43 $ 25 $ 68 $ (13) Pre-tax income - FTE $ 424 $ 377 $ 362 $ 279 $ Net Income $ 432 $ 275 $ 272 $ 208 $ % 81 % Noninterest Income $11 MM increase in other income $8 MM decrease in gain on sale of loans $5 MM decrease in mortgage banking income Noninterest Expense $13 MM decrease in net occupancy costs $11 MM decrease in marketing expense $13 MM increase in personnel costs $7 MM increase in other expense Operating Leverage Fifth consecutive year of achieving positive operating leverage ($MM) Y/Y Change Actual Actual $ % Net interest income $ 3,002 $ 2,369 FTE adjustment $ 50 $ 43 FTE Net interest income $ 3,052 $ 2, Noninterest income $ 1,307 $ 1,150 Securities gains (losses) $ (4) $ (0) Merger and acquisition related gain (loss) $ 2 $ (1) Net gain (loss) MSR hedging $ 1 $ 0 Adjusted noninterest income $ 1,307 $ 1, Adjusted total revenue $ 4,359 $ 3, Noninterest expense $ 2,714 $ 2,409 Merger and acquisition expenses $ 154 $ 281 Addition to litigation reserves $ - $ (42) Adjusted noninterest expense $ 2,559 $ 2,
4 Earning Asset/Liability Mix Disciplined growth and pricing on both sides of the balance sheet Avg. Earning Assets Mix Avg. Non-Equity Funding Mix $100 $90 $80 $70 $60 $50 ($B) $91.5 $91.1 $91.7 $92.8 $93.9 2% 2% 2% 3% 2% 9% 9% 9% 9% 8% 11% 11% 11% 11% 11% 12% 12% 12% 13% 13% 8% 8% 8% 8% 8% Other Earning Assets Other Consumer RV and Marine Finance Residential Mortgage Home Equity $100 $90 $80 $70 $60 $50 ($B) $89.9 $89.9 $ % 9% 10% 10% 10% 3% 4% 3% 3% 3% 5% 5% 5% 4% 4% 3% 3% 2% 2% 2% 14% 13% 13% $90.5 $ % 12% 21% 21% 21% 22% 23% Other Long-Term Debt Short-Term Borrowings Noncore Deposits Core CDs $40 $30 30% 31% 31% 30% 30% Automobile $40 $30 17% 19% 19% 20% 20% Savings / Other $20 CRE $20 MMA $10 24% 26% 26% 26% 26% Commercial & Industrial $10 26% 24% 24% 24% 24% DDA-Int. Bearing $0 4Q16 1Q17 2Q17 3Q17 4Q17 Total Securities $0 4Q16 1Q17 2Q17 3Q17 4Q17 DDA-Nonint. Bearing 7 Net Interest Margin (FTE) Purchase accounting adjustments added 10 basis points to NIM Earning Asset Yield Core NIM (1) Net Interest Margin Cost of Interest Bearing Liabilities 4Q17 Reported vs. Core NIM (1) Cost of Commercial Core Deposits Cost of Consumer Core Deposits 4.00% 3.78% 3.83% 3.70% 3.75% 3.60% 3.30% 3.20% 3.50% 3.25% 3.30% 3.31% 3.29% 3.30% 3.00% 0.75% 0.50% 2.50% 3.07% 0.48% 3.14% 3.16% 3.18% 3.20% 0.68% 0.73% 0.61% 0.54% 0.25% 0.00% 2.00% 0.18% 0.19% 0.21% 0.22% 0.24% 0.20% 0.22% 0.15% 0.09% 0.11% 4Q16 1Q17 2Q17 3Q17 4Q17 Reported NIM Core NIM (1) Net of purchase accounting adjustments; see reconciliation on slide 24 8
5 Net Impact of FirstMerit-Related Purchase Accounting and Provision Expected net impact on pre-tax income down to $3 million in 2018 $122 $43 $66 $60 $42 $13 $15 $3 FY2017A FY2018E Purchase Accounting Impact on Net Interest Income Debt & Deposits Purchase Accounting Impact on Net Interest Income Purchased Credit Impaired Loans Purchase Accounting Impact on Net Interest Income Performing Loans (Accretion) Amortization of Intangibles FirstMerit-related provision for credit losses Net impact on pre-tax income 9 Achieved All Long-Term Financial Goals in 4Q17 Long-Term Financial Goal GAAP 4Q17 Adjusted (Non-GAAP) 1 GAAP FY17 Adjusted (Non-GAAP) Target Revenue (FTE) Growth (Y/Y) 4% - 6% +4% +4% +22% +22% Expense Growth (Y/Y) Positive Operating Leverage (7%) (7%) +13% +18% Efficiency Ratio 56% - 59% 55% 55% 61% 57% NCO bp 24 bp 24 bp 23 bp 23 bp ROTCE 13% - 15% 23% 16% 16% 15% (1) Reconciliation on slides 26 & 27 10
6 High Confidence in FirstMerit Deal Economics Realizing originally announced cost savings and on pace to deliver revenue enhancements $255+ MM Cost Savings $100+ MM Revenue Synergies Implementation of all cost savings complete Eliminated 42% of legacy FirstMerit expense base Fully converted all operating systems to Huntington systems Consolidated 24 operations centers and corporate offices Consolidated 146 branches Introducing full Huntington product suite to FirstMerit customer base through Optimal Customer Relationships (OCR) Expanded SBA expertise to Chicago / WI Expanded RV / Marine lending to 17 new states Expanded Home Lending business to Chicago / WI 11 Capital (1) Capital ratios receive one-time benefit from federal tax reform 4Q17 3Q17 2Q17 1Q17 4Q16 Tang. common equity / tang. assets 7.34% 7.42% 7.41% 7.28% 7.16% Common equity Tier 1 (CET1) Tier 1 leverage Tier 1 risk-based capital Total risk-based capital Total risk-weighted assets ($B) $80.4 $78.6 $78.4 $77.6 $78.3 Double leverage (2) 109% 108% 108% 107% 108% (1) End of period (2) (Parent company investments in subsidiaries + goodwill) / equity 12
7 Potential Conversion of Series A Preferred Equity 4Q17 Average Diluted Shares Includes Conversion for First Time Potential conversion of $363 million of 8.50% Series A preferred equity into $363 million of common equity yields opportunity to optimize regulatory capital ratios in 2018 CCAR process o Evaluating the need to replace this preferred equity with new preferred issuance Potential conversion of Series A preferred equity would have positive impact on TCE ratio, CET1 ratio, and TBVPS, and immaterial impact to diluted EPS o o o Conversion terms: each Series A preferred share converts into HBAN common shares (partial shares are paid out in cash) Shareholder can choose to convert at any time Conversion can be forced if HBAN common shares close at or above $15.54 for 20 out of 30 trading days As of January 22, 2018, HBAN has closed above this threshold for 6 of the past 7 trading days The earliest potential date of forced conversion is February 9, Q17 average diluted shares outstanding includes 30 million shares from the assumed conversion of Series A preferred equity into common equity o Inclusion in diluted share count as a result of Basic EPS exceeding dilution threshold for the first time $ in millions, except per share 4Q17 Basic EPS $0.38 Series A preferred equity quarterly dividend $7.7 Common shares issued upon conversion 30.3 Per share preferred dividend savings upon conversion to common $ Provision, NCO, and ACL NCOs remain below long-term target ($MM) $100 $90 $80 $70 $60 $50 $40 $30 $20 $37 Loan Loss Provision vs. Net Charge-offs % Chg. 4Q17 vs. LLP NCO 4Q16 (13%) (6%) 3Q17 49% (5%) $22 LLP $28 NCO $25 $17 $64 $40 $75 $44 $68 $39 $25 $36 $43 $43 $65 $ % 1.35% 1.30% 1.25% 1.20% 1.15% 1.10% Allowance for Credit Losses vs. NALs 1.33% 1.34% 1.33% 180% 138% 151% 174% 174% 1.10% 190% 207% 223% 223% 1.14% 1.11%1.10% 1.11% 250% 200% 150% 100% 50% $10 $0 $9 4Q15 2Q16 4Q16 2Q17 4Q % 1.00% 1.06% ACL % Lns / Lse ACL % NALs 4Q15 2Q16 4Q16 2Q17 4Q17 0% 14
8 Asset Quality Trends Overall credit metrics remain stable NPA Ratio EOP 0.35% 90+ Day Delinquencies Ratio 1.20% 1.10% 1.00% 0.90% 0.80% 0.70% 0.60% 0.79% 1.02% 0.93% 0.72% 0.72% 0.68% 0.61% 0.56% 0.55% 0.30% 0.25% 0.20% 0.15% 0.10% 0.05% 0.21% 0.21% 0.19% 0.20% 0.19% 0.19% 0.20% 0.16% 0.17% 0.50% 4Q15 1Q16 2Q16 3Q16 4Q16 1Q17 2Q17 3Q17 4Q % 4Q15 1Q16 2Q16 3Q16 4Q16 1Q17 2Q17 3Q17 4Q % Criticized Asset Ratio 0.70% NPA Inflows % of BOP Loans 4.50% 0.60% 0.50% 0.48% 4.00% 3.50% 3.00% 3.54% 3.50% 3.44% 3.72% 3.80% 3.54% 3.53% 3.62% 3.66% 0.40% 0.30% 0.20% 0.10% 0.29% 0.32% 0.14% 0.23% 0.19% 0.17% 0.13% 0.13% 2.50% 4Q15 1Q16 2Q16 3Q16 4Q16 1Q17 2Q17 3Q17 4Q % 4Q15 1Q16 2Q16 3Q16 4Q16 1Q17 2Q17 3Q17 4Q17 15 Footprint Economic Indicators Unemployment rates remain near historical lows In November, unemployment rates were near or below the national unemployment rate of 4.1% in Cincinnati (4.1%), Columbus (3.9%), Detroit (4.3%), Grand Rapids (3.9%), Indianapolis (3.3%), Madison (2.2%) and Milwaukee (3.4%). For the most recent 3-month period, unemployment rate changes were moving primarily in a downward direction in the largest MSAs with 13 decreases and 4 increases. Net nonfarm employment growth in the 12 months through November was well above U.S. growth of +1.23% in Cincinnati (+2.38%), Columbus (+1.80%), Dayton (+2.92%), Detroit (+2.27%), Madison (+3.57%) and Milwaukee (+2.25%). In the 3 months through November, jobs growth was especially strong in Akron (+1.09%), Canton (+1.22%), Dayton (+1.79%), Madison (+1.01%), Pittsburgh (+0.88%) and Youngstown (+0.74%). U.S. employment grew 0.3% during the same 3-month period. November 2017 State Coincident Indexes (Three-Month Historical Change) Less than -1.0% -0.6% to -1.0% 0.0% to -0.5% 0.0% to +0.5% +0.6% to +1.0% More than +1.0% Unemployment Rate (Seasonally Adjusted %) November 2017 State Leading Indexes (Expected Six-Month Change) Less than -4.5% 0.0% to +1.5% -1.6% to -4.5% +1.6% to +4.5% KY IN IL MI OH PA WV WI USA 0.0% to -1.5% More than +4.5% Sources: US Bureau of Labor Statistics; Federal Reserve Bank of Philadelphia; Haver Analytics 16
9 Unemployment Rates in Top 10 Deposit MSAs Our largest deposit markets demonstrate continued strength According to the Philadelphia FRB coincident economic indicator, economic activity grew faster than the nation in 6 of 8 Huntington footprint states during the economic recovery-to-date. Michigan, Ohio, Indiana, Illinois, Kentucky, and Wisconsin all exhibited stronger growth than the nation since the Great Recession ended. Home prices continued to grow solidly across most of the footprint states. According to the FHFA Home Price Index, home prices in the year through Q3 grew 8.0% in Michigan, 6.1% in Wisconsin, 5.9% in Kentucky, 5.4% in Ohio, 5.0% in Indiana, 4.1% in Pennsylvania, 3.7% in Illinois and 1.3% in West Virginia. Consumer Confidence in the East North Central region of the U.S. (OH, MI, IN, IL, WI) generally at highest level since Unemployment Rate (Seasonally Adjusted %) Nov-16 Nov-17 National Unemployment Rate (4.1%) Grand Rapids, MI Toledo, OH Cincinnati, OH Canton, OH Pittsburgh, PA Indianapolis, IN Akron, OH Detroit, MI Cleveland, OH Columbus, OH Source: US Bureau of Labor Statistics; Federal Reserve Bank of Philadelphia; Haver Analytics 17 Positioned for Strong Relative Performance Through-the-Cycle Strengthened Pretax Pre-Provision Net Revenue (1) Well-Diversified Balance Sheet $ billions $1.0 $1.1 $1.4 $1.8 $1.8 $1.9 50% Core Loans (3) $69 B 50% 48% Deposits (3) 52% $74 B Q16 4Q17 (2) (2) % of RWA 1.86% 1.86% 1.75% 2.25% 2.27% (2) 2.41% (2) Commercial Consumer Disciplined Management of Credit Risk Strong Capital Base and Capital Management Cumulative Losses as a % of Average Total Loans in Dodd-Frank Act Stress Test (DFAST) Supervisory Severely Adverse Scenario % # % # % #4 Note: Ranking among 19 traditional commercial banks (1) Non-GAAP financial metric; see Appendix slide 28; (2) Annualized; (3) 4Q17 average balances; (4) projected minimum in the Federal Reserve Severely Adverse Scenario Common Equity Tier 1 (CET1) Ratio 2017 CCAR minimum (4) 4.5% 1.5% 6.0% 4Q17 Actual 4.5% 5.4% Total Risk-Based Capital Ratio 2017 CCAR minimum (4) 4Q17 Actual Minimum 8.0% 8.0% Buffer 9.9% 1.7% 9.7% 5.2% 13.2% 18
10 2018 Expectations Avg Loan Balances 4% - 6% growth (assumes $500 MM Auto securitization in 3Q18) Avg Deposit Balances 3% - 5% growth Revenue 4% - 6% growth (assumes no rate hikes in 2018) Net Interest Margin Noninterest Expense GAAP NIM flat; Core NIM up modestly (new money yields above back book yields across all loan categories) 2% - 4% decrease Efficiency Ratio 55% - 57% Effective Tax Rate 16% - 17% Net charge-offs Remain below long-term expectations of 35 bp 55 bp Note: All metrics presented on a GAAP basis assuming an unchanged rate environment 19 Important Messages Strong economic outlook for Midwest footprint FirstMerit integration complete; fully implemented all cost saves and executing on revenue synergies Focused on three areas with sustainable competitive advantages o o o Consumer Small to Medium Enterprises (including Commercial Real Estate) Vehicle Finance Consistent core strategy since 2009 o o o Delivering on growth strategies with sustained investment Meaningful investment in people, technology, and brand continuously improving Disciplined risk management aggregate moderate-to-low risk profile Driving core deposit and loan growth through disciplined execution and a differentiated customer experience Focused on delivery of consistent through-the-cycle shareholder returns High level of colleague and shareholder alignment 20


 22")
11 Reconciliation Noninterest Income Noninterest Income (GAAP) Impact of Significant Items Adjusted Noninterest Income (Non-GAAP) 21 Reconciliation Noninterest Expense Noninterest Expense (GAAP) Impact of Significant Items Adjusted Noninterest Expense (Non-GAAP) 22
12 Reconciliation Significant Items impacting financial performance comparisons 2017 Net Income and EPS ($ in millions, except per share amounts) 4Q17 3Q17 2Q17 1Q17 After-tax EPS After-tax EPS After-tax EPS After-tax EPS Net income - reported earnings $ 432 $ 275 $ 272 $ 208 Net income applicable to common shares $ 413 $ 0.37 $ 256 $ 0.23 $ 253 $ 0.23 $ 189 $ 0.17 Significant items - favorable (unfavorable) impact: Earnings (1) EPS Earnings (1) EPS Earnings (1) EPS Earnings (1) EPS Merger and acquisition related expenses, net $ - $ - $ (31) $ (0.02) $ (50) $ (0.03) $ (71) $ (0.04) Benefit of federal tax reform $ 123 $ 0.11 $ - $ - $ - $ - $ - $ Net Income and EPS (in millions, except per share amounts) 4Q16 3Q16 2Q16 1Q16 After-tax EPS After-tax EPS After-tax EPS After-tax EPS Net income - reported earnings $ 239 $ 127 $ 175 $ 171 Net income applicable to common shares $ 220 $ 0.20 $ 108 $ 0.11 $ 155 $ 0.19 $ 163 $ 0.20 Significant items - favorable (unfavorable) impact: Earnings (1) EPS Earnings (1) EPS Earnings (1) EPS Earnings (1) EPS Merger and acquisition related expenses, net $ (96) $ (0.06) $ (159) $ (0.11) $ (21) $ (0.02) $ (6) $ (0.01) Litigation reserve reduction Efficiency Ratio ($ in millions) 4Q17 3Q17 2Q17 1Q17 Pre-Tax Efficiency Ratio Pre-Tax Efficiency Ratio Pre-Tax Efficiency Ratio Pre-Tax Efficiency Ratio Noninterest expense less amortization of intangibles $ % $ % $ % $ % Revenue less gain/loss on securities $ 1, $ 1, $ 1, $ 1, Significant items: Revenue (Expense) (1) Efficiency Ratio Revenue (Expense) (1) Efficiency Ratio Revenue (Expense) (1) Efficiency Ratio Revenue (Expense) (1) Efficiency Ratio Merger and acquisition related expenses, net $ - 0.0% $ (31) 2.8% $ (50) 4.6% $ (71) 6.7% (1) Pre-tax, except for benefit of federal tax reform 23 Reconciliation Net Interest Margin ($ in millions) 4Q17 3Q17 2Q17 1Q17 Net Interest Income (FTE) reported $ 782 $ 771 $ 757 $ 742 Purchase accounting impact (performing loans) Purchase accounting impact (credit impaired loans) Total Loan Purchase Accounting Impact Debt Deposit accretion Total Net Purchase Accounting Adjustments $ 24 $ 27 $ 34 $ 37 Net Interest Income (FTE) - core $ 758 $ 744 $ 723 $ 705 Average Earning Assets ($B) $ 93.9 $ 92.8 $ 91.7 $ 91.1 Net Interest Margin - reported 3.30% 3.29% 3.31% 3.30% Net Interest Margin - core 3.20% 3.18% 3.16% 3.14% 24
13 Reconciliation Loan marks ($ in millions) Performing: Loan mark: At September 30, 2017 $ 90 Amortization (13) Charge-off/HFS/Other (1) At December 31, 2017 $ 75 Performing loan balance ($B): At September 30, 2017 $ 10.0 At December 31, Purchased credit impaired (PCI): Accretable yield: At September 30, 2017 $ 35 Accretion (4) Reclassification from nonaccretable difference 1 At December 31, 2017 $ 33 PCI Loan balance: At September 30, 2017 $ 65 At December 31, Reconciliation Revenue, Noninterest Income, and Noninterest Expense Growth ($ in millions) GAAP Adjustment (1) Adjusted 2017 Net interest income (FTE) $3, $3, Noninterest income $1,307 $2 (2) $1, Total Revenue $4,359 $2 (2) $4, Net interest income (FTE) $2, $2, Noninterest income $1,150 ($1) (2) $1, Total revenue $3, $3, Total revenue growth 22% 22% 2017 Noninterest expense $2,714 $155 (2) $2, Noninterest expense $2,408 $239 (2) $2, Noninterest expense growth 13% 18% (1) Significant Items related to benefit of federal tax reform and FirstMerit acquisition-related expenses (2) Pre-tax 26
14 Reconciliation Efficiency Ratio and ROTCE ($ in millions) GAAP Adjustment (1) Adjusted Full Year 2017: Noninterest expense $2,714 $155 (2) $2,559 Amortization of intangibles $56 -- $56 Noninterest expense less amortization of intangibles A $2,658 $2,503 Total revenue (FTE) $4,359 ($2) $4,357 Securities gains ($4) -- ($4) Total revenue (FTE) less securities gains B $4,363 $4,361 Efficiency ratio A / B 61% 57% Net income applicable to common shares C $1,110 ($24) (3) $1,086 Less: Amortization of intangibles (net of deferred tax) D $36 (3) -- $36 (3) Net income applicable to common shares less amortization of intangibles C + D = E $1,146 $1,122 Average tangible common equity F $7, $7,304 Return on average tangible common equity (ROTCE): E / F 16% 15% Fourth Quarter 2017: Net income applicable to common shares G $413 $123 (3) $289 Less: Amortization of intangibles (net of deferred tax) H $14 (3) -- $14 (3) Net income applicable to common shares less amortization of intangibles G + H = J $427 $303 Average tangible common equity K $7, $7,383 Return on average tangible common equity (ROTCE): J / K 23% 16% (1) Significant Items related to benefit of federal tax reform and FirstMerit acquisition-related expenses (2) Pre-tax (3) After-tax 27 Reconciliation Pretax Pre-Provision Net Revenue (PPNR) ($ in millions) 4Q17 4Q Net interest income FTE $782 $748 $3,052 $2,412 $1,983 $1,865 Noninterest income ,307 1,151 1, Total revenue 1,122 1,082 4,359 3,563 3,022 2,826 Less: Significant Items 0 (1) Less: gain on securities (4) (0) (4) Total revenue adjusted A 1,126 1,083 4,361 3,562 3,018 2,807 Noninterest expense ,714 2,408 1,976 1,882 Add: provision for unfunded loans 8 10 (11) (2) Less: Significant Items Noninterest expense adjusted B ,549 2,191 1,929 1,815 Pretax pre-provision net revenue (PPNR) A - B $485 $445 $1,812 $1,372 $1,089 $1,011 Risk-weighted assets (RWA) $80,382 $78,263 $80,382 $78,263 $58,420 $54,479 PPNR as % of RWA 2.41% 2.27% 2.25% 1.75% 1.86% 1.86% 28
15 Appendix 29 Do we consolidate Basis of Presentation this and next slide? Use of Non-GAAP Financial Measures This document contains GAAP financial measures and non-gaap financial measures where management believes it to be helpful in understanding Huntington s results of operations or financial position. Where non-gaap financial measures are used, the comparable GAAP financial measure, as well as the reconciliation to the comparable GAAP financial measure, can be found in this document, conference call slides, or the Form 8-K related to this document, all of which can be found in the Investor Relations section of Huntington s website, Annualized Data Certain returns, yields, performance ratios, or quarterly growth rates are presented on an annualized basis. This is done for analytical and decision-making purposes to better discern underlying performance trends when compared to full-year or year-over-year amounts. For example, loan and deposit growth rates, as well as net charge-off percentages, are most often expressed in terms of an annual rate like 8%. As such, a 2% growth rate for a quarter would represent an annualized 8% growth rate. Fully-Taxable Equivalent Interest Income and Net Interest Margin Income from tax-exempt earning assets is increased by an amount equivalent to the taxes that would have been paid if this income had been taxable at statutory rates. This adjustment puts all earning assets, most notably tax-exempt municipal securities and certain lease assets, on a common basis that facilitates comparison of results to results of competitors. Earnings per Share Equivalent Data Significant income or expense items may be expressed on a per common share basis. This is done for analytical and decision-making purposes to better discern underlying trends in total corporate earnings per share performance excluding the impact of such items. Investors may also find this information helpful in their evaluation of the company s financial performance against published earnings per share mean estimate amounts, which typically exclude the impact of Significant Items. Earnings per share equivalents are usually calculated by applying an effective tax rate to a pre-tax amount to derive an after-tax amount, which is divided by the average shares outstanding during the respective reporting period. Occasionally, when the item involves special tax treatment, the after-tax amount is disclosed separately, with this then being the amount used to calculate the earnings per share equivalent. Rounding Please note that columns of data in this document may not add due to rounding. 30
16 Basis of Presentation Significant Items From time to time, revenue, expenses, or taxes are impacted by items judged by Management to be outside of ordinary banking activities and/or by items that, while they may be associated with ordinary banking activities, are so unusually large that their outsized impact is believed by Management at that time to be infrequent or short term in nature. We refer to such items as Significant Items. Most often, these Significant Items result from factors originating outside the company e.g., regulatory actions/assessments, windfall gains, changes in accounting principles, one-time tax assessments/refunds, litigation actions, etc. In other cases they may result from Management decisions associated with significant corporate actions out of the ordinary course of business e.g., merger/restructuring charges, recapitalization actions, goodwill impairment, etc. Even though certain revenue and expense items are naturally subject to more volatility than others due to changes in market and economic environment conditions, as a general rule volatility alone does not define a Significant Item. For example, changes in the provision for credit losses, gains/losses from investment activities, asset valuation write-downs, etc., reflect ordinary banking activities and are, therefore, typically excluded from consideration as a Significant Item. Management believes the disclosure of Significant Items, when appropriate, aids analysts/investors in better understanding corporate performance and trends so that they can ascertain which of such items, if any, they may wish to include/exclude from their analysis of the company s performance - i.e., within the context of determining how that performance differed from their expectations, as well as how, if at all, to adjust their estimates of future performance accordingly. To this end, Management has adopted a practice of listing Significant Items in its external disclosure documents (e.g., earnings press releases, quarterly performance discussions, investor presentations, Forms 10-Q and 10-K). Significant Items for any particular period are not intended to be a complete list of items that may materially impact current or future period performance. A number of items could materially impact these periods, including those described in Huntington s 2016 Annual Report on Form 10-K and other factors described from time to time in Huntington s other filings with the Securities and Exchange Commission. 31 Table of Contents Income Statement 33 Mortgage Banking Noninterest Income 35 Tax Rate Summary 36 Balance Sheet 38 Core Deposits 41 Loan and Deposit Composition 42 Investment Securities 44 Capital 46 Commercial Loans 47 Commercial & Industrial 48 Commercial Real Estate 51 Automobile 53 Home Equity 57 Residential Mortgages 59 RV/Marine 61 Credit Quality Review 62 Delinquencies 64 Net Charge-offs 67 Franchise and Leadership 70 32
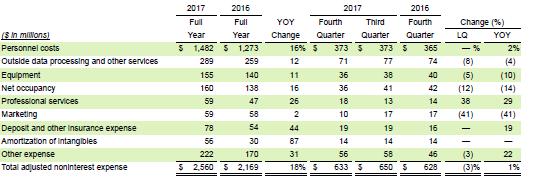
17 Income Statement 33 Income Statement Summary Change (%) ($ in millions) Dec. 31, Sep. 30, Dec. 31, LQ YOY Interest income $ 894 $ 873 $ % 10 % Interest expense Net interest income Provision for credit losses (13) Net interest income after provision (1) 7 Service charges on deposit accounts (1) Cards and payment processing income (1) 8 Trust and investment management services Mortgage banking income (2) (13) Insurance income Capital markets fees Bank owned life insurance income Gain on sale of loans (32) Securities gains (losses) (4) (0) (2) NM NM Other income Total noninterest income Personnel costs (1) 4 Outside data processing and other services (11) (20) Net occupancy (35) (27) Equipment (21) (40) Deposit and other insurance expense Professional services (22) Marketing (41) (52) Amortization of intangibles (0) - Other expense (4) 14 Total noninterest expense (7) (7) Income before income taxes Provision for income taxes (20) (122) (127) Net Income $ 432 $ 275 $ % 81 % 34
18 Mortgage Banking Noninterest Income Summary ($MM, except as noted) 4Q17 3Q17 2Q17 1Q17 4Q16 Net origination and secondary marketing income $24) $25) $24) $22) $22) Net mortgage servicing income Loan servicing income 13) 13) 13) 13) 13) Amortization of capitalized servicing (8) (7) (7) (7) (8) Operating Income 5) 6) 6) 6) 5) MSR valuation adjustment 2) 0) (3) 2) 25) Gains (losses) due to MSR hedging (1) 0) 2) (1) (17) Net MSR risk management 1) 0) (1) 1) 8) Total net mortgage servicing income $6) $6) $5) $7) $13) All other 3) 3) 3) 3) 3) Mortgage banking income $33) $34) $32) $32) $38) Mortgage origination volume ($B) $1.8) $1.8) $1.8) $1.3) $1.5) Mortgage origination volume for sale ($B) 1.0) 1.1) 1.0) 0.8) 1.1) Third party mortgage loans serviced ($B) 20.0) 19.6) 19.1) 19.1) 18.9) Mortgage servicing rights (1) 202) 195) 189) 191) 186) MSR % of investor servicing portfolio (1) 1.01%) 1.00%) 0.99%) 1.00%) 0.99%) (1) End-of-period 35 Tax Rate Summary Reported vs. Adjusted ($ in millions) Reported (GAAP) Significant Items Adjusted (Non-GAAP) 2017 Fourth Quarter Income before income taxes $412 $0 $412 Provision for income taxes ($20) $123 $104 Effective tax rate -4.8% 25.2% 2017 Third Quarter Income before income taxes $365 $31 $395 Provision for income taxes $90 $11 $101 Effective tax rate 24.7% 25.5% 2017 Second Quarter Income before income taxes $350 $50 $401 Provision for income taxes $79 $18 $96 Effective tax rate 22.4% 24.0% 2017 First Quarter Income before income taxes $267 $71 $339 Provision for income taxes $59 $25 $84 Effective tax rate 22.2% 24.9% 36
19 Tax Rate Summary Reported vs. FTE Adjusted ($ in millions) Reported (GAAP) FTE Adjustment FTE Adjusted (Non-GAAP) 2017 Fourth Quarter Income before income taxes $412 $13 $425 Provision for income taxes ($20) $13 ($7) Effective tax rate -4.8% -1.6% 2017 Third Quarter Income before income taxes $365 $12 $377 Provision for income taxes $90 $12 $102 Effective tax rate 24.7% 27.1% 2017 Second Quarter Income before income taxes $350 $12 $363 Provision for income taxes $79 $12 $91 Effective tax rate 22.4% 25.0% 2017 First Quarter Income before income taxes $267 $12 $279 Provision for income taxes $59 $12 $71 Effective tax rate 22.2% 25.5% 37 Balance Sheet 38
20 Assets Change (%) ($ in billions) De c. 31, Sep. 30, Dec. 31, LQ YOY Assets Cash and due from banks $ 1.5 $ 1.2 $ % 10 % Interest bearing deposits in banks (6) (19) Trading account securities (3) (35) Loans held for sale (25) (5) Available-for-sale securities (1) Held-to-maturity securities Loans and leases: Commercial and industrial loans and leases Commercial real estate loans (1) Total commercial (0) Automobile Home equity loans (0) Residential mortgage loans RV and marine finance Other consumer loans Total consumer Loans and leases Allow ance for loan and lease losses (0.7) (0.7) (0.6) 2 8 Net loans and leases Bank ow ned life insurance Premises and equipment Goodw ill Other intangible assets (4) (14) Servicing rights Accrued income and other assets Total assets $ $ $ % 4 % 39 Liabilities & Shareholders Equity Change (%) ($ in billions) Dec. 31, Sep. 30, Dec. 31, LQ YOY Liabilities Demand deposits - non-interest bearing $ 21.5 $ 22.2 $ 22.8 (3) % (6) % Demand deposits - interest bearing (2) 15 Money market deposits Savings and other domestic deposits (1) (6) Core certificates of deposit (4) (24) Total core deposits (2) 3 Other domestic deposits of $250,000 or more (43) (39) Brokered deposits and negotiable CDs (3) (11) Deposits in foreign offices NM NM Total deposits (2) 2 Short-term borrow ings Other long-term debt Accrued expenses and other liabilities Total liabilities Shareholders' equity Preferred stock (0) - Common stock Capital surplus (1) (2) Less treasury shares, at cost (0.0) (0.0) (0.0) (0) 30 Accumulated other comprehensive loss (0.4) (0.4) (0.4) 18 8 Retained earnings (0.2) 146 (318) Total shareholders' equity Total liabilities and shareholders' equity $ $ $ % 4 % NM = Not meaningful 40
21 Total Core Deposit Trends 4Q17 v 3Q17 4Q17 v 4Q16 Average ($B) 4Q17 (1) Commercial Demand deposits - non-interest bearing $ % (9) % Demand deposits - interest bearing Other core deposits (2) Total Consumer Demand deposits - non-interest bearing Demand deposits - interest bearing Other core deposits (2) 25.9 (9) (20) Total 38.6 (3) (1) Total Demand deposits - non-interest bearing Demand deposits - interest bearing Other core deposits (2) 34.3 (2) (13) Total $ % 3 % (1) Linked-quarter percent change annualized (2) Money market deposits, savings / other deposits, and core certificates of deposit 41 Loan Portfolio Composition 4Q17 Average Balances Average Balance by Type 3% 2% Average Balance by Segment 7% 0% 13% 40% 25% 31% 15% 10% 17% 37% C&I $27.4B Commercial Real Estate $7.2B Auto $12.0B Home Equity $10.0B Residential Mortgage $8.8B RV/Marine Finance $2.4B Other Consumer $1.1B Consumer and Business Banking: $21.1B Commercial Banking and CRE: $25.2B Vehicle Finance: $17.5B Regional Banking and Private Client Group: $5.1B Treasury/Other: $0.1B 42
22 Deposit Composition 4Q17 Average Balances Average Balance by Type Average Balance by Segment 3% 1% 4% 0% 8% 5% 15% 28% 28% 59% 27% 23% Demand - noninterest bearing $21.7B Demand - interest bearing $18.2B Money Market $20.7B Savings $11.3B Core CDs $1.9B Other Domestic Deps >$250,000 $0.4B Brokered Deps & Negotiable CDs $3.4B Consumer and Business Banking: $45.6B Commercial Banking and CRE: $22.1B Vehicle Finance: $0.3B Regional Banking and Private Client Group: $5.9B Treasury/Other: $3.8B 43 Securities Mix & Yield (1) Securities Portfolio Mix Securities Portfolio Yield $25 ($ B) Available-for-sale Held-to-maturity 2.90% 2.80% 2.80% $20 $ % 2.60% 2.64% 2.65% 2.64% 2.65% 2.65% 2.64% 2.67% $10 $ % 2.40% 2.30% 2.45% 2.50% 2.43% 2.44% 2.43% 2.41% 2.36% 2.38% 2.36% 2.41% Held-to-maturity Available-for-sale $- 4Q15 1Q16 2Q16 3Q16 4Q16 1Q17 2Q17 3Q17 4Q % 4Q15 1Q16 2Q16 3Q16 4Q16 1Q17 2Q17 3Q17 4Q17 (1) Average balances 44
23 AFS & HTM Securities Overview (1) December 31, 2017 September 30, 2017 December 31, 2016 ($mm) % of Estimated % of Estimated % of Estimated AFS Portfolio Carry Value Portfolio Duration (1) Yield Carry Value Portfolio Duration (1) Yield Carry Value Portfolio Duration (1) Yield U.S. Treasuries 5 0.0% % 5 0.0% % 5 0.0% % Agency Debt % % % % % % Agency P/T 1, % % % % % % Agency CMO 6, % % 7, % % 6, % % Agency Multi-Family 2, % % 3, % % 3, % % Municipal Securities % % % % % % Other Securities 1, % % 1, % % 1, % % Total AFS Securities 12, % % 12, % % 12, % % HTM Portfolio Agency Debt % % % % % % Agency P/T 1, % % % % % % Agency CMO 3, % % 3, % % 4, % % Agency Multi-Family 3, % % 3, % % 2, % % Municipal Securities 5 0.0% % 6 0.0% % 6 0.0% % Total HTM Securities 9, % % 8, % % 7, % % Direct Purchase Municipal Instruments 3, % % 2, % % 2, % % Grand Total 24, % % 24, % % 23, % % Weighted Average Life Level 1 HQLA 15,197 16,250 15,660 LCR 132.2% 141.9% 127.9% (1) End of period 45 Capital Ratios (1) 12.00% 11.00% 10.92% 11.11% 11.24% 11.30% 11.22% 10.00% 9.00% 9.56% 9.74% 9.88% 9.94% 9.89% 8.00% 7.00% 7.16% 7.28% 7.41% 7.42% 7.34% 6.00% 4Q16 1Q17 2Q17 3Q17 4Q17 Tier 1 Risk-Based Capital Ratio Common Equity Tier 1 Ratio Tangible Common Equity / Tangible Assets (TCE Ratio) (1) End of period 46

 Diversified by sector and geographically within our Midwest footprint Comprised primarily of middle market companies with $20-$500 MM in sales and Business Banking customers with <$20")
24 Total Commercial Loans Granularity EOP Outstandings of $35.3 Billion # of Loans by Size Loans by Dollar Size 44,142 96% 14% 6% 33% < $5 MM $5+ MM 1,674 4% $5 MM - < $10 MM 780 $10 MM - < $25 MM 713 $25 MM - < $50 MM 154 > $50 MM 27 Total 1,674 32% 16% < $5 MM $5 MM - < $10 MM $10 MM - <$25 MM $25 MM - < $50 MM $50 MM + 47 Commercial and Industrial: $28.1 Billion (1) Diversified by sector and geographically within our Midwest footprint Comprised primarily of middle market companies with $20-$500 MM in sales and Business Banking customers with <$20 MM in sales Lend to defined relationship-oriented clients where we understand our client's market / industry and their durable competitive advantage Underwrite to historical cash flows with collateral as a secondary repayment source while stress testing for lower earnings / higher interest rates Follow disciplined credit policies and processes with quarterly review of criticized and classified loans 4Q17 3Q17 2Q17 1Q17 4Q16 Period end balance ($B) $28.1 $27.5 $28.0 $28.2 $ days PD & accruing 0.16% 0.20% 0.26% 0.35% 0.24% 90+ days PD & accruing (2) 0.03% 0.05% 0.08% 0.05% 0.06% NCOs (3) 0.10% 0.19% 0.18% 0.12% 0.23% NALs 0.57% 0.62% 0.70% 0.82% 0.83% ACL 1.61% 1.61% 1.58% 1.64% 1.55% (1) End of period (2) All amounts represent accruing purchased impaired loans; under the applicable accounting guidance (ASC ), the loans were recorded at fair value upon acquisition and remain in accruing status (3) Annualized 48
25 C&I Auto Industry End of period balances Outstandings ($MM) 4Q17 3Q17 2Q17 1Q17 4Q16 Suppliers (1) Domestic $ 841 $ 828 $ 763 $ 783 $ 861 Foreign Total suppliers Dealers Floorplan-domestic 1,691 1,642 1,826 1,896 1,833 Floorplan-foreign Total floorplan 2,511 2,382 2,586 2,676 2,588 Other Total dealers 3,278 3,108 3,300 3,413 3,286 Total auto industry $4,119 $3,935 $4,063 $4,196 $4,147 NALs Suppliers 0.09% 0.09% 0.10% 0.09% 0.05% Dealers Net charge-offs (2) Suppliers 0.01% 0.00% 0.00% (0.01)% 0.07% Dealers (1) Companies with > 25% of their revenue from the auto industry (2) Annualized 49 C&I Retail Exposure: $3.0 Billion (1) Retail exposure defined by NAICS excludes automotive dealer floorplan exposure No exposure to retailers having filed for Bankruptcy protection Retail Industry Category ($ in millions) Outstanding Exposure Motor Vehicle Parts Dealers $523 $765 Building Material and Garden Equipment and Supplies Dealers Food and Beverage Stores Gasoline Stations Health and Personal Care Stores Nonstore Retailers Miscellaneous Store Retailers Clothing and Clothing Accessories Stores Furniture and Home Furnishings Stores General Merchandise Stores Sporting Goods, Hobby, Musical Instrument, and Book Stores Electronics and Appliance Stores Grand Total $1,645 $2,958 (1) End of period 50
26 Commercial Real Estate: $7.2 Billion (1) Long-term, meaningful relationships with opportunities for additional cross-sell Primarily Midwest footprint projects generating adequate return on capital Proven CRE participants 28+ years average CRE experience >80% of the loans have personal guarantees >65% is within our geographic footprint Portfolio remains within the Board established concentration limit Credit Quality Trends 4Q17 3Q17 2Q17 1Q17 4Q16 Period end balance ($B) $7.2 $7.2 $7.1 $7.1 $ days PD & accruing 0.12% 0.65% 0.38% 0.74% 0.56% 90+ days PD & accruing (2) 0.04% 0.13% 0.24% 0.20% 0.24% NCOs (3) (0.04)% (0.22)% (0.20)% (0.12)% (0.30)% NALs 0.40% 0.24% 0.23% 0.20% 0.28% ACL 1.58% 1.51% 1.62% 1.51% 1.42% (1) End of period (2) All amounts represent accruing purchased impaired loans; under the applicable accounting guidance (ASC ), the loans were recorded at fair value upon acquisition and remain in accruing status (3) Annualized 51 CRE Retail Exposure: $2.3 Billion (1) $1.6 Billion Retail Properties, $0.7 Billion REIT Retail Total mall exposure is $257MM: all within REIT exposure, associated with 4 borrowers o Corporate leverage on these borrowers ranges from 34% to 60% o Fixed Charge Coverage on these borrowers ranges from 1.9x to 4.7x Property Type Outstanding ($MM) Exposure ($MM) Anchored Strip Center $ 383 $ 430 Mixed Use - Retail Unanchored Strip Center Grocery Anchored Power Center Lifestyle Center Freestanding Single Tenant Restaurant All Other (7 Retail Types Combined) Project Retail Exposure $ 1,342 $ 1,557 Retail REIT Grand Total $ 1,832 $ 2,277 (1) End of period 52
27 Automobile: $12.1 Billion (1) Extensive relationships with high quality Dealers o o o Huntington consistently in the market for over 60 years Dominant market position in the Midwest with over 4,100 dealers Floorplan and dealership real estate lending, core deposit relationship, full Treasury Management, Private Banking, etc. Relationships create the consistent flow of auto loans o Prime customers, average FICO >760 o LTVs average <90% o Custom Score, utilized in conjunction with FICO to enhance predictive modeling o No auto leasing (exited leasing in 2008) Operational efficiency and scale leverages expertise o o Highly scalable auto-decision engine evaluates >70% of applications based on FICO & custom score Underwriters directly compensated on credit performance by vintage Credit Quality Trends 4Q17 3Q17 2Q17 1Q17 4Q16 Period end balance ($B) $12.1 $11.9 $11.6 $11.2 $ days PD & accruing 0.94% 0.90% 0.80% 0.84% 0.94% 90+ days PD & accruing 0.06% 0.09% 0.07% 0.07% 0.09% NCOs 0.39% 0.33% 0.29% 0.45% 0.48% NALs 0.05% 0.03% 0.03% 0.04% 0.05% (1) End of period 53 Auto Loans Production and Credit Quality Originations 4Q17 3Q17 2Q17 1Q17 4Q16 3Q16 2Q16 1Q16 Amount ($B) $1.5 $1.6 $1.7 $1.4 $1.4 $1.5 $1.6 $1.4 % new vehicles 53% 49% 45% 45% 49% 46% 45% 46% Avg. LTV 88% 89% 89% 88% 89% 90% 89% 88% Avg. FICO Expected cumulative loss 0.80% 0.79% 0.80% 0.88% 0.84% 0.87% 0.86% 0.82% Portfolio Performance 30+ days PD & accruing % 0.94% 0.90% 0.80% 0.84% 0.94% 0.81% 0.78% 0.70% NCO % 0.39% 0.33% 0.29% 0.45% 0.48% 0.27% 0.17% 0.28% Vintage Performance (1) 6-month losses 0.04% 0.04% 0.07% 0.03% 0.04% 0.06% 9-month losses 0.10% 0.15% 0.08% 0.09% 0.11% 12-month losses 0.20% 0.16% 0.15% 0.16% (1) Annualized 54
28 Auto Loans - Origination Trends Loan originations from 2010 through 2017 demonstrate strong characteristics and continued improvements from pre-2010 Credit scoring model most recently updated in January net charge-offs impacted by acquisition of FirstMerit, including purchase accounting treatment of acquired portfolio (see Appendix slide 56) 1 ($B) Originations $6.2 $5.8 $5.2 $5.2 $4.2 $4.0 $3.6 $3.4 % New Vehicles 50% 49% 48% 49% 46% 45% 52% 48% Avg. LTV 88% 89% 90% 89% 89% 88% 88% 88% Avg. FICO Weighted Avg. Original Term (months) Avg. Custom Score Annualized risk expected loss 0.22% 0.25% 0.27% 0.26% 0.28% 0.27% 0.22% 0.37% 1 Charge-off % (annualized) 0.39% 0.30% 0.23% 0.23% 0.19% 0.21% 0.26% 0.54% (1) End of Period 55 Indirect Auto Charge-off Performance Reconciliation non GAAP The auto loan performance trends were impacted by the acquired FirstMerit portfolio and accounting for recoveries on acquired loans. Accounting requires that all recoveries associated with loans charged off prior to the date of FirstMerit acquisition be booked as noninterest income. This inflates the level of net charge-offs as the normal recovery stream is not included. 4Q17 3Q17 4Q16 ($MM) Originated Acquired Total Originated Acquired Total Originated Acquired Total Average Auto Loans $11,106 $857 $11,963 $10,731 $982 $11,713 $9,416 $1,450 $10,866 Reported Net Charge-offs (NCOs) FirstMerit-related Net Recoveries in Noninterest Income $9.3 $2.2 $11.5 $6.9 $2.7 $9.6 $9.4 $3.8 $ (0.7) (0.7) -- (0.8) (0.8) -- (0.8) (0.8) Adjusted Net Charge-offs Reported NCOs as % of Avg Loans Adjusted NCOs as % of Avg Loans 0.33% 1.01% 0.39% 0.26% 1.08% 0.33% 0.40% 1.03% 0.48% 0.33% 0.67% 0.36% 0.26% 0.76% 0.30% 0.40% 0.80% 0.45% 56
29 Home Equity: $10.1 Billion (1) Focused on geographies within our Midwest footprint with relationship customers Focused on high quality borrowers 4Q17 originations: o Average FICO scores of >750+ o Average LTVs of <80% for junior liens and <70% for 1st-liens o Approximately 63% are 1st-liens Portfolio: average origination FICO of 770 Conservative underwriting manage the probability of default with increased interest rates used to ensure affordability on variable rate HELOCs Credit Quality Trends 4Q17 3Q17 2Q17 1Q17 4Q16 Period end balance ($B) $10.1 $10.0 $10.0 $10.0 $ days PD & accruing 0.81% 0.74% 0.76% 0.75% 0.70% 90+ days PD & accruing 0.18% 0.16% 0.19% 0.15% 0.11% NCOs 0.01% 0.06% 0.05% 0.07% 0.06% NALs 0.68% 0.71% 0.68% 0.70% 0.71% (1) End of Period 57 Home Equity Origination Trends Consistent origination strategy since 2010 HPI Index is at highest level since pre-2007 consistent with general assessment of the overall market Origination continues to be oriented toward 1st lien position HELOCs ($B) Originations (1) $4.3 $3.3 $2.9 $2.6 $2.2 $1.7 $1.9 $1.3 Avg. LTV 77% 78% 77% 76% 72% 74% 74% 73% Avg. FICO Charge-off % (annualized) 0.05% 0.06% 0.23% 0.44% 0.99% 1.40% 1.28% 1.84% HPI Index (2) Unemployment rate (3) 4.4% 4.9% 5.3% 6.2% 7.4% 8.1% 8.9% 9.6% (1) Originations are based on commitment amounts (2) FHFA Regional HPI ENC Season-Adj; U.S. and Census Division (3) Source: BLS.gov; average of monthly seasonally-adjusted unemployment rate for period 58
30 Residential Mortgages: $9.0 Billion (1) Traditional product mix focused on geographies within our Midwest footprint Early identification of at-risk borrowers. Home Savers program has a 75% success rate Average 4Q17 origination: FICO of 759, purchased / refinance mix approximately 75 / 25% Credit Quality Trends 4Q17 3Q17 2Q17 1Q17 4Q16 Period end balance ($B) $9.0 $8.6 $8.2 $7.8 $ days PD & accruing 2.66% 2.45% 2.61% 2.42% 2.82% 90+ days PD & accruing 0.80% 0.73% 0.79% 0.88% 0.87% NCOs 0.04% 0.10% 0.05% 0.13% 0.09% NALs 0.93% 0.87% 0.97% 1.03% 1.17% (1) End of Period 59 Residential Mortgages Origination Trends Consistent origination strategy since 2010 HPI Index is at highest level since pre-2007 consistent with general assessment of the overall market ($B) Portfolio Originations $2.7 $1.9 $1.5 $1.2 $1.4 $0.9 $1.4 $1.1 Avg. LTV 84.0% 84.0% 83.2% 82.6% 77.8% 81.3% 80.5% 82.0% Avg. FICO Charge-off % (annualized) 0.08% 0.09% 0.17% 0.35% 0.52% 0.92% 1.20% 1.54% HPI Index (1) Unemployment rate (2) 4.4% 4.9% 5.3% 6.2% 7.4% 8.1% 8.9% 9.6% (1) FHFA Regional HPI ENC Season-Adj; U.S. and Census Division (2) Source: BLS.gov; average of monthly seasonally-adjusted unemployment rate for period 60
31 Recreational Vehicle & Marine: $2.4 Billion (1) Indirect origination via established dealers with expansion into new states, primarily in the southeast. Centrally underwritten, with focus on quality borrowers Average 4Q17 origination: FICO of 798 Underwriting aligns with Huntington s origination standards and risk appetite o Leveraging Huntington Auto Finance s existing infrastructure and standards Credit Quality Trends 4Q17 3Q17 2Q17 1Q17 4Q16 Period end balance ($B) $2.4 $2.4 $2.2 $1.9 $ days PD & accruing 0.63% 0.61% 0.60% 0.79% 0.74% 90+ days PD & accruing 0.05% 0.09% 0.11% 0.05% 0.05% NCOs 0.46% 0.59% 0.37% 0.50% 0.47% NALs 0.03% 0.01% 0.02% 0.01% 0.01% (1) End of Period 61 Credit Quality Review 62
32 Credit Quality Trends Overview 4Q17 3Q17 2Q17 1Q17 4Q16 Net charge-off ratio 0.24% 0.25% 0.21% 0.24% 0.26% 90+ days PD and accruing NAL ratio (1) NPA ratio (2) Criticized asset ratio (3) ALLL ratio ALLL / NAL coverage ALLL / NPA coverage ACL ratio ACL / Criticized assets (3) ACL / NAL coverage ACL / NPA coverage (1) NALs divided by total loans and leases (2) NPAs divided by the sum of loans and leases, impaired loans held for sale, other real estate and other NPAs (3) Criticized assets = commercial criticized loans + consumer loans >60 DPD + OREO; Total criticized assets divided by the sum of loans and leases, impaired loans held for sale, other real estate and other NPAs 63 Total Consumer Loan Delinquencies (1) 30+ Days 90+ Days 1.50% 1.45% 1.46% 0.38% 0.36% 0.36% 1.40% 1.35% 1.30% 1.25% 1.20% 1.15% 1.34% 1.24% 1.25% 1.24% 1.23% 1.20% 1.25% 1.36% 0.34% 0.32% 0.30% 0.28% 0.26% 0.34% 0.32% 0.31% 0.30% 0.30% 0.30% 0.30% 0.28% 1.10% 0.24% 1.05% 0.22% 1.00% Reported Delinquencies 0.20% Reported Delinquencies 4Q15 1Q16 2Q16 3Q16 4Q16 1Q17 2Q17 3Q17 4Q17 4Q15 1Q16 2Q16 3Q16 4Q16 1Q17 2Q17 3Q17 4Q17 (1) End of period; delinquent but accruing as a % of related outstandings at EOP 64
33 Consumer Loan Delinquencies (1) 30+ Days 90+ Days 4.00% 1.00% 0.90% 0.87% 0.88% 3.00% 2.82% 2.42% 2.61% 2.45% 2.66% 0.80% 0.70% 0.60% 0.79% 0.73% 0.80% 2.00% 0.50% 0.40% 1.00% 0.00% 0.94% 0.84% 0.80% 0.90% 0.94% 0.70% 0.75% 0.76% 0.74% 0.81% 4Q16 1Q17 2Q17 3Q17 4Q % 0.20% 0.10% 0.00% 0.15% 0.19% 0.16% 0.18% 0.11% 0.09% 0.07% 0.07% 0.09% 0.06% 4Q16 1Q17 2Q17 3Q17 4Q17 Residential Mortgages Home Equity Auto Loans & Lease Residential Mortgages Home Equity Auto Loans & Lease (1) End of period; delinquent but accruing as a % of related outstandings at EOP 65 Total Commercial Loan Delinquencies 30+ Days (1) 90+ Days (2) 0.50% 0.25% 0.45% 0.43% 0.40% 0.20% 0.35% 0.30% 0.25% 0.28% 0.29% 0.24% 0.31% 0.29% 0.29% 0.15% 0.12% 0.11% 0.20% 0.15% 0.10% 0.16% 0.15% 0.10% 0.05% 0.08% 0.07% 0.06% 0.10% 0.08% 0.07% 0.05% 0.03% 0.00% 4Q15 1Q16 2Q16 3Q16 4Q16 1Q17 2Q17 3Q17 4Q % 4Q15 1Q16 2Q16 3Q16 4Q16 1Q17 2Q17 3Q17 4Q17 (1) Amounts include Huntington Technology Finance administrative lease delinquencies (2) Amounts include Huntington Technology Finance administrative lease delinquencies and accruing purchased impaired loans acquired in the FirstMerit transaction. Under the applicable accounting guidance (ASC ), the accruing purchased impaired loans were recorded at fair value upon acquisition and remain in accruing status. 66
34 Net Charge-Offs Total Commercial Loans Total Consumer Loans $100 $90 $80 ($MM) Amount Annualized % 0.50% 0.40% ($MM) $100 $ % 0.42% $ % 0.40% 0.50% 0.40% $70 $70 $ % $ % 0.30% $50 $50 $ % $ % $30 $ % 0.07% 0.11% 0.11% 0.07% 0.10% $30 $20 $34 $33 $27 $34 $ % $10 $0 $10 $6 $9 $9 $7 4Q16 1Q17 2Q17 3Q17 4Q % $10 $0 4Q16 1Q17 2Q17 3Q17 4Q % 67 Nonperforming Asset Flow Analysis End of Period ($MM) 4Q17 3Q17 2Q17 1Q17 4Q16 NPA beginning-of-period $387 $415 $458 $481 $476 Additions / increases Return to accruing status (25) (38) (33) (22) (13) Loan and lease losses (21) (23) (17) (34) (37) Payments (54) (44) (71) (83) (33) Sales & other (14) (8) (11) (9) (62) NPA end-of-period $389 $387 $415 $458 $481 Percent change (Q/Q) 0% (7)% (9)% (5)% 1% 68
35 Total Commercial Loans Criticized Loan Flow Analysis End of Period ($MM) 4Q17 3Q17 2Q17 1Q17 4Q16 Criticized beginning-of-period $2,293 $2,184 $2,185 $2,105 $2,022 Additions / increases Advances Upgrades to Pass (253) (220) (138) (91) (106) Paydowns (484) (244) (190) (297) (263) Charge-offs (11) (19) (12) (14) (15) FirstMerit Net Change Criticized end-of-period $2,156 $2,293 $2,184 $2,185 $2,105 Percent change (Q/Q) (6)% 5% (0)% 4% 4% 69 Franchise and Leadership 70
 Huntington s top 10 deposit")
 $2B $2B $50B $2B $4B Ranked #1 in branch market share in both Ohio (13%) and Michigan (12%) Ranked #1 SBA 7(a) lender in footprint and #2 in nation (2) $1B")
 Rankings for SBA 2018 first fiscal quarter (December 31 quarter-end); (3) Ranking among Icon Advisory Group's Retail Mortgage Consortium of leading lenders YTD 9/17")


36 Huntington Bancshares Overview $104 billion asset Midwest financial services holding company Founded in 1866 in Columbus, Ohio Traditional regional bank with strategic focus on small to medium-sized businesses, consumers, and vehicle finance Combined GDP of 8 state core footprint represents 4th largest economy in world (1) Huntington s top 10 deposit MSAs represent ~78% of total deposits $1B Ranked #1 in deposit share in 14% of total footprint MSAs and top 3 in 41% $15B Ranked #2 in deposit market share in Ohio (15%) and #6 in Michigan (7%) $2B $2B $50B $2B $4B Ranked #1 in branch market share in both Ohio (13%) and Michigan (12%) Ranked #1 SBA 7(a) lender in footprint and #2 in nation (2) $1B Ranked #4 mortgage lender in footprint (3) Source: SNL Financial, FDIC deposit data as of June 30, 2017 (1) Source: 2016 International Monetary Fund and US Bureau of Economic Analysis; (2) Rankings for SBA 2018 first fiscal quarter (December 31 quarter-end); (3) Ranking among Icon Advisory Group's Retail Mortgage Consortium of leading lenders YTD 9/17 71 Leadership Team Chairman, President, and CEO Steve Steinour Business Segments Consumer and Business Banking Andy Harmening Regional Banking and The Private Client Group Sandy Pierce Commercial Banking and Commercial Real Estate Rick Remiker Vehicle Finance Sandy Pierce Finance Mac McCullough Chief Financial Officer Risk Helga Houston Chief Risk Officer Credit Dan Neumeyer Chief Credit Officer Human Resources and Diversity Raj Syal Corporate Operations Mark Thompson Technology and Operations Paul Heller Chief Technology and Operations Officer Internal Audit Harry Farver Chief Auditor Communications and Marketing Julie Tutkovics Chief Communication & Marketing Officer Legal Jana Litsey General Counsel and Secretary 72
Welcome. Huntington Bancshares Incorporated 2018 First Quarter Earnings Review. April 24, 2018
 Welcome Huntington Bancshares Incorporated 2018 First Quarter Earnings Review April 24, 2018 2018 Huntington Bancshares Incorporated. All rights reserved. (NASDAQ: HBAN) Disclaimer CAUTION REGARDING FORWARD-LOOKING
Welcome. Huntington Bancshares Incorporated 2017 Third Quarter Earnings Review. October 25, 2017
 Welcome Huntington Bancshares Incorporated 2017 Third Quarter Earnings Review October 25, 2017 2017 Huntington Bancshares Incorporated. All rights reserved. (NASDAQ: HBAN) Disclaimer CAUTION REGARDING
Welcome Huntington Bancshares Incorporated
 Welcome Huntington Bancshares Incorporated 2018 RBC Capital Markets Financial Institutions Conference March 7, 2018 2018 Huntington Bancshares Incorporated. All rights reserved. (NASDAQ: HBAN) Disclaimer
Welcome. Huntington Bancshares Incorporated 2016 Fourth Quarter Earnings Review. January 25, 2017
 Welcome Huntington Bancshares Incorporated 2016 Fourth Quarter Earnings Review January 25, 2017 2016 Huntington Bancshares Incorporated. All rights reserved. (NASDAQ: HBAN) Disclaimer CAUTION REGARDING
Welcome. Huntington Bancshares Incorporated 2018 Fourth Quarter Earnings Review. January 24, 2019
 Welcome Huntington Bancshares Incorporated 2018 Fourth Quarter Earnings Review January 24, 2019 2019 Huntington Bancshares Incorporated. All rights reserved. (Nasdaq: HBAN) Disclaimer CAUTION REGARDING
Welcome. Huntington Bancshares Incorporated 2017 First Quarter Earnings Review. April 19, 2017
 Welcome Huntington Bancshares Incorporated 2017 First Quarter Earnings Review April 19, 2017 2017 Huntington Bancshares Incorporated. All rights reserved. (NASDAQ: HBAN) Disclaimer CAUTION REGARDING FORWARD-LOOKING
Welcome. Huntington Bancshares Incorporated 2018 Third Quarter Earnings Review. October 23, 2018
 Welcome Huntington Bancshares Incorporated 2018 Third Quarter Earnings Review October 23, 2018 2018 Huntington Bancshares Incorporated. All rights reserved. (Nasdaq: HBAN) Disclaimer CAUTION REGARDING
HUNTINGTON BANCSHARES INCORPORATED REPORTS 2018 FIRST QUARTER EARNINGS
 FOR IMMEDIATE RELEASE April 24, 2018 Analysts: Mark Muth (mark.muth@huntington.com), 614.480.4720 Media: Matt Samson (matt.b.samson@huntington.com), 312.263.0203 HUNTINGTON BANCSHARES INCORPORATED REPORTS
HUNTINGTON BANCSHARES INCORPORATED REPORTS 2017 FIRST QUARTER EARNINGS
 FOR IMMEDIATE RELEASE April 19, 2017 Analysts: Mark Muth (mark.muth@huntington.com), 614.480.4720 Media: Matt Samson (matt.b.samson@huntington.com), 312.263.0203 Brent Wilder (brent.wilder@huntington.com),
HUNTINGTON BANCSHARES INCORPORATED REPORTS 2018 THIRD QUARTER EARNINGS OF $0.33 PER COMMON SHARE
 FOR IMMEDIATE RELEASE October 23, 2018 Analysts: Mark Muth (mark.muth@huntington.com), 614.480.4720 Media: Matt Samson (matt.b.samson@huntington.com), 312.263.0203 HUNTINGTON BANCSHARES INCORPORATED REPORTS
FOR IMMEDIATE RELEASE
 FOR IMMEDIATE RELEASE January 23, 2018 Analysts: Mark Muth (mark.muth@huntington.com), 614.480.4720 Media: Matt Samson (matt.b.samson@huntington.com), 312.263.0203 Michael Sherman (michael.sherman@huntington.com),
HUNTINGTON BANCSHARES INCORPORATED
 UNITED STATES SECURITIES AND EXCHANGE COMMISSION Washington, D.C. 20549 FORM 8-K CURRENT REPORT Pursuant to Section 13 OR 15(d) of The Securities Exchange Act of 1934 Date of Report (Date of earliest event
Media: Maureen Brown
 FOR IMMEDIATE RELEASE April 22, 2015 Analysts: Mark Muth (mark.muth@huntington.com), 614.480.4720 Media: Maureen Brown (maureen.brown@huntington.com), 614.480.5512 HUNTINGTON BANCSHARES INCORPORATED REPORTS
Welcome Huntington Bancshares Incorporated
 Welcome Huntington Bancshares Incorporated 2019 Annual Shareholders Meeting April 18, 2019 2019 Huntington Bancshares Incorporated. All rights reserved. (Nasdaq: HBAN) Caution Regarding Forward-Looking
Media: Maureen Brown
 FOR IMMEDIATE RELEASE July 23, 2015 Analysts: Mark Muth (mark.muth@huntington.com), 614.480.4720 Media: Maureen Brown (maureen.brown@huntington.com), 614.480.5512 HUNTINGTON BANCSHARES INCORPORATED REPORTS
KeyCorp Beth E. Mooney Don Kimble
 KeyCorp Fourth Quarter 2017 Earnings Review January 18, 2018 Beth E. Mooney Chairman and Chief Executive Officer Don Kimble Chief Financial Officer FORWARD-LOOKING STATEMENTS AND ADDITIONAL INFORMATION
KeyCorp. Third Quarter 2017 Earnings Review. Don Kimble Chief Financial Officer. Beth E. Mooney Chairman and Chief Executive Officer.
 KeyCorp Third Quarter 2017 Earnings Review October 19, 2017 Beth E. Mooney Chairman and Chief Executive Officer Don Kimble Chief Financial Officer FORWARD-LOOKING STATEMENTS AND ADDITIONAL INFORMATION
Welcome Huntington Bancshares Incorporated
 Welcome Huntington Bancshares Incorporated Investor Presentation August 2018 2018 Huntington Bancshares Incorporated. All rights reserved. (NASDAQ: HBAN) Disclaimer CAUTION REGARDING FORWARD-LOOKING STATEMENTS
4Q 18 EARNINGS PRESENTATION
 4Q 18 EARNINGS PRESENTATION January 18, 2019 2019 SunTrust Banks, Inc. SunTrust is a federally registered trademark of SunTrust Banks, Inc. IMPORTANT CAUTIONARY STATEMENT This presentation should be read
3Q18 Quarterly Supplement
 3Q18 Quarterly Supplement October 12, 2018 2018 Wells Fargo & Company. All rights reserved. Table of contents 3Q18 Results 3Q18 Highlights Pages 2 3Q18 Earnings 3 Year-over-year results 4 Balance Sheet
4Q15 Quarterly Supplement
 4Q15 Quarterly Supplement January 15, 2016 These results do not reflect the impact of the agreement in principle Wells Fargo & Company reached with the United States government on February 1, 2016 to pay
Welcome. Merger with FirstMerit Corporation. January 26, 2016
 Welcome Merger with FirstMerit Corporation January 26, 2016 Disclaimer CAUTION REGARDING FORWARD-LOOKING STATEMENTS This presentation may contain certain forward-looking statements, including certain plans,
3Q13 Quarterly Supplement. October 11, 2013
 3Q13 Quarterly Supplement October 11, 2013 Table of contents 3Q13 Results - 3Q13 Results Page 2 - Year-over-year results 3 - Strong revenue diversification 4 - Balance Sheet and credit overview 5 - Income
2Q15 Quarterly Supplement
 2Q15 Quarterly Supplement July 14, 2015 2015 Wells Fargo & Company. All rights reserved. Table of contents 2Q15 Results - 2Q15 Highlights Page 2 - Year-over-year results 3 - Balance Sheet and credit overview
4Q17 and FY2017 Financial Results. January 19, 2018
 4Q17 and FY2017 Financial Results January 19, 2018 Forward-looking statements and use of key performance metrics and non-gaap Financial Measures This document contains forward-looking statements within
4Q14 and FY 2014 Financial Results. January 26, 2015
 4Q14 and FY 2014 Financial Results January 26, 2015 Forward-looking statements This document contains forward-looking statements within the Private Securities Litigation Reform Act of 1995. Statements
Huntington Bancshares Incorporated
 UNITED STATES SECURITIES AND EXCHANGE COMMISSION Washington, D.C. 20549 FORM 10-Q QUARTERLY REPORT PURSUANT TO SECTION 13 OR 15(d) OF THE SECURITIES EXCHANGE ACT OF 1934 QUARTERLY PERIOD ENDED September
1Q19 Financial Results. April 18, 2019
 1Q19 Financial Results April 18, 2019 Forward-looking statements and use of key performance metrics and non-gaap financial measures This document contains forward-looking statements within the meaning
FIFTH THIRD ANNOUNCES SECOND QUARTER 2017 NET INCOME TO COMMON SHAREHOLDERS OF $344 MILLION, OR $0.45 PER DILUTED SHARE
 CONTACTS: Sameer Gokhale (Investors) News Release (513) 534-2219 Larry Magnesen (Media) FOR IMMEDIATE RELEASE (513) 534-8055 July 21, 2017 FIFTH THIRD ANNOUNCES SECOND QUARTER 2017 NET INCOME TO COMMON
Third Quarter 2017 Earnings Conference Call
 Third Quarter 2017 Earnings Conference Call October 19, 2017 Kelly S. King Chairman and Chief Executive Officer Daryl N. Bible Chief Financial Officer Forward-Looking Information This presentation contains
Huntington Bancshares Incorporated
 UNITED STATES SECURITIES AND EXCHANGE COMMISSION Washington, D.C. 20549 FORM 10-Q QUARTERLY REPORT PURSUANT TO SECTION 13 OR 15(d) OF THE SECURITIES EXCHANGE ACT OF 1934 QUARTERLY PERIOD ENDED September
Ally Financial Inc. 3Q 2018 Earnings Review
 Ally Financial Inc. 3Q 2018 Earnings Review October 25, 2018 Contact Ally Investor Relations at (866) 710-4623 or investor.relations@ally.com Forward-Looking Statements and Additional Information This
3Q17 Quarterly Supplement
 3Q17 Quarterly Supplement October 13, 2017 2017 Wells Fargo & Company. All rights reserved. Table of contents 3Q17 Results 3Q17 Highlights Year-over-year results Page 2 Balance Sheet and credit overview
4Q18 and 2018 Financial Results. January 18, 2019
 4Q18 and 2018 Financial Results January 18, 2019 Forward-looking statements and use of key performance metrics and non-gaap financial measures This document contains forward-looking statements within the
1Q17 Quarterly Supplement
 1Q17 Quarterly Supplement April 13, 2017 2017 Wells Fargo & Company. All rights reserved. Table of contents 1Q17 Results Year-over-year results Retail Banking customer activity 1Q17 Highlights Page 2 Balance
1Q15 Quarterly Supplement
 1Q15 Quarterly Supplement April 14, 2015 2015 Wells Fargo & Company. All rights reserved. Table of contents 1Q15 Results - 1Q15 Highlights Page 2 - Year-over-year results 3-1Q15 Revenue diversification
Ally Financial Inc. 2Q Earnings Review
 Ally Financial Inc. 2Q Earnings Review July 29, 2014 Contact Ally Investor Relations at (866) 710-4623 or investor.relations@ally.com Forward-Looking Statements and Additional Information The following
Fifth Third Announces Fourth Quarter 2018 Results
 Fifth Third Announces Fourth Quarter 2018 Results Diluted earnings per share of $0.64, including a negative $0.05 impact from certain items on page 2 Key Financial Data $ millions for all balance sheet
FIFTH THIRD ANNOUNCES SECOND QUARTER 2018 NET INCOME TO COMMON SHAREHOLDERS OF $563 MILLION, OR $0.80 PER DILUTED SHARE
 CONTACTS: Sameer Gokhale (Investors) News Release (513) 534-2219 Larry Magnesen (Media) FOR IMMEDIATE RELEASE (513) 534-8055 July 19, 2018 FIFTH THIRD ANNOUNCES SECOND QUARTER 2018 NET INCOME TO COMMON
2Q16 Quarterly Supplement
 2Q16 Quarterly Supplement July 15, 2016 2016 Wells Fargo & Company. All rights reserved. Table of contents 2Q16 Results 2Q16 Highlights Page 2 Year-over-year results 3 Balance Sheet and credit overview
1Q 18 EARNINGS PRESENTATION
 1Q 18 EARNINGS PRESENTATION April 20, 2018 2018 SunTrust Banks, Inc. SunTrust is a federally registered trademark of SunTrust Banks, Inc. IMPORTANT CAUTIONARY STATEMENT This presentation should be read
Forward-Looking Information. Non-GAAP Information
 Forward-Looking Information This presentation contains forward-looking statements with respect to the financial condition, results of operations and businesses of BB&T. Statements that are not historical
The Huntington National Bank
 December 5, 1 The Huntington National Bank George Mokrzan, Ph.D. Director of Economics Nicholas Blizniak Research Analyst Indiana Indiana Illinois Census Population 17-Dec. 1,,3. th Real GDP - All Industries
1Q18 Financial Results. April 20, 2018
 1Q18 Financial Results April 20, 2018 Forward-looking statements and use of key performance metrics and non-gaap financial measures This document contains forward-looking statements within the Private
Third Quarter 2017 Earnings Presentation. October 24, 2017
 Third Quarter 207 Earnings Presentation October 24, 207 Forward looking statements This presentation contains forward-looking statements made pursuant to the safe harbor provisions of the Private Securities
Ally Financial Inc. 4Q Earnings Review
 Ally Financial Inc. 4Q Earnings Review January 29, 2015 Contact Ally Investor Relations at (866) 710-4623 or investor.relations@ally.com Forward-Looking Statements and Additional Information The following
3Q17 Financial Results. October 20, 2017
 3Q17 Financial Results October 20, 2017 Forward-looking statements and use of key performance metrics and Non-GAAP financial measures This document contains forward-looking statements within the Private
Fifth Third Bancorp 1Q18 Earnings Presentation
 Fifth Third Bancorp Q8 Earnings Presentation April 24, 208 Refer to earnings release dated April 24, 208 for further information. Fifth Third Bancorp All Rights Reserved Cautionary statement This presentation
The Huntington National Bank
 January 1, 19 The Huntington National Bank George Mokrzan, Ph.D. Director of Economics Nicholas Blizniak Research Analyst Indiana Indiana Illinois Census Population 1-Dec. 1,71,. th Real GDP - All Industries
Fourth Quarter 2018 Earnings Conference Call
 Fourth Quarter 2018 Earnings Conference Call January 17, 2019 Kelly S. King Chairman and Chief Executive Officer Daryl N. Bible Chief Financial Officer Forward-Looking Information This presentation contains
Ally Financial Inc. 1Q 2015 Earnings Review
 Ally Financial Inc. 1Q 2015 Earnings Review April 28, 2015 Contact Ally Investor Relations at (866) 710-4623 or investor.relations@ally.com Forward-Looking Statements and Additional Information The following
F I N A N C I A L R E S U L T S
 Q5 April, 05 Q5 Financial highlights ROTCE % CET ratio 0.6% Overhead ratio 60% Net payout ratio LTM 5% Q5 net income of $5.9B and EPS of $.5 Revenue of $.8B Adjusted expense of $.B 5 and adjusted overhead
Fifth Third Bancorp 3Q18 Earnings Presentation
 Fifth Third Bancorp 3Q8 Earnings Presentation October 23, 208 Refer to earnings release dated October 23, 208 for further information. FORWARD-LOOKING STATEMENTS This communication contains forward-looking
F I N A N C I A L R E S U L T S
 3Q5 October 3, 05 3Q5 Financial highlights ROTCE 5% CET ratio.4% Overhead ratio 3 65% Net payout ratio LTM 4 49% 3Q5 reported net income of $6.8B and EPS of $.68; net income of $5.4B, EPS of $.3 and ROTCE
TCF Financial Corporation Fourth Quarter Investor Presentation
 TCF Financial Corporation 04 Fourth Quarter Investor Presentation Cautionary Statements for Purposes of the Safe Harbor Provisions of the Securities Litigation Reform Act Any statements contained in this
Second Quarter 2018 Earnings Conference Call
 Second Quarter 2018 Earnings Conference Call July 19, 2018 Kelly S. King Chairman and Chief Executive Officer Daryl N. Bible Chief Financial Officer Forward-Looking Information This presentation contains
4Q14 Quarterly Supplement
 4Q14 Quarterly Supplement January 14, 2015 2015 Wells Fargo & Company. All rights reserved. Table of contents 4Q14 Results - 4Q14 Highlights - Year-over-year results - 4Q14 Revenue diversification - Balance
Second Quarter 2018 Earnings Conference Call July 19, 2018
 Second Quarter 2018 Earnings Conference Call July 19, 2018 WBS 2Q18 Earnings Highlights ($ in millions, except EPS data) Significant progress on our key strategic initiatives: 35 consecutive quarters of
CONTACTS: Sameer Gokhale (Investors) FOR IMMEDIATE RELEASE (513) January 24, 2017 Larry Magnesen (Media) (513)
 FOR IMMEDIATE RELEASE (513) January 24, 2017 Larry Magnesen (Media) (513)") News Release CONTACTS: Sameer Gokhale (Investors) FOR IMMEDIATE RELEASE (513) 534-2219 January 24, 2017 Larry Magnesen (Media) (513) 534-8055 FIFTH THIRD ANNOUNCES FOURTH QUARTER EARNINGS PER DILUTED SHARE
News Release CONTACTS: Sameer Gokhale (Investors) FOR IMMEDIATE RELEASE (513) 534-2219 January 24, 2017 Larry Magnesen (Media) (513) 534-8055 FIFTH THIRD ANNOUNCES FOURTH QUARTER EARNINGS PER DILUTED SHARE
Forward-Looking Information
 Forward-Looking Information This presentation contains forward-looking statements with respect to the financial condition, results of operations and businesses of BB&T. Statements that are not historical
Third Quarter 2018 Earnings Conference Call
 Third Quarter 2018 Earnings Conference Call October 18, 2018 Kelly S. King Chairman and Chief Executive Officer Daryl N. Bible Chief Financial Officer Forward-Looking Information This presentation contains
4Q18 Financial Results. January 15, 2019
 4Q8 Financial Results January 5, 209 4Q8 Financial highlights ROTCE 4% Common equity Tier 2 2.0% Net payout LTM 3 92% 4Q8 net income of $7.B and EPS of $.98 Managed revenue of $26.8B 4 Expense of $5.7B
F I N A N C I A L R E S U L T S
 F I N A N C I A L R E S U L T S Q6 April 3, 206 F I N A N C I A L R E S U L T S Q6 Financial highlights ROTCE 2% CET ratio 2.7% Overhead ratio 3 57% Net payout ratio LTM 4 48% Q6 net income of $5.5B and
F.N.B. Corporation Reports Third Quarter 2016 Earnings
 Press Release F.N.B. Corporation Reports Third Quarter 2016 Earnings PITTSBURGH, PA - October 19, 2016 F.N.B. Corporation (NYSE: FNB) reported earnings for the third quarter of 2016 with net income available
4Q 17 EARNINGS PRESENTATION
 4Q 17 EARNINGS PRESENTATION January 19, 2018 2018 SunTrust Banks, Inc. SunTrust is a federally registered trademark of SunTrust Banks, Inc. IMPORTANT CAUTIONARY STATEMENT This presentation should be read
3Q 18 EARNINGS PRESENTATION
 3Q 18 EARNINGS PRESENTATION October 19, 2018 2018 SunTrust Banks, Inc. SunTrust is a federally registered trademark of SunTrust Banks, Inc. IMPORTANT CAUTIONARY STATEMENT This presentation should be read
Bryn Mawr Bank Corporation Reports First Quarter Net Income of $9.0 Million, Improved Net Interest Margin
 FOR RELEASE: IMMEDIATELY Frank Leto, President, CEO FOR MORE INFORMATION CONTACT: 610-581-4730 Mike Harrington, CFO 610-526-2466 Bryn Mawr Bank Corporation Reports First Quarter Net Income of $9.0 Million,
2Q18 Quarterly Supplement
 2Q18 Quarterly Supplement July 13, 2018 2018 Wells Fargo & Company. All rights reserved. Table of contents 2Q18 Results 2Q18 Highlights Page 2 Update on customer remediation for previously disclosed matters
Ally Financial Inc. 2Q 2018 Earnings Review
 Ally Financial Inc. 2Q 2018 Earnings Review July 26, 2018 Contact Ally Investor Relations at (866) 710-4623 or investor.relations@ally.com Forward-Looking Statements and Additional Information This presentation
THIRD QUARTER 2018 FINANCIAL SUPPLEMENT
 THIRD QUARTER 2018 FINANCIAL SUPPLEMENT 1 FORWARD-LOOKING STATEMENTS AND ADDITIONAL INFORMATION This document and related communications should be read in conjunction with the financial statements, notes,
SECOND QUARTER 2018 FINANCIAL SUPPLEMENT
 SECOND QUARTER 2018 FINANCIAL SUPPLEMENT 1 FORWARD-LOOKING STATEMENTS AND ADDITIONAL INFORMATION This document and related communications should be read in conjunction with the financial statements, notes,
FIFTH THIRD ANNOUNCES FIRST QUARTER 2018 NET INCOME TO COMMON SHAREHOLDERS OF $689 MILLION, OR $0.97 PER DILUTED SHARE
 CONTACTS: Sameer Gokhale (Investors) News Release (513) 534-2219 Larry Magnesen (Media) FOR IMMEDIATE RELEASE (513) 534-8055 April 24, 2018 FIFTH THIRD ANNOUNCES FIRST QUARTER 2018 NET INCOME TO COMMON
Third Quarter 2018 Earnings Conference Call October 18, 2018
 Third Quarter 2018 Earnings Conference Call October 18, 2018 WBS 3Q18 Earnings Highlights ($ in millions, except EPS data) Continued progress on our key strategic initiatives: 36 consecutive quarters of
F.N.B. Corporation Reports Fourth Quarter and Full Year 2016 Earnings
 Press Release F.N.B. Corporation Reports Fourth Quarter and Full Year 2016 Earnings PITTSBURGH, PA - January 18, 2017 F.N.B. Corporation (NYSE: FNB) reported earnings for the fourth quarter of 2016 with
Fourth Quarter 2017 Earnings Review
 Citi Investor Relations On February 23, 2018, Citi announced that it was adjusting downward its fourth quarter and full year 2017 financial results, from those reported on January 16, 2018, due to an updated
Ally Financial Inc. 4Q 2017 Earnings Review
 Ally Financial Inc. 4Q 2017 Earnings Review January 30, 2018 Contact Ally Investor Relations at (866) 710-4623 or investor.relations@ally.com Forward-Looking Statements and Additional Information This
Ally Financial Reports Second Quarter 2018 Financial Results
 Ally Financial Inc. NYSE: ALLY www.ally.com/about News release: IMMEDIATE RELEASE Ally Financial Reports Second Quarter 2018 Financial Results Net Income of $349 million, $0.81 EPS, $0.83 Adjusted EPS
F I N A N C I A L R E S U L T S
 Q January, 05 Q Financial highlights Q net income of $.9B and EPS of $.9 Revenue of $.6B, adjusted expense of $.B and ROTCE of % Q results included as a significant item $.0B (after-tax) Firmwide legal
3Q18 Financial Results. October 19, 2018
 3Q18 Financial Results October 19, 2018 Forward-looking statements and use of key performance metrics and non-gaap financial measures This document contains forward-looking statements within the Private
INVESTOR PRESENTATION
 INVESTOR PRESENTATION JUNE 2017 DISCLAIMER Forward-Looking Statements This presentation contains forward-looking statements within the meaning of the Private Securities Litigation Reform Act of 1995. These
Ally Financial Inc. Auto Securitization - Corporate Overview 2Q 2018
 Ally Financial Inc. Auto Securitization - Corporate Overview 2Q 2018 Contact Ally Investor Relations at (866) 710-4623 or investor.relations@ally.com Forward-Looking Statements and Additional Information
First Quarter 2018 Earnings Presentation. April 24, 2018
 First Quarter 2018 Earnings Presentation April 24, 2018 Forward looking statements Certain statements contained in this presentation are forward-looking statements within the meaning of Section 27A of
Ally Financial Reports First Quarter 2018 Financial Results
 Ally Financial Inc. NYSE: ALLY www.ally.com/about News release: IMMEDIATE RELEASE Ally Financial Reports First Quarter 2018 Financial Results Net Income of $250 million, $0.57 EPS, $0.68 Adjusted EPS 1
Ally Financial Inc. 1Q Earnings Review
 Ally Financial Inc. 1Q Earnings Review May 1, 2013 Contact Ally Investor Relations at (866) 710-4623 or investor.relations@ally.com Forward-Looking Statements and Additional Information The following should
Fourth Quarter 2018 Earnings Review
 Citi Investor Relations Fourth Quarter 2018 Earnings Review January 14, 2019 Overview 4Q 18 showed continued progress in a challenging environment Continued momentum in Institutional accrual businesses
THE PNC FINANCIAL SERVICES GROUP, INC. FINANCIAL SUPPLEMENT FIRST QUARTER 2012 (Unaudited)
") THE PNC FINANCIAL SERVICES GROUP, INC. FINANCIAL SUPPLEMENT FIRST QUARTER 2012 (Unaudited) THE PNC FINANCIAL SERVICES GROUP, INC. FINANCIAL SUPPLEMENT FIRST QUARTER 2012 (UNAUDITED) Consolidated Results:
THE PNC FINANCIAL SERVICES GROUP, INC. FINANCIAL SUPPLEMENT FIRST QUARTER 2012 (Unaudited) THE PNC FINANCIAL SERVICES GROUP, INC. FINANCIAL SUPPLEMENT FIRST QUARTER 2012 (UNAUDITED) Consolidated Results:
July 21, Wells Fargo & Company. All rights reserved.
 2Q10 Quarterly Supplement July 21, 2010 2010 Wells Fargo & Company. All rights reserved. Forward-looking statements and additional information Forward-looking statements: This Quarterly Supplement contains
Old National s 2016 net income is highest in the Company s history, increasing 15% over 2015, with organic loan growth over 7%
 NASDAQ: ONB oldnational.com FOR IMMEDIATE RELEASE January 24, 2017 Contacts: Media: Kathy A. Schoettlin (812) 465-7269 Executive Vice President Communications Old National s 2016 net income is highest
First Quarter 2018 Earnings Review
 Citi Investor Relations First Quarter 2018 Earnings Review April 13, 2018 Overview 1Q 18 showed strong operating results and balanced franchise performance Revenue growth in both Cards and Retail Banking
4Q18 Quarterly Supplement
 4Q18 Quarterly Supplement January 15, 2019 2019 Wells Fargo & Company. All rights reserved. Table of contents 4Q18 Results 4Q18 Highlights Pages 2 4Q18 Earnings 3 2018 year-over-year results 4 Balance
FOR MORE INFORMATION CONTACT: Mike Harrington, CFO
 FOR RELEASE: IMMEDIATELY Frank Leto, President, CEO FOR MORE INFORMATION CONTACT: 610-581-4730 Mike Harrington, CFO 610-526-2466 Bryn Mawr Bank Corporation Reports Fourth Quarter Earnings Impacted by $15.2
FINANCIAL SUPPLEMENT TO FIRST QUARTER 2008 EARNINGS RELEASE. Summary
 Summary Quarterly earnings of $0.48 per diluted share (GAAP); excluding $0.07 in after-tax merger charges, earnings were $0.55 (non-gaap - see page 17 for additional details) First quarter earnings included
RETURN ON EQUITY 6.9% Fourth Quarter Results RETURN ON EQUITY 5.3% CORE ROTCE % Notable Items
 Ally Financial Inc. NYSE: A www.ally.com/about News release: IMMEDIATE RELEASE Ally Financial Reports Full Year and Fourth Quarter 2017 Financial Results Full Year 2017 Net Income of $929 million, $2.04
F I N A N C I A L R E S U L T S
 4Q7 January, 08 4Q7 Financial highlights Reported Excluding significant items ROTCE 8% ROTCE % Common equity Tier.% Common equity Tier.4% Net payout LTM 4 98% Net payout LTM 4 90% 4Q7 net income of $4.B
Credit Suisse Financial Services Forum. Tim Sloan Chief Financial Officer
 Credit Suisse Financial Services Forum Tim Sloan Chief Financial Officer February 12, 2014 Wells Fargo vision Wells Fargo Vision We want to satisfy all our customers financial needs and help them succeed
focused 1Q17 Earnings Conference Call Supplemental Presentation April 27, 2017
 focused 1Q17 Earnings Conference Call Supplemental Presentation April 27, 2017 Safe Harbor And Non-GAAP Financial Measures Safe Harbor To the extent that statements in this PowerPoint presentation relate
BancAnalysts Association of Boston Conference
 BancAnalysts Association of Boston Conference John Shrewsberry Chief Financial Officer November 6, 2015 2015 Wells Fargo & Company. All rights reserved. 0 Wells Fargo vision Wells Fargo Vision We want
UMPQUA HOLDINGS CORPORATION. 4 th Quarter 2017 Earnings Conference Call Presentation
 UMPQUA HOLDINGS CORPORATION 4 th Quarter 2017 Earnings Conference Call Presentation January 24, 2018 Forward-looking Statements This presentation includes forward-looking statements within the meaning
Credit Suisse Financial Services Forum
 Credit Suisse Financial Services Forum John Shrewsberry Chief Financial Officer February 9, 2016 2016 Wells Fargo & Company. All rights reserved. Wells Fargo Vision We want to satisfy our customers financial
INVESTOR PRESENTATION NOVEMBER 2018
 INVESTOR PRESENTATION NOVEMBER 2018 0 DISCLAIMER Forward-Looking Statements This presentation contains forward-looking statements within the meaning of the Private Securities Litigation Reform Act of 1995.