O REPORT STRATEGIES TO INCREASE VALUE: Expand Retail Franchise. Efficienty Utilize Capital. Manage Equity Investment
|
|
|
- Claude Hodge
- 6 years ago
- Views:
Transcription
1 ANNUAL 2 6 O REPORT STRATEGIES TO INCREASE VALUE: Expand Retail Franchise Efficienty Utilize Capital Manage Equity Investment
2

3
4 United States Securities and Exchange Commission Washington, D.C FORM 10-K (Mark One) ANNUAL REPORT PURSUANT TO SECTION 13 OR 15 (d) OF THE SECURITIES EXCHANGE ACT OF 1934 For the fiscal year ended September 30, 2006 TRANSITION REPORT PURSUANT TO SECTION 13 OR 15 (d) OF THE SECURITIES EXCHANGE ACT OF 1934 Commission File No.: Charter Financial Corporation (Exact Name of Registrant as Specified in Its Charter) United States (State or Other Jurisdiction of Incorporation or Organization) (I.R.S. Employer Identification No.) 1233 O.G. Skinner Drive, West Point, Georgia (Address of Principal Executive Offices, including zip code) (706) (Registrant s telephone number, including area code) Securities registered pursuant to Section 12(b) of the Act: Common stock, $.01 par value per share. Name of Exchange on which registered: Nasdaq Global Market Securities registered pursuant to Section 12(g) of the Act: None. Indicate by check mark if the registrant is a well-known seasoned issuer, as defined in Rule 405 of the Securities Act. Yes No Indicate by check mark if the registrant is not required to file reports pursuant to Section 13 or 15(d) of the Act. Yes No - 1 -
5 Indicate by check mark whether the registrant (1) has filed all reports required to be filed by Section 13 or 15(d) of the Securities Exchange Act of 1934 during the preceding 12 months (or for such shorter period that the registrant was required to file such reports), and (2) has been subject to such filing requirements for the past 90 days. Yes No Indicate by check mark if disclosure of delinquent filers pursuant to Item 405 of Regulation S-K is not contained herein, and will not be contained, to the best of registrant s knowledge, in definitive proxy or information statements incorporated by reference in Part III of this Form 10-K or any amendment to this Form 10-K. Indicate by check mark whether the registrant is a large accelerated filer, an accelerated filer or a nonaccelerated filer. See definition of accelerated filer and large accelerated filer in Rule 12b-2 of the Exchange Act. (Check one): Large accelerated filer Accelerated filer Non-accelerated filer Indicate by check mark whether the registrant is a shell company (as defined in Rule 12b-2 of the Securities Exchange Act). Yes No The aggregate market value of the voting stock held by non-affiliates of the registrant as of March 31, 2006 was $131,936,855 based on the per share closing price as of March 31, 2006 on the Nasdaq Global Market for the registrant s common stock, which was $ There were 19,837,816 shares of the registrant s common stock, $.01 par value per share outstanding at October 31, DOCUMENTS INCORPORATED BY REFERENCE: Portions of the proxy statement for the 2007 Annual Meeting of Shareholders are incorporated by reference into Part III of this Form 10-K
6 CHARTER FINANCIAL CORPORATION ANNUAL REPORT ON FORM 10-K FOR THE FISCAL YEAR ENDED SEPTEMBER 30, 2006 TABLE OF CONTENTS ITEM PART I PAGE 1 BUSINESS 5 1A RISK FACTORS 48 1B UNRESOLVED STAFF COMMENTS 53 2 PROPERTIES 54 3 LEGAL PROCEEDINGS 55 4 SUBMISSION OF MATTERS TO A VOTE OF SECURITY HOLDERS 55 PART II 5 MARKET FOR REGISTRANT S COMMON EQUITY, RELATED STOCKHOLDER MATTERS AND ISSUER PURCHASES OF EQUITY SECURITIES 55 6 SELECTED FINANCIAL DATA 57 7 MANAGEMENT S DISCUSSION AND ANALYSIS OF FINANCIAL CONDITION AND RESULTS OF OPERATIONS 59 7A QUANTITATIVE AND QUALITATIVE DISCLOSURES ABOUT MARKET RISK 98 8 FINANCIAL STATEMENTS AND SUPPLEMENTARY DATA 98 9 CHANGES IN AND DISAGREEMENTS WITH ACCOUNTANTS ON ACCOUNTING AND FINANCIAL DISCLOSURE 98 9A CONTROLS AND PROCEDURES 98 9B OTHER INFORMATION 99 PART III 10 DIRECTORS, EXECUTIVE OFFICERS AND CORPORATE GOVERANCE EXECUTIVE COMPENSATION SECURITY OWNERSHIP OF CERTAIN BENEFICIAL OWNERS AND MANAGEMENT AND RELATED STOCKHOLDER MATTERS CERTAIN RELATIONSHIPS AND RELATED TRANSACTIONS, AND DIRECTOR INDEPENDENCE PRINCIPAL ACCOUNTING FEES AND SERVICES 101 PART IV 15 EXHIBITS, FINANCIAL STATEMENT SCHEDULES
7 FORWARD LOOKING STATEMENTS This Annual Report on Form 10-K contains forward-looking statements which may be identified by the use of such words as believe, expect, anticipate, should, planned, estimated, and potential. Examples of forward-looking statements include, but are not limited to, estimates with respect to our financial condition and results of operation and business that are subject to various factors which could cause actual results to differ materially from these estimates. These factors include, but are not limited to: general and local economic conditions; changes in interest rates, deposit flows, demand for mortgages and other loans, real estate values, and competition; the performance of Freddie Mac common stock price and the level of dividends received; changes in accounting principles, policies, or guidelines; economic, competitive, governmental, regulatory, and technological factors affecting our operations, pricing, products, and services; our ability to continue to maintain overhead costs at reasonable levels; our ability to generate qualifying thrift lending assets with competitive risk and yield characteristics; our ability to acquire funds from or invest funds in wholesale or secondary markets; the future earnings and capital levels of CharterBank, which could affect our ability to pay dividends in accordance with our dividend policies; the credit risks of lending and investing activities, including changes in the level and direction of loan delinquencies and write-offs and changes in estimates of the adequacy of the allowance for loan losses; the strength of the U.S. economy in general and the strength of the local economies in which we conduct operations; the effects of, and changes in, trade, monetary and fiscal policies and laws, including interest rate policies of the Board of Governors of the Federal Reserve System; the effects of, and changes in, foreign and military policies of the United States Government; inflation, interest rates, market and monetary fluctuations; our ability to access cost-effective funding; the timely development and acceptance of our new products and services and the perceived overall value of these products and services by users, including the features, pricing and quality compared to competitors products and services; the willingness of users to substitute competitors products and services for our products and services; our success in gaining regulatory approval of our products, services and branching locations, when required; the impact of changes in financial services laws and regulations, including laws concerning taxes, banking, securities and insurance; technological changes; acquisitions and dispositions; changes in consumer spending and saving habits; and our success at managing the risks involved in our business. Any or all of our forward-looking statements in this Annual Report on Form 10-K and in any other public statements we make may turn out to be wrong. They can be affected by inaccurate assumptions we might make or known or unknown risks and uncertainties. Consequently, no forward-looking statements can be guaranteed. We undertake no obligation to publicly update forward-looking statements, whether as a result of new information, future events or otherwise
8 PART I ITEM 1. BUSINESS General. Charter Financial Corporation ( Charter Financial, us, or we ) is a federally-chartered corporation organized in 2001 and is registered as a savings and loan holding company with the Office of Thrift Supervision ( OTS ). Charter Financial serves as the holding company for CharterBank ( Bank ). First Charter, MHC, a federal mutual holding company registered as a savings and loan holding company with the OTS, owns 80% of the outstanding shares of Charter Financial s common stock. Our common stock is quoted on the National Nasdaq Global Market under the symbol CHFN. Unless the context otherwise requires, all references herein to the Bank or Charter Financial include Charter Financial and the Bank on a consolidated basis. Our focus is to build stockholder value by effectively deploying our capital. Our plan is to invest in and build our retail banking franchise, manage our Freddie Mac common stock investment wisely and make use of the full range of capital management strategies that are available to us. Our plan is to grow our retail franchise, focusing on core deposits, by enhancing convenience and customer service. This means extending service hours and expanding access through additional branches, either de novo or through acquisitions, and electronic delivery channels. In this regard, we acquired EBA Bancshares, Inc. and its wholly-owned subsidiary, Eagle Bank of Alabama, in order to expand our presence in the Auburn-Opelika, Alabama market in February We also opened a new branch in Lagrange, Georgia in March 2005 and have relocated two branches in the Auburn-Opelika, Alabama area to more convenient facilities. In addition, we have a nineteen-year history with our investment in Freddie Mac common stock. We will liquidate enough Freddie Mac common stock to fund our self-tender filed on November 21, 2006 with the Securities a nd Exchange Commission. We will also sell enough Freddie Mac common stock to pay income taxes on this related gain. We will continually evaluate the remaining investment and explore our options. We expect our investment to continue to provide a competitive return for our stockholders. We will also evaluate, as appropriate, capital management strategies such as leverage, stock buyback programs and the payment of cash dividends. On October 16, 2001, CharterBank converted from a federally-chartered mutual savings and loan association into a two-tiered mutual holding company structure and became a wholly-owned subsidiary of Charter Financial. Charter Financial sold 3,964,481 shares of its common stock to the public, representing 20% of the outstanding shares, at $10.00 per share and received net proceeds of $37.2 million. Charter Financial contributed 50% of the net proceeds from the initial public offering to CharterBank. An additional 15,857,924 shares, or 80% of the outstanding shares of Charter Financial, were issued to First Charter, MHC. An Employee Stock Ownership Plan (ESOP) was established and such ESOP acquired 317,158 shares of Charter Financial in the offering, using the proceeds of a loan from Charter Financial. The ESOP loan is disclosed as unearned compensation reducing stockholders equity of Charter Financial. The net proceeds, adjusted for the ESOP, totaled approximately $34 million
9 As part of our reorganization, CharterBank organized First Charter, MHC. First Charter, MHC s principal assets are its investment in Charter Financial and 398,000 shares of Freddie Mac common stock, the fair value of which was $26.4 million as of September 30, First Charter, MHC does not engage in any business activity other than its investment in a majority of the common stock of Charter Financial, management of Freddie Mac common stock, and the management of any cash dividends received from Freddie Mac common stock. Federal law and regulations require that as long as First Charter, MHC is in existence it must own at least a majority of Charter Financial s common stock. During the year ended September 30, 2006, First Charter, MHC waived its right to receive cash dividends from Charter Financial. Upon continued regulatory approval, First Charter, MHC expects to waive its right to receive any future cash dividends from Charter Financial for the foreseeable future. At September 30, 2006, Charter Financial had total assets of $1.1 billion, of which $381.7 million was comprised of loans receivable and $308.1 million was comprised of mortgage-backed securities and collateralized mortgage obligations. At September 30, 2006, total deposits were $372.1 million, borrowings were $337.9 million and total stockholders equity was $267.7 million. Charter Financial owns 4,437,500 shares of Freddie Mac common stock of which 1,882,500 shares are owned directly by Charter Financial and the remaining 2,555,000 shares are owned by CharterBank. Charter Financial s 4,437,500 shares of Freddie Mac common stock had a market value of $294.3 million at September 30, CharterBank was founded in 1954 and currently operates in Georgia and Alabama with nine fullservice branch offices, three loan production offices and our corporate headquarters. CharterBank is a community-oriented financial institution serving primarily consumer households and small businesses. CharterBank is the only locally-owned and operated financial institution in Troup County, Georgia and the Valley area, consisting of Lanett and Valley, Alabama and West Point, Georgia. CharterBank is subject to extensive regulation, supervision, and examination by the OTS, its primary regulator, and the Federal Deposit Insurance Corporation (the FDIC ), which insures its deposits. CharterBank s savings deposits are insured up to the maximum allowable amount by the Deposit Insurance Fund of the FDIC. CharterBank is a service-oriented bank providing retail and small business customers with products and services designed to create a long-term, profitable relationship. CharterBank offers numerous loan products, including residential mortgage loans, commercial real estate loans, commercial loans, home equity loans, second mortgages, and other products. CharterBank also offers deposit products, including consumer and commercial checking accounts, savings accounts, money market accounts, and Certificates of Deposit. Prior to the reorganization, CharterBank founded The Charter Foundation, a non-profit foundation, which makes charitable contributions in CharterBank s market area. In February 2003, the Company acquired EBA Bancshares, Inc. (EBA) and its subsidiary bank, Eagle Bank, and merged them into CharterBank. As part of the Eagle Bank acquisition, we acquired approximately $55.3 million in gross loans and $60.7 million in deposits. The acquisition was accounted for using the purchase method of accounting and, therefore, the results of operations of Eagle Bank have been included in our operations since the effective date of the acquisition
10 Internet Address. Our Internet address is We make available free of charge, through our web site, annual reports on Form 10-K, quarterly reports on Form 10-Q and current reports on Form 8-K and amendments to those reports filed or furnished pursuant to Section 13(a) or 15(d) of the Securities Exchange Act of 1934 as soon as reasonably practicable after we electronically file such material with, or furnish it to, the Securities and Exchange Commission. Market Area. We conduct our operations in west-central Georgia and east-central Alabama through one branch office in West Point, Georgia, two branch offices in Valley, Alabama, two branch offices in LaGrange, Georgia, one branch office in Opelika, Alabama, and three branch offices in Auburn, Alabama. The West Point branch office and two Valley, Alabama offices serve the Valley region of our market area, which consists of West Point, Georgia, and Lanett and Valley, Alabama. The LaGrange offices serve an adjacent community on Interstate 85. Four branches serve the Auburn-Opelika or Lee County, Alabama area. We also operate loan production offices in Newnan and St. Mary s, Georgia and Phenix City, Alabama. The Valley area is a small market area and we are expanding our market area to nearby counties along the Interstate I-85 corridor, which are larger and have more growth potential. The economy of our market area has historically been supported by the textile industry. During the 1980 s and 1990 s employment growth in local telecommunications companies offset declining textile industry jobs in our area. Textile industry employment trends are continuing downward. Also, the median household income in our area is below national and statewide levels. In March 2006, Kia Motors Corporation announced that they plan to construct a major automotive assembly and manufacturing facility in our market area. This facility should stimulate economic growth in all parts of our market. Competition. We face intense competition both in making loans and attracting deposits. Westcentral Georgia and east-central Alabama have a high concentration of financial institutions, many of which are branches of large money center, super-regional, and regional banks which have resulted from the consolidation of the banking industry in Alabama and Georgia. Many of these competitors have greater resources than we do and may offer services that we do not provide. Our competition for loans comes from commercial banks, savings institutions, mortgage banking firms, credit unions, finance companies, credit card banks, insurance companies, and brokerage and investment banking firms. Our most direct competition for deposits has historically come from commercial banks, savings banks, savings and loan associations, credit unions, and mutual funds. We face additional competition for deposits from short-term money market funds and other corporate and government securities funds and from brokerage firms and insurance companies. Lending Activities. Loan Portfolio Composition. Our loan portfolio consists of one-to-four family residential first and second mortgage loans, commercial real estate loans, real estate construction loans, consumer loans and commercial loans. At September 30, 2006, we had total loans receivable of $381.7 million, or 34.8% of total assets. Residential mortgage loans comprised $143.9 million, or 37.7% of - 7 -
11 total loans at September 30, Commercial real estate loans totaled $158.0 million, or 41.4% of total loans at September 30, This represented a $7.0 million, or 4.6%, increase from the balance of commercial real estate loans at September 30, At September 30, 2006, approximately $73.8 million of total commercial real estate loans were secured by real estate in the local bank market and approximately $84.2 million of total commercial real estate loans were secured by commercial real estate in other parts of Georgia and Alabama. Of the $84.2 million not in the local bank market, approximately $14.8 million was secured by real estate in the Atlanta metropolitan area. We expect continued growth in our commercial real estate portfolio in the future. The remaining portion of our loan portfolio at September 30, 2006 consisted of consumer loans totaling $19.3 million, real estate construction loans of $43.7 million, and other commercial loans of $16.9 million. Our consumer loan portfolio contains approximately $1.7 million in auto loans. Our loans are subject to federal and state law and regulations. The interest rates we charge on loans are affected principally by the demand for loans, the supply of money available for lending purposes and the interest rates offered by our competitors. These factors are, in turn, affected by general and local economic conditions, monetary policies of the federal government, including the Federal Reserve Board, legislative tax policies, and governmental budgetary matters
12 The following table presents the composition of our loan portfolio in dollar amounts and in percentages of the total portfolio at the dates indicated. At September 30, Percent of Percent of Percent of Percent of Percent of Amount Total Amount Total Amount Total Amount Total Amount Total (Dollars in thousands) One-to-four family residential real estate(1) $143, % $ 148, % $142, % $133, % $ 100, % Commercial real estate 158, , , , , Consumer and other(2) 19, , , , , Commercial 16, , , , , Real estate constructio n(3) 43, , , , , Total loans 381, % 363, % 323, % 299, % 214, % Less: Net deferred loan (fees) (909) (931) (773) (544) (173) Allowance for loan losses (6,086) (6,160) (6,623) (6,780) (5,179) Loans receivable, net $374,727 $ 356,808 $316,151 $292,553 $ 208,654 (1) Excludes loans held for sale. (2) Includes home equity loans, lines of credit, and second mortgage loans. (3) Net of undisbursed proceeds on loans-in-process
13 Loan Maturity and Repricing. The following table shows the repricing dates or contractual maturity dates of our loan portfolio as of September 30, The table does not reflect prepayments but does reflect scheduled principal amortization. Demand loans, loans having no stated maturity, and overdrafts are shown as due in one year or less. 1-4 Family Residential Real Estate Loans Commercial Real Estate At September 30, 2006 Consumer and Other Commercial (In thousands) Real Estate Construction(1) Amounts due or repricing: Within one year $ 27,003 $ 70,587 $ 15,658 $ 10,801 $ 42,272 $166,321 After one year: One to three years 16,215 26,236 1,679 2, ,288 Three to five years 36,725 48, , ,921 Five to ten years 50,087 10, ,172 1,316 64,760 Over ten years 13,858 1, ,432 Total due after one year 116,885 87,416 3,597 6,120 1, ,401 Total amount due: $143,888 $ 158,003 $ 19,255 $ 16,921 $ 43,655 $381,722 Totals (1) Presented net of undisbursed proceeds on loans-in-process. The following table presents, as of September 30, 2006, the dollar amount of all loans contractually due or scheduled to reprice after September 30, 2007 and whether such loans have fixed interest rates or adjustable interest rates. Due After September 30, 2007 Fixed Adjustable Total (In thousands) One-to-four family residential real estate $40,393 $ 76,492 $116,885 Commercial real estate 8,509 78,907 87,416 Consumer and other 3, ,597 Commercial 2,892 3,228 6,120 Construction 1,383 1,383 Total loans $55,385 $ 160,016 $215,
14 The following table presents our loan originations, purchases, sales and principal payments for the periods indicated. For the Years Ended September 30, (In thousands) Loans(1): Balance outstanding at beginning of period $363,899 $323,547 $299,877 Originations: One-to-four family residential real estate 57,251 70,599 76,037 Commercial real estate and commercial 59,826 56,855 62,839 Consumer and other loans 7,877 8,170 11,530 Real estate construction 28,172 25,595 41,115 Total originations 153, , ,521 Less: Principal repayments, unadvanced funds and other, net 111,104 92, ,070 Sale of residential mortgage loans, principal balance 23,168 27,631 38,083 Loan charge-offs and transfers to foreclosed real estate 1,031 1, Total deductions 135, , ,851 Net loan activity 17,823 40,352 23,670 Ending balance $381,722 $363,899 $323,547 (1) Excludes loans held for sale. Residential Mortgage Loans and Originations. We originate first and second mortgages secured by one-to-four family properties within Georgia and Alabama. At September 30, 2006, and September 30, 2005, loans on one-to-four family properties accounted for 37.7% and 40.8% of our total loan portfolio, respectively. Our mortgage origination strategy is to offer a broad array of products to meet customer needs. These products include conforming and nonconforming loans with a variety of maturities and interest rate adjustment terms. We generally sell conforming fixed rate loans on a servicing released basis. We generally retain for our portfolio conforming loans with maturities shorter than 15 years or that have interest rate resets or balloon terms. We also retain nonconforming loans. Nonconforming loans generally have interest rate resets or maturities of less than thirty years. Management s current strategy is to sell loans with servicing released instead of keeping the servicing, as we believe that this improves our overall profitability. Our loan portfolio contains some loans that are nonconforming due to loan-to-value or credit exceptions
15 Our originations of all types of residential first mortgages amounted to $57.3 million for the fiscal year ended September 30, 2006, and $70.6 million for the year ended September 30, The average size of our residential mortgage loans originated in the year ended September 30, 2006 was $127,000, and $144,000 for the year ended September 30, We originate new mortgage loans through dedicated mortgage originators. Our mortgage originators develop referrals from current bank customers, real estate brokers, attorneys, past customers and other key referral sources. We offer a variety of mortgage products to allow customers to select the best product for their needs. A description of our mortgage products and underwriting guidelines are highlighted below. Adjustable Rate Mortgage Loans. We offer a variety of adjustable rate mortgage products that initially adjust after one, three, five, or seven years. After the initial term, the interest rate generally adjusts on an annual basis at a fixed spread over the monthly average yield on United States Treasury securities, the Wall Street Journal Prime, or LIBOR. The interest rate adjustments are generally subject to a maximum increase of 2% per adjustment period and the aggregate adjustment is generally subject to a maximum increase of 6% over the life of the loan. At September 30, 2006, 65.44% of the residential mortgage loans in our portfolio were adjustable rate mortgage loans, most of which were hybrid loans with a fixed rate for the first five or seven years. Generally, we offer adjustable rate mortgage loans in amounts up to $1.0 million depending on the loan-to-value ratio and the type of property. The loan-to-value ratio is the loan amount divided by the lower of (a) the appraised value of the property or (b) the purchase price of the property. The loan-to-value ratio is commonly used by financial institutions as one measure of potential exposure to risk. Loans on owner occupied one-to-four family residences are generally subject to a maximum loan to value ratio of 80% or require mortgage insurance if they exceed this ratio. Fixed Rate Mortgages Sold with Servicing Released. We offer a variety of fixed-rate loan products that we sell to investors on a servicing released basis. These loans are underwritten to the investors standards and are generally sold to the investor immediately after the loan closes. The rate on these loans is committed with the investor on a best efforts basis when the borrower locks in his or her interest rate. Gains on sales of residential loans and servicing released loan fees amounted to $741,000 of our noninterest income for the year ended September 30, Fixed Rate Mortgages Sold with Servicing Retained. We are an approved seller/servicer for Freddie Mac. Our fixed rate loans are underwritten to comply with Freddie Mac standards for sale to the secondary market. At September 30, 2006, CharterBank serviced loans for Freddie Mac with an aggregate balance of $21.1 million and serviced loans for other investors with an aggregate balance of $978,000. There were no loans sold in 2006 in which servicing was retained
16 Home Equity Credit Lines of Credit and Second Mortgages. We offer home equity lines of credit as a complement to our one-to-four family lending activities. We believe that offering home equity credit lines helps to expand and create stronger ties to our existing customer base by increasing the number of customer relationships and providing cross-marketing opportunities. Home equity credit lines provide adjustable-rate loans secured by a first or second mortgage on owner-occupied one-to-four family residences located primarily in Georgia and Alabama. Home equity credit lines enable customers to borrow at rates tied to the prime rate as reported in The Wall Street Journal. The underwriting standards applicable to home equity credit lines are similar to those applicable to one-to-four family first mortgage loans with the exception of loan- to-value ratios, which may go to 100%, and slightly more stringent credit-to-income and credit score requirements. At September 30, 2006, we had $14.5 million of home equity lines of credit and second mortgage loans. We also had $11.4 million of unfunded home equity commitments at September 30, Commercial Real Estate Loans. Increasing the size of our commercial real estate loan portfolio is an integral part of our operating strategy. In underwriting commercial real estate loans, we consider not only the property s historic cash flow, but also its current and projected occupancy, location, and physical condition. We generally lend up to a maximum loan-to-value ratio of 80% on commercial properties and require a minimum debt coverage ratio of 1.15 to 1 after tax. At September 30, 2006, we had $158.0 million of loans in our commercial real estate portfolio. The average size of a commercial real estate loan in our portfolio at September 30, 2006 was $205,000. Our largest funded loan exposure is a commercial real estate loan with a balance of $6.4 million at September 30, This loan is secured by a hotel located in the metropolitan Atlanta, Georgia area. Commercial real estate lending involves additional risks compared with one-to-four family residential lending. Payments on loans secured by commercial real estate properties often depend on the successful management of the properties, the amount of rent from the properties, or the level of expenses needed to maintain the properties. Repayment of such loans may therefore be adversely affected by conditions in the real estate market or the general economy. Also, commercial real estate loans typically involve large loan balances to single borrowers or groups of related borrowers. In order to mitigate these risks, we monitor our loan concentration and our loan policies generally limit the amount of loans to a single borrower or group of borrowers. We also utilize the services of an outside consultant to conduct credit quality reviews of the commercial loan portfolio. Because of increased risks associated with commercial real estate loans, our commercial real estate loans generally have higher rates and shorter maturities than our residential mortgage loans. We usually offer commercial real estate loans at fixed rates and adjustable rates tied to the prime rate. However, a portion of the commercial real estate portfolio is tied to yields on U.S. Treasury securities or LIBOR. We currently offer fixed rate terms of 3-7 years on these loans. However, in prior years we have had fixed rate loans with maturities of up to 25 years. Commercial Loans. Commercial loans generally are limited to terms of five years or less. Whenever possible, we collateralize these loans with a lien on commercial real estate, or alternatively, with a lien on business assets and equipment. We also generally require the personal guarantee of the business owner. Interest rates on commercial loans generally have higher yields than residential or commercial real estate loans due to the risk inherent in this type of loan
17 Commercial loans are generally considered to involve a higher degree of risk than residential or commercial real estate loans because the collateral may be in the form of intangible assets and/or inventory subject to market obsolescence. Commercial loans may also involve relatively large loan balances to single borrowers or groups of related borrowers, with the repayment of such loans typically dependent on the successful operation and income stream of the borrower. Such risks can be significantly affected by economic conditions. In addition, business lending generally requires substantially greater supervision efforts by our management compared to residential or commercial real estate lending. Commercial loans, however, comprise a small portion of our loan portfolio, totaling $16.9 million, or approximately 4.4% of total loans receivable and approximately 1.5% of total assets at September 30, Consumer Loans. We offer a variety of consumer loans to retail customers in the communities we serve. Examples of our consumer loans include: home equity loans-open and closed end; loans secured by certificates of deposit and other loans; and unsecured credit lines and installment loans. At September 30, 2006, our consumer loan portfolio totaled $19.3 million, or 5.0% of total loans. Consumer loans are generally originated at higher interest rates than residential and commercial mortgage loans and tend to have a higher credit risk than residential loans because they may be secured by a home with a loan-to-value of 100%, secured by rapidly depreciable assets, or be unsecured. Despite these risks, our level of consumer loan delinquencies, excluding auto loans, has generally been low. We cannot assure you, however, that our delinquency rate on consumer loans will continue to remain low in the future, or that we will not incur future losses on these activities. We also make loans for up to 100% of the amount of a borrower s certificates of deposit balance. These secured deposit loans totaled $1.1 million at September 30, Loan Approval Procedures and Authority. Our lending policies provide that various loan personnel and management committees may review and approve secured loan relationships up to $2.0 million and unsecured loan relationships up to $500,000. All loan relationships above these amounts require approval of either the Board s Executive Loan Committee or the full Board of Directors. The following describes our current lending procedures for residential mortgages and home equity lines and loans. Upon receipt of a completed loan application from a prospective borrower, we order a credit report and verify other information. If necessary, we obtain additional financial or credit related information. We require an appraisal for all mortgage loans, except for home equity loans or lines where an alternative evaluation may be used to determine the loan-to-value ratio. Appraisals are performed by licensed or certified third-party appraisal firms and are reviewed by our lending department. We require title insurance or a title opinion on all mortgage loans
18 We require borrowers to obtain hazard insurance and we may require borrowers to obtain flood insurance prior to closing. For properties with a private sewage disposal system, we also require evidence of compliance with applicable laws on residential mortgage loans. Further, we generally require borrowers to advance funds on a monthly basis together with each payment of principal and interest to a mortgage escrow account from which we make disbursements for items such as real estate taxes, hazard insurance, flood insurance, and private mortgage insurance premiums, if required. Commercial loans are approved through CharterBank s Management Loan Committee process. The Management Loan Committee consists of the President, the Executive Vice President, the Chief Financial Officer, the Senior Credit Administrator, and certain other senior lending and credit officers. The Management Loan Committee has authority to approve loan relationships up to $2,000,000. Commercial loan relationships of $1,000,000 or less may be approved outside the Committee process by two officers who have commercial loan authority. Commercial loan relationships greater than $2,000,000 are approved by the Management Loan Committee and the Board s Executive Loan Committee or the entire Board of Directors. Asset Quality. One of our key operating objectives has been and continues to be the achievement of a high level of asset quality. We maintain a large proportion of loans secured by residential one-to-four family properties and commercial properties; we set sound credit standards for new loan originations; and we follow careful loan administration procedures. The following table sets forth the non-performing loans by loan category at the dates indicated. As indicated by the table, nonperforming loans decreased overall and in all categories during the year ended September 30, At September 30, (Decrease) 1-4 family residential real estate mortgage $1,208,812 $2,128,104 $ (919,292) Commercial real estate 1,497,178 1,714,642 (217,464) Commercial 109, ,842 (99,473) Consumer and other 21,448 23,839 (2,391) Total $2,836,807 $4,075,427 $(1,238,620) Non-accrual loans decreased by $1.2 million with the real estate secured loans, including one-to-four family and commercial real estate loans, decreasing by approximately $1.1 million and commercial, consumer and other loans decreasing by approximately $102,000. Delinquent Loans and Foreclosed Assets. Our policies require that management continuously monitor the status of the loan portfolio and report to the Executive Loan Committee of the Board of Directors on a monthly basis. These reports include information on delinquent loans and foreclosed real estate, and our actions and plans to cure the delinquent status of the loans and to dispose of the foreclosed property. The Loan Committee approves action plans on all loans that are 90 days delinquent. The Loan Committee
19 consists of three outside directors, and two directors who are also members of management. Two of the outside directors, one of whom is the chairman, serve each time. The third outside slot rotates between two other outside directors. The following table presents information regarding total non-performing loans, accruing loans delinquent 90 days or more, foreclosed real estate and total non-performing assets as of the dates indicated. At September 30, 2006, 2005, and 2004, we had $2.8 million, $4.1 million, and $5.9 million, respectively, of non-performing loans. The non-performing loans are primarily residential and commercial real estate loans. If all non-performing loans had been performing in accordance with their original terms and had been outstanding from the earlier of the beginning of the period or origination, we would have recorded additional interest income on these loans of approximately $134,000 for the year ended September 30, At September 30, (Dollars in thousands) Underperforming loans - accruing loans delinquent 90 days or more $ 392 $ 133 $ 195 $ 633 $ 133 Total nonaccrual loans $2,837 $4,075 $5,865 $5,124 $3,013 Foreclosed real estate, net 460 1, Total non-performing assets $3,297 $5,195 $6,318 $5,808 $3,683 Non-performing loans to total loans 0.74% 1.12% 1.81% 1.71% 1.41% Non-performing assets to total assets 0.30% 0.49% 0.59% 0.58% 0.38% Nonperforming assets at September 30, 2006, 2005, and 2004 were $3.3 million, $5.2 million, and $6.3 million, respectively. We generally stop accruing income when interest or principal payments are 90 days in arrears. We may stop accruing income on such loans earlier than 90 days when we consider the timely collectibility of interest or principal to be doubtful. We may continue to accrue interest income beyond 90 days if the loan is well secured and we determine that the ultimate collection of all principal and interest is not in doubt. When we designate nonaccrual loans, we reverse all outstanding interest that we had previously credited. If we receive a payment on a nonaccrual loan, we may recognize a portion of that payment as interest income; if we determine that the ultimate collectibility of principal is no longer in doubt. However, such loans may remain on nonaccrual status. Impaired loans are individually assessed to determine whether the carrying value exceeds the fair value of the collateral or the present value of the expected cash flows to be received. Smaller balance homogeneous loans, such as residential mortgage loans and consumer loans, are collectively evaluated for impairment. At September 30, 2006, 2005 and 2004, impaired loans totaled $1.6 million, $2.5 million, and $3.9 million, respectively. The average recorded investment in impaired loans for the years ended September 30, 2006, 2005, and 2004 was approximately $2.1 million, $3.2 million, and $3.0 million, respectively. There were specific allowances attributable to impared loans at September 30, 2006, 2005, and 2004 of $46,073, $70,211 and $22,000. Interest income recognized on impaired loans for the years ended September 30, 2006, 2005, and 2004 was not significant
20 At September 30, 2006, 2005, and 2004, we had $6.5 million, $6.3 million, and $3.0 million, respectively, of portfolio loans classified as troubled debt restructurings. Foreclosed real estate consists of property we have acquired through foreclosure or deed in lieu of foreclosure. Foreclosed real estate properties are initially recorded at the lower of the recorded investment in the loan or fair value less disposal costs. Thereafter, we carry foreclosed real estate at the lower of cost or fair value. At September 30, 2006, 2005, and 2004 we had $460,000, $1.1 million, and $453,000 in foreclosed real estate, respectively
21 Allowance for Loan Losses. The following table presents the activity in our allowance for loan losses and other ratios at or for the dates indicated. At or for Years Ended September 30, (Dollars in thousands) Balance at beginning of year $ 6,160 $ 6,623 $ 6,780 $ 5,179 $ 5,290 Allowance for loan losses of acquired company(1) 2,177 Charge-offs: 1-4 residential real estate (180) (57) (185) (209) (321) Commercial real estate (222) (15) Commercial (319) (230) (497) (175) Consumer and other (62) (61) (139) (338) (320) Real estate construction (81) Total charge-offs (242) (659) (650) (1,044) (816) Recoveries: 1-4 residential real estate Commercial real estate Commercial Consumer and other Real estate construction Total recoveries Net (charge-offs) (74) (538) (187) (601) (361) Provision for loan losses Balance at end of year $ 6,086 $ 6,160 $ 6,623 $ 6,780 $ 5,179 Total loans receivable $381,722 $363,899 $323,547 $299,877 $214,006 Average loans outstanding $383,346 $337,127 $311,480 $256,792 $215,632 Allowance for loan losses as a percent of total loans receivable (2) 1.60% 1.69% 2.05% 2.26% 2.33% Net loans charged off as a percent of average outstanding (0.02)% (0.16)% (0.06)% (0.23)% (0.16)% (1) Recorded in connection with the EBA in (2) Does not include loans held for sale or deferred fees
22 Our evaluation of the loan portfolio includes the review of all loans on which the collection of principal might be at risk. We consider the following factors as part of this evaluation: our historical loan loss experience; estimated losses in the loan portfolio; increases in categories with higher loss potential, such as commercial real estate loans; credit scores and credit history; the estimated value of the underlying collateral; and current economic and market trends. There may be other factors that warrant our consideration in maintaining the allowance at a level sufficient to cover probable losses. Although we believe that we have established and maintained the allowance for loan losses at adequate levels, it may be necessary to increase the allowance if economic, real estate and other conditions differ substantially from the current operating environment. In addition, the OTS, as an integral part of its examination process, periodically reviews our loan and foreclosed real estate portfolios and the related allowance for loan losses and valuation allowance for foreclosed real estate. The OTS may require us to increase the allowance for loan losses or the valuation allowance for foreclosed real estate based on their judgments of information available to them at the time of their examination, thereby adversely affecting our results of operations. Management believes the allowance for loan losses is sufficient to cover all known losses and inherent losses in the current loan portfolio at September 30, To determine the adequacy of the allowance, we look at historical trends in the growth and composition of our loan portfolio, among other factors. The most significant risk trends over the last five years are the growth of our commercial real estate loan portfolio, the growth of the nonconforming residential loan portfolio, and the nonperforming loans acquired in the EBA acquisition and the acquisition of Citizens Bancgroup, Inc. and its wholly-owned subsidiary, Citizens National Bank, in We believe that, despite using prudent underwriting standards, commercial real estate loans contain higher loss potential than one-to-four family residential mortgages. For the year ended September 30, 2006, we did not record a provision for loan losses based on our evaluation of the items discussed above. See Management s Discussion and Analysis of Financial Condition and Results of Operations for the years ended September 30, 2006, and 2005, Provision for Loan Losses
23 Allocation of Allowance for Loan Losses. The following tables set forth the allowance for loan losses allocated by loan category, the total loan balances by category, and the percent of loans in each category to total loans indicated. Loan Categor y Amount At September 30, Percent of Loan loans in Each Balances by Category to Category Total Loans Percent of Loan loans in Each Balances by Category to Amount Category Total Loans (Dollars in thousands) Amount Percent of Loan loans in Each Balances by Category to Category Total Loans One-to-four family residentia l real estate $ 838 $ 143, % $1,042 $148, % $1,364 $ 142, % Commercial real estate 2, , , , , , Consumer loans and other(1) , , , Commercial , , , Real estate construct ion 1,077 43, , , Unallocated Total allowanc e for loan losses $ 6,086 $ 381, % $6,160 $363, % $6,623 $ 323, % Loan Category Amount 2003 At September 30, 2002 Percent of loans in Each Loan Category to Balances by Total Loans Amount Category Loan Balances by Category (Dollars in thousands) Percent of loans in Each Category to Total Loans One-to-four family residential real estate $1,185 $133, % $1,017 $ 100, % Commercial real estate 2, , ,394 68, Consumer loans and other(1) , , Commercial 1,147 21, , Real estate construction , , Unallocated Total allowance for loan losses $6,780 $299, % $5,179 $ 214, % (1) Includes home equity lines of credit, excludes loans held for sale
24 Investment Activities. The Board of Directors reviews and approves our investment policy on an annual basis. The President and Chief Financial Officer, as authorized by the Board, implement this policy based on the established guidelines within the written investment policy, and other established guidelines, including those set periodically by the Asset-Liability Management Committee. The primary goal of our investment policy is to invest funds in assets with varying maturities which will result in the best possible yield while maintaining the safety of the principal invested and assisting in managing interest rate risk. We also seek to use our strong capital position to maximize our net income through investment in higher yielding mortgage related securities funded by borrowings. The investment portfolio is also viewed as a source of liquidity. The broad objectives of our investment portfolio management are to: minimize the risk of loss of principal or interest; generate a favorable return without incurring undue interest rate and credit risk; manage the interest rate sensitivity of our assets and liabilities; meet daily, cyclical and long term liquidity requirements while complying with our established policies and regulatory liquidity requirements; diversify assets in stable economic regions and address maturity or interest repricing imbalances; and provide collateral for pledging requirements. In determining our investment strategies, we consider our interest rate sensitivity, yield, credit risk factors, maturity and amortization schedules, asset prepayment risks, collateral value and other characteristics of the securities to be held. Our investment policies and procedures also encompass evaluating and monitoring our Freddie Mac common stock investment. Liquidity. We calculate liquidity by taking the total of: our cash; cash we have in other banks; unpledged U.S. Government or Government Agency Securities; and unpledged mortgage-backed securities guaranteed by the U.S. Government or Agencies or rated AAA. We utilize borrowing lines of credit supported by available collateral, including Freddie Mac common stock, which provides a high level of liquidity. We consider our Freddie Mac common stock a collateral source of last resort due to the adverse income tax consequences of losing the dividends received deduction. We borrow funds from the Federal Home Loan Bank based on eligible collateral of loans and securities up to a limit of 40% of CharterBank s assets. Our maximum borrowing capacity from the Federal Home Loan Bank is approximately $388.2 million, of which $312.0 million was utilized at September 30, We utilize Federal Home Loan Bank advances, reverse repurchase agreements and other borrowings to fund the purchase of investment securities in order to increase our net income and return on equity
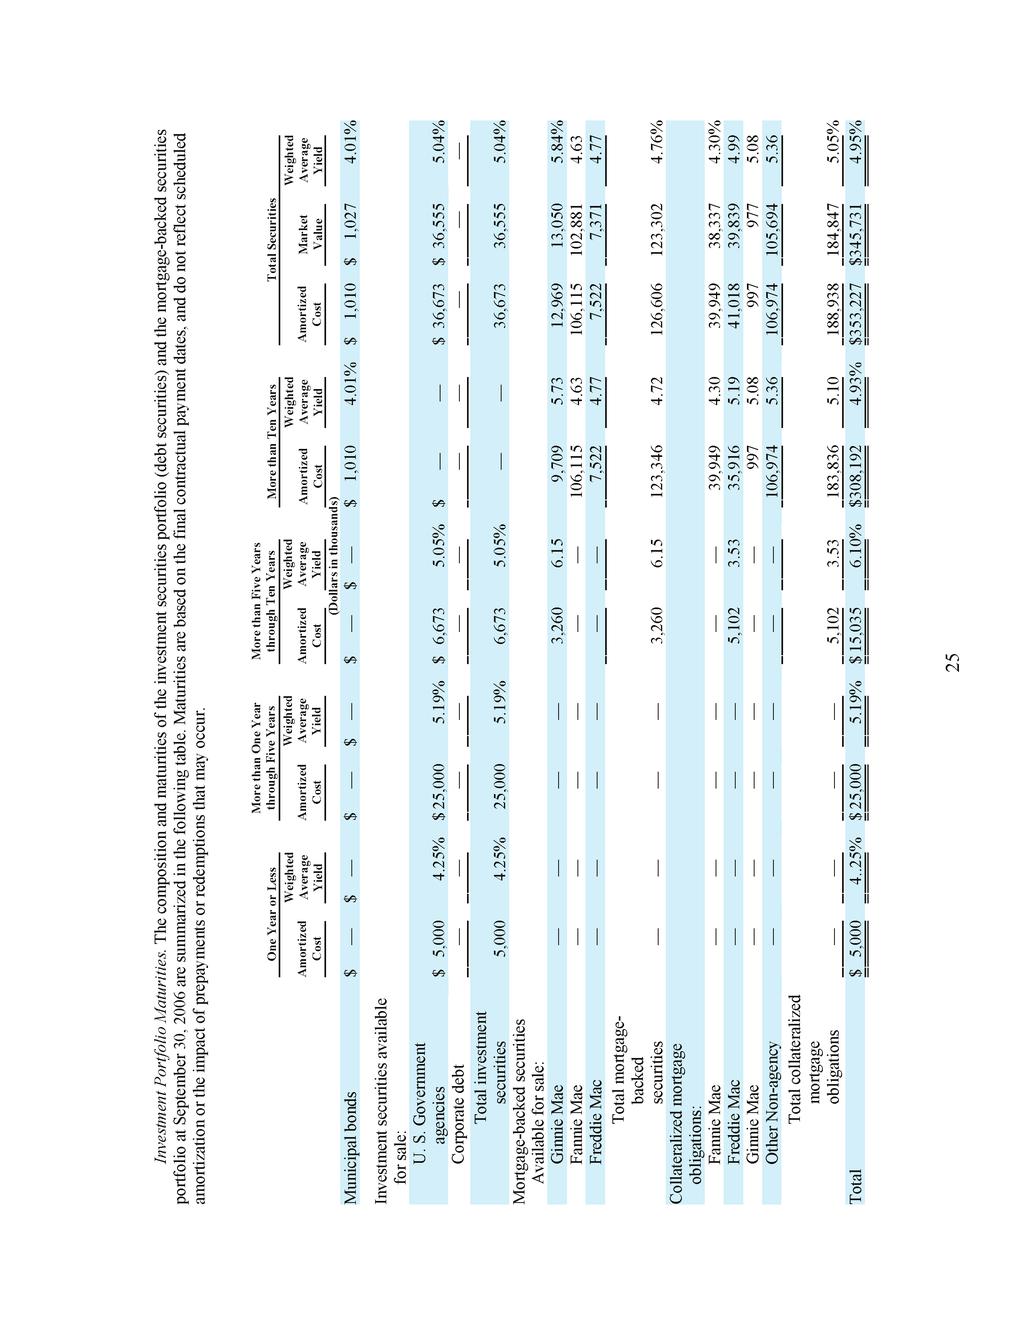
25 Investment and Mortgage Securities. General. Federally chartered thrifts have authority to invest in various types of assets, including U.S. Treasury obligations, securities of various federal agencies, mortgage-backed securities, certain Certificates of Deposits of insured financial institutions, repurchase agreements, overnight and short term loans to other banks, corporate debt instruments, and Fannie Mae and Freddie Mac equity securities. Our investments primarily fall into two major categories: equity investments, primarily Freddie Mac common stock and collateralized mortgage obligations and mortgage-backed securities. Securities can be classified as trading, held to maturity, or available for sale at the date of purchase. All of our securities are currently classified as available for sale. The weighted average annualized yield of our non-equity portfolio was 4.95% as of September 30, We believe the credit quality of the portfolio is high as it is invested in U.S. Government, U.S. Government Agency, or U.S. Government Agency-guaranteed mortgage-backed securities or mortgage related securities with a rating of AA or better or equities, primarily Freddie Mac common stock. For information see Management Discussion and Analysis Carrying Values, Yields and Maturities

26
27 The following table sets forth the composition of the investment and mortgage portfolio at the dates indicated and whether such investments have fixed or adjustable interest rates. Amortized Costs At September 30, 2006 At September 30, 2005 Market Unrealized Amortized Market Value Gain/(Loss) Costs Value Unrealized Gain/(Loss) (Dollars in thousands) Total municipal bonds $ 1,010 $ 1,027 $ 17 $ $ $ Fixed rate agency notes/bonds 11,672 11,476 (196) 17,859 17,712 (147) Total fixed rate mortgage-backed and mortgage-related securities 96,466 93,799 (2,667) 111, ,881 (1,327) Total fixed rate collateralized mortgage obligations 101,406 97,914 (3,492) 127, ,019 (2,726) Total fixed rate municipals, investment and mortgage securities 210, ,216 (6,338) 256, ,612 (4,200) Variable rate agency 25,000 25, Variable rate mortgage-backed and mortgage-related securities 30,140 29,504 (636) 42,644 42,025 (619) Variable rate collateralized mortgage obligations 87,534 86,932 (602) 82,101 81,535 (566) Total variable rate investment and mortgage securities 142, ,515 (1,159) 124, ,560 (1,185) Freddie Mac common stock and other equity securities 5, , ,420 6, , ,715 Total municipals, investment and mortgage securities and Freddie Mac common stock $359,147 $640,070 $280,923 $387,618 $630,949 $ 243,330 24
28
29 Equity Securities. As of September 30, 2006, equity securities were primarily comprised of 4,437,500 shares of Freddie Mac common stock which had a per share market value of $66.33 per share, a total market value of $294.3 million and a cost basis of approximately $1.33 per share. The large unrealized pretax gain of approximately $288.4 million is the result of a series of well-timed investments in Freddie Mac common stock in the middle to late 1980 s. As a result of strong fundamental growth at Freddie Mac and a favorable stock market environment, our Freddie Mac common stock investment has appreciated significantly and now constitutes approximately 26.8% of our total assets. The unrealized gain in Freddie Mac common stock has substantially strengthened our capital. The after-tax unrealized gain in Freddie Mac common stock constitutes 66.2% of our equity capital. Dividends on Freddie Mac common stock have also significantly increased our dividend and interest income. Our Freddie Mac common stock is held by the Company and the Bank as follows: CharterBank Charter Financial Total 2,555,000 shares 1,882,500 shares 4,437,500 shares In addition, the owner of 80% of Charter Financial s common stock, First Charter, MHC, owns 398,000 shares of Freddie Mac common stock. We believe that our ownership of Freddie Mac common stock continues to present attractive appreciation and dividend growth potential. We filed a self tender offer with the Securities and Exchange Commission on November 21, 2006 and indicated that we would fudn the tender offer by selling enough Freddie Mac stock held at the Charter Financial level to fund the tender offer and pay income taxes on the gain that is realized. We will continue to evaluate our remaining investment in Freddie Mac common stock considering the appreciation and dividend potential of the Freddie Mac common stock, the income tax impact of a strategy, alternative investments or uses of sales proceeds and the portion of our capital that the after-tax unrealized gain represents. We operate a covered call program with respect to 400,000 shares of Freddie Mac common stock. When we write a call option, we receive a fee or premium. If the call option expires unexercised, we retain this premium and record it as income. If the call option is exercised, the premium is added to the sale proceeds and increases the gain on the sale of Freddie Mac stock. Once a covered call is written, we have little control over whether it will be exercised. If a call option is in the money as its maturity approaches, we can either allow it to be exercised or purchase the call to prevent its exercise. The decision to allow the exercise or to repurchase the option is based on several factors including the strike price at which the option would be exercised, alternative investments for the proceeds of the sale, tax considerations, the proportion of realized to unrealized equity and the cost to repurchase the option. If a high volume of call options are exercised within a particular quarter, we would experience higher than normal noninterest income. Because we have little control over whether a call will be exercised, our noninterest income and net income could fluctuate significantly from quarter to quarter. 26
30 A gain on a sale of Freddie Mac stock resulting from a covered call exercise is included in net income. While normally net income results in an increase in equity, the unrealized gain is already included in equity as accumulated other comprehensive income. The gain on sale of Freddie Mac stock does not result in an increase in total equity but rather moves the equity from accumulated other comprehensive income to retained earnings. During fiscal year 2003, we sold 15,000 shares of Freddie Mac common stock, during fiscal year 2004, we sold 35,000 shares of Freddie Mac common stock, during fiscal year 2005, we sold 92,500 shares of Freddie Mac common stock and during fiscal year 2006, we sold 75,000 shares of Freddie Mac common stock under the covered call program. Mortgage Related Securities. Our mortgage-related security portfolio is composed of collateralized mortgage obligations and mortgage-backed securities. Collateralized mortgage obligations and mortgagebacked securities consist of various types of securities issued by the major secondary market issuers including Ginnie Mae, Fannie Mae and Freddie Mac, as well as a variety of private issuers. The portfolio includes securities with a wide variety of structures including variable rate and fixed rate securities, including many hybrid securities with balloon terms. Mortgage-backed securities generally yield less than the loans that underlie these securities because of the cost of payment guarantees or credit enhancements that reduce credit risk. However, mortgagebacked securities are more liquid than individual mortgage loans and may be used as collateral for our borrowings. In general, mortgage-backed securities issued or guaranteed by Fannie Mae, Freddie Mac, Ginnie Mae or private issuers that rate AA or better are weighted at not more than 20% for risk-based capital purposes, compared to 50% risk weighting assigned to most nonsecuritized residential mortgage loans. While mortgage-backed securities carry a reduced credit risk as compared to whole loans, they remain subject to the risk of a fluctuating interest rate environment. Along with other factors, such as the geographic distribution of the underlying mortgage loans, changes in interest rates may alter the prepayment rate of those mortgage loans and affect both prepayment rates and the value of mortgagebacked securities. Prepayments impact the rate of amortization of premiums and accretion of discounts and thus impact the yield on our securities. The table below shows the premiums, discounts and projected weighted average lives for our mortgage-backed securities and collateralized mortgage obligations. 27
31 At September 30, 2006 Par Premium Discount Amortized Cost Average Life in Yrs. Average Interest Yield MBS - fixed rate $ 96,431,679 $588,785 $ 554,895 $ 96,465, % MBS variable rate 30,064, ,155 33,800 30,140, CMO - fixed rate 101,762, , , ,406, CMO variable rate 88,010,374 12, ,697 87,530, Total $316,268,509 $903,925 $1,629,454 $315,542,980 While mortgage related securities have average lives as stated in the accompanying tables, average lives may be significantly shorter or longer based on interest rates and underlying loan prepayments. Based on interest rates and market prepayment assumptions as of September 30, 2006, the estimated average life of our fixed rate mortgage-backed security portfolio was 5.27 years and the estimated average life of our fixed rate collateralized mortgage obligation portfolio was 4.51 years. If prepayment rates are lower than estimated, our earnings will be negatively affected by the lack of cash flows to invest in higher yields. A portion of the fixed rate mortgage-backed securities are backed by multifamily loans that have prepayment penalties or yield maintenance agreements and thus are not as likely to prepay due to changes in interest rates. As discussed above, we have sought to utilize our strong equity position to enhance our earnings and return on equity by using Federal Home Loan Bank advances, reverse repurchase agreements and other borrowings to fund the purchase of higher yielding investment securities. Historically our mortgage-backed securities portfolio has been effective in leveraging our strong capital and increasing net earnings levels. With the current yield and risk characteristics we have been using cash flow from mortgage securities to reduce borrowings. 28
32 Mortgage-Backed Securities and Mortgage-Related Securities. The following table discloses the amortized cost and fair value of our mortgage-backed and mortgage-related securities, all of which are classified as available for sale as of the dates indicated. Since 1994, all mortgage-related securities have been classified as available for sale. Amortized Cost At September 30, Percent of Fair Amortized Percent of Fair Amortized Percent of Total Value Cost Total Value Cost Total (Dollars in thousands) Fair Value Mortgagebacked securities available for sale: Ginnie Mae $ 12, % $ 13,050 $ 16, % $ 16,266 $ 19, % $ 20,170 Fannie Mae 106, , , , , ,652 Freddie Mac 7, ,371 10, ,191 9, ,902 Collateralized mortgage obligation s available for sale: Fannie Mae 39, ,336 60, ,183 72, ,122 Freddie Mac 41, ,839 56, ,085 92, ,644 Other 106, ,695 91, ,289 52, ,358 Ginnie Mae , ,509 Total $ 315, % $308,149 $363, % $358,461 $378, % $ 378,357 Amortized Cost At September 30, Percent of Fair Amortized Percent of Total Value Cost Total (Dollars in thousands) Fair Value Mortgage-backed securities available for sale: Ginnie Mae $ 14, % $ 14,919 $ 24, % $ 24,714 Fannie Mae 89, ,408 31, ,590 Freddie Mac 13, ,267 6, ,732 Collateralized mortgage obligations available for sale: Fannie Mae 136, , , ,353 Freddie Mac 86, , , ,179 Other 56, ,250 25, ,238 Ginnie Mae. 2, ,134 Total $396, % $394,432 $455, % $455,940 29
33 Federal Home Loan Bank Stock. Every federally insured financial institution that borrows funds from a Federal Home Loan Bank is required to invest in the stock of that Federal Home Loan Bank. The institution s investment in Federal Home Loan Bank stock, along with other assets of the institution, is then pledged as collateral for the advances. As of September 30, 2006, we owned approximately $16.0 million of stock in the Federal Home Loan Bank of Atlanta. Bank Owned Life Insurance During 2006, we purchased $12 million of single premium life insurance as a tax advantage investment. The insurance also serves as key person insurance for certain directors and members of management. Sources of Funds. Deposits (both retail and wholesale), borrowings, securities sold under agreements to repurchase, scheduled amortization and prepayments of loan principal and mortgage-backed securities, maturities and calls of investment securities and funds provided by operations are our primary sources of funds for use in lending, investing and for other general purposes. See Management s Discussion and Analysis of Financial Condition and Results of Operations - Liquidity and Capital Resources. Deposits. At September 30, 2006, our total deposits amounted to $372.1 million, of which $321.3 million were retail deposits, $32.6 million were funds on deposit from credit unions, and $18.1 million were brokered deposits. Funds on deposit from credit unions and brokered deposits are known as wholesale deposits. At September 30, 2005, our retail deposits totaled $250.4 million, and our wholesale deposits totaled $69.7 million. Retail Deposits. We offer a variety of deposit products to meet the needs of retail and business customers. We currently offer non-interest bearing demand accounts, interest bearing demand accounts (NOW), savings passbook and statement accounts, money market accounts and certificates of deposits. Deposit products are developed to meet the needs of our targeted markets and products are changed as necessary to meet customer needs and marketing objectives. Our deposit flows are influenced by a number of factors including: general and local economic conditions; the perceived strength of the stock and stock mutual fund market; prevailing interest rates; and competition. Our retail deposits are primarily obtained from areas surrounding our offices. To attract and retain deposits, our primary strategy is to provide a superior customer experience and convenience. We determine our deposit rates by evaluating our competition s pricing, the cost of Federal Home Loan Bank borrowings, rates on U.S. Treasury securities, the LIBOR swap curve and other related funds. As of September 30, 2006, core deposits, consisting of demand deposits, NOW deposits, savings, and money market accounts, represented 52.6% of total retail deposits and 45.5% of total deposits. See Management s Discussion and Analysis of Financial Condition and Results of Operations-Analysis of Net Interest Income for information relating to the average balances and costs of 30
34 our deposit accounts for the years ended September 30, 2006, 2005, and We expect that our retail core deposit base will continue to expand to reflect the planned expansion of our retail branch network and that our transaction accounts will increase as a result of our increased marketing efforts related to such accounts within our targeted market area. Wholesale Deposits. Our wholesale deposits consist of brokered deposits and funds on deposit from credit unions. CharterBank obtains credit union deposits by placing rates on a rate service. CharterBank pays to advertise its rates with the third party. Credit unions with an interest in depositing funds contact CharterBank directly. At September 30, 2006, we had $32.6 million in credit union certificates of deposit and $18.1 million in brokered deposits. At September 30, 2006, credit union certificates of deposit and brokered deposits totaled $50.7 million, or 13.6% of our total deposits. At September 30, 2005, credit union certificates of deposit and brokered deposits totaled $69.7 million, or 21.8% of our total deposits. 31

35
36 Deposit Flow. The following table summarizes the deposit activity of the Bank for the periods indicated. For the Years Ended September 30, (Dollars in thousands) Balance at beginning of period $320,129 $279,575 $279,386 Net increase (decrease) before interest credited, wholesale (18,970) 35,627 (15,626) Net increase (decrease) before interest credited, retail 62,228 (311) 12,244 Interest credited 8,670 5,238 3,571 Balance at end of period $372,057 $320,129 $279,575 Total increase in deposit accounts $ 51,928 $ 40,554 $ 189 Percentage increase 16.22% 14.51%.07% The balances of our wholesale deposits are more volatile than retail deposits. As wholesale deposits mature, these deposits are less likely to remain with CharterBank, as compared to the relatively stable balances of our core retail deposit base. While we expect our retail deposit base to increase in the next several years, our loan portfolio growth may outpace the growth of our retail deposit base. Accordingly, we plan to either utilize borrowed funds or retain our wholesale certificates of deposit to fund loans. Certificate of Deposit Maturities. At September 30, 2006, we had $94.3 million in certificates of deposit with balances of $100,000 and greater maturing as follows: Maturity Period Weighted Average Rate Amount (Dollars in thousands) Retail: Three months or less $10, % Over three months through six months 21, Over six months through 12 months 27, Over 12 months 7, Total 67, Wholesale: Three months or less 21, Over three months through six months Over six months through 12 months 1, Over 12 months 2, Total 26, Total $94, % 33
37 Certificate of Deposit Balances by Rates. The following table sets forth, by interest rate ranges, information concerning our certificates of deposit at the dates indicated. Less than One Year One to Two Years At September 30, 2006 Period to Maturity Two to Three More than Years Three Years (Dollars in thousands) Total Percent of Total Retail: 2.00% and below $ 114 $ 19 $ $ 203 $ % 2.01% to 3.00% 24,550 1, , % to 4.00% 4,467 4,110 2,761 2,060 13, % to 5.00% 28,505 1,700 3,473 3,395 37, % to 6.00% 73, ,133 74, % and above 2 2 Total $131,240 $ 7,586 $ 7,522 $ 5,910 $152, % Wholesale: 2.00% and below $ $ $ $ $ % 2.01% to 3.00% % to 4.00% 3,476 1, , % to 5.00% 34, , % to 6.00% 5,456 2, , % and above Total $ 43,218 $ 4,915 $ 1,542 $ 994 $ 50, % Borrowings. In addition to deposits, borrowings from the Federal Home Loan Bank and securities sold under agreements to repurchase provide an additional source of funds to finance our lending and investing activities. At September 30, 2006, our total borrowings were $337.9 million, as compared to $382.3 million at September 30, Our utilization of borrowings has generally contributed to our profitability and we will continue to employ borrowings as a source of funds. At the same time, we will consider whether to undertake future borrowings as a source of funds only after a review of numerous relevant factors including: the potential interest spread and risks involved; analysis of the current and anticipated interest rate environment; the current and expected levels of our deposit base; various other risk factors associated with using borrowings as a source of funds; and the return and risk characteristics of the asset to be acquired or retained. Federal Home Loan Bank Advances. At September 30, 2006, our outstanding Federal Home Loan Bank advances totaled $312.0 million, as compared to $287.0 million at September 30, At September 30, 2006, CharterBank had pledged, under a blanket lien with the Federal Home Loan Bank of Atlanta: all stock of the Federal Home Loan Bank of Atlanta held by CharterBank; 34
38 certain qualifying first mortgage loans with unpaid principal balances totaling $75.0 million; certain commercial real estate loans with unpaid principal balances totaling $7.8 million; and certain mortgage-backed securities, collateralized mortgage obligations, and investment securities with an aggregate carrying amount of $297.7 million. At September 30, 2006, CharterBank has available lines of credit commitments with the FHLB totaling $388.1 million, of which $312.0 million was advanced and $76.1 million was available. Securities Sold Under Agreements to Repurchase. We had approximately $25.9 million of securities sold under agreements to repurchase outstanding at September 30, 2006, as compared to $95.3 million at September 30, This amount was reduced during fiscal 2006 as payments received on mortgage securities were applied as reductions. Our securities sold under agreements to repurchase are secured by certain mortgage-backed securities, collateralized mortgage obligations. At September 30, 2006, investment securities and had an aggregate carrying amount, including accrued interest of $28.6 million, as compared to $102.2 million at September 30, All securities sold under the agreements to repurchase are under our control. The repurchase agreements at September 30, 2006 and 2005 have maturities of less than 45 days and provide for the purchase of identical securities and specify delivery of the underlying securities to an approved custodian. 35
39 The following table sets forth information concerning balances and interest rates on the Bank s Federal Home Loan Bank advances and securities sold under agreement to repurchase at the dates and for the years indicated. At and for the Year Ended September 30, (Dollars in thousands) Federal Home Loan Bank advances: Average balance outstanding $302,823 $304,077 $259,235 Maximum amount outstanding at any month-end during the year 320, , ,700 Balance outstanding at end of the year 312, , ,050 Weighted average interest rate during the year 4.38% 4.24% 4.08% Weighted average interest rate at end of year 4.44% 4.31% 4.11% Securities sold under agreements to repurchase: Average balance outstanding $ 56,047 $100,005 $132,623 Maximum amount outstanding at any month-end during the year 82, , ,710 Balance outstanding at end of the year 25,928 95, ,739 Weighted average interest rate during the year 4.69% 2.83% 1.28% Weighted average interest rate at end of year 5.42% 3.85% 1.81% The following table sets forth additional information on the maturities, interest rates, and balances of Federal Home Loan Bank advances at the dates and for the years indicated. Due Amount Weighted Interest average rates rate Amount Interest rates Weighted average rate Less than one year $ 75,000, % 3.40% 25,000, % 2.97% One to two years 50,000, % 3.09% 75,000, % 3.18% Two to three years 50,000, % 3.09% Three to four years 35,000, % 5.57% Four to five years 35,000, % 5.57% Thereafter 152,000, % 5.26% 102,000, % 5.64% $312,000, % 287,000, % Current and Planned Sources of Funds. As discussed above, we expect to continue to rely on a combination of both retail and wholesale deposits to fund our operations. We seek to grow the retail component of our funding structure, while reducing our dependence on wholesale funds as a source of funds. We are hopeful that our future renovations and ATMs will enhance our ability to attract retail deposits. 36
40 While we would prefer to reduce our reliance on wholesale fundings in the long term, our loan growth will probably exceed our retail deposit growth. Thus, wholesale fundings, possibly including brokered deposits, credit union deposits and borrowings, will continue to remain a significant source of funds for CharterBank in the near term. In addition to deposits and borrowings, our other significant sources of funds include liquidity, loan repayments, maturing investments and retained earnings. Personnel. As of September 30, 2006, CharterBank had 179 full-time equivalent employees. The employees are not represented by a collective bargaining unit, and we consider our relationship with our employees to be excellent. Federal Taxation. General. For federal income tax purposes, we report income on the basis of a taxable year ending September 30, using the accrual method of accounting, and we are generally subject to federal income taxation in the same manner as other corporations. CharterBank and Charter Financial constitute an affiliated group of corporations and, therefore, are eligible to report their income on a consolidated basis. However, Charter Financial and CharterBank file separate federal and state income tax returns. CharterBank and Charter Financial are not currently under audit by the IRS and have not been audited for the past five years. Charter Insurance, which was liquidated in December 2004, is currently under an IRS audit. The last federal audit of CharterBank s federal tax return was related to the fiscal year ended September 30, Distributions. To the extent that CharterBank makes non-dividend distributions to Charter Financial, such distributions will be considered to result in distributions from unrecaptured tax bad debt reserve as of December 31, 1987 ( base year reserve ), to the extent thereof; and then from supplemental reserve for losses on loans, and an amount based on the amount distributed will be included in income. Non-dividend distributions include distributions in excess of current and accumulated earnings and profits, distributions in redemption of stock and distributions in partial or complete liquidation. Dividends paid out of current or accumulated earnings and profits will not be included in income. The amount of additional income created from a non-dividend distribution is equal to the lesser of (1) the base year reserve and supplemental reserve for losses on loans or (2) an amount that, when reduced by the tax attributable to the income, is equal to the amount of the distribution. Thus, in some situations, approximately one and one-half times the non-dividend distribution would be included in gross income for federal income tax purposes, assuming a 34% federal corporate income tax rate. Corporate Alternative Minimum Tax. The Internal Revenue Code of 1986, as amended (the Code ), imposes a tax on alternative minimum taxable income at a rate of 20%. Only 90% of alternative minimum taxable income can be offset by alternative minimum tax net operating loss carryovers, of which we currently have none. Alternative minimum taxable income is also adjusted by 37
41 determining the tax treatment of certain items in a manner that negates the deferral of income resulting from the regular tax treatment of those items. We have been subject to a tax on alternative minimum taxable income during the past five years. Elimination of Dividends. Charter Financial may exclude from its income 100% of dividends received from CharterBank because CharterBank and Charter Financial are members of the same affiliated group of corporations. State Taxation. CharterBank currently files and will continue to file Georgia and Alabama income tax returns. Generally, the income of financial institutions in Georgia and Alabama, which is calculated based on federal taxable income, subject to certain adjustments, is subject to Georgia and Alabama tax, respectively. We are not currently under audit with respect to either our Georgia or our Alabama income tax returns and none of our state tax returns have been audited for the past five years. Charter Financial is required to file a Georgia income tax return and is generally subject to a state income tax rate that is the same tax rate as the tax rate omposed on financial institutions in Georgia. Regulation of CharterBank and Charter Financial. General. Charter Financial and First Charter, MHC, are regulated as savings and loan holding companies by the OTS. CharterBank, as a federal stock savings bank, is subject to regulation, examination and supervision by the OTS and the FDIC. CharterBank must file reports with the OTS concerning its activities and financial condition. Charter Financial and First Charter, MHC, are also required to file reports with, and otherwise comply with the rules and regulations of the OTS. Charter Financial is also required to file reports with, and otherwise comply with, the rules and regulations of the SEC under the federal securities laws. Any change in such laws and regulations, whether by the OTS, the FDIC, or through legislation, could have a material adverse impact on Charter Financial and CharterBank and their operations and stockholders. Federal Banking Regulation. Activity Powers. CharterBank derives its lending and investment powers from the Home Owners Loan Act, as amended (the HOLA ), and the regulations of the OTS. Under these laws and regulations, CharterBank may invest in mortgage loans secured by residential and commercial real estate; commercial and consumer loans; certain types of debt securities; and certain other assets. CharterBank may also establish service corporations that may engage in activities not otherwise permissible for CharterBank, including certain real estate equity investments and securities and insurance brokerage. CharterBank s authority to invest in certain types of loans or other investments is limited by federal law and regulation. Loans-to-One-Borrower Limitations. CharterBank is generally subject to the same limits on loans to one borrower as a national bank. With specified exceptions, CharterBank s total loans or extensions of credit to a single borrower cannot exceed 15% of CharterBank s unimpaired capital and surplus which does not include accumulated other comprehensive income. CharterBank may 38
42 lend additional amounts up to 10% of its unimpaired capital and surplus, if the loans or extensions of credit are fully-secured by readily-marketable collateral. CharterBank currently complies with applicable loansto-one-borrower limitations. QTL Test. Under federal law, CharterBank must comply with the qualified thrift lender, or QTL test. Under the QTL test, CharterBank is required to maintain at least 65% of its portfolio assets in certain qualified thrift investments in at least nine months of the most recent 12-month period. Portfolio assets means, in general, CharterBank s total assets less the sum of: liquid assets up to 20% of total assets; goodwill and other intangible assets; and office property. CharterBank may also satisfy the QTL test by qualifying as a domestic building and loan association as defined in the Internal Revenue Code of CharterBank met the QTL test at September 30, 2006, and in each of the prior 12 months, and, therefore, is a qualified thrift lender. For purposes of calculating compliance with the QTL test, we use the cost basis of our investment in our Freddie Mac common stock, rather than the current market value of the stock. If CharterBank fails the QTL test and is unable to correct that failure for a period of time, it must either operate under certain restrictions on its activities or convert to a bank charter. Capital Requirements. OTS regulations require CharterBank to meet three minimum capital standards: (1) A tangible capital ratio requirement of 1.5% of tangible capital to adjusted total assets, as adjusted under the OTS regulations; (2) a leverage ratio requirement of 3% of core capital to such adjusted total assets, if a savings association has been assigned the highest composite rating of 1 under the Uniform Financial Institutions Ratings System or 4% or more if the savings association has not been assigned the highest composite rating; and (3) a risk-based capital ratio requirement of 8% of core and supplementary capital to total riskweighted assets; provided that the amount of supplementary capital used to satisfy this requirement may not exceed 100% of core capital. In determining compliance with the risk-based capital requirement, CharterBank must compute its risk-weighted assets by multiplying its assets and certain off-balance sheet items by risk-weights, which range from 0% for cash and obligations issued by the United States Government or its agencies to 100% for consumer and commercial loans, as assigned by the OTS capital regulation based on the risks that the OTS believes are inherent in the type of asset. 39
43 Tangible capital is defined, generally, as common stockholders equity (including retained earnings), certain non-cumulative perpetual preferred stock and related earnings, nonwithdrawable accounts and pledged deposits that qualify as core capital and minority interests in equity accounts of fully consolidated subsidiaries, less intangible assets, servicing assets and credit-enhancing interest-only strips not includable in tangible capital and certain investments in and loans to non-includable subsidiaries and subsidiaries engaged in activities not permissible for a national bank. Core capital is defined similarly to tangible capital, but core capital also includes certain qualifying supervisory goodwill and certain purchased credit card relationships and excludes minority interests in consolidated asset backed commercial paper programs that are excluded from risk-weighted assets pursuant to OTS regulations. Supplementary capital includes cumulative and other perpetual preferred stock, mandatory convertible subordinated debt, mandatory redeemable peferred stock, intermediate-term preferred stock, perpetual subordinated debt, income capital certificates, net worth certificates, mutual capital certificates, non-withdrawable accounts and pledged deposits included in core capital and allowance for loan and lease losses, as defined. In addition, up to 45% of unrealized gains on available-for-sale equity securities with a readily determinable fair value may be included in tier 2 capital. The allowance for loan and lease losses, as defined, is included in tier 2 capital to a maximum of 1.25% of risk-weighted assets, and the amount of supplementary capital that may be included as total capital cannot exceed the amount of core capital. At September 30, 2006, CharterBank met each of its capital requirements. See footnote 17 in the accompanying consolidated financial statements. Community Reinvestment Act. Under the Community Reinvestment Act ( CRA ), as implemented by OTS regulations, CharterBank has a continuing and affirmative obligation to help meet the credit needs of its entire community, including low and moderate income neighborhoods. The CRA does not establish specific lending requirements or programs for CharterBank nor does it limit its discretion to develop the types of products and services that it believes are best suited to its particular community, consistent with the CRA. The CRA requires the OTS, in connection with its examination of CharterBank, to assess CharterBank s record of meeting the credit needs of its community and to take the record into account in its evaluation of certain applications by CharterBank. The CRA also requires all institutions to make public disclosure of their CRA ratings. CharterBank received a Satisfactory CRA rating in its most recent examination. CRA regulations rate an institution based on its actual performance in meeting community needs. In particular, the system focuses on three tests: a lending test, to evaluate the institution s record of making loans in its assessment areas; an investment test, to evaluate the institution s record of investing in community development projects, affordable housing, and programs benefiting low or moderate income individuals and businesses in its assessment areas or a broader area that includes its assessment areas; and a service test, to evaluate the institution s delivery of services through its retail banking channels and the extent and innovativeness of its community development services. 40
44 Transactions with Affiliates. CharterBank s authority to engage in transactions with its affiliates is limited by OTS and Federal Reserve Board ( FRB ) regulations and by Sections 23A and 23B of the Federal Reserve Act (the FRA ). In general, these transactions must be on terms which are as favorable to CharterBank as comparable transactions with non-affiliates. In addition, certain types of these transactions are restricted to an aggregate percentage of CharterBank s capital. Collateral in specified amounts must usually be provided by affiliates in order to receive loans from CharterBank. In addition, regulations prohibit a savings association from lending to any of its affiliates that is engaged in activities that are not permissible for bank holding companies and from purchasing the securities of any affiliate, other than a subsidiary. The FRB implements sections 23A and 23B of the FRA through Regulation W. The FRB expects each depository institution that is subject to Sections 23A and 23B to implement policies and procedures to ensure compliance with Regulation W, which CharterBank has done. Loans to Insiders. CharterBank s authority to extend credit to its directors, executive officers and principal shareholders, as well as to entities controlled by such persons, is currently governed by the requirements of Sections 22(g) and 22(h) of the FRA and Regulation O of the FRB. Among other things, these provisions require that extensions of credit to insiders (a) be made on terms that are substantially the same as, and follow credit underwriting procedures that are not less stringent than, those prevailing for comparable transactions with unaffiliated persons and that do not involve more than the normal risk of repayment or present other unfavorable features, and (b) not exceed certain limitations on the amount of credit extended to such persons, individually and in the aggregate, which limits are based, in part, on the amount of CharterBank s capital. The regulations allow small discounts on fees on residential mortgages for directors, officers and employees. In addition, extensions of credit in excess of certain limits must be approved by CharterBank s Board of Directors. Enforcement. The OTS has primary enforcement responsibility over savings associations, including CharterBank. This enforcement authority includes, among other things, the ability to assess civil money penalties, to issue cease and desist orders and to remove directors and officers. In general, these enforcement actions may be initiated in response to violations of laws and regulations and to unsafe or unsound practices. Standards for Safety and Soundness. Under federal law, the OTS has adopted a set of guidelines prescribing safety and soundness standards. These guidelines establish general standards relating to internal controls, information systems, internal audit systems, loan documentation, credit underwriting, interest rate risk exposure, asset growth, asset quality, earnings standards, and compensation, fees and benefits. In general, the guidelines require appropriate systems and practices to identify and manage the risks and exposures specified in the guidelines. In addition, the OTS adopted regulations that authorize, but do not require, the OTS to order an institution that has been given notice that it is not satisfying these safety and soundness standards to submit a compliance plan. If, after being notified, an institution fails to submit an acceptable plan or fails in any material respect to implement an accepted plan, the OTS must issue an order directing action to correct the deficiency, may issue an order directing corrective actions and may issue an order directing other 41
45 actions of the types to which an undercapitalized association is subject under the prompt corrective action provisions of federal law. If an institution fails to comply with such an order, the OTS may seek to enforce such order in judicial proceedings and to impose civil money penalties. Limitation on Capital Distributions. The OTS imposes various restrictions or requirements on CharterBank s ability to make capital distributions, including cash dividends. A savings institution that is the subsidiary of a savings and loan holding company must file a notice with the OTS at least 30 days before making a capital distribution. CharterBank must file an application for prior approval if the total amount of its capital distributions, including the proposed distribution, for the applicable calendar year would exceed an amount equal to CharterBank s net income for that year plus CharterBank s retained net income for the previous two years. The OTS may disapprove of a notice or application if: CharterBank would be undercapitalized following the distribution; the proposed capital distribution raises safety and soundness concerns; or the capital distribution would violate a prohibition contained in any statute, regulation or agreement. Liquidity. CharterBank is required to maintain a sufficient amount of liquid assets to ensure its safe and sound operation. Prompt Corrective Action Regulations. Under the OTS prompt corrective action regulations, the OTS is required to take certain, and is authorized to take other, supervisory actions against undercapitalized savings associations. For this purpose, a savings association would be placed in one of the following four categories based on the association s capital: well-capitalized; adequately capitalized; undercapitalized; or critically undercapitalized. At September 30, 2006, CharterBank met the criteria for being considered well-capitalized. When appropriate, the OTS can require corrective action by a savings association holding company under the prompt corrective action provisions of federal law. Insurance of Deposit Accounts. The FDIC merged the Bank Insurance Fund and the Savings Association Insurance Fund to form the Deposit Insurance Fund (the DIF ) on March 31, CharterBank is a member of the DIF and pays its deposit insurance assessments to the DIF. Effective January 1, 2007, the FDIC established a risk-based assessment system for determining the deposit insurance assessments to be paid by insured depository institutions. Under the assessment system, the FDIC assigns an institution to one of four risk categories with the first category having two subcategories based on the institution s most recent supervisory and capital 42
46 evaluations, designed to measure risk. Assessment rates currently range from 0.05% of deposits for an institution in the highest sub-category of the highest category to 0.43% of deposits for an institution in the lowest category. The FDIC is authorized to raise the assessment rates as necessary to maintain the required reserve ratio of 1.25%. The FDIC allows the use of credits for assessments previously paid. We believe that we have credits that will offset the assessment for calendar 2007 and possibly In addition, all FDIC insured institutions are required to pay assessments to the FDIC at an annual rate of approximately.0124% of insured deposits to fund interest payments on bonds issued by the Financing Corporation, an agency of the federal government established to recapitalize the predecessor to the Savings Association Insurance Fund. These assessments will continue until the Financing Corporation bonds mature in 2017 through Federal Home Loan Bank System. CharterBank is a member of the Federal Home Loan Bank (the FHLB ) of Atlanta, which is one of the regional FHLBs making up the FHLB System. Each member of the FHLB of Atlanta has to maintain a minimum investment in FHLB of Atlanta stock in an amount equal to the sum of (i) approximately 0.25% of the member s total assets up to a maximum of $25 million, (ii) 4.5% of the member s outstanding advances, (iii) 4.5% of the outstanding assets purchased from the member and held by the FHLB under master commitments, and (iv) 8% of any Affordable Multi-Family Participation Program loans purchased from the member. Any advances from a FHLB must be secured by specified types of collateral, and all long-term advances may be obtained only for the purpose of providing funds for residential housing finance. FHLBs are required to provide funds for the resolution of insolvent thrifts and to contribute funds for affordable housing programs. These requirements could reduce the amount of earnings that the FHLBs can pay as dividends to their members and could also result in the FHLBs imposing a higher rate of interest on advances to their members. If dividends were reduced or interest on future FHLB advances was increased, CharterBank s net interest income would be adversely affected. Prohibitions Against Tying Arrangements. Federal savings banks are subject to the prohibitions on certain tying arrangements. A depository institution is prohibited, subject to some exceptions, from extending credit to or offering any other service, or fixing or varying the terms or pricing for such extension of credit or service, on the condition that the customer obtain some additional service from the institution or its affiliates or not obtain services from a competitor of the institution. Federal Reserve System. Under regulations of the FRB, CharterBank is required to maintain noninterest-earning reserves against its transaction accounts. The amount of transaction accounts exempt from a reserve requirement is $7.8 million. A 3% reserve is required for transaction accounts from $7.8 million to $48.3 million. Institutions with transaction accounts over $48.3 million are subject to a reserve requirement of $1.215 million plus 10% on all transaction accounts over $48.3 million. CharterBank is in compliance with these requirements. Because required reserves must be maintained in the form of either vault cash, a noninterest- 43
47 bearing account at a Federal Reserve Bank or a pass-through account as defined by FRB, the effect of this reserve requirement is to reduce CharterBank s interest-earning assets, to the extent the requirement exceeds vault cash. Holding Company Regulation. Charter Financial and First Charter, MHC, are savings and loan holding companies regulated by the OTS. As such, Charter Financial and First Charter, MHC, are registered with and are subject to OTS examination and supervision, as well as certain reporting requirements. In addition, the OTS has enforcement authority over Charter Financial and First Charter, MHC, and any of their non-savings institution subsidiaries. Among other things, this authority permits the OTS to restrict or prohibit activities that are determined to be a serious risk to the financial safety, soundness or stability of a subsidiary savings institution. Unlike bank holding companies, federal savings and loan holding companies are not subject to any regulatory capital requirements or to supervision by the Federal Reserve System. Restrictions Applicable to Charter Financial. Because Charter Financial was organized after May 4, 1999, under the Gramm-Leach-Bliley Act (the GLB Act ), it is prohibited from engaging in non-financial activities. Charter Financial s activities are generally restricted to: furnishing or performing management services for a savings institution subsidiary of such holding company; conducting an insurance agency or escrow business; holding, managing, or liquidating assets owned or acquired from a savings institution subsidiary of such company; holding or managing properties used or occupied by a savings institution subsidiary of such company; acting as trustee under a deed of trust; any other activity (a) that the FRB, by regulation, has determined to be permissible for bank holding companies under Section 4(c) of the Bank Holding Company Act of 1956 ( BHCA ), unless the Director of the OTS, by regulation, prohibits or limits any such activity for savings and loan holding companies, or (b) in which multiple savings and loan holding companies were authorized by regulation to directly engage on March 5, 1987; purchasing, holding, or disposing of stock acquired in connection with a qualified stock issuance if the purchase of such stock by such holding company is approved by the Director of the OTS; and any activity permissible for financial holding companies under section 4(k) of the BHCA. Permissible activities which are deemed to be financial in nature or incidental thereto under section 4(k) of the BHCA include: lending, exchanging, transferring, investing for others or safeguarding money or securities; insurance activities or providing and issuing annuities, and acting as principal, agent or broker; 44
48 financial, investment or economic advisory services; issuing or selling instruments representing interests in pools of assets that a bank is permitted to hold directly; underwriting, dealing in, or making a market in securities; activities previously determined by the FRB to be closely related to banking; activities that bank holding companies are permitted to engage in outside of the U.S.; merchant banking activities; and portfolio investments made by an insurance company. In addition, Charter Financial cannot be acquired or acquire a company unless the acquirer or target (as the case may be is engaged solely in financial activities. Restrictions Applicable to Activities of Mutual Holding Companies. Under federal law, a mutual holding company such as First Charter MHC may engage only in the following activities: investing in the stock of a savings institution; acquiring a mutual association through the merger of such association into a savings institution subsidiary of such holding company or an interim savings institution subsidiary of such holding company; merging with or acquiring another holding company, one of whose subsidiaries is a savings institution; investing in a corporation the capital stock of which is available for purchase by a savings institution under federal law or under the law of any state where the subsidiary savings institution or association is located; and the permissible activities described above for non-grandfathered savings and loan holding companies. If a mutual holding company acquires or merges with another holding company, the holding company acquired or the holding company resulting from such merger or acquisition may only invest in assets and engage in activities listed above, and it has a period of two years to cease any non-conforming activities and divest any non-conforming investments. Restrictions Applicable to All Savings and Loan Holding Companies. Federal law prohibits a savings and loan holding company, including Charter Financial and First Charter, MHC, directly or indirectly, from acquiring: control (as defined under HOLA) of another savings institution (or a holding company parent) without prior OTS approval; through merger, consolidation, or purchase of assets, another savings institution or a holding company thereof, or acquiring all or substantially all of the assets of such institution (or a holding company) without prior OTS approval; or control of any depository institution not insured by the FDIC (except through a merger with and into the holding company s savings institution subsidiary that is approved by the OTS). 45
49 A savings and loan holding company may not acquire as a separate subsidiary an insured institution that has a principal office outside of the state where the principal office of its subsidiary institution is located, except: in the case of certain emergency acquisitions approved by the FDIC; if such holding company controls a savings institution subsidiary that operated a home or branch office in such additional state as of March 5, 1987; or if the laws of the state in which the savings institution to be acquired is located specifically authorize a Georgia savings institution chartered by that state to be acquired by a savings institution. The Sarbanes-Oxley Act. The Company is subject to the Sarbanes-Oxley Act of 2002, which implements a broad range of corporate governance and accounting measures for public companies designed to promote honesty and transparency in corporate America and better protect investors from the corporate misconduct. Section 402 of the Sarbanes-Oxley Act of 2002, or Sarbanes-Oxley, prohibits the extension of personal loans to directors and executive officers of issuers (as defined in Sarbanes-Oxley). The prohibition, however, does not apply to mortgages advanced by an insured depository institution, such as the Bank, which are subject to the insider lending restrictions of Section 22(h) of the FRA. The Sarbanes-Oxley Act s principal legislation and the derivative legislation and rulemaking promulgated by the SEC includes: the creation of an independent accounting oversight board; auditor independence provisions that restrict non-audit services that accountants may provide to their audit clients; additional corporate governance and responsibility measures, including the requirement that the chief executive officer and chief financial officer certify financial statements; A requirement that companies establish and maintain a system of internal control over financial reporting and that a company s management provide an annual report regarding its assessment of the effectiveness of such internal control over financial reporting to the company s independent accountants and that such accountants provide an attestation report with respect to management s assessment of the effectiveness of the company s internal control over financial reporting; the forfeiture of bonuses or other incentive-based compensation and profits from the sale of an issuer s securities by directors and senior officers in the twelve month period following initial publication of any financial statements that later require restatement; 46
50 an increase in the oversight of, and enhancement of certain requirements relating to audit committees of public companies and how they interact with the company s independent auditors; a requirement that audit committee members must be independent and are absolutely barred from accepting consulting, advisory or other compensatory fees from the issuer; a requirement that companies disclose whether at least one member of the audit committee is a financial expert (as defined by the SEC) and if not, why not; expanded disclosure requirements for corporate insiders, including accelerated reporting of stock transactions by insiders and a prohibition on insider trading during pension blackout periods; a prohibition on personal loans to directors and officers, except certain loans made by insured financial institutions; disclosure of a code of ethics and filing a Form 8-K for a change or waiver of such code; mandatory disclosure by analysts of potential conflicts of interest; and a range of enhanced penalties for fraud and other violations. We estimate the costs of complying with the provisions of Sarbanes Oxley section 404 were approximately $500,000 to $750,000 for the year ended September 30, USA Patriot Act. CharterBank is subject to the Bank Secrecy Act, as amended by the USA Patriot Act which gives the federal government powers to address money laundering and terrorist threats through enhanced domestic security measures, expanded surveillance powers, increased information sharing and broadened anti-money laundering requirements. Title III of the USA Patriot Act takes measures intended to encourage information sharing among financial institutions, bank regulatory agencies and law enforcement bodies. Further, certain provisions of Title III impose affirmative obligations on a broad range of financial institutions, including banks, thrifts, brokers, dealers, credit unions, money transfer agents and parties registered under the Commodity Exchange Act. 47
51 Among other requirements, the USA Patriot Act imposes the following obligations on financial institutions: All financial institutions must establish risk-based anti-money laundering programs that include, at minimum: (i) internal policies, procedures, and controls, (ii) specific designation of an anti-money laundering compliance officer, (iii) ongoing employee training programs, and (iv) an independent audit function to test the anti-money laundering program. All financial institutions must implement a written customer identification program appropriate for its size, location and type of business, Financial institutions that establish, maintain, administer, or manage private banking accounts or correspondent accounts in the United States for non-united States persons or their representatives (including foreign individuals visiting the United States) must establish appropriate, specific, and, where necessary, enhanced due diligence policies, procedures, and controls designed to detect and report money laundering through these accounts. Financial institutions are prohibited from establishing, maintaining, administering or managing correspondent accounts for foreign shell banks (foreign banks that do not have a physical presence in any country), and must take reasonable steps to ensure that correspondent accounts provided to foreign banks are not being used to indirectly provide banking services to foreign shell banks. Bank regulators are directed to consider a holding company s effectiveness in combating money laundering when ruling on BHCA and Bank Merger Act applications. Federal Securities Law. Our common stock is registered with the SEC under Section 12(g) of the Securities Exchange Act of 1934, as amended (the Exchange Act ). We are subject to information, proxy solicitation, insider trading restrictions, and other requirements under the Exchange Act. ITEM 1A. RISK FACTORS An investment in our common stock is subject to risks inherent in our business. Before making an investment decision, you should carefully consider the risks and uncertainties described below together with all of the other information included in this report. In addition to the risks and uncertainties described below, other risks and uncertainties not currently known to us or that we currently deem to be immaterial also may materially and adversely affect our business, financial condition and results of operations. The value or market price of our common stock could decline due to any of these identified or other risks, and you could lose all of your investment. 48
52 A decrease in the market value of our Freddie Mac stock investment may reduce our earnings and capital. At November 16, 2006, we owned 4,402,500 shares of Freddie Mac stock of which 1,847,500 shares were owned directly by Charter Financial and the remaining 2,555,000 shares were owned by CharterBank. These shares had an estimated fair market value of $302.0 million. On November 21, 2006, we commenced an issuer tender offer pursuant to which we plan to purchase up to 1,000,000 shares of our common stock. The tender offer will be funded by the sale of Freddie Mac common by Charter Financial. Assuming we purchase 1,000,000 shares of our common stock at the maximum purchase price of $52.00, we would need to sell approximately 776,000 shares of Freddie Mac stock to fund the tender offer and related expenses, based on the $67.51 closing price of Freddie Mac stock on November 21, In that case, we would still own approximately 3,626,500 shares of Freddie Mac stock, on a consolidated basis, having a market value of approximately $248.7 million. Our current revenue and strong capital structure are due, in part, to dividend income from the Freddie Mac stock and the appreciation of the stock investment. If we cannot increase income from our loan and investment portfolio and the market value of our Freddie Mac stock investment declines, our capital and profitability may be adversely impacted. In addition, if the market value of our Freddie Mac stock investment declines, our capital will be reduced proportionately. We have a significant deferred tax liability on our Freddie Mac stock investment. If it became payable, this tax liability would significantly adversely affect our liquidity, ability to hold Freddie Mac stock and earnings. At September 30, 2006, we had deferred taxes of $108.2 million which relate primarily to the unrealized gain on our Freddie Mac stock. The unrealized gain, net of tax, has been recorded as other comprehensive income and has been included in the equity section of the statement of financial condition as Accumulated Other Comprehensive Income and the related deferred taxes have been included in the liability section as Deferred Income Taxes. We have designated our Freddie Mac stock investment as held for investment, as opposed to trading, for tax purposes. If, because of frequent sales or for other reasons, the Internal Revenue Service designates our Freddie Mac stock investment as trading, the investment would be marked to market for tax purposes each year. As of September 30, 2006, this would add approximately $288.4 million to taxable income which, assuming a 38.6% effective tax rate, would require a combined tax payment of $111.3 million. The payment of this deferred tax liability would adversely affect our liquidity, ability to hold Freddie Mac stock and earnings. In addition, assuming we sell approximately 1,244,,000 shares of Freddie Mac stock to fund our announced issuer tender offer, approximately $83.3 million would be added to our taxable income which, assuming a 38.6% effective tax rate, would require a combined tax payment of $31.3 million. If our dividend income exceeds our taxable income for any given year, we will lose potential tax benefits associated with the dividends received deduction. We receive a dividends received deduction on dividend income from our investment in Freddie Mac stock. This deduction is the lesser of 70% of dividends received or 70% of taxable income before the dividend received deduction. Therefore, if taxable income exceeds 70% of dividend income or if we incur a net loss for any given year, the full deduction of 70% of dividends is allowed, 49
53 creating significant tax savings for us. However, if 70% of dividend income exceeds taxable income for any given year, we will not be able to take full advantage of the dividends received deduction and we would lose potential tax benefits. The table below shows the tax benefit of the dividends received deduction at different levels of taxable income assuming constant dividend income of $8,400,000 and an effective tax rate of 37.72%. Taxable Income (Loss) 1. Taxable income (loss) before dividend exclusion $9,000,000 $ 100,000 $ (100,000) 2. Dividend income $8,400,000 $8,400,000 $8,400, Dividends received deduction lesser of 70% of line 1 or line 2 $5,888,000 $ 70,000 $5,888, Tax benefit of deduction $2,220,954 $ 26,404 $2,220,954 A decrease in our sources of funds may affect our ability to fund loans. This would reduce our earnings. CharterBank funds its operations with a combination of retail and wholesale deposits, and with borrowings from the Federal Home Loan Bank of Atlanta and securities sold under agreements to repurchase. Credit union certificates of deposits comprised approximately 10% of our total deposit base at September 30, The balances of our credit union deposits are more volatile than our retail deposits. Wholesale deposits of approximately $43.2 million are scheduled to mature within the next year. As these deposits mature, they are less likely to remain with CharterBank, as compared to the relatively stable balance of our core retail deposit base. As a result, these maturities will most likely outpace the growth of our retail deposit base. Accordingly, we plan to continue to utilize either borrowed funds or wholesale deposits to fund asset growth and maturing liabilities. Our capacity to borrow is impacted by the amount of available collateral. This collateral is impacted by interest rates, delinquencies and other factors related to the underlying loans and securities. In a rising interest rate environment or a weak economy, the value of our collateral may decrease thereby reducing our capacity to borrow. Further, the Federal Home Loan Bank may have higher priority than other lenders from whom we have borrowed in times of financial distress and demand significant collateral. At September 30, 2006, CharterBank had available lines of credit commitments with the Federal Home Loan Bank of Atlanta totaling $388.2 million, of which $312.0 million was advanced and $76.0 million was available. Although we have secured a line of credit based on the value of our Freddie Mac stock, we believe that the significant negative tax implications associated with borrowing against our Freddie Mac stock makes this option a last resort. If sufficient deposits or borrowings are not available to effectively fund loans, our future earnings may be negatively impacted. 50
54 Our local economy may affect our future growth possibilities. Our current market area is principally located in west-central Georgia and east-central Alabama. Our future growth opportunities depend on the growth and stability of our regional economy and our ability to expand our market area. While we expect our local economy to moderately grow over the next several years, a downturn in our local economy may limit funds available for deposit and may negatively affect our borrowers ability to repay their loans on a timely basis, both of which could have an impact on our profitability. Our market area has traditionally depended on the textile industry as a source of employment, and while our local economy has expanded to include other trade sectors in recent years, including the March 2006 announcement by Kia Motor Corporation that they plan to construct an automotive assembly and manufacturing facility in West Point, Georgia, our local economy has not experienced the same growth as other nearby regions. While we will seek to address this economic risk through expansion of our retail delivery systems into other nearby markets, we cannot guarantee that a downturn in our local economy will not have a negative impact on our earnings. Our high market share in the Valley area may limit further growth and lower our profitability. Our strong market share in the Valley region of our market area, which consists of West Point, Georgia, and Lanett and Valley, Alabama, may limit further growth in this area which could limit the amount of funds available to originate loans. Therefore, our profitability will depend, in part, on our ability to expand our retail market area beyond the Valley region. If this growth strategy is not successful, our earnings may be negatively impacted. Our ownership of Freddie Mac stock causes our return on average equity to be low compared to other companies. This could hurt the trading price of our common stock. At September 30, 2006, Freddie Mac stock, based on the price and dividend at September 30, 2006 had a yield of approximately 2.77% compared to a yield of 6.04% on our total interest-earning assets excluding Freddie Mac stock. This factor reduces our return on average equity to a level that may be lower than our peers. For the year ended September 30, 2006, our return on average equity was 5.10%. As long as we own a large amount of Freddie Mac stock, we expect our return on equity to be below the industry average, which may negatively impact the value of our stock. A decrease in demand for mortgage, commercial and consumer loans may lower our earnings. Making loans is a major component of our business and a primary source of revenues. If customer demand for loans decreases, our earnings may decrease because our alternative investments earn less revenue for us than real estate, commercial and consumer loans. Customer demand for loans could be reduced by a weaker economy, an increase in unemployment, a decrease in real estate values, an increase in interest rates or increased competition from other institutions. 51
55 Because we intend to increase our commercial real estate lending, our lending risk will increase and downturns in the real estate market or local economy could adversely impact our earnings. Loans secured by commercial real estate properties generally involve a higher degree of risk than residential mortgages. Because payments on loans secured by commercial real estate properties are often dependent on the successful operation or management of the properties or a related business, repayment of such loans may be subject to a greater extent, to adverse conditions in the real estate market or the local economy. Commercial real estate loans may also involve relatively large loan balances to single borrowers or groups of related borrowers. A downturn in the real estate market or the local economy could adversely impact the value of properties secured by the loan or the revenues from the business thereby increasing the risk of nonperforming loans. As the volume of commercial real estate loans in our loan portfolio increases, the corresponding risks and potential for losses from these activities may also increase. Because our loans are concentrated in the states of Georgia and Alabama, downturns in the economy or real estate market in our market area will adversely impact our earnings. Our loan portfolio is secured primarily by real estate located in Georgia and Alabama. Accordingly, the asset quality of our loan portfolio depends upon the economy and unemployment rate in this area. A downturn in the economy or the real estate market in our primary lending area would likely adversely affect our operations and earnings. Because First Charter, MHC owns a majority of Charter Financial s common stock, First Charter, MHC is able to prevent transactions you might be in favor of, including a sale or merger of Charter Financial. Provisions of our federal charter and bylaws and applicable provisions of federal law and regulations may delay, inhibit or prevent an organization or person from gaining control of Charter Financial through a tender offer, business combination, proxy contest or some other method even though some of our stockholders might believe a change in control is desirable. In addition, First Charter, MHC owns 80.0% of Charter Financial s common stock. The same directors and officers who manage CharterBank and Charter Financial manage First Charter, MHC. The board of directors of First Charter, MHC controls the outcome of most matters put to a vote of stockholders of Charter Financial. We cannot assure you that the votes cast by First Charter, MHC will be in your personal best interests as a stockholder. 52
56 If we deregister our common stock under the Exchange Act, it could reduce the amount of information about us that is publicly available. We plan to terminate the registration of our common stock under the Exchange Act if we have fewer than 300 holders of record of our common stock as determined under the Exchange Act. As of September 30, 2006, we had approximately 310 shareholders of record and our issuer tender offer announced November 21, 2006 will likely reduce that number. If we deregistered our common stock under the Exchange Act, we would no longer be required to file information with the SEC or provide certain information to our stockholders under the Exchange Act, and many provisions of the Exchange Act would become inapplicable to us. Therefore, deregistration could substantially reduce the information we would be required to furnish to our stockholders. However, if we deregister our common stock, we currently intend to provide all of our stockholders with audited annual financial statements, along with other information we deem appropriate and consistent with applicable laws. If our common stock does not continue to be traded on the Nasdaq Global Market, the liquidity of our common stock could decrease and it may be difficult for you to sell your stock. Our common stock is currently traded on the Nasdaq Global Market. If we deregister our common stock under the Exchange Act, it will no longer be eligible to be traded on that market. In that case, we expect that our common stock will trade on the Over-the-Counter Bulletin Board or the Pink Sheets. However, broker-dealers often decline to trade in OTC Bulletin Board and Pink Sheet stocks given that the market for such securities is often limited, the stocks are more volatile, and the risk to investors are greater. These factors may reduce the potential market for our common stock by reducing the number of potential investors. This may make it more difficult for investors in our common stock to sell shares to third parties or to otherwise dispose of them. This could cause our stock price to decline. ITEM 1B. UNRESOLVED STAFF COMMENTS None. 53
57 ITEM 2. PROPERTIES We currently conduct our business through nine full-service banking offices and three loan production offices. As of September 30, 2006, the properties and leasehold improvements owned by us had an aggregate net book value of $17.0 million. Location Ownership Year Opened Administrative Office: 1233 O.G. Skinner Drive West Point, Georgia Branch Offices: 600 Third Avenue West Point, Georgia 300 Church Street LaGrange, Georgia th Avenue(2) Valley, Alabama 91 River Road(2) Valley, Alabama 1605 East University Drive Auburn, Alabama 2320 Moore s Mill Road (3) Auburn, Alabama 555 South Davis Road LaGrange, Georgia 2 nd Avenue Opelika, Alabama 1684 South College Street Auburn, Alabama Loan Production Offices: 2959 Highway 154, Bld. C, Suite D Newnan, Georgia th Avenue, Suite B and C Phenix City, Alabama 217 Osborne Street St. Mary s, Georgia Date of Lease or License Expiration(1) Deposits as of September 30, 2005 (In thousands) Owned 2005 Owned 1965 $ 139,740 Owned ,903 Leased /31/08 62,894 Owned ,811 Owned ,305 Owned ,562 Owned ,613 Owned ,021 Owned ,208 Leased /31/08 Leased 2001 month-to-month Leased /31/07 (1) Lease expiration dates assume all options to extend lease terms are exercised. (2) Includes time period operated by Citizens National Bank prior to the Citizens acquisition. (3) Includes time period operated by Eagle Bank prior to the EBA acquisition. 54
58 ITEM 3. LEGAL PROCEEDINGS We are not involved in and none of our property is the subject of any pending legal proceeding other than ordinary routine legal proceedings incidental to our business. We believe that these routine legal proceedings, in the aggregate, are immaterial to our consolidated financial condition and results of operations. ITEM 4. SUBMISSION OF MATTERS TO A VOTE OF SECURITY HOLDERS None. PART II ITEM 5. MARKET FOR REGISTRANT S COMMON EQUITY, RELATED STOCKHOLDER MATTERS AND ISSUER PURCHASES OF EQUITY SECURITIES Our common stock is listed on the Nasdaq Global Market under the symbol CHFN. First Charter, MHC, owns 15,857,924 shares, or 80% of our outstanding common stock. At September 30, 2006, there were 19,662,981 shares of common stock issued and outstanding, and there were approximately 330 holders of record. The price range for our common stock for the period from October 1, 2004, to September 30, 2006, based on daily closing prices, and the amounts of dividends we paid during that period, are set forth in the following table. 55
59 High Low Dividends Declared Fiscal Year Ended September 30, 2005 First Quarter $44.00 $34.85 $2.25 per share(1) Second Quarter $43.27 $31.50 $ 0.25 per share Third Quarter $36.44 $30.75 $0.35 per share Fourth Quarter $36.40 $33.48 $ 0.35 per share Fiscal Year Ended September 30, 2006 First Quarter $39.65 $32.68 $0.70 per share (2) Second Quarter $38.74 $35.00 $0.45 per share Third Quarter $40.05 $35.72 $ 0.45 per share Fourth Quarter $40.30 $34.79 $2.20 per share (3) (1) Included a special dividend of $2.00 (2) Included a special dividend of $.35 (3) Included special dividend of $1.75 The stock price information set forth above has been provided by Bloomberg. High, low, and closing prices and daily trading volumes are reported in most major newspapers. During the years ended September 30, 2006, and September 30, 2005, we paid dividends in the amounts set forth in the table above. The payment of future dividends will be subject to determination by our board of directors, which will take into account, among other factors, our financial condition, results of operations, tax considerations, industry standards, economic conditions and regulatory restrictions that affect the payment of dividends by CharterBank to Charter Financial. We cannot guarantee that we will not reduce or eliminate dividends in the future. When Charter Financial pays dividends to its stockholders, it is required to pay dividends to First Charter, MHC, unless First Charter, MHC, elects to waive dividends. To date, First Charter, MHC, has waived dividends paid by Charter Financial. Any decision to waive dividends will be subject to regulatory approval. Charter Financial is not subject to OTS regulatory restrictions on the payment of dividends. Our ability to pay dividends in the future depends on cash at Charter Financial and income at Charter Financial, including premiums on covered calls and exercises of covered calls on Freddie Mac common stock. It also depends on the amount of funds available from CharterBank. CharterBank must provide the OTS with 30 days notice of its intention to make a capital distribution to Charter Financial. OTS regulations may also limit, in certain circumstances, CharterBank s ability to make capital distributions. CharterBank made a dividend distribution to Charter Financial in December 2005 of $9.0 million, which was approved by the OTS. 56
60 ITEM 6. SELECTED FINANCIAL DATA The summary information presented below at September 30 and for each of the years presented is derived in part from the consolidated financial statements of Charter Financial. The following information is only a summary, and you should read it in conjunction with our consolidated financial statements and notes beginning on page F-1. At September 30, (In thousands) Selected Financial Data: Total assets $1,097,321 $1,050,570 $1,068,201 $1,000,495 $982,563 Loans receivable, net(1) 374, , , , ,654 Investment and mortgage securities available for sale(2) 345, , , , ,999 Freddie Mac common stock & other equity securities 294, , , , ,215 Retail deposits 321, , , , ,078 Total deposits 372, , , , ,746 Deferred income taxes 108,186 93, ,603 88,196 96,040 Total borrowings 337, , , , ,963 Total retained earnings 63,548 63,790 63,626 59,190 58,225 Accumulated other comprehensive income(3) 172, , , , ,961 Total equity 267, , , , ,166 Allowance for loan losses 6,086 6,160 6,623 6,780 5,179 Non-performing assets 3,297 5,195 6,318 5,808 3,683 For the Years Ended September 30, (In thousands) Selected Operating Data: Interest and dividend income $ 53,802 $ 44,689 $ 38,813 $ 34,335 $ 37,740 Interest expense 27,801 21,782 17,068 18,805 21,845 Net interest income 26,001 22,907 21,745 15,530 15,895 Provision for loan losses Net interest and dividend income after provision for loan losses 26,001 22,832 21,715 15,505 15,645 Total noninterest income 10,826 10,966 6,508 5,894 1,939 Total noninterest expenses 21,130 18,269 17,156 18,225 14,200 Income before provision for income taxes 15,697 15,529 11,067 3,174 3,384 Income tax expense 2,353 4,116 2, Net income $ 13,344 $ 11,413 $ 8,217 $ 3,091 $ 2,900 Basic earnings per share $ 0.69 $ 0.58 $ 0.42 $ 0.16 $ 0.15 Fully Diluted earnings per share $ 0.68 $ 0.58 $ 0.42 $ 0.16 $ 0.15 Dividends declared per share $ 3.80 $ 3.20 $ 1.10 $ 0.60 $ 0.20 (1) Loans are shown net of deferred loan (fees) costs and allowance for loan losses and exclude loans held for sale. (2) Includes all CharterBank investment and mortgage securities available for sale excluding Freddie Mac common stock. (3) Consists of unrealized holding gains and losses on Freddie Mac common stock, investments, mortgagebacked securities and collateralized mortgage obligations classified as available for sale, net of income taxes. 57
61 Selected Financial Ratios and Other Data(4): At or for the Years Ended September 30, Performance: Return on realized assets(5) 1.61% 1.44% 1.06% 0.43% 0.40% Return on average assets Comprehensive return on average assets(6) 3.34 (1.81) 4.28 (0.91) (2.17) Return on realized equity(5) Return on average equity Comprehensive return on average equity(7) (7.24) (3.64) (7.06) Average equity to average assets Equity to total assets at end of period Average interest rate spread(8) Net interest margin(8)(9) Average interest-earning assets to average interest-bearing liabilities 1.52x 1.59x 1.55x 1.57x 1.69x Total noninterest expense to average assets 1.94% 1.69% 1.64% 1.85% 1.40% Regulatory Capital Ratios: Tangible capital 9.71% 9.86% 9.46% 8.78% 10.16% Core capital Risk-based capital Asset Quality Ratios: Non-performing loans as a percent of total loans Non-performing assets as a percent of total assets Allowance for loan losses as a percent of total loans Allowance for loan losses as a ratio of non-performing loans 2.15x 1.51x 1.12x 1.32x 1.30x Number of: Full-time equivalent employees (4) Asset quality ratios and regulatory capital ratios are end of period ratios. (5) Realized assets and equity exclude unrealized gains on available for sale securities. Please see the Ratio Analysis section in the Management s Discussion and Analysis for further discussion. (6) Comprehensive return on average assets represents comprehensive income divided by average assets. We believe that this information is relevant because, in contrast to other financial institutions, a vast majority of Charter Financial s comprehensive income is in the form of other comprehensive income instead of net income due to Charter Financial s significant investment in Freddie Mac common stock. Please see the Ratio Analysis section in the Management s Discussion and Analysis for further discussion. (7) Comprehensive return on average equity represents comprehensive income divided by average equity. We believe that this information is relevant because, in contrast to other financial institutions, a vast majority of Charter Financial s comprehensive income is in the form of other comprehensive income instead of net income due to Charter Financial s significant investment in Freddie Mac common stock. Please see the Ratio Analysis section in the Management s Discussion and Analysis for further discussion. (8) The net interest spread and net interest margin are significantly impacted by the large balances of Freddie Mac common stock and the low dividend yield on that stock. Please see the net interest margin discussion in Management s Discussion & Analysis for a discussion of this impact. (9) Net interest margin represents net interest income including dividend income from Freddie Mac common stock as a percentage of average interest-earning assets including Freddie Mac common stock. 58
62 ITEM 7. MANAGEMENT S DISCUSSION AND ANALYSIS OF FINANCIAL CONDITION AND RESULTS OF OPERATIONS Management Strategy. In recent years, we have adopted a growth-oriented strategy focused on (1) expanding our retail banking operations, (2) managing our Freddie Mac common stock investment while periodically reviewing strategies to increase or realize its value for our shareholders, and (3) effectively managing our capital. Expanding Retail Banking Operations. Our retail banking strategy is to operate as a well-capitalized community bank dedicated to providing quality products, excellent service, and a superior customer experience at competitive prices. We have sought to implement this strategy by concentrating on our core product offerings, including residential and commercial mortgage loans and a variety of checking and saving products, while at the same time broadening our product lines and services, expanding delivery systems for our customers, and filling in our branch network. The I-85/I-185 corridor anchored by Auburn, Alabama and Atlanta and Columbus, Georgia is an attractive market and the portions that are not in our current market are the most logical places for expanding our franchise through de novo branching. We will consider acquisitions in attractive growth markets in a broader geographic area. Our current market includes the I-85 corridor from LaGrange, Georgia to Auburn, Alabama, including the economic communities of LaGrange, Georgia, Auburn-Opelika, Alabama and the Valley area which includes West Point, Georgia, and Lanett and Valley, Alabama. The Valley area is our historical home base. Based on data from the FDIC, as of June 30, 2006 we have 51.7% of the bank deposits in the Valley market, approximately 5.5% deposit market share in the Auburn-Opelika market and 11.9% deposit market share in the LaGrange market. Only one competitor has branches in all three of these markets. We have 15.3% of the combined deposit market share which is the second largest market share of any bank in these markets. There are a significant number of customers and potential customers that live in one of these markets and work in another. Auburn-Opelika, and to a lesser extent LaGrange, have stronger economies and more growth potential than the Valley market. Historically we have focused on the consumer with one-to-four family mortgage loans and certificates of deposit. We are continuing our consumer focus with one-to-four family mortgages, consumer loans to credit-worthy borrowers, and a full menu of core deposit products. Our core deposits, transaction accounts, savings accounts and money market accounts, have increased to 52.6% of our total retail deposits from the traditional thrift deposit base that was almost exclusively certificate of deposits and passbook savings. We are expanding our customer base to include credit worthy small businesses and commercial real estate loans. 59
63 We seek to: Improve customer service and convenience as a means to compete for an increased share of our customers financial service business; Expand our retail banking franchise and our market share by increasing the number of households and the share of wallet of current households served within our market area; Expand our retail banking franchise through the convenience of extended retail hours; Continue to expand our market coverage by taking advantage of opportunities to build or acquire branches or acquire delivery systems within our target market; Improve customer use of our existing alternative delivery channels, such as ATMs, Internet banking and telephone banking; and Expand our offerings to businesses by focusing our commercial loan and deposit products and services as a means to increase the yield on our loan portfolio, to attract lower cost deposit accounts and increase non-interest income through related fees. We train our employees in providing outstanding quality service to customers as well as in the technical aspects of their jobs. A significant component of expanding our retail franchise is improving the communities we serve. The Charter Foundation plays a major role in implementing change in our markets. The Charter Foundation was created in 1994 and endowed by CharterBank s members with an initial gift of $1 million of Freddie Mac common stock. Subsequent gifts from CharterBank plus proceeds from the Foundation s investments have put the Foundation s corpus at approximately $7.0 million. The annual grant budget, which is a minimum of 5% of the Foundation s average assets, now totals approximately $400,000. In 2002, The Charter Foundation incorporated a member-voting component into the grant program. In June and July of each year, CharterBank s customers in each market have an opportunity to vote for three $5,000 grants to be given in their community. This program is designed to more closely tie The Charter Foundation and CharterBank in the minds of customers and the general public. Since its inception in 1994, The Charter Foundation has awarded approximately $3.0 million in grants in the communities served by CharterBank. Another community development activity geared to expanding the retail franchise is the Honors Savings Club program. This program, currently available to students in all public high schools in Troup County, Georgia, and Chambers County, Alabama, pays students for making all A s in a given semester. There is also a $500 bonus opportunity for the class valedictorian, and a $500 bonus opportunity for any student who makes all A s for all 4 years. To receive the award, each student must open an account at CharterBank, with one of the goals of the program being to cement a banking relationship with these students while they are young. Other goals are to reward academic excellence and to try to combat peer pressure that says it is not cool to be smart. Since its inception in 1996, more than $560,000 has been earned by students making all A s. This program, while bearing the CharterBank name, is funded from First Charter, MHC. 60
64 In October 2006, First Charter, MHC made a contribution to the local hospital to assist in the creation of the CharterBank Women s Center. Managing Our Freddie Mac Common Stock Investment. We manage our Freddie Mac common stock in several ways. Over the past ten years our total annual return on Freddie Mac common stock has averaged 12.03%. Dividends on pretax Freddie Mac common stock are an important component of our shareholder value. Our income from Freddie Mac dividends exceeds $0.43 per Charter Financial share, or over $2.33 per Charter Financial minority share. Seventy percent of the Freddie Mac dividends are excluded from Charter Financial s taxable income through the corporate dividends received exclusion. The Freddie Mac dividend, when combined with the 70% corporate dividend exclusion and the 15% personal tax rate reduction on dividends received by individuals, creates a tax efficient means for our stockholders to receive value from our Freddie Mac common stock investment. Also, the dividend waiver by First Charter, MHC, where only our minority shareholders receive dividends, adds significant value to our minority shareholders. In 2003, we implemented a program of selling covered calls on the Freddie Mac common stock as a means of enhancing the returns on this investment. The holders of the call options exercised their call on 75,000 shares in fiscal 2006, 92,500 shares in fiscal 2005, 35,000 shares in fiscal 2004 and 15,000 shares in 2003 resulting in the sale of these shares. The sales resulted in gain on the sale of stock of approximately $4.8 million, $6.1 million, and $2.1 million in fiscal 2006, 2005, and 2004, respectively. The call program resulted in net call premiums of $278,000, $525,000, and $149,000 in 2006, 2005, and 2004, respectively. In the thirty-nine month period during which we have been writing calls, the price of the underlying stock has ranged from a low of $48.10 to a high of $ This volatility has resulted in more repurchases of the option or sales of the underlying stock than would occur in a lower level of volatility. We continue to review this investment in Freddie Mac common stock in light of existing conditions and what is in the best interests of our shareholders. On November 21, 2006 we filed a self tender offer to repurchase up to one million of our outstanding shares. We will sell enough Freddie Mac common stock to fund this tender offer and pay income taxes on the gain on the sale of Freddie mac stock. Managing our Capital. The third major component of our strategy is capital management. We increased our capital leverage with the additional retail assets and deposits acquired in the Eagle Bank acquisition. We regularly evaluate expanding our capital leverage by extending the market area through de novo branching or acquisitions. Effective February 2003, Charter Financial acquired all of the outstanding shares of EBA Bancshares, Inc., Opelika, Alabama, and its wholly-owned banking subsidiary, Eagle Bank of Alabama, for a purchase price of approximately $8.6 million cash. The acquisition added three branches in the growing Auburn-Opelika area of Alabama, home of Auburn University, with $55.3 million in loans and $60.7 million in retail deposits. We slightly reduced our wholesale leverage of mortgage securities and borrowings. Wholesale leverage generally enhances income, but not franchise value, and thus is a low priority capital management tool. During the second fiscal quarter of 2006 we increased our quarterly dividend from 35 cents to 45 cents per share. We also paid special dividends of $2.10 per share in addition to our regular quarterly dividend during the fiscal year Our capacity to pay dividends is enhanced by First Charter, MHC s willingness to waive receipt of its portion of the dividends. We continue to evaluate our dividend policy and the appropriateness of special dividends or share repurchases. 61
65 General. Charter Financial Corporation is the mid-tier holding company and the sole shareholder of CharterBank. In October 2001, Charter Financial was formed in connection with the conversion of the Bank from mutual to stock form. At that time, the Company issued 80% or 15,857,924 shares of its common stock to First Charter, MHC ( MHC ). The conversion, the offering of stock to depositors, and the issuance of Company stock to the MHC are referred to collectively as the reorganization. As a result of the reorganization, the Bank converted to a federally chartered stock savings bank and became a whollyowned subsidiary of the Company, which is majority owned by the MHC, a federally chartered mutual holding company. Charter Financial s common stock is traded on the Nasdaq Global Market under the symbol CHFN. All references to Charter Financial prior to October 16, 2001, except where otherwise indicated, are to CharterBank. Our principal business is attracting deposits from the general public and investing those funds primarily in real estate loans. We also own 4.4 million shares of Freddie Mac common stock with an after tax unrealized gain of $177.1 million. While our primary businesses are the collecting of deposits from the general public and investing those funds in real estate loans, we also make consumer, construction and commercial loans and invest in mortgage-related and investment securities. The Company s results of operations are primarily dependent on our net interest income, which is the difference between the interest and dividend income we earn on loans, mortgage related securities and investments, and the interest expense we pay on deposits and borrowings. Our net interest income is affected by economic, competitive and regulatory factors that influence interest rates, loan demand and deposit flows. In addition, we, like other savings institution holding companies, are subject to interest rate risk to the degree that our interest- earning assets mature, prepay or reprice at different times, or on a different basis, than our interest-bearing liabilities. Our results of operations are also affected by, among other things, the level of operating expenses, fee income received, gains or losses on the sale of Freddie Mac common stock or other securities, gains or losses on loans held for sale, the establishment of provisions for losses on loans, and income taxes. Our operating expenses principally consist of employee compensation and benefits, occupancy expenses, professional services, federal deposit insurance premiums, marketing expenses and other general and administrative expenses. The Company is significantly affected by prevailing economic conditions including federal monetary and fiscal policies and federal regulation of financial institutions. Deposit balances are affected by a number of factors including interest rates paid on competing personal investments, the level of personal income and the personal rate of savings within our market area. Lending activities are influenced by the demand for housing as well as competition from other lending institutions. The primary sources of funds for lending activities include deposits, loan repayments, borrowings and funds provided from operations. 62
66 The table below shows our quarterly operating results for the past eight quarters th qtr. 3 rd qtr. 2 nd qtr. 1 st qtr. 4 th qtr. 3 rd qtr. 2 nd qtr. 1 st qtr. (In thousands) Interest and dividend income $ 14,003 $13,739 $13,273 $12,787 $11,530 $11,422 $ 11,059 $10,679 Interest expense 7,605 7,282 6,606 6,308 5,831 5,610 5,302 5,039 Net interest and dividend income 6,398 6,457 6,667 6,479 5,699 5,812 5,757 5,640 Provision for loan losses 75 Net interest and dividend income after provision for loan losses 6,398 6,457 6,667 6,479 5,624 5,812 5,757 5,640 Noninterest income 1,383 1,788 1,694 5,961 2,871 3,108 1,695 3,292 Noninterest expense 5,917 5,300 4,873 5,040 4,603 4,535 4,530 4,601 Income before provision for income taxes 1,864 2,945 3,488 7,400 3,892 4,385 2,922 4,331 Income tax expense (1,045) ,067 1,075 1, ,407 Net income $ 2,909 $ 2,550 $2,552 $5,333 $2,817 $3,209 $ 2,463 $ 2,924 Earnings per share $ 0.16 $ 0.13 $ 0.13 $ 0.27 $ 0.14 $ 0.16 $ 0.13 $ 0.15 Earnings per share- fully diluted $ 0.15 $ 0.13 $ 0.13 $ 0.27 $ 0.14 $ 0.16 $ 0.13 $ 0.15 Capital and Capital Management. CharterBank has traditionally been a well-capitalized savings bank, due, among other factors, to our unrealized gains on Freddie Mac common stock. At September 30, 2006 and 2005, we exceeded each of the applicable regulatory capital requirements. Our tier 1 capital was $78.4 million and $78.8 million at September 30, 2006 and 2005, respectively. Tier 1 capital represented 13.11% and 14.69% of risk-weighted assets at September 30, 2006 and 2005, respectively. Tier 1 capital represented 9.71% and 9.86% of total regulatory assets at September 30, 2006 and 2005, respectively, which exceeds the well-capitalized requirements of 5.0%. At September 30, 2006 and 2005, respectively, we had total risk-based capital of $156.8 million and $148.1 million and risk-based capital ratios of 26.21% and 27.62%, which significantly exceeds the applicable well-capitalized requirements of 10%. CharterBank exceeded its various regulatory capital requirements by amounts ranging from $38.0 million to $97.0 million at September 30, We declared regular dividends of $0.35 per share in December 2005 and $0.45 per share in March 2006, June 2006 and September 2006, and special dividends of $0.35 in December 2005 and $1.75 in August First Charter, MHC has waived its portion of these dividends. The Board of Directors will determine future dividends as well as other capital management strategies such as additional leverage, stock repurchases and special dividends. The Board of Directors will consider, among other factors, capital levels, results of operations, tax considerations, regulatory and regulatory business plan considerations, industry standards and economic conditions in determining such future dividends. 63
67 Critical Accounting Policies. In reviewing and understanding financial information for the Company, you are encouraged to read and understand the significant accounting policies used in preparing our consolidated financial statements. These policies are described in Note 1 to the consolidated financial statements. Also please see Asset Quality on page 15 for a further discussion of the Company s methodology in determining the allowance for loan losses. The accounting and financial reporting policies of Charter Financial Corporation conform to accounting principles generally accepted in the United States of America and to general practices within the banking industry. Of these policies, management has identified the allowance for loan losses as one of the most critical accounting policies that requires difficult subjective judgment and is important to the presentation of the financial condition and results of operations of the Company. The allowance for loan losses is established through a provision for loan losses charged to expense. Loans are charged against the allowance for loan losses when management believes that the collectibility of the principal is unlikely. Subsequent recoveries are added to the allowance. The allowance is an amount that management believes will be adequate to absorb losses on existing loans that become uncollectible, based on evaluations of the collectibility of loans. The evaluations take into consideration such factors as changes in the nature and volume of the loan portfolio, historical loss rates, overall portfolio quality, review of specific problem loans, and current economic conditions and trends that may affect a borrower s ability to repay. The Company segments its allowance for loan losses into the following four major categories: 1) specific reserves; 2) general reserves for Classified/Watch loans; 3) general reserves for loans with satisfactory ratings; and 4) an unallocated amount. Risk ratings are initially assigned in accordance with CharterBank s loan and collection policy. An organizationally independent department reviews risk grade assignments on an ongoing basis. Management reviews current information and events regarding a borrowers financial condition and strengths, cash flows available for debt repayment, the related collateral supporting the loan and the effects of known and expected economic conditions. When the evaluation reflects a greater than normal risk associated with the individual loan, management classifies the loan accordingly. If the loan is determined to be impaired, management allocates a portion of the allowance for loan losses for that loan based on the fair value of the collateral as the measure for the amount of the impairment. Impaired and Classified/Watch loans are aggressively monitored. The reserves for loans rated satisfactory are further subdivided into various types of loans as defined by loan type. The Company has developed specific quantitative reserve factors to apply to each individual component of the reserve. These quantitative reserve factors are based upon economic, market and industry conditions that are specific to the Company s local markets. These quantitative reserve factors consider, but are not limited to, national and local economic conditions, bankruptcy trends, unemployment trends, loan concentrations, dependency upon government installations and facilities, and competitive factors in the local market. These allocations for the quantitative reserve factors are included in the various individual components of the allowance for loan losses. In addition, we use some qualitative reserve factors that are subjective in nature and require considerable judgment on the part of management. However, it is management s opinion that these items do represent uncertainties in the Bank s business environment that must be factored into the Bank s analysis of the allowance for loan losses. The unallocated component of the allowance is established for losses that specifically exist in the remainder of the portfolio, but have yet to be identified. 64
68 While management uses available information to recognize losses on loans, future additions or reductions to the allowance may be necessary based on changes in economic conditions or changes in accounting guidance on reserves. In addition, various regulatory agencies, as an integral part of their examination process, periodically review our allowance for loan losses. Such agencies may require us to recognize additions to the allowance based on their judgments about information available to them at the time of their examination. Management believes that the allowance for loan losses is adequate. The Company has 90.6% of its loan portfolio secured by real estate, with one-to-four family real estate loans comprising 37.7% of the total loan portfolio. Commercial real estate loans comprise 41.4% of the loan portfolio. Construction and development loans comprise 11.5% of the real estate loan portfolio. The Company carefully monitors the loans in this category since the repayment of these loans is generally dependent upon earnings from the collateral real estate or the liquidation of the real estate and is impacted by national and local economic conditions. The residential category represents those loans the Company chooses to maintain in its portfolio rather than selling into the secondary market. The residential loans held for sale category comprises loans that are in the process of being sold into the secondary market. The credit has been approved by the investor and the interest rate and purchase price locked so the Company takes no credit or interest rate risk with respect to these loans. The Company s largest individual funded loan exposure is a commercial real estate loan with a balance of $6.4 million at September 30, Our largest industry exposure is the hotel industry with approximately $16.6 million in loans. Only 5.0% of the Company s portfolio consists of consumer loans, while 4.4% consists of commercial non-real estate loans. Investments, mortgage-backed securities, and collateralized mortgage obligations available for sale are reported at fair value, as determined by independent quotations. Purchase premiums and discounts on investment securities are amortized and accreted to interest income using a method that approximates a level yield over the period to maturity of the related securities. Purchase premiums and discounts on mortgage-backed securities and collateralized mortgage obligations are amortized and accreted to interest income using the interest method over the remaining lives of the securities, taking into consideration assumed prepayment patterns. The Company receives a dividends received deduction for tax purposes on dividend income from our investment in Freddie Mac common stock. This deduction is the lesser of 70% of dividends received or 70% of taxable income before the dividends received deduction. Since the Company does not file a consolidated tax return, this determination is made at the individual entity level. At September 30, 2006, the tax provision was based on a deduction of 70% of dividends received. Also, goodwill and core deposit premiums are evaluated annually for impairment in accordance with Statement of Financial Accounting Standards (SFAS) No. 142 Goodwill and Other Intangible Assets and SFAS No. 144 Accounting for the Impairment or Disposal of Long-Lived Assets. The evaluation of impairment is a critical accounting policy due to the subjective nature of the calculation and the assumptions used. Deposit premiums are amortized over the life of up to 13 years determined in the independent evaluation made as part of the purchase accounting determinations. 65
69 Management of Interest Rate Risk. As a financial institution, we face risk from interest rate volatility. Fluctuations in interest rates impact both our level of income and expense on a large portion of our assets and liabilities. Fluctuations in interest rates also affect the market value of all interest-earning assets. The primary goal of our interest rate risk management strategy is to maximize net interest income while maintaining an acceptable profile. We seek to coordinate asset and liability decisions so that, under changing interest rate scenarios, portfolio equity and net interest income remain within an acceptable range. Our lending activities have emphasized one-to-four family and commercial real estate loans. Our sources of funds include retail deposits, FHLB advances, repurchase agreements and wholesale deposits. Retail deposits consist primarily of Certificates of Deposit, which have shorter terms to maturity than the loan portfolio, and transaction accounts. We employ several strategies to manage the interest rate risk inherent in the asset/liability mix, including but not limited to: selling fixed rate mortgages we originate to the secondary market, generally on a servicing released basis; maintaining the diversity of our existing loan portfolio through the origination of commercial real estate and consumer loans which typically have variable rates and shorter terms than residential mortgages; emphasizing investments with adjustable interest rates; maintaining fixed rate borrowings from the FHLB; and increasing retail transaction deposits which typically have long durations. The actual amount of time before loans are repaid can be significantly impacted by changes in market interest rates. Prepayment rates also vary due to a number of other factors, including the regional economy in the area where the loans were originated, seasonal factors, demographic variables, the assumability of the loans, related refinancing opportunities and competition. We monitor interest rate sensitivity so that we can attempt to adjust our asset and liability mix in a timely manner and thereby minimize the negative effects of changing rates. Extension risk, or lower prepayments causing longer average lives, is our primary exposure to higher interest rates. Faster prepayment of loans and securities providing cash for reinvestment at lower interest rates creating a lower net interest income is our primary exposure to lower interest rates. Interest Risk Simulation. We use a simulation model to monitor interest rate risk. An analysis is performed on changes in net interest income assuming changes in interest rates, both up and down 100, 200 and 300 basis points from current rates over the one year time period following the current financial statement. However, with certain interest rates currently at 4.00%, a decrease of 300 basis points in our simulation model does not provide meaningful information. 66
70 The table following sets forth, as of September 30, 2006, the estimated changes in net portfolio value that would result from changes in interest rates as indicated over the applicable twelve-month period. Change In Rates Net Portfolio Value % Change Post Shock Capital Ratio +300 bp (13.31)% 24.12% +200 bp (8.74)% 24.88% +100 bp (4.17)% 25.61% 0 bp 0.00% 26.21% -100 bp 1.75% 26.28% -200 bp 0.26% 25.70% The net portfolio value is the capital, the excess of assets over liabilities, after all assets and liabilities are marked to market. The net portfolio value decreases as interest rates increase because fixed rate loans and securities decline in value with the increase in rates. The net portfolio value also decreases as interest rates decrease because fixed rate loans and mortgage securities have a borrower option to prepay so the assets do not gain significantly in value as rates decline. Freddie Mac common stock is held at a constant value through the interest rate shocks. The disparate result on net portfolio value of interest rate increases versus interest rate decreases is sometimes referred to as negative convexity and is the result of embedded options in mortgage securities, loans and borrowings. The post shock capital ratio is the post shock net portfolio value as a percent of total assets. The effects of interest rates on net portfolio value and net interest income are not predictable. Computations of prospective effects of hypothetical interest rate changes are based on numerous assumptions, including relative levels of market interest rates, prepayments, and deposit run-offs, and should not be relied upon as indicative of actual results. Certain shortcomings are inherent in these computations. Although some assets and liabilities may have similar maturity or periods of repricing, they may react at different times and in different degrees to changes in the market interest rates. Rates on other types of assets and liabilities may lag behind changes in market interest rates. Assets, such as adjustable rate mortgages, generally have features that restrict changes in interest rates on a short-term basis and over the life of the asset. After a change in interest rates, prepayments and early withdrawal levels could deviate significantly from those assumed in making the calculations set forth above. Additionally, increased credit risk may result if our borrowers are unable to meet their repayment obligations as interest rates increase. The following gap table summarizes the anticipated maturities or repricing of CharterBank s interestearning assets and interest-bearing liabilities as of September 30, 2006, based on the information and assumptions set forth in the notes that follow. 67

71
72
73 Overall, our net interest margin for September 30, 2006 was 2.48%, compared to 2.18% for the year ended September 30, The net interest margin excluding the Freddie Mac stock dividends was essentially the same for 2006 at 2.27% compared to 2.22% for the prior year. The yield on Freddie Mac common stock increased from 2.08% to 3.04% as the impact of the increased dividend rate was partially offset by the higher market value. The increase in the average cost of borrowings was 54 basis points from 2005 to 2006 which was similar to the increase of 52 basis points in the yield on mortgage-related investments. The increase in mortgage securities was attributable to increased yields on adjustable rate investments and newly purchased investments. The yield on loans receivable also increased 72 basis points. The cost of deposits increased 122 basis points from 2.35% in 2005 to 3.57% in The increase in the cost of deposits is due to cathchup since deposit rates had not increased in the prior year as much as overall interest rates. In the following tables, we derived the yields and costs by dividing income or expense by the average balance of interest-earning assets or interest-bearing liabilities, respectively, for the periods shown. We derived average balances from actual daily balances over the periods indicated. Interest income includes the recognition of certain fees over the lives of the underlying loans. 70
74 At September 30, 2006 Actual Balance Yield/Cost Assets: Interest-earning assets: Interest-bearing deposits in other financial institutions $ 9, % FHLB common stock 15, % Mortgage-backed securities and collateralized mortgage obligations available for sale 308, % Other investment securities available for sale 37, % Loans receivable 381, % Total interest-earning assets excluding Freddie Mac common stock 753, % Freddie Mac common stock 294, % Total interest-earning assets including Freddie Mac common stock 1,047, % Total noninterest-earning assets 49,907 Total assets $1,097, % Liabilities and Stockholders Equity: Interest-bearing liabilities: NOW accounts $ 49, % Savings accounts 13, % Money market deposit accounts 75, % Certificates of Deposit accounts 202, % Total interest-bearing deposits 340, % Borrowed funds 337, % Total interest-bearing liabilities 678, % Noninterest-bearing deposits 31,383 Other noninterest-bearing liabilities 119,627 Total noninterest-bearing liabilities 151,010 Total liabilities 829, % Total stockholders equity 267,709 Total liabilities and stockholders equity $1,097,321 71

75

76

77
78 (1) Interest income on loans is interest income as recorded in the income statement and therefore does not include interest income on non-accrual loans. (2) Tax exempt or tax advantaged securities and loans are shown at their contractual yields and are not shown at a tax equivalent yield. (3) Net interest rate spread represents the difference between the weighted average yield on interestearning assets and the weighted average cost of interest bearing liabilities. (4) Net interest margin represents net interest income as a percentage of average interest-earning assets. (5) Net interest rate spread excluding Freddie Mac common stock represents the difference between the weighted average yield on total interest-earning assets excluding Freddie Mac common stock and the weighted average cost of interest-bearing liabilities. (6) Net interest margin excluding Freddie Mac common stock represents net interest income excluding Freddie Mac common stock dividends as a percentage of average interest-earning assets excluding Freddie Mac common stock. 75
79 The following tables show our net interest spread and margin with and without Freddie Mac common stock and the dividends on that stock. Year Ended September 30, Net interest spread including Freddie Mac common stock 1.10% 0.96% 1.20% Net interest spread excluding Freddie Mac common stock Difference attributable to Freddie Mac common stock (0.74)% (0.86)% (0.70)% Net interest margin including Freddie Mac common stock 2.48% 2.18% 2.14% Net interest margin excluding Freddie Mac common stock Difference attributable to Freddie Mac common stock 0.21% (0.04)% (0.07)% Rate/Volume Analysis. The following table shows how changes in interest rates and changes in the volume of interest-earning assets and interest-bearing liabilities have affected our interest income and interest expense during the periods indicated. Information is provided in each category with respect to: interest income changes attributable to changes in volume (changes in volume multiplied by prior rate); interest income changes attributable to changes in rate (changes in rate multiplied by prior volume); and the net change. 76
80 Year Ended September 30, 2006 Compared to Year Ended September 30, 2005 Increase/(Decrease) Due to Year Ended September 30, 2005 Compared to Year Ended September 30, 2004 Increase/(Decrease) Due to Volume Rate Combined Net Volume Rate Combined Net (In thousands) Interest-earning assets: Interest-bearing deposits in other financial institutions $ 252 $ 86 $ 207 $ 545 $ 6 $ 34 $ 4 $ 44 FHLB common stock and other equity securities Mortgage-backed securities and collateralized mortgage obligations available for sale (2,242) 1,979 (266) (529) (441) 2,836 (87) 2,308 Other investment securities available for sale (108) 27 (6) (87) Loans receivable 2,844 2, ,638 1,490 1, ,675 Total interest-earning assets 1,336 5, ,890 1,034 4, ,080 Freddie Mac common stock(1) (44) 2,273 (5) 2,224 (44) 845 (5) 796 Total interestearning assets and Freddie Mac common stock 1,292 7, , , ,876 Interest-bearing liabilities: NOW accounts Savings accounts (3) (0) (0) (3) 1 (3) (0) (2) Money market deposit accounts , Certificates of Deposit 1,750 1, ,169 (196) 931 (47) 688 Total interestbearing deposits 2,056 2, ,834 (167) 1,482 (32) 1,283 Borrowed funds (1,758) 2,188 (245) , ,431 Total interest-bearing liabilities 298 5, , , ,714 Change in net interest income including Freddie Mac common stock $ 994 $2,212 $ (111) $3,095 $ 774 $ 444 $ (56) $1,162 (1) The rate/volume table shows the changes resulting from both rate and volume in the combined column in lieu of allocating this amount to the rate and volume columns. 77
81 Comparison of Financial Condition at September 30, 2006 and Our total assets increased $46.8 million, or 4.45%, to $1.10 billion at September 30, 2006, from $1.05 billion at September 30, The increase was primarily due to increases in the market value of Freddie Mac common stock and loans receivable. Total loans increased $17.8 million, or 4.90%, to $381.7 million at September 30, Real estate construction loans accounted for $11.5 million of the $17.8 million increase. Freddie Mac stock increased to $294.3 million at September 30, 2006 from $254.8 million the prior year as the price per share increased to $66.33 from $ The one-to-four family residential real estate portfolio decreased by $4.6 million, or 3.08%, to $143.9 million at September 30, The consumer and other loan portfolio increased $468,000 or 2.49% from September 30, 2005, to $19.3 million at September 30, Commercial real estate and other commercial loans increased by $10.4 million to $174.9 million during fiscal 2006, and real estate construction loans also increased by $11.5 million to $43.7 million during the year. Our mortgage-backed securities and collateralized mortgage obligations decreased from $358.5 million at September 30, 2005, to $308.1 million at September 30, 2006, a decrease of $50.3 million or 14.04%. The decrease was attributable to our determination not to reinvest cash flow from floating rate collateralized mortgage securities as the spread from borrowing costs was unfavorable. Total deposits increased from $320.1 million at September 30, 2005, to $372.1 million at September 30, Core deposits increased by $37.8 million while certificates of deposits increased $14.2 million with a $19.0 million decrease in wholesale deposits. While we are diligently working to gather core deposits, we will continue to rely on borrowings and brokered deposits, especially brokered deposits, Federal Home Loan Bank advances and repurchase agreements to fund the loan portfolio to the extent that loan growth exceeds deposit growth. The terms of new advances will be determined at the time of the advance based on interest rates, our interest risk profile, and other factors. Repurchase agreements are generally less than 45 days to maturity with rates at or slightly above LIBOR. Total borrowings decreased 11.61% from $382.3 million at September 30, 2005, to $337.9 million at September 30, Our total stockholders equity is comprised of realized equity and unrealized equity. Realized equity includes common stock, additional paid-in capital, treasury stock, unearned compensation, and retained earnings, while unrealized equity is comprised of accumulated other comprehensive income. Stockholders equity increased $24.5 million, or 10.06%, to $267.7 million at September 30, Realized equity increased by $1.4 million to $95.2 million at September 30, 2006, from $93.8 million at September 30, Accumulated other comprehensive income or, unrealized equity, is comprised of net unrealized holding gains on securities available for sale. Accumulated other comprehensive income increased by $23.1 million or 15.45%, to $172.5 million at September 30, 2006 due an increase in the Freddie Mac stock price. 78
82 As indicated in the tables below, total other comprehensive income for the year was $23.1 million compared to a loss of $31.0 million for the year ended September 30, The gain was primarily the result of the increase in the price of Freddie Mac common stock, which increased by $9.87 per share, resulting in an after-tax increase in our Freddie Mac common stock investment of $24.4 million. Other comprehensive income (loss) relating to mortgage securities and other investments increased by $1.3 million to a loss of $4.6 million from a loss of $3.3 million for the year ended September 30, For the Years Ended September 30, Freddie Mac: Number of shares 4,437,500 4,512,500 4,605,000 4,640,000 4,655,000 Market Price $ $ $ $ $ Market Value $294,339,375 $254,775,750 $300,430,200 $242,904,000 $260,214,500 Unrealized Gain Net of Tax $177,090,209 $152,710,919 $180,649,622 $145,283,854 $155,893,352 Other Comprehensive Gain (Loss) Related to Mortgage Securities and other Investments $ (1,294,963) $ (3,015,313) $ 1,052,778 $ (1,410,665) $ 1,112,500 Freddie Mac Common Stock $ 24,379,290 $ (27,938,704) $ 35,365,768 $ (10,609,498) $ (26,009,347) Total Other Comprehensive Income (Loss) $ 23,084,327 $ (30,954,017) $ 36,418,546 $ (12,020,163) $ (24,896,847) Comparison of Operating Results for Years Ended September 30, 2006 and General. Net income of $13.3 million for the year ended September 30, 2006 represents a $1.9 million increase from net income of $11.4 million for the year ended September 30, Net interest income increased by $3.2 million. We had a decrease of $140,000 in noninterest income and an increase of $2.9 million in noninterest expense. Our income tax expense was down $1.8 million as a result of the reversing of contingency items, primarily due to a change in strategic planning during the fourth quarter of There was no provision for loan losses during Ratio Analysis. Our return on equity can be measured in three ways. The first is the traditional return on total equity, or GAAP measure, which is net income divided by average total equity. The second is return on realized equity which is net income divided by realized equity (excluding unrealized gains on available for sale securities). The third is comprehensive return on equity which is comprehensive income divided by average total equity. We use all of these measures in evaluating our performance and setting goals. The following table shows these three measures. 79
83 Year Ended September 30, Return on total equity 5.18% 4.23% 3.23% 1.26% 0.93% Return on realized equity Difference attributable to unrealized equity 8.52% 8.14% 5.93% 2.20% 1.29% Return on total equity 5.18% 4.23% 3.23% 1.26% 0.93% Comprehensive return on equity (7.24) (3.64) (7.06) Difference attributable to unrealized equity and other comprehensive income (loss) 8.96% (11.47)% 14.34% (4.90)% (7.99)% Each of these measures has its strengths and weaknesses and is useful to investors by providing different perspectives. Return on total equity is the traditional measure. However, in our case, the total equity measure shows a low result because it includes the unrealized gains on Freddie Mac stock and other available for sale securities in equity (the denominator) but does not reflect unrealized gains and losses on Freddie Mac common stock and other available for sale securities in net income (the numerator). The return on realized equity measure excludes unrealized gains on Freddie Mac common stock and other available for sale securities from both net income and equity and thus does not reflect a significant portion of the economic value in the Company, while it does include gains on Freddie Mac stock and other available for sale securities that are realized through the sale of stock. The comprehensive return on equity reflects the overall increase or decrease in value as reflected by the stock price of Freddie Mac common stock and other available for sale securities. The return on assets measures shown below similarly reflect the effects of including or not including the significant unrealized gains and losses on the Freddie Mac common stock and other available for sale securities. Year Ended September 30, Return on total assets 1.22% 1.06% 0.79% 0.32% 0.29% Return on realized assets Difference attributable to unrealized assets (0.39)% (0.38)% (0.27)% (0.11)% (0.11)% Return on total assets 1.22% 1.06% 0.79% Comprehensive return on assets 3.34 (1.81) % (0.91) 0.29% (2.17) Difference attributable to other comprehensive income(loss) 2.12% (2.87)% 3.49% (1.23)% (2.46)% 80
84 Interest Income. Total interest and dividend income, including dividends on Freddie Mac common stock, was $53.8 million for 2006, a 20.39% increase over the total of $44.7 million for the year ended September 30, Dividend income on Freddie Mac common stock increased by $2.2 million to $8.4 million from $6.2 million due to the increase in quarterly dividends of Freddie Mac common stock from $0.35 per share to $0.47 per share. Total interest and dividend income, excluding Freddie Mac common stock, was $45.4 million for the year, a 17.88% increase over interest and dividend income, excluding Freddie Mac common stock, of $38.5 million for the year ended September 30, Interest on loans increased $5.6 million, or 27.16%, to $26.4 million. The average balance of loans receivable increased $46.2 million to $383.3 million for the year ended September 30, Interest on investment debt securities available for sale increased $973,000 to $1.4 million for the year from $401,000 for the prior year. Interest on mortgage-backed securities and collateralized mortgage obligations decreased by $529,000 to $16.1 million for the year from $16.7 million a year earlier. The decrease was due to lower volume as the yield on adjustable rate securities increased and higher yield rates provided higher yields on current year purchases. The yield on interest-earning assets excluding Freddie Mac common stock increased 75 basis points. Total interest-earning assets excluding Freddie Mac common stock averaged $774.9 million for the year, up from $754.8 million in the comparable 2005 period, a 2.66% increase. The average yield on loans increased 72 basis points to 6.88%, while the yield on mortgage-related securities increased from 4.33% for 2005 to 4.85% in Interest Expense. Total interest expense for the year was $27.8 million, a $6.0 million, or 27.63%, increase from The increase is attributable to a 73 basis point increase in the average cost of interestbearing liabilities and a $29.4 million increase in the average balance of interest-bearing liabilities from $662.7 million for the year ended September 30, 2005, to $692.1 million for the year ended September 30, The increase in average cost was primarily due to the 54 basis point increase in the cost of borrowed funds and a 122 basis point increase in the cost of interest bearing deposits as compared to the year ended September 30, Interest expense on deposits increased $5.8 million, or 96.15%, to $11.9 million for the year ended September 30, 2006, compared with $6.1 million for the prior year. Due to the increasing interest rate environment during this period the average cost of interest-bearing deposits increased 122 basis points. The average balance on deposits increased $74.6 million during 2006 also attributing to the increase in interest expense on deposits. Interest expense on certificate of deposit balances increased $4.2 million during the year ended September 30, 2006, compared with the year ended September 30, 2005, as the average balance of these accounts increased by $59.6 million and the cost increased 111 basis points. Interest expense on borrowed funds increased $185,000 as a result of the 54 basis point increase in the average cost of borrowed funds partially offset by a decrease in the average balance of borrowed funds by $45.2 million. The increase in the average cost was attributed to the rising interest rate environment, specifically in short term interest rates. 81
85 Net Interest Income. Net interest income including Freddie Mac common stock dividends for the year ended September 30, 2006 increased $3.2 million, or 13.88%, to $26.0 million. The net interest rate spread including Freddie Mac common stock increased 14 basis points to 1.10% for the year ended September 30, 2006, from 0.96% for the prior year. We believe that traditional bank measures such as net interest rate spread and net interest rate margin would improve if the market value of the Freddie Mac common stock and/or mortgage securities and borrowings became a smaller portion of our earning assets and we were able to invest in higher yielding assets. The average balance of the Freddie Mac common stock was $275.2 million for the year ended September 30, 2006, as compared to $296.5 million for the year ended September 30, The net interest margin, which is net interest income including dividends on Freddie Mac common stock divided by average total interest-earning assets, increased 30 basis points to 2.48% for the year ended September 30, Net interest income excluding the effects of Freddie Mac common stock increased $870,000, or 5.19%, to $17.6 million for the year ended September 30, 2006, compared with $16.8 million for the year ended September 30, The net interest rate spread excluding effects of Freddie Mac common stock, the difference between the average yield on average total interest-earning assets and the average cost of average total interest-bearing liabilities, increased by two basis points as the yield on interest-earning assets excluding Freddie Mac common stock increased at a less rate than the average cost of interest-bearing liabilities. The net interest margin, which is net interest income divided by average total interest-earning assets excluding Freddie Mac common stock, increased five basis points. Our net interest margin and net interest spread are low when compared to industry standards primarily due to two factors. First, under our wholesale investment strategy, our assets include a high proportion of securities with rates lower than those that would typically be earned on loans. Our liabilities include a high proportion of borrowings and wholesale deposits with higher costs than those typically paid on retail deposits. Generally each of these factors lowers our net interest margin and net interest spread. Our wholesale investment strategy has historically resulted in increases in net interest income and a more efficient use of our capital. Second, the dividend rate as compared to the market value of our Freddie Mac common stock is low. However, when compared to our cost basis in the investment, the dividend rate exceeds 100%. Provision for Loan Losses and Asset Quality. There was no provison for loan losses booked for the year ended September 30, 2006, while $75,000 was recorded for the year ended September 30, We had net charge-offs of $74,000 for the year ended September 30, 2006 compared to $538,000 for the year ended September 30,
86 Nonperforming loans are not accruing interest. The following table shows nonperforming loans, under-performing loans and nonperforming assets. September 30, 2006 September 30, 2005 (In thousands) Under-performing loans $ 392 $ 133 Total nonperforming loans $ 2,837 $ 4,075 Foreclosed real estate, net 460 1,120 Total nonperforming assets $ 3,297 $ 5,195 Nonperforming loans to total loans 0.74% 1.12% Nonperforming assets to total assets 0.30% 0.49% Nonperforming loans decreased from $4.1 million at September 30, 2006, to $2.8 million at September 30, Nonperforming loans as a percentage of total loans fell from 1.12% at September 30, 2005, to 0.74% at September 30, Approximately 98.7% of our nonaccrual loans had real estate as collateral at September 30, Under-performing loans are loans 90 days or more delinquent or 90 days past maturity date that are still accruing interest. Under-performing loans increased from $133,000 at September 30, 2005, to $392,000 at September 30, Under-performing loans at September 30, 2006, were primarily nonresidential loans with underlying collateral that indicate a very low risk of loss. The allowance for loan losses represents a reserve for probable loan losses in the loan portfolio. The adequacy of the allowance for loan losses is evaluated periodically based on a review of all significant loans with particular emphasis on impaired, non-accruing, past due and other loans that management believes require special attention. The determination of the allowance for loan losses is considered a critical accounting policy. When reviewing the allowance for loan losses, it is important to understand our lending strategy. The largest components of our loan portfolio are one-to-four family residential loans and commercial real estate loans. Economic downturns resulting in reduced capacity to repay and/or depreciated property values are the chief risks to this lending strategy. We have mitigated the risk associated with these types of borrowers through prudent loan to value ratios and regular monitoring of economic conditions. Additions to the allowance for loan losses are made periodically to maintain the allowance at an appropriate level based on management s analysis of loss inherent in the loan portfolio. The amount of the provision for loan losses is determined by an evaluation of the level of loans outstanding, loss risk as determined based on a loan grading system, the level of non-performing loans, historical loss experience, delinquency trends, the amount of losses charged to the allowance in a given period, and an assessment of economic conditions. Management considers the current allowance for loan losses to be adequate based on its analysis of the losses in the portfolio. 83
87 Our allowance for loan loss methodology is a loan classification-based system. We base the required reserve on a percentage of the loan balance for each type of loan and classification level. Doubtful, substandard and special mention loans are reserved at 50.0%, 15.0% and 5.0%, respectively. Loans may be classified manually and are automatically classified if they are not previously classified when they reach certain levels of delinquency. Unclassified loans are reserved at different percentages based on our perception of the inherent losses in the type of loan. The conforming one-to-four family loans in the portfolio are reserved at lower percentages than other loans. Reserve percentages are based on each individual lending program and its loss history and underwriting characteristics, including loan to value, credit score, debt coverage, collateral, and capacity to service debt. We have no loans for which there is known information about possible credit problems of borrowers that causes management to have serious doubts about their ability to comply with present loan repayment terms that are not currently disclosed as non-accrual, past due, underperforming or restructured. Noninterest Income. Noninterest income decreased 1.3% to $10.8 million for the year ended September 30, 2006 compared with $11.0 million in the prior year. We had $4.8 million in gain on the sale of Freddie Mac common stock during the year ended September 30, 2006, compared with a net gain of $6.1 million gain on the sale of Freddie Mac common stock for the prior year. This decrease was partially offset by a $266,000 increase in cash surrender value of bank owned life insurance and an increase of 36.75% or $1.0 million in fees on deposits. In 2005 and 2006, the gain on sale of loans has been lower as fewer borrowers have the capacity to reduce their interest rate through a refinance and mortgage interest rates have increased slightly. Future levels of gain on sale of loans will be dependent on interest rates. The increase in deposit fees reflects growth in core deposits and our focus on deposit fees. The following table shows the quarterly levels of deposit fees, core deposits and gain on sale of loans for the last four fiscal years. 84
88 (In thousands) Core Deposits (at Quarter End) Deposit Fees (for the Quarter) Gain on Sale of Loans (for the Quarter) September 30, 2006 $ 169,129 $ 1,031 $ 232 June 30, , March 31, , December 31, , September 30, , June 30, , March 31, , December 31, , September 30, , June 30, , March 31, , December 31, , September 30, , June 30, , March 31, , December 31, , The following table shows the yearly levels of gain on sale of loans, gain on sale of Freddie Mac common stock, and gain on sale of covered calls for the last five fiscal years. (In thousands) Gain on Sale of Loans Gain on Sale of Freddie Mac Stock Gain on Covered Calls September 30, 2006 $ 741 $ 4,769 $ 278 September 30, , September 30, ,152 2, September 30, , September 30, , Gain on sale of securities, including Freddie Mac common stock, was $4.8 million for the year ended September 30, 2006, compared to $6.1 million for the same period in 2005, a decrease of $1.3 million. There were no sales of mortgage securities during the 2006 fiscal year. The $6.1 million gain on sale of securities for fiscal 2005 was comprised of net gains of approximately $38,000 on mortgage securities and other investment securities and a net gain of $6.1 million on the sale of Freddie Mac common stock. Noninterest Expense. Total noninterest expense increased $2.8 million, or 15.66%, to $21.1 million for the year compared with $18.3 million for the prior year. The primary causes of the increase were due to increases in overall general and administrative expenses and occupancy expenses. Occupancy expenses increased $590,000, or 21.06%, for the year ended September 30, 2006, as compared to the same period in 2005 primarily due to service bureau expenses and increased building maintenance. We consolidated management and support 85
89 personnel into a new facility from five buildings. Salaries and employee benefits expense increased due to dividends on unallocated ESOP shares, granted but not vested stock options, and incentive compensation. Incentive compensation increased primarily due to higher attainment of targets and to a lesser extent the elimination of the deferral feature in the incentive compensation program. The elimination of the deferral feature accelerated a portion of this expense. The following table shows the yearly levels of compensation and benefits, occupancy, equipment, and professional services for the last five fiscal years. (In thousands) Salaries & Employee Benefits Occupancy Furniture and Equipment Legal and Professional September 30, 2006 $12,035 3, ,583 September 30, ,094 2, ,500 September 30, ,130 2, September 30, ,574 2, ,261 September 30, ,412 1, ,243 Income Taxes. Income taxes decreased from $4.1 million for the year ended September 30, 2005 to $2.4 million for the year ended September 30, The effective tax rate was 14.99% in 2006, and 26.51% in The decrease in income tax expense is due to the reversing of approximately $1,422,000 in contingency items that were thought to be exposure items in the prior year and not in the current year. The single largest contingency reserve was $800,000 for recapture of the tax bad debt reserve. In the fourth quarter the Company determined based on several factors that it was no longer appropriate to maintain this reserve. In both years, the dividends received deduction relating to 70% of the Freddie Mac cash dividends received has reduced federal income tax. Comparison of Financial Condition at September 30, 2005 and Our total assets decreased $17.6 million, or 1.68%, to $1.05 billion at September 30, 2005, from $1.07 billion at September 30, The decrease was primarily due to a $19.9 million decrease in the amount of mortgage backed securities and collateralized mortgage obligations and a decrease of 92,500 shares of Freddie Mac common stock owned. Total loans increased $40.4 million, or 12.47%, to $363.9 million at September 30, The one-to-four family residential real estate portfolio increased by $6.2 million, or 4.37%, to $148.5 million at September 30, The consumer and other loan portfolio decreased $792,000 or 4.04% from September 30, 2004, to $18.8 million at September 30, The decrease in the consumer portfolio was primarily the result of reductions in second mortgage loans due to refinancings. Commercial real estate and other commercial loans increased by $24.2 million to $164.5 million during fiscal 2005, and real estate construction loans also increased by $10.7 million to $32.2 million during the year. Our mortgage-backed securities and collateralized mortgage obligations decreased from $378.4 million at September 30, 2004, to $358.5 million at September 30, 2005, a decrease of $19.9 million or 5.26% which was attributable to our determination not to reinvest cash flow from floating rate collateralized mortgage securities as the spread from borrowing costs was unfavorable. The market value of Freddie Mac common stock decreased $45.6 million, or 15.20%, from $300.4 million at September 30, 2004, to $254.8 million at September 30,
90 Total deposits increased from $279.6 million at September 30, 2004, to $320.1 million at September 30, Core deposits increased by $2.0 million while certificates of deposits increased $38.5 million with $35.6 million of the increase being wholesale deposits. While we are diligently working to gather core deposits, we will continue to rely on borrowings and brokered deposits, especially brokered deposits, Federal Home Loan Bank advances and repurchase agreements to fund the securities portfolios and loans to the extent that loan growth exceeds deposit growth. The terms of new advances will be determined at the time of the advance based on interest rates, the Company s interest risk profile, and other factors. Repurchase agreements are generally less than 90 days to maturity with rates at or slightly above LIBOR. Total borrowings decreased 2.66% from $392.8 million at September 30, 2004, to $382.3 million at September 30, Our total stockholders equity is comprised of realized equity and unrealized equity. Realized equity includes common stock, additional paid-in capital, treasury stock, unearned compensation, and retained earnings, while unrealized equity is comprised of accumulated other comprehensive income. Stockholders equity decreased $29.3 million, or 10.74%, to $243.2 million at September 30, Realized equity increased by $1.7 million to $93.8 million at September 30, 2005, from $92.1 million at September 30, Accumulated other comprehensive income or, unrealized equity is comprised, of net unrealized holding gains on securities available for sale. Accumulated other comprehensive income decreased by $31.0 million or 17.16%, to $149.4 million at September 30, 2005 due to sales of Freddie Mac stock and a decrease in the Freddie Mac stock price. As indicated in the tables below, other comprehensive loss for the year was $31.0 million compared to a gain of $36.4 million for the year ended September 30, The loss was primarily the result of the decrease in the price of Freddie Mac common stock, which decreased by $8.78 per share, resulting in an after-tax decrease in our Freddie Mac common stock investment of $27.9 million. Other comprehensive income (loss) relating to mortgage securities and other investments decreased by $4.1 million to a loss of $3.0 million from a gain of $1.1 million for the year ended September 30,
91 For the Years Ended September 30, Freddie Mac: Number of shares 4,512,500 4,605,000 4,640,000 4,655,000 4,655,000 Market Price $ $ $ $ $ Market Value $254,775,750 $300,430,200 $242,904,000 $260,214,500 $ 302,575,000 Unrealized Gain Net of Tax $152,710,919 $180,649,622 $145,283,854 $155,893,352 $ 181,902,699 Other Comprehensive Gain(Loss) Related to Mortgage Securities and other Investments $ (3,015,313) $ 1,052,778 $ (1,410,665) $ 1,112,500 $ 9,696,208 Freddie Mac Common Stock $ (27,938,704) $ 35,365,768 $ (10,609,498) $ (26,009,347) $ 31,261,235 Total Other Comprehensive Income (Loss) $ (30,954,017) $ 36,418,546 $ (12,020,163) $ (24,896,847) $ 40,957,443 Comparison of Operating Results for Years Ended September 30, 2005 and General. Net income of $11.4 million for the year ended September 30, 2005 represents a $3.2 million increase from net income of $8.2 million for the year ended September 30, Net interest income increased by $1.2 million. We had an increase of $4.5 million in noninterest income and an increase of $1.1 million in noninterest expense. Our income tax expense was up $1.3 million as a result of our higher level of pretax income. The provision for loan losses was slightly higher at $75,000. Ratio Analysis. Our return on equity can be measured in three ways. The first is the traditional return on total equity, or GAAP measure, which is net income divided by average total equity. The second is return on realized equity which is net income divided by realized equity (excluding unrealized gains on available for sale securities). The third is comprehensive return on equity which is comprehensive income divided by average total equity. We use all of these measures in evaluating our performance and setting goals. The following table shows these three measures. Year Ended September 30, Return on total equity 4.23% 3.23% 1.26% 0.93% 1.94% Return on realized equity Difference attributable to unrealized equity 8.14% 5.93% 2.20% 1.29% 6.60% Return on total equity 4.23% 3.23% 1.26% 0.93% 1.94% Comprehensive return on equity (7.24) (3.64) (7.06) Difference attributable to unrealized equity and other comprehensive income(loss) (11.47)% 14.34% (4.90)% (7.99)% 16.71% 88
92 Each of these measures has its strengths and weaknesses and is useful to investors by providing different perspectives. Return on total equity is the traditional measure. However, in our case, the total equity measure shows a low result because it includes the unrealized gains on Freddie Mac stock and other available for sale securities in equity (the denominator) but does not reflect unrealized gains and losses on Freddie Mac common stock and other available for sale securities in net income (the numerator). The return on realized equity measure excludes unrealized gains on Freddie Mac common stock and other available for sale securities from both net income and equity and thus does not reflect a significant portion of the economic value in the Company, while it does include gains on Freddie Mac stock and other available for sale securities that are realized through the sale of stock. The comprehensive return on equity reflects the overall increase or decrease in value as reflected by the stock price of Freddie Mac common stock and other available for sale securities. The return on assets measures shown below similarly reflect the effects of including or not including the significant unrealized gains and losses on the Freddie Mac common stock and other available for sale securities. Year Ended September 30, Return on total assets 1.06% 0.79% 0.32% 0.29% 0.50% Return on realized assets Difference attributable to unrealized assets (0.38)% (0.27)% (0.11)% (0.11)% (0.25)% Return on total assets 1.06% 0.79% 0.32% 0.29% 0.50% Comprehensive return on assets (1.81) 4.28 (0.91) (2.17) 4.84 Difference attributable to other comprehensive income(loss) (2.87)% 3.49% (1.23)% (2.46)% 4.34% Interest Income. Total interest and dividend income, including dividends on Freddie Mac common stock, was $44.7 million for 2005, a 15.1% increase over the total of $38.8 million for the year ended September 30, Dividend income on Freddie Mac common stock increased by $797,000 to $6.2 million from $5.4 million due to the increase in quarterly dividends of Freddie Mac common stock from $0.30 per share to $0.35 per share. Total interest and dividend income, excluding Freddie Mac common stock, was $38.5 million for the year, a 15.18% increase over interest and dividend income, excluding Freddie Mac common stock, of $33.5 million for the year ended September 30, Interest on loans increased $2.7 million, or 14.8%, to $20.8 million. The average balance of loans receivable increased $25.6 million to $337.1 million for the year ended September 30, Interest on investment debt securities available for sale decreased $87,000 to $401,000 for the year from $489,000 for the prior year. Interest on mortgage-backed securities and collateralized mortgage obligations increased by $2.3 million to $16.7 million for the year from $14.4 million a year earlier. The increase was due to higher yields as the yield on adjustable rate securities increased and higher interest rates provided higher yields on current year purchases. The yield on interest-earning assets excluding Freddie Mac common stock increased 60 basis points. Total interest-earning assets excluding Freddie Mac common stock averaged $754.8 million for the year, up from $742.2 million in the comparable 2004 period, a 1.69% increase. The average yield on loans increased 36 basis points to 6.16%, while the yield on mortgage-related securities increased from 3.62% for 2004 to 4.33% in Interest Expense. Total interest expense for the year was $21.8 million, a $4.7 million, or 27.62%, increase from The increase is attributable to a 68 basis point increase in the average cost of interestbearing liabilities and a $7.8 million increase in the average balance of interest-bearing liabilities from $654.9 million for the year ended September 30, 2004, to $662.7 million for the year ended September 30, The increase in average cost was primarily due to the 76 basis point increase in the cost of borrowed 89
93 funds and a 53 basis point increase in the cost of deposits as compared to the year ended September 30, Interest expense on deposits increased $1.3 million, or 26.80%, to $6.1 million for the year ended September 30, 2005, compared with $4.8 million for the prior year. Due to the increasing interest rate environment during this period the average cost of interest-bearing deposits increased 53 basis points during Interest expense on Certificate of Deposit balances increased $688,000 during the year ended September 30, 2005, compared with the year ended September 30, 2004, as the average balance of these accounts decreased $8.3 million and the cost increased 57 basis points. Interest expense on borrowed funds increased $3.4 million as a result of the 76 basis point increase in the average cost of borrowed funds and an increase in the average balance of borrowed funds by $12.2 million. The increase in the average cost was attributed to the rising interest rate environment, specifically in short term interest rates. Net Interest Income. Net interest income including Freddie Mac common stock dividends for the year ended September 30, 2005 increased $1.2 million, or 5.34%, to $22.9 million. The net interest rate spread including Freddie Mac common stock decreased 24 basis points to 0.96% for the year ended September 30, 2005, from 1.20% for the prior year. Traditional bank measures such as net interest rate spread and net interest rate margin would improve if the market value of the Freddie Mac common stock and/or mortgage securities and borrowings became a smaller portion of our earning assets. The average balance of the Freddie Mac common stock was $296.5 million for the year ended September 30, 2005, as compared to $276.0 million for the year ended September 30, The net interest margin, which is net interest income including dividends on Freddie Mac common stock divided by average total interest-earning assets, increased 4 basis points to 2.18% for the year ended September 30, Net interest income excluding the effects of Freddie Mac common stock increased $366,000, or 2.23%, to $16.8 million for the year ended September 30, 2005, compared with $16.4 million for the year ended September 30, The net interest rate spread excluding effects of Freddie Mac common stock, the difference between the average yield on average total interest-earning assets and the average cost of average total interest-bearing liabilities, decreased by eight basis points as the yield on interest-earning assets excluding Freddie Mac common stock increased at a lower rate than the average cost of interestbearing liabilities. The net interest margin, which is net interest income divided by average total interestearning assets excluding Freddie Mac common stock, increased one basis point. Our net interest margin and net interest spread are low when compared to industry standards primarily due to two factors. First, under our wholesale investment strategy, our assets include a high proportion of securities with rates lower than those that would typically be earned on loans. Our liabilities include a high proportion of borrowings and wholesale deposits with higher costs than those typically paid on retail deposits. Each of these factors lowers our net interest margin and net interest spread. Our wholesale investment strategy has historically resulted in increases in net interest income and a more efficient use of our capital. Second, the dividend rate as compared to the market value of our Freddie Mac common stock is low. However, when compared to our cost basis in the investment, the dividend rate exceeds 100%. Provision for Loan Losses and Asset Quality. The provision for loan losses was $75,000 for the year ended September 30, 2005, while $30,000 was recorded for the year ended September 30, The CharterBank had net charge-offs of $537,000 for the year ended September 30, 2005 compared to $187,000 for the year ended September 30, The difference in the provision and net charge-offs for the year ended September 30, 2005, is due in part to the fact that the CharterBank had $464,863 of the net chargeoffs related to loans acquired in the Citizen National Bank and Eagle Bank acquisitions while net chargeoffs of $72,419 were originated by CharterBank. The following table further illustrates the relationship between our charge-offs and charge-offs of loans acquired in purchase business combinations. Nonperforming loans are not accruing interest. The following table shows nonperforming loans, under-performing loans and nonperforming assets. 90
94 September 30, 2005 September 30, 2004 (In thousands) Under-performing loans $ 133 $ 195 Total nonperforming loans $ 4,075 $ 5,865 Foreclosed real estate, net 1, Total nonperforming assets $ 5,195 $ 6,318 Nonperforming loans to total loans 1.12% 1.81% Nonperforming assets to total assets 0.49% 0.59% Nonperforming loans decreased from $5.9 million at September 30, 2004, to $4.1 million at September 30, Nonperforming loans acquired in the Eagle Bank acquisition made up $626,000 of these loans at September 30, Nonperforming loans as a percentage of total loans fell from 1.81% at September 30, 2004, to 1.12% at September 30, Approximately 97% of our nonaccrual loans had real estate as collateral at September 30, Under-performing loans are loans 90 days or more delinquent or 90 days past maturity date that are still accruing interest. Under-performing loans decreased from $195,000 at September 30, 2004, to $133,000 at September 30, Under-performing loans at September 30, 2005, were primarily nonresidential loans with underlying collateral that indicate a very low risk of loss. The allowance for loan losses represents a reserve for probable loan losses in the loan portfolio. The adequacy of the allowance for loan losses is evaluated periodically based on a review of all significant loans with particular emphasis on impaired, non-accruing, past due and other loans that management believes require special attention. The determination of the allowance for loan losses is considered a critical accounting policy. When reviewing the allowance for loan losses, it is important to understand the Company s lending strategy. The largest components of our loan portfolio are one-to-four family residential loans and commercial real estate loans. Economic downturns resulting in reduced capacity to repay and/or depreciated property values are the chief risks to this lending strategy. The Company has mitigated the risk associated with these types of borrowers through prudent loan to value ratios and regular monitoring of economic conditions. Additions to the allowance for loan losses are made periodically to maintain the allowance at an appropriate level based on management s analysis of loss inherent in the loan portfolio. The amount of the provision for loan losses is determined by an evaluation of the level of loans outstanding, loss risk as determined based on a loan grading system, the level of non-performing loans, historical loss experience, delinquency trends, the amount of losses charged to the allowance in a given period, and an assessment of economic conditions. Management considers the current allowance for loan losses to be adequate based on its analysis of the losses in the portfolio. Our allowance for loan loss methodology is a loan classification-based system. We base the required reserve on a percentage of the loan balance for each type of loan and classification level. Doubtful, substandard and special mention loans are reserved at 50.0%, 15.0% and 5.0%, respectively. Loans may be classified manually and are automatically classified if they are not previously classified when they reach certain levels of delinquency. Unclassified loans are reserved at different percentages based on our perception of the inherent losses in the type of loan. The conforming one-to-four family loans in the portfolio are reserved at lower percentages than other loans. Reserve percentages are based on each individual lending program and its loss history and underwriting characteristics, including loan to value, credit score, debt coverage, collateral, and capacity to service debt. We have no loans, for which there is known information about possible credit problems of borrowers that causes management to have serious doubts about their ability to comply with present loan repayment terms that are not currently disclosed as non-accrual, past due, underperforming or restructured. 91
95 Noninterest Income. Noninterest income increased 68.5% to $11.0 million for the year ended September 30, 2005 compared with $6.5 million in the prior year. We had $6.1 million in gain on the sale of Freddie Mac common stock during the year ended September 30, 2005, compared with a net gain of $2.1 million gain on the sale of Freddie Mac common stock for the prior year. Other factors included a decrease of $268,000 in the gain on loans sold and an increase of 6.9% or $177,000 in fees on deposits. The gain on sale of loans peaked in fiscal 2003 with record levels of one-to-four family originations. In 2004 and 2005, the gain on sale of loans has been lower as fewer borrowers have the capacity to reduce their interest rate through a refinance and mortgage interest rates have increased slightly. Future levels of gain on sale of loans will be dependent on interest rates. The increase in deposit fees reflects growth in core deposits and the Company s focus on deposit fees. The following table shows the quarterly levels of deposit fees, core deposits and gain on sale of loans for the last four fiscal years. (In thousands) Core Deposits (at Quarter End) Deposit Fees (for the Quarter) Gain on Sale of Loans (for the Quarter) September 30, 2005 $ 131,001 $ 745 $ 254 June 30, , March 31, , December 31, , September 30, , June 30, , March 31, , December 31, , September 30, , June 30, , March 31, , December 31, , September 30, , June 30, , March 31, , December 31, , The following table shows the yearly levels of gain on sale of loans, gain on sale of Freddie Mac common stock, and gain on sale of covered calls for the last five fiscal years. (In thousands) Gain on Sale of Loans Gain on Sale of Freddie Mac Stock Gain on Covered Calls September 30, 2005 $ 884 $ 6,085 $ 525 September 30, ,152 2, September 30, , September 30, , September 30, ,
96 Gain on sale of securities, including Freddie Mac common stock, was $6.1 million for the year ended September 30, 2005, compared to $2.1 million for the same period in 2004, an increase of $4.0 million. The $6.1 million gain on sale of securities was comprised of net gains of approximately $38,000 on mortgage securities and other investment securities, and a net gain of $6.1 million on the sale of Freddie Mac common stock. Noninterest Expense. Total noninterest expense increased $1.1 million, or 6.49%, to $18.3 million for the year compared with $17.2 million for the prior year. The primary causes of the increase were due to increases in professional services and overall general and administrative expenses. Occupancy and equipment expenses increased $566,000, or 18.9%, for the year ended September 30, 2005, as compared to the same period in 2004 primarily due to service bureau expenses and increased building maintenance. We consolidated management and support personnel into a new facility from five buildings. Legal and professional expenses increased $613,000 due primarily to the requirements of Sarbanes Oxley Section 404. Compensation and benefits expense was down slightly as expense related to restricted stock and incentive compensation was down. The following table shows the yearly levels of compensation and benefits, occupancy, equipment, and professional services for the last five fiscal years. (In thousands) Salaries & Employee Benefits Occupancy Furniture and Equipment Legal and Professional September 30, 2005 $10,094 2, ,500 September 30, ,130 2, September 30, ,574 2, ,261 September 30, ,412 1, ,243 September 30, ,245 1, Income Taxes. Income taxes increased from $2.9 million for the year ended September 30, 2004 to $4.1 million for the year ended September 30, The effective tax rate was 26.51% in 2005, and 25.75% in In both years, the dividends received deduction relating to 70% of the Freddie Mac cash dividends received has reduced federal income tax. Liquidity and Capital Resources Commitments. We had commitments to fund loans at September 30, 2006, of approximately $49.4 million which is composed of unused consumer credit lines of approximately $12.1 million, unused commercial credit lines of approximately $11.6 million, unfunded construction loans of approximately $19.7 million, mortgage loans of approximately $1.4 million, and nonresidential and consumer loans of approximately $4.6 million. Fixed rate conforming one-to-four family loans are generally sold on a best efforts basis so we have no binding commitments on these loans. CharterBank is party to lines of credit with off-balance sheet risk in the normal course of business to meet the financing needs of its customers. Lines of credit are unfunded commitments to extend credit. These instruments involve, in varying degrees, exposure to credit and interest rate risk in excess of the amounts recognized in the financial statements. CharterBank s exposure to credit loss in the event of nonperformance by the other party to the financial instrument for unfunded commitments to extend credit and letters of credit is represented by the contractual amount of those instruments. The Bank follows the same credit policies in making commitments and conditional obligations as it does for on-balance sheet instruments. Our commitments are funded through internal funding sources of scheduled repayments of loans and sales and maturities of investment securities available for sale or external funding sources through acceptance of deposits from customers or borrowings from other financial institutions. The following table is a summary of our commitments to extend credit, commitments under contractual leases as well as our contractual obligations, consisting of deposits, Federal Home Loan Bank advances and borrowed funds by contractual maturity date for the next five years. 93
97 Due in 1 Year Commitments and Contractual Obligations Due in Due in Due in 2 Years 3 Years 4 Years Due in 5 Years Loan commitments to originate mortgage loans $ 1,364,050 $ $ $ $ Loan commitments to fund construction loans in process 19,733,390 Loan commitments to originate nonresidential mortgage loans 4,577,200 Loan commitments to originate consumer loans 40,000 Available home equity and unadvanced lines of credit 23,672,137 Letters of credit 1,367,509 Lease agreements 78,224 52,464 Deposits 343,361,390 12,500,784 9,063,382 5,531,858 1,170,582 Securities sold under agreements to repurchase 25,928,000 FHLB advances 75,000,000 50,000,000 35,000, ,000,000 Total commitments and contractual obligations $495,121,900 $62,553,248 $9,063,382 $40,531,858 $ 103,170,582 Management regularly monitors the balance of outstanding commitments to fund loans to ensure funding availability should the need arise. Management believes that the risk of all customers fully drawing on all these lines of credit at the same time is remote. Derivative Instruments. We did not have any commitments to originate loans held for sale at September 30, In prior periods these commitments were accounted for at fair value. The commitments to sell loans are best effort, forward sale agreements, and not mandatory forward sale commitments. The best effort agreements are not derivative instruments and, therefore, are not accounted for as derivatives. The interest rate caps and floors in our adjustable rate loans are clearly and closely related to the interest rate on the loan and, therefore, the floors and caps are not accounted for separately from the loan as a derivative instrument. See page 58 for a discussion of our covered call program. Liquidity. The term liquidity refers to our ability to generate adequate amounts of cash to fund loan originations, loan purchases, deposit withdrawals and operating expenses. The OTS requires that CharterBank maintain a sufficient amount of liquid assets to maintain its safe and sound operation. Our primary sources of liquidity are deposits, borrowings, scheduled amortization and prepayments of loan principal and mortgage related securities, maturities and calls of investment securities and funds provided by our operations. We can borrow funds from the FHLB based on eligible collateral of loans and securities up to a limit of 40% of CharterBank s assets. At September 30, 2006 and 2005, our maximum borrowing capacity from the FHLB was approximately $388.1 million and $375.6 million, respectively. At September 30, 2006 and 2005, we had outstanding borrowings of $312.0 million and $287.0 million, respectively, with unused borrowing capacity of $76.1 million and $88.6 million, respectively. In addition, we may enter into reverse repurchase agreements with approved broker-dealers. Reverse repurchase agreements are agreements that allow us to borrow money using our securities as collateral. We can obtain funds in the brokered deposit markets. See page 33 for a distribution of our deposit accounts over the last three years, including presentation of historical reliance on brokered deposits. 94
98 We can also obtain funds using our Freddie Mac common stock as collateral and have established a line of credit that provides for borrowing up to half of the market value of the stock. We consider this source of funds a last resort due to the potential adverse tax consequences on the dividends received deduction that exempts 70% of our Freddie Mac dividends from taxable income. CharterBank has relied on wholesale fundings, including advances from the Federal Home Loan Bank, repurchase agreements and brokered deposits, to fund loans and purchase securities in the past two fiscal years. CharterBank monitors its liquidity position frequently and anticipates that we will have sufficient funds to meet our current funding commitments. At September 30, 2006, repurchase agreements totaled $25.9 million, a $69.4 million decrease from the amount outstanding at September 30, 2005, of $95.3 million. Wholesale deposits were $50.7 million at September 30, 2006, as compared to $69.8 million at September 30, Loan repayment and maturing investment securities are a relatively predictable source of funds. However, deposit flows, calls of investment securities and prepayments of loans and mortgage-backed securities are strongly influenced by interest rates, general and local economic conditions and competition in the marketplace. These factors reduce the predictability of the timing of these sources of funds. Principal repayments on mortgage related securities totaled $77.2 million for the twelve months ended September 30, Ongoing levels of cash flow will depend on the level of mortgage rates and possible mortgage refinancing. Our primary investing activities are the origination of commercial real estate, one-to four-family real estate, commercial, and consumer loans, and the purchase of mortgage and investment securities. During the year ended September 30, 2006, we originated approximately $153.1 million in total loans. Residential mortgage loans accounted for 37.4% of the originations, construction loans for 18.4% of the originations, commercial and commercial real estate loans for 39.1% of the originations, and consumer loans for 5.1% of the originations during the year ended September 30, Of the $57.3 million in residential loans originated, $23.2 million were sold to investors. During the year ended September 30, 2005, we originated loans of approximately $161.2 million. In the year ended September 30, 2005, with the 1-4 family refinance boom residential mortgage loans accounted for 43.8% of total loan originations for fiscal Commercial real estate loans accounted for 35.2% of total originations for fiscal Purchases of mortgage-backed securities, collateralized mortgage obligations, and other investment securities totaled $54.7 million for the year ended September 30, 2006, and $136.8 million for the year ended September 30, CharterBank has relied on wholesale fundings including advances from the Federal Home Loan Bank, repurchase agreements and brokered deposits to purchase securities and fund loans. Deposit flows are affected by the level of interest rates, by the interest rates and products offered by competitors, and by other factors. Total deposits were $372.1 million at September 30, 2006, as compared to $320.1 million at September 30, Time deposit accounts scheduled to mature within one year were $174.2 million and $136.2 million at September 30, 2006 and 2005, respectively. While CharterBank has experienced Certificates of Deposit run-off, we anticipate that a significant portion of these Certificates of Deposit will remain on deposit. CharterBank continues to target growth of transaction-based deposit accounts to lower its overall cost of funds, provide deposit fees, and provide cross-sell opportunities. Capital expenditures of $5.5 million during the twelve months ended September 30, 2006, included approximately $4.6 million for branch expansions. We anticipate that capital expenditures for acquisition of branch sites, construction, and expansion will total $1.5 million for fiscal Except for these expenditures and any changes in our intentions to repurchase shares as outlined in Capital and Capital Management, we do not anticipate any other material capital expenditures during fiscal year We do not have any balloon or other payments due on any long-term obligations or any off-balance sheet items, other than the commitments and unused lines of credit noted above. Off-Balance Sheet Arrangements. We do not have any off-balance sheet arrangements that have or are reasonably likely to have a current or future effect on our financial condition, revenues or expenses, results of operations, liquidity, capital expenditures or capital resources that are material to investors. 95
99 Recent Accounting Pronouncements In December 2004, the Financial Accounting Standards Board ( FASB ) issued SFAS No. 123(R) (revised 2004), Share-Based Payment. This Statement is a revision of SFAS No. 123, Accounting for Stock-Based Compensation, and supersedes APB Opinion No. 25, Accounting for Stock Issued to Employees, and its related implementation guidance. SFAS No. 123(R) established standards for the accounting for transactions in which an entity exchanges its equity instruments for goods or services. This Statement requires that the cost resulting from all share-based payment transactions be recognized in the financial statements. This Statement establishes grant date fair value as the measurement objective in accounting for share-based payment arrangements and requires all entities to apply a fair-value-based measurement method in accounting for share-based payment transactions with employees, except for equity instruments held by employee stock ownership plans. The Company adopted SFAS No. 123(R) effective October 1, 2005, resulting in additional compensation expense of $221,279 for the year ended September 30, In March 2005, the SEC released Staff Accounting Bulletin ( SAB ) No. 107, Share-Based Payment. SAB No. 107 expresses views of the SEC staff regarding the application of SFAS No. 123(R). Among other things, SAB No. 107 provides interpretive guidance related to the interaction between SFAS No. 123(R) and certain SEC rules and regulations and provides the staff s view regarding the valuation of share-based payment arrangements for public companies. SAB No. 107 has been considered by the Company in its adoption of SFAS No. 123(R). In May 2005, the FASB issued SFAS No. 154, Accounting Changes and Error Corrections. This statement replaces APB Opinion No. 20, Accounting Changes, and SFAS No. 3, Reporting Accounting Changes in Interim Financial Statements. SFAS No. 154 changes the requirements for the accounting for and reporting of a voluntary change in accounting principle. SFAS No. 154 requires retrospective application to prior periods financial statements of changes in accounting principles or error corrections, unless it is impractical to determine the period-specific effects or when a pronouncement includes specific transition provisions. This statement is effective for accounting changes and corrections of error made in fiscal years beginning after December 15, The Company does not expect the adoption of SFAS No. 154 (revised 2004) to have a material impact on its financial condition or results of operation. FASB Staff Position No. FAS and FAS 124-1, The Meaning of Other-Than-Temporary Impairment and Its Application to Certain Investments (the FSP ), was issued on November 3, 2005 and addresses the determination of when an investment is considered impaired; whether the impairment is other than temporary; and how to measure an impairment loss. The FSP also addresses accounting considerations subsequent to the recognition of an other-than-temporary impairment on a debt security, and requires certain disclosures about unrealized losses that have not been recognized as other-than-temporary impairments. The FSP replaces the impairment guidance in EITF Issue No with references to existing authoritative literature concerning other-than-temporary determinations SFAS No. 115 and SEC Staff Accounting Bulletin 59). Under the FSP, impairment losses must be recognized in earnings equal to the entire difference between the security s cost and its fair value at the financial statement date, without considering partial recoveries subsequent to that date. The FSP also requires that an investor recognize an other-than-temporary impairment loss when a decision to sell a security has been made and the investor does not expect the fair value of the security to fully recover prior to the expected time of sale. The FSP is effective for reporting periods beginning after December 15, The application of the FSP did not have a material impact on the Company s financial condition or results of operations. In February 2006, the FASB issued SFAS No. 155, Accounting for Certain Hybrid Financial Instruments-an amendment of FASB statements No. 133 and 140. This statement permits fair value remeasurement of certain hybrid financial instruments, clarifies the scope of SFAS No. 133, Accounting for Derivative Instruments and Hedging Activities regarding interest-only and principal-only strips, and provides further guidance on certain issues regarding beneficial interests in securitized financial assets, concentrations of credit risk and qualifying special purpose entities. SFAS No. 155 is effective as of the beginning of the first fiscal year that begins after September 15, The application of SFAS No. 155 is not expected to have an impact on the Company s financial condition or results of operations. 96
100 In March 2006, the FASB issued SFAS No. 156, Accounting for Servicing of Financial Assets-an amendment of FASB Statement No This statement requires that an entity recognize a servicing asset or servicing liability each time it undertakes an obligation to service a financial asset, and that the servicing assets and servicing liabilities be initially measured at fair value. The statement also permits an entity to choose a subsequent measurement method for each class of separately recognized servicing assets and servicing liabilities. SFAS No. 156 is effective as of the beginning of the first fiscal year that begins after September 15, The application of SFAS No. 156 is not expected to have a material impact on the Company s financial condition or results of operations. In July 2006, the FASB issued Interpretation No. 48, Accounting for Uncertainty in Income Taxes, an interpretation of FASB Statement No This interpretation clarifies the accounting for uncertainty in income taxes recognized in an enterprise s financial statements in accordance with FASB Statement No. 109, Accounting for Income Taxes. The interpretation prescribes a recognition threshold and measurement attribute for the financial statement recognition and measurement of a tax position taken or expected to be taken in a tax return. The interpretation also provides guidance on derecognition, classification, interest and penalties, accounting in interim periods, disclosure and transition. FASB Interpretation No. 48 is effective for fiscal years beginning after December 31, The application of FASB Interpretation No. 48 is not expected to have a material impact on the Company s financial condition or results of operations. On September 15, 2006, the FASB issued SFAS No. 157, Fair Value Measurements, which provides for enhanced guidance for using fair value to measure assets and liabilities. SFAS No. 157 defines fair value, establishes a framework for measuring fair value in generally accepted accounting principles, and expands disclosures about fair value measurements. SFAS No. 157 is applicable under other accounting pronouncements that either require or permit fair value measurements and does not require any new fair value measurements. SFAS No. 157 is effective for financial statements issued for fiscal years beginning after November 15, 2007, and interim periods within those fiscal years. The Company has not yet evaluated the impact of the implementation of SFAS No On September 20, 2006, the FASB ratified EITF Issue 06-4, Accounting for Deferred Compensation and Postretirement Benefit Aspects of Endorsement Split-Dollar Life Insurance Arrangements. EITF Issue 06-4 addresses accounting for split-dollar life insurance arrangements after the employer purchases a life insurance policy on the covered employee. This Issue states that an obligation arises as a result of a substantive agreement with an employee to provide future postretirement benefits. Under Issue EITF 06-4, the obligation is not settled upon entering into an insurance arrangement. Since the obligation is not settled, a liability should be recognized in accordance with applicable authoritative guidance. Issue EITF 06-4 is effective for fiscal years beginning after December 15, The Company has not yet evaluated the impact of the implementation of EITF Issue On September 20, 2006, the FASB ratified EITF Issue 06-5, Accounting for Purchases of Life Insurance Determining the Amount That Could Be Realized in Accordance with FASB Technical Bulletin ( FTB ) No. 85-4, Accounting for Purchases of Life Insurance. This Issue addresses how an entity should determine the amount that could be realized under the insurance contract at the balance sheet date in applying FTB 85-4 and if the determination should be on an individual or group policy basis. EITF Issue 06-5 is effective for fiscal years beginning after December 15, The adoption of EITF Issue 06-5 is not expected to have a material effect on the Company s financial statements. In September 2006, the SEC issued SAB No. 108, Considering the Effects of Prior Year Misstatements when Quantifying Misstatements in Current Year Financial Statements. SAB 108 provides interpretive guidance on how the effects of prior-year uncorrected misstatements should be considered when quantifying misstatements in the current year financial statements. SAB 108 requires registrants to quantify misstatements using both an income statement and balance sheet approach and evaluate whether either approach results in a misstatement that, when all relevant quantitative and qualitative factors are considered, is material. If prior year errors that had been previously considered immaterial now are considered material based on either approach, no restatement is required so long as management properly applied its previous approach and all relevant facts and circumstances were considered. If prior years are not restated, the cumulative effect adjustment is recorded in opening accumulated earnings as of the 97
101 beginning of the fiscal year of adoption. SAB 108 is effective for fiscal years ending on or after November 15, 2006, with earlier adoption encouraged. The Company has not yet evaluated the impact of the implementation of SFAS No Impact of Inflation and Changing Prices. The consolidated financial statements and accompanying notes of the Company have been prepared in accordance with accounting principles generally accepted in the United States of America ( GAAP ). GAAP generally requires the measurement of financial position and operating results in terms of historical dollars without consideration for changes in the relative purchasing power of money over time due to inflation. The impact of inflation is reflected in the increased cost of our operations. Unlike industrial companies, our assets and liabilities are primarily monetary in nature. As a result, changes in market interest rates have a greater impact on performance than do the effects of inflation. ITEM 7A. QUANTITATIVE AND QUALITATIVE DISCLOSURES ABOUT MARKET RISK See Item 7, Management s Discussion and Analysis of Financial Condition and Results of Operations, pages 63 to 72, for a discussion of Quantitative and Qualitative Disclosures about Market Risk. The interest rate sensitivity analysis or the market value of portfolio equity for various changes in interest rate analysis calculated as of September 30, 2006 indicates a loss of market value of portfolio equity for a significant increase or decrease in interest rates. ITEM 8. FINANCIAL STATEMENTS AND SUPPLEMENTARY DATA See pages F-1 through F-49 following the signature page of this Annual Report. ITEM 9. CHANGES IN AND DISAGREEMENTS WITH ACCOUNTANTS ON ACCOUNTING AND FINANCIAL DISCLOSURE. None. ITEM 9A. CONTROLS AND PROCEDURES Management, including the Company s President and Chief Executive Officer and Chief Financial Officer, Treasurer and Senior Vice President, has evaluated the effectiveness of the Company s disclosure controls and procedures (as defined in Exchange Act Rules 13a-15(e) and 15d-15(e)) as of the end of the period covered by this report. Based upon that evaluation, the Company s President and Chief Executive Officer and Chief Financial Officer, Treasurer and Vice President concluded that the disclosure controls and procedures were effective to ensure that information required to be disclosed in the reports the Company files under the Exchange Act is (i)recorded, processed, summarized and reported as and when required and (ii) accumulated and communicated to our management, including our principal executive officer and principal financial officer, as appropriate to allow timely decisions regarding disclosure. There have been no changes in the Company s internal control over financial reporting identified in connection with the evaluation that occurred during the Company s last fiscal quarter that has materially affected, or that is reasonably likely to materially affect, the Company s internal control over financial reporting. Management s Report on Internal Control Over Financial Reporting Management is responsible for establishing and maintaining adequate internal control over financial reporting, as such term is defined in Rule 13a-15(f) under the Securities Exchange Act of Management, including the principal executive officer and principal financial officer, has assessed the effectiveness of the Company s internal control over financial reporting as of September 30, In making this assessment, management used the criteria set forth by the Committee of Sponsoring Organizations of the Treadway Commission in Internal Control- Integrated Framework. Based on such assessment, management believes that, as of September 30, 2006, the Company s internal control over financial reporting is effective based upon those criteria. 98
102 KPMG LLP, an independent registered public accounting firm, has audited the consolidated financial statements included in this Annual Report and has issued an attestation report on management s assessment of the effectiveness of the Company s internal control over financial reporting. Their reports appear on the pages F1 and F2. ITEM 9B. OTHER INFORMATION None. PART III ITEM 10. DIRECTORS, EXECUTIVE OFFICERS AND CORPORATE GOVERNANCE The information included in the Company s Proxy Statement for the 2007 Annual Meeting of Stockholders to be filed within 120 days after the Company s fiscal year end (the Proxy Statement ) under the captions: Election of Directors, Nominees and Continuing Directors, Executive Officers who are not Directors, Code of Ethics, and Section 16(a) Beneficial Ownership Reporting Compliance is incorporated herein by reference. ITEM 11. EXECUTIVE COMPENSATION The information included in the Proxy Statement under the captions: Compensation Committee Report on Executive Compensation, Compensation Committee Interlocks and Insider Participation, Performance Graph, Change of Control Agreements, Director Compensation, Executive Compensation, Employment Agreements, and Benefit Plans is incorporated herein by reference. 99
103 ITEM 12. SECURITY OWNERSHIP OF CERTAIN BENEFICIAL OWNERS AND MANAGEMENT AND RELATED STOCKHOLDER MATTERS The information included in the Proxy Statement under the captions: Security Ownership of Certain Beneficial Owners and Management-Principal Shareholders of Charter Financial Corporation, and Security Ownership of Management is incorporated herein by reference. The following table sets forth the aggregate information regarding our equity compensation plans in effect as of September 30, Plan category Number of securities to be issued upon exercise or vesting of outstanding options, warrants and rights Weighted-average exercise price of outstanding options, warrants and rights Number of securities remaining available for future issuance under equity compensation plans (excluding securities reflected in column (a)) (a) (b) (c) Equity compensation plans approved by security holders: Options 258,300 $ ,343 Restricted stock 107,346 N/A 67,489 Equity compensation plans not approved by security holders Total 365,646 N/A 488,832 ITEM 13. CERTAIN RELATIONSHIPS AND RELATED TRANSACTIONS, AND DIRECTOR INDEPENDENCE The information included in the Proxy Statement under the caption: Information about the Board of Directors and Management Transactions with Certain Related Persons is incorporated herein by reference. 100
104 ITEM 14. PRINCIPAL ACCOUNTANT FEES AND SERVICES The information included in the Proxy Statement under the caption: Principal Accountant Fees and Services is incorporated herein by reference. PART IV ITEM 15. EXHIBITS, FINANCIAL STATEMENT SCHEDULES Listed below are all financial statements and exhibits filed as part of this report: a. Financial Statements, Schedules, and Exhibits (1) The consolidated balance sheets of Charter Financial Corporation and its subsidiaries as of September 30, 2006 and 2005 and the related consolidated statements of income, stockholders equity and comprehensive income (loss), and cash flows for each of the years in the three-year period ended September 30, 2006, together with the related notes and report of KPMG LLP, independent registered public accounting firm. (2) Schedules omitted as they are not applicable. (3) See Exhibit Index. b. Exhibits Exhibit Description 2.1 CharterBank Amended Plan of Reorganization from Mutual Savings Bank to Mutual Holding Company and Stock Issuance (1) 2.2 Business Combination Agreement, dated September 10, 2002 by and among Charter Financial Corporation, CharterBank and EBA Bancshares, Inc. (2) 3.1 Federal Stock Charter of Charter Financial Corporation (1) 3.2 Bylaws of Charter Financial Corporation (1) 4.1 Federal Stock Charter of Charter Financial Corporation (See Exhibit 3.1) (1) 4.2 Bylaws of Charter Financial Corporation (See Exhibit 3.2) (1) 4.3 Form of Stock Certificate of Charter Financial Corporation (1) 10.1 Form of Employee Stock Ownership Plan of Charter Financial Corporation (6) 10.2 Form of Benefit Restoration Plan of Charter Financial Corporation (7) 10.3 Form of Employment Agreement by and among Robert L. Johnson and Charter Financial Corporation (1) 101
105 10.4 Form of One Year Change in Control Agreement by and among certain officers, Charter Financial Corporation and CharterBank (1) 10.5 Form of Two Year Change in Control Agreement by and among certain officers, Charter Financial Corporation and CharterBank (1) 10.6 CharterBank 401(k) Plan and Adoption Agreement (3) 10.7 Charter Financial Corporation 2001 Stock Option Plan (4) 10.8 Charter Financial Corporation 2001 Recognition and Retention Plan (4) 14.0 Conflict of Interest Policy and Code of Ethics (5) 21.1 Subsidiaries of the Registrant 23.1 Consent of KPMG LLP 31.1 Rule 13a-14(a)/15d-14(a) Certifications Section 1350 Certifications. (1) Incorporated herein by reference to the Registration Statement No , on Form S-1 of Charter Financial filed with the SEC on March 27, 2001, as amended. (2) Incorporated herein by reference to the current report on Form 8-K dated September 11, (3) Incorporated herein by reference to the Registration Statement No , on Form S-8, filed with the SEC on August 13, 2001, as amended. (4) Incorporated herein by reference to the definitive proxy statement on Schedule 14A as filed with the SEC on March 26, (5) Incorporated herein by reference to the current report on Form 8-K dated April 30, (6) Incorporated by reference to the Current Report on Form 8-K dated September 6, (7) Incorporated by reference to the Current Report on Form 8-K dated December 23,
106 SIGNATURES Pursuant to the requirements of Section 13 or 15(d) of the Securities Exchange Act of 1934, the Registrant has duly caused this report to be signed on its behalf by the undersigned, thereunto duly authorized, on December 7, CHARTER FINANCIAL CORPORATION By: /s/ Robert L. Johnson Robert L. Johnson President and Chief Executive Officer Pursuant to the requirements of the Securities Act of 1933, as amended, and any rules and regulations promulgated there under, this Annual Report on Form 10-K, has been signed by the following persons in the capacities and on the dates indicated. Name Title Date /s/john W. Johnson, Jr. Chairman of the Board December 7, 2006 John W. Johnson, Jr. /s/ Robert L. Johnson Robert L. Johnson /s/ David Z. Cauble, III David Z. Cauble, III /s/ Jane W. Darden Jane W. Darden /s/ William B. Hudson William B. Hudson /s/ Thomas M. Lane Thomas M. Lane /s/ David L. Strobel David L. Strobel /s/ Curtis R. Kollar Curtis R. Kollar President, Chief Executive Officer and Director (principal executive officer) Director Director Director Director Director Chief Financial Officer, Vice President and Treasurer (principal financial and accounting officer) December 7, 2006 December 7, 2006 December 7, 2006 December 7, 2006 December 7, 2006 December 7, 2006 December 7,
107 Exhibit Index Exhibit Description 2.1 CharterBank Amended Plan of Reorganization from Mutual Savings Bank to Mutual Holding Company and Stock Issuance 2.2 Business Combination Agreement, dated September 10, 2002 by and among Charter Financial Corporation, CharterBank and EBA Bancshares, Inc. 3.1 Federal Stock Charter of Charter Financial Corporation (1) 3.2 Bylaws of Charter Financial Corporation (1) 4.1 Federal Stock Charter of Charter Financial Corporation (1) 4.2 Bylaws of Charter Financial Corporation (1) 4.3 Form of Stock Certificate of Charter Financial Corporation (1) 10.1 Form of Employee Stock Ownership Plan of Charter Financial Corporation (6) 10.2 Form of Benefit Restoration Plan of Charter Financial Corporation (7) 10.3 Form of Employment Agreement by and among Robert L. Johnson and Charter Financial Corporation 10.4 Form of One Year Change in Control Agreement by and among certain officers, Charter Financial Corporation and CharterBank 10.5 Form of Two Year Change in Control Agreement by and among certain officers, Charter Financial Corporation and CharterBank 10.6 CharterBank 401(k) Plan and Adoption Agreement (3) 10.7 Charter Financial Corporation 2001 Stock Option Plan (4) 10.8 Charter Financial Corporation 2001 Recognition and Retention Plan (4) 14.0 Conflict of Interest Policy and Code of Ethics (5) Method of Filing (1) (2) (1) (1) (1) 104
108 21.1 Subsidiaries of the Registrant 23.1 Consent of KPMG LLP 31.1 Rule 13a-14(a)/15d-14(a) Certifications 32.1 SSSection 1350 Certifications (1) Incorporated herein by reference to the Registration Statement No , on Form S-1 of Charter Financial filed with the SEC on March 27, 2001, as amended. (2) Incorporated herein by reference to the current report on Form 8-K dated September 11, (3) Incorporated herein by reference to the Registration Statement No , on From S-8, filed with the SEC on August 13, 2001, as amended. (4) Incorporated herein by reference to the definitive proxy statement on Schedule 14A as filed with the SEC on March 26, (5) Incorporated herein by reference to the Current Report on Form 8-K dated April 30, (6) Incorporated herein by reference to the Current Report on Form 8-K dated September 6, (7) Incorporated herein by reference to the Current Report on Form 8-K dated December 23,
109 The Board of Directors Charter Financial Corporation: Report of Independent Registered Public Accounting Firm We have audited the accompanying consolidated balance sheets of Charter Financial Corporation and subsidiaries as of September 30, 2006 and 2005, and the related consolidated statements of income, stockholders equity and comprehensive income (loss), and cash flows for each of the years in the threeyear period ended September 30, These consolidated financial statements are the responsibility of the Company s management. Our responsibility is to express an opinion on these consolidated financial statements based on our audits. We conducted our audits in accordance with the standards of the Public Company Accounting Oversight Board (United States). Those standards require that we plan and perform the audit to obtain reasonable assurance about whether the financial statements are free of material misstatement. An audit includes examining, on a test basis, evidence supporting the amounts and disclosures in the financial statements. An audit also includes assessing the accounting principles used and significant estimates made by management, as well as evaluating the overall financial statement presentation. We believe that our audits provide a reasonable basis for our opinion. In our opinion, the consolidated financial statements referred to above present fairly, in all material respects, the financial position of Charter Financial Corporation and subsidiaries as of September 30, 2006 and 2005, and the results of their operations and their cash flows for each of the years in the three-year period ended September , in conformity with U.S. generally accepted accounting principles. We have also audited, in accordance with the standards of the Public Company Accounting Oversight Board (United States), the effectiveness of the Company s internal control over financial reporting as of September 30, 2006, based on criteria established in Internal Control Integrated Framework issued by the Committee of Sponsoring Organizations of the Treadway Commission (COSO), and our report dated December 7, 2006, expressed an unqualified opinion on management s assessment of, and the effective operation of internal control over financial reporting. As discussed in Note 1 to the consolidated financial statements, the Company adopted the provisions of Statement of Financial Accounting Standards No. 123R, Share-Based Payments, effective October 1, /s/ KPMG LLP Birmingham, Alabama December 7, 2006
110 The Board of Directors Charter Financial Corporation: Report of Independent Registered Public Accounting Firm We have audited management s assessment, included in the accompanying Management s Report on Internal Control Over Financial Reporting, that Charter Financial Corporation (the Company) maintained effective internal control over financial reporting as of September 30, 2006, based on criteria established in Internal Control Integrated Framework issued by the Committee of Sponsoring Organizations of the Treadway Commission (COSO). Charter Financial Corporation s management is responsible for maintaining effective internal control over financial reporting and for its assessment of the effectiveness of internal control over financial reporting. Our responsibility is to express an opinion on management s assessment and an opinion on the effectiveness of the Company s internal control over financial reporting based on our audit. We conducted our audit in accordance with the standards of the Public Company Accounting Oversight Board (United States). Those standards require that we plan and perform the audit to obtain reasonable assurance about whether effective internal control over financial reporting was maintained in all material respects. Our audit included obtaining an understanding of internal control over financial reporting, evaluating management s assessment, testing and evaluating the design and operating effectiveness of internal control, and performing such other procedures as we considered necessary in the circumstances. We believe that our audit provides a reasonable basis for our opinion. A company s internal control over financial reporting is a process designed to provide reasonable assurance regarding the reliability of financial reporting and the preparation of financial statements for external purposes in accordance with generally accepted accounting principles. A company s internal control over financial reporting includes those policies and procedures that (1) pertain to the maintenance of records that, in reasonable detail, accurately and fairly reflect the transactions and dispositions of the assets of the company; (2) provide reasonable assurance that transactions are recorded as necessary to permit preparation of financial statements in accordance with generally accepted accounting principles, and that receipts and expenditures of the company are being made only in accordance with authorizations of management and directors of the company; and (3) provide reasonable assurance regarding prevention or timely detection of unauthorized acquisition, use, or disposition of the company s assets that could have a material effect on the financial statements. Because of its inherent limitations, internal control over financial reporting may not prevent or detect misstatements. Also, projections of any evaluation of effectiveness to future periods are subject to the risk that controls may become inadequate because of changes in conditions, or that the degree of compliance with the policies or procedures may deteriorate.
111 The Board of Directors Charter Financial Corporation: Report of Independent Registered Public Accounting Firm We have audited management s assessment, included in the accompanying Management s Report on Internal Control Over Financial Reporting, that Charter Financial Corporation (the Company) maintained effective internal control over financial reporting as of September 30, 2006, based on criteria established in Internal Control Integrated Framework issued by the Committee of Sponsoring Organizations of the Treadway Commission (COSO). Charter Financial Corporation s management is responsible for maintaining effective internal control over financial reporting and for its assessment of the effectiveness of internal control over financial reporting. Our responsibility is to express an opinion on management s assessment and an opinion on the effectiveness of the Company s internal control over financial reporting based on our audit. We conducted our audit in accordance with the standards of the Public Company Accounting Oversight Board (United States). Those standards require that we plan and perform the audit to obtain reasonable assurance about whether effective internal control over financial reporting was maintained in all material respects. Our audit included obtaining an understanding of internal control over financial reporting, evaluating management s assessment, testing and evaluating the design and operating effectiveness of internal control, and performing such other procedures as we considered necessary in the circumstances. We believe that our audit provides a reasonable basis for our opinion. A company s internal control over financial reporting is a process designed to provide reasonable assurance regarding the reliability of financial reporting and the preparation of financial statements for external purposes in accordance with generally accepted accounting principles. A company s internal control over financial reporting includes those policies and procedures that (1) pertain to the maintenance of records that, in reasonable detail, accurately and fairly reflect the transactions and dispositions of the assets of the company; (2) provide reasonable assurance that transactions are recorded as necessary to permit preparation of financial statements in accordance with generally accepted accounting principles, and that receipts and expenditures of the company are being made only in accordance with authorizations of management and directors of the company; and (3) provide reasonable assurance regarding prevention or timely detection of unauthorized acquisition, use, or disposition of the company s assets that could have a material effect on the financial statements. Because of its inherent limitations, internal control over financial reporting may not prevent or detect misstatements. Also, projections of any evaluation of effectiveness to future periods are subject to the risk that controls may become inadequate because of changes in conditions, or that the degree of compliance with the policies or procedures may deteriorate.
112 In our opinion, management s assessment that Charter Financial Corporation maintained effective internal control over financial reporting as of September 30, 2006, is fairly stated, in all material respects, based on criteria established in Internal Control Integrated Framework issued by the Committee of Sponsoring Organizations of the Treadway Commission (COSO). Also, in our opinion, Charter Financial Corporation maintained, in all material respects, effective internal control over financial reporting as of September 30, 2006, based on criteria established in Internal Control Integrated Framework issued by the Committee of Sponsoring Organizations of the Treadway Commission (COSO). We also have audited, in accordance with the standards of the Public Company Accounting Oversight Board (United States), the consolidated balance sheets of Charter Financial Corporation and subsidiaries as of September 30, 2006 and 2005, and the related consolidated statements of operations, stockholders equity and comprehensive income (loss), and cash flows for each of the years in the three-year period ended September 30, 2006, and our report dated December 7, 2006 expressed an unqualified opinion on those consolidated financial statements. /s/ KPMG LLP Birmingham, Alabama December 7, 2006
113 CHARTER FINANCIAL CORPORATION AND SUBSIDIARIES Consolidated Balance Sheets September 30, 2006 and Assets Cash and amounts due from depository institutions $ 14,780,668 12,295,506 Interest bearing deposits in other financial institutions 9,640,178 8,568,599 Cash and cash equivalents 24,420,846 20,864,105 Loans held for sale, market value of $913,825 and $1,248,495 at September 30, 2006 and 2005, respectively 909,206 1,233,679 Freddie Mac common stock (note 3) 294,339, ,775,750 Mortgage backed securities and collateralized mortgage obligations available for sale (notes 4 and 16) 308,149, ,461,047 Other investment securities available for sale (notes 4 and 16) 37,582,398 17,711,641 Federal Home Loan Bank stock (notes 3 and 16) 15,981,200 14,869,300 Loans receivable 381,721, ,898,792 Unamortized loan origination fees, net (909,229) (930,936) Allowance for loan losses (6,086,205) (6,160,314) Loans receivable, net (notes 6 and 16) 374,726, ,807,542 Real estate owned (note 7) 460,223 1,120,418 Accrued interest and dividends receivable (note 8) 3,578,371 3,222,854 Premises and equipment, net (note 9) 17,025,398 13,969,137 Goodwill and other intangible assets, net of amortization (note 2) 5,598,817 5,765,492 Cash surrender value of life insurance 12,265,590 Other assets (note 10) 2,284,034 1,769,518 Total assets $ 1,097,321,495 1,050,570,483 Liabilities and Stockholders Equity Liabilities: Deposits (note 11 and 16) $ 372,056, ,129,182 Borrowings (note 12 and 16) 337,928, ,336,000 Advance payments by borrowers for taxes and insurance 1,344,221 1,314,541 Deferred income taxes (note 13) 108,185,711 93,270,870 Other liabilities 10,097,621 10,289,711
114 Total liabilities 829,612, ,340,304 Stockholders equity (notes 14, 17, and 20): Common stock, $0.01 par value; authorized 30,000,000 and issued 19,837,816 and 19,830,705 shares in 2006 and 2005, respectively; outstanding 19,662,981 and 19,629,372 shares in 2006 and 2005, respectively 198, ,307 Preferred Stock, authorized 5,000,000 shares Additional paid in capital 39,031,515 38,384,588 Treasury stock, at cost; 174,835 and 201,333 shares in 2006 and 2005, respectively (5,436,393) (6,261,270) Unearned compensation ESOP (2,121,940) (2,286,940) Retained earnings 63,548,301 63,790,437 Accumulated other comprehensive income: Net unrealized holding gains on securities available for sale 172,489, ,405,057 Total stockholders equity 267,709, ,230,179 Commitments and contingencies (notes 15, 16, and 18) Total liabilities and stockholders equity $ 1,097,321,495 1,050,570,483 See accompanying notes to consolidated financial statements.
115
116 CHARTER FINANCIAL CORPORATION AND SUBSIDIARIES Consolidated Statements of Stockholders Equity and Comprehensive Income (Loss) Years ended September 30, 2006, 2005, and 2004 Comprehensive income (loss) Common stock Number of shares Amount Additional paid in capital Treasury stock Unearned compensation ESOP Retained earnings Accumulated other comprehensive income Total stockholders equity Balance at September 30, ,822, ,224 37,491,011 (7,836,234) (2,624,940) 59,190, ,940, ,359,082 Comprehensive income: Net income $ 8,217,276 8,217,276 8,217,276 Other comprehensive income unrealized gain on securities, net of income taxes of $22,895,046 (note 20) 36,418,546 36,418,546 36,418,546 Total comprehensive income $ 44,635,822 Dividends paid, $1.10 per share (3,781,656) (3,781,656) Allocation of ESOP common stock 363, , ,834 Grant of common stock from treasury (67,145) 776, ,265 Stock options exercised 1, ,875 43,890 Balance at September 30, ,823, ,239 37,831,575 (7,059,824) (2,454,940) 63,626, ,359, ,500,237 Comprehensive income (loss): Net income $ 11,413,103 11,413,103 11,413,103 Other comprehensive loss unrealized loss on securities, net of income taxes of $19,459,691 (note 20) (30,954,017) (30,954,017) (30,954,017) Total comprehensive loss $(19,540,914)
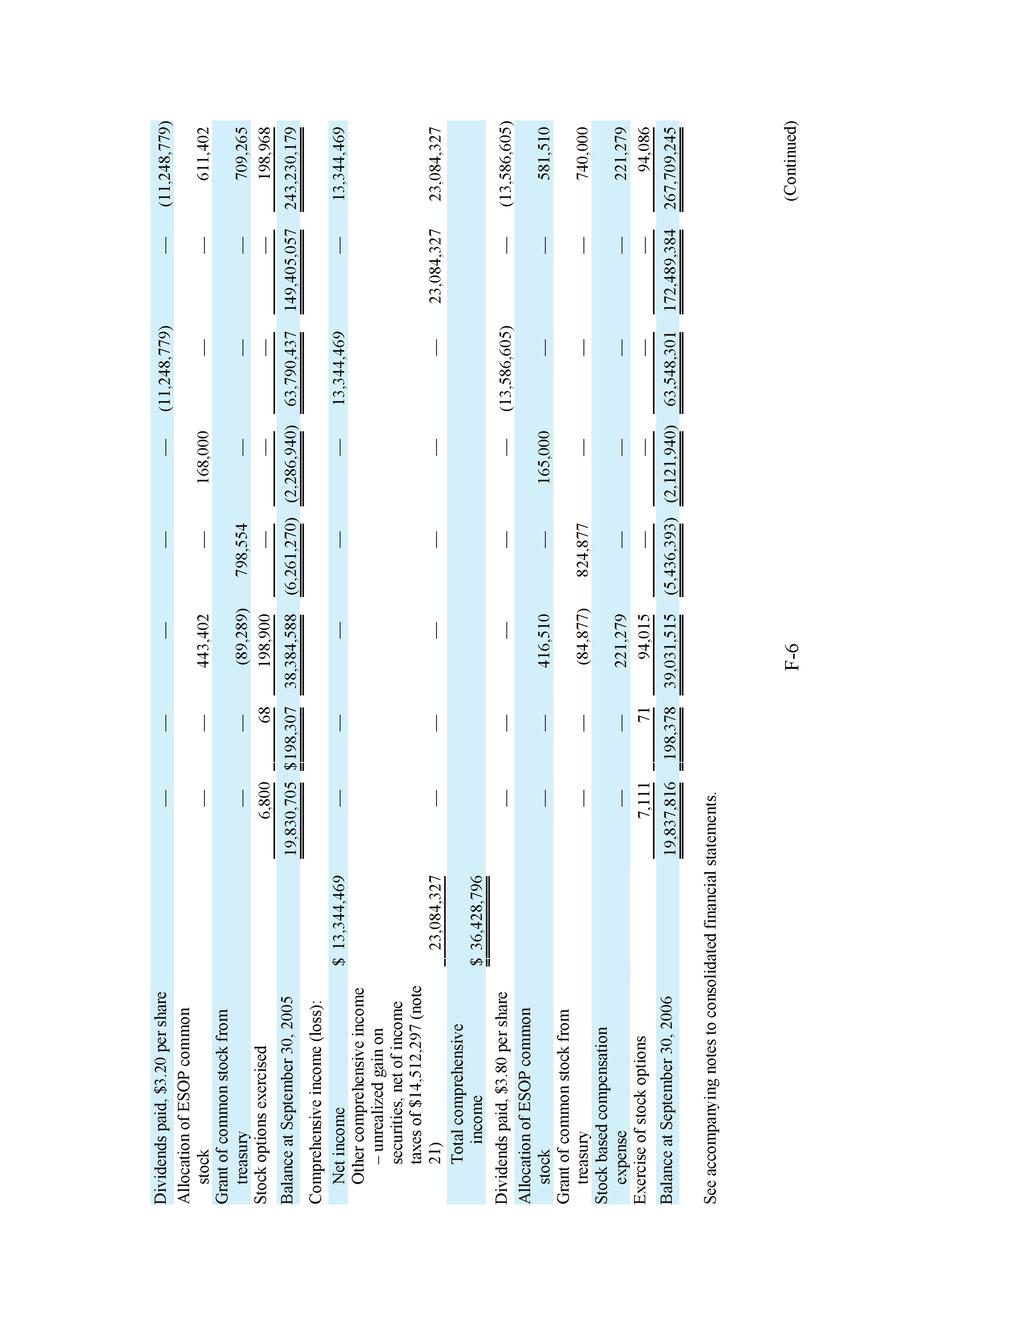

117
118 CHARTER FINANCIAL CORPORATION AND SUBSIDIARIES Consolidated Statements of Cash Flows Years ended September 30, 2006, 2005, and Cash flows from operating activities: Net income $ 13,344,469 11,413,103 8,217,276 Adjustments to reconcile net income to net cash provided by operating activities: Provision for loan losses 75,000 30,000 Provision for asset impairment 184,233 Depreciation and amortization 967, , ,758 Allocation of ESOP common stock 581, , ,834 Deferred income tax expense 402,545 1,127, ,285 Loss (gain) on sale of premises and equipment, net 79,354 (2,500) Write off of investment 200,000 (Accretion) amortization of premiums and discounts, net (311,609) 251, ,235 Gain on sale of loans held for sale, net (741,014) (883,928) (1,151,996) Proceeds from sale of loans held for sale 24,233,032 28,515,369 39,183,522 Originations of loans held for sale (23,167,545) (26,787,610) (38,082,775) Gain on sale of Freddie Mac common stock (4,768,735) (6,085,297) (2,113,336) Gain on sales of mortgage backed securities, collateralized mortgage obligations, and other investments (38,069) (115,261) Provision for allowance in other real estate owned 78,418 71,507 Loss (gain) on sales of real estate owned 20,774 (13,183) (24,201) Stock based compensation expense 221,279 Excess tax benefit on exercise of stock options (6,306) Income on bank owned life insurance (265,590) Changes in assets and liabilities: (Increase) decrease in accrued interest and dividends receivable (355,517) (218,630) 195,888 (Increase) decrease in other assets (62,399) (194,612) 426,093 Increase (decrease) in other liabilities 554, ,152 (1,667,336) Net cash provided by operating activities 10,988,216 9,150,858 7,793,993 Cash flows from investing activities:

119
120 CHARTER FINANCIAL CORPORATION AND SUBSIDIARIES Consolidated Statements of Cash Flows Years ended September 30, 2006, 2005, and Cash flows from financing activities: Net proceeds from the exercise of stock options $ 87, ,968 43,890 Excess tax benefit on exercise of stock options 6,306 Dividends paid (13,586,605) (11,248,779) (3,781,656) Net increase in deposits 51,927,515 40,554, ,001 Proceeds from Federal Home Loan Bank advances 104,250, ,215, ,375,000 Principal payments on advances from Federal Home Loan Bank (79,250,000) (318,265,000) (556,425,000) Proceeds from other borrowings 745,152,000 1,640,817,678 1,694,902,600 Principal payments on other borrowings (814,560,000) (1,646,220,678) (1,715,504,820) Net increase (decrease) in advance payments by borrowers for taxes and insurance 29, ,954 (2,010) Net cash (used in) provided by financing activities (5,943,324) 19,176, ,005 Net increase in cash and cash equivalents 3,556,741 8,492, ,740 Cash and cash equivalents, beginning of year 20,864,105 12,371,229 11,920,489 Cash and cash equivalents, end of year $ 24,420,846 20,864,105 12,371,229 Supplemental disclosures of cash flow information: Interest paid $ 27,032,168 21,933,245 17,042,988 Income taxes paid 4,082,450 3,588,395 3,294,453 Investing activities: Transfer of premises and equipment to assets held for sale 486, ,349 Financing activities: Real estate acquired through foreclosure of loans receivable 1,031,213 1,022, ,381 Issuance of common stock under stock benefit plans 740, , ,265 Issuance of common stock through net share settlement exercises 497,420 See accompanying notes to consolidated financial statements. F-8 (Continued)
121 (1) Summary of Significant Accounting Policies CHARTER FINANCIAL CORPORATION AND SUBSIDIARIES Notes to Consolidated Financial Statements September 30, 2006, 2005, and 2004 The consolidated financial statements of Charter Financial Corporation and subsidiaries (the Company) include the financial statements of Charter Financial Corporation and its wholly owned subsidiaries, CharterBank (the Bank) and Charter Insurance Company which was liquidated during December All intercompany accounts and transactions have been eliminated in consolidation. CharterBank was organized as a federally chartered mutual savings and loan association in CharterBank is primarily regulated by the Office of Thrift Supervision (OTS) and the Federal Deposit Insurance Corporation (FDIC), and undergoes periodic examinations by those regulatory authorities. Charter Financial Corporation was formed through the reorganization of CharterBank in October At that time, CharterBank converted from a federally chartered mutual savings and loan association into a two tiered mutual holding company structure and became a direct wholly owned subsidiary of Charter Financial Corporation. Through a public offering during the same year, Charter Financial Corporation sold 20% of its common stock. First Charter, MHC, a federal mutual holding company, owns the remaining 80% of the outstanding shares of the common stock of Charter Financial Corporation (See note 21). The Company primarily provides real estate loans and a full range of deposit products to individual and small business consumers through its nine full service branch offices located in West Point and LaGrange, Georgia; Auburn, Opelika, and Valley, Alabama. In addition, the Company operates three loan production offices located in various Georgia and Alabama locations. The Company primarily competes with other financial institutions in its market area within west central Georgia and east central Alabama. The Company considers its primary lending market to be the states of Georgia and Alabama. The accounting and reporting policies of the Company conform to accounting principles generally accepted in the United States of America and to prevailing practices within the financial institutions industry. The following is a summary of the significant accounting policies that the Company follows in presenting its consolidated financial statements. (a) Basis of Presentation In preparing the consolidated financial statements, management is required to make estimates and assumptions that affect the reported amounts of assets and liabilities as of the date of the balance sheet and revenue and expenses for the period. Actual results could differ significantly from those estimates. Material estimates that are particularly susceptible to significant change in the near term relate to the determination of the allowance for loan losses, the valuation of real estate acquired in connection with foreclosures or in satisfaction of loans, and mortgage loan prepayment assumptions used to determine the amount of revenue recognition on mortgage backed securities and collateralized mortgage obligations. In connection with the determination of the allowance for loan losses and the value of real estate owned, management obtains independent appraisals for significant properties. In connection with the determination of revenue recognition on mortgage backed securities and collateralized mortgage obligations, management obtains independent estimates of mortgage loan prepayment assumptions, which are based partly on historical prepayments and current interest rates. F-9 (Continued)
122 CHARTER FINANCIAL CORPORATION AND SUBSIDIARIES Notes to Consolidated Financial Statements September 30, 2006, 2005, and 2004 A substantial portion of the Company s loans is secured by real estate located in its market area. Accordingly, the ultimate collectibility of a substantial portion of the Company s loan portfolio is susceptible to changes in the real estate market conditions of this market area. (b) Cash and Cash Equivalents Cash and cash equivalents, as presented in the consolidated financial statements, include amounts due from other depository institutions and interest bearing deposits in other financial institutions. Generally, interest bearing deposits in other financial institutions are for one day periods. (c) Investments, Mortgage Backed Securities, and Collateralized Mortgage Obligations Investments, mortgage backed securities, and collateralized mortgage obligations available for sale are reported at fair value, as determined by independent quotations. Investment in stock of the Federal Home Loan Bank (FHLB) is required of every federally insured financial institution, which utilizes its services. Generally, the FHLB will repurchase excess stock at cost; accordingly, the investment in FHLB stock is carried at cost, which approximates its fair value. Purchase premiums and discounts on investment securities are amortized and accreted to interest income using a method, which approximates a level yield over the period to maturity of the related securities. Purchase premiums and discounts on mortgage backed securities and collateralized mortgage obligations are amortized and accreted to interest income using the interest method over the remaining lives of the securities, taking into consideration assumed prepayment patterns. Gains and losses on sales of investments, mortgage backed securities, and collateralized mortgage obligations are recognized on the trade date, based on the net proceeds received and the adjusted carrying amount of the specific security sold. A decline in the market value of any available for sale security below cost that is deemed other than temporary results in a charge to earnings and the establishment of a new cost basis for that security. At September 30, 2006, the Company did not have any securities with other than temporary impairment. (d) Loans and Interest Income Loans are reported at the principal amounts outstanding, net of unearned income, deferred loan fees/origination costs, and the allowance for loan losses. Interest income is recognized using the simple interest method on the balance of the principal amount outstanding. Unearned income, primarily arising from deferred loan fees, net of certain origination costs, and deferred gains on the sale of the guaranteed portion of Small Business Administration (SBA) loans, is amortized over the lives of the underlying loans using the interest method. Generally, the accrual of interest income is discontinued on loans which become contractually past due by 90 days or when reasonable doubt exists as to the full timely collection of interest or principal. Interest previously accrued but not collected is reversed against current period interest income when such loans are placed on nonaccrual status. Interest on nonaccrual loans, which is ultimately collected, is credited to income in the period received. F-10 (Continued)
123 CHARTER FINANCIAL CORPORATION AND SUBSIDIARIES Notes to Consolidated Financial Statements September 30, 2006, 2005, and 2004 Impaired loans are measured based on the present value of expected future cash flows, discounted at the loan s effective interest rate, or at the loan s observable market price, or the fair value of the collateral if the loan is collateral dependent. The Company considers a loan impaired when, based on current information and events, it is probable that the Company will be unable to collect all amounts due according to the contractual terms of the note agreement. Large pools of smaller balance homogeneous loans, such as consumer and installment loans, are collectively evaluated for impairment by the Company. Impairment losses are included in the allowance for loan losses through a charge to the provision for loan losses. Cash receipts on impaired loans for which the accrual of interest has been discontinued are recorded as income when received unless full recovery of principal is in doubt. Gains or losses on the sale of mortgage loans are recognized at settlement dates and are computed as the difference between the sales proceeds received and the net book value of the mortgage loans sold. On loans sold with servicing retained, at the time of sale, a servicing asset is recorded if expected servicing revenues exceed an amount approximating adequate servicing compensation. The servicing asset, included in other assets, is amortized using the interest method over the estimated life of the serviced loans considering assumed prepayment patterns. Loans held for sale are carried at the lower of aggregate cost or market, with market determined on the basis of open commitments for committed loans. For uncommitted loans, market is determined on the basis of current delivery prices in the secondary mortgage market. (e) Allowance for Loan Losses The allowance for loan losses is adjusted through provisions for loan losses charged or credited to operations. Loans are charged off against the allowance for loan losses when management believes that the collection of the principal is unlikely. Subsequent recoveries are added to the allowance. The allowance is determined through consideration of such factors as changes in the nature and volume of the portfolio, overall portfolio quality, delinquency trends, adequacy of collateral, loan concentrations, specific problem loans, and economic conditions that may affect the borrowers ability to pay. To the best of management s ability, all known and inherent losses that are both probable and reasonable to estimate have been recorded. While management uses available information to recognize losses on loans, future additions to the allowance may be necessary based on changes in economic conditions. In addition, various regulatory agencies, as an integral part of their examination process, periodically review the Company s allowance for loan losses. Such agencies may require the Company to adjust the allowance based on their judgment about information available to them at the time of their examination. (f) Real Estate Owned Real estate acquired through foreclosure, consisting of properties obtained through foreclosure proceedings or acceptance of a deed in lieu of foreclosure, is reported on an individual asset basis at the lower of cost or fair value, less disposal costs. Fair value is determined on the basis of current appraisals, comparable sales, and other estimates of value obtained principally from independent F-11 (Continued)
124 CHARTER FINANCIAL CORPORATION AND SUBSIDIARIES Notes to Consolidated Financial Statements September 30, 2006, 2005, and 2004 sources. When properties are acquired through foreclosure, any excess of the loan balance at the time of foreclosure over the fair value of the real estate held as collateral is recognized and charged to the allowance for loan losses. Subsequent write downs are charged to a separate allowance for losses pertaining to real estate owned, established through provisions for estimated losses on real estate owned charged to operations. Based upon management s evaluation of the real estate acquired through foreclosure, additional expense is recorded when necessary in an amount sufficient to restore the allowance to an adequate level. Gains recognized on the disposition of the properties are recorded in other income. Costs of improvements to real estate are capitalized, while costs associated with holding the real estate are charged to operations. (g) Premises and Equipment Premises and equipment are stated at cost, less accumulated depreciation, which is computed using the straight line method over the estimated useful lives of the assets. The estimated useful lives of the assets range from 20 to 50 years for buildings and improvements and 3 to 15 years for furniture, fixtures, and equipment. (h) Mortgage Banking Activities Statement of Financial Accounting Standards (SFAS) No. 140 provides accounting and reporting standards for transfers and servicing of financial assets and extinguishments of liabilities based on consistent application of a financial components approach that focuses on control. Under that approach, after a transfer of financial assets, an entity recognizes the financial and servicing assets it controls and the liabilities it has incurred, derecognizes financial assets when control has been surrendered, and derecognizes liabilities when extinguished. This statement provides consistent standards for distinguishing transfers of financial assets that are sales from transfers that are secured borrowings. Mortgage loan servicing rights are included in other assets. Mortgage servicing rights are stated at cost, less accumulated amortization and impairment valuation allowance. The Company recognizes, as separate assets, rights to service mortgage loans for others, either purchased or through Company originations. Mortgage servicing rights which are acquired through either the purchase or origination of mortgage loans are recognized as separate assets when the Company sells or securitizes those loans with servicing rights retained. For originated and purchased mortgage loans, the amount of the mortgage servicing rights to be recognized is determined based upon an allocation of the total cost of the mortgage loans to the mortgage servicing rights and the loans (without the mortgage servicing rights) based on their relative fair values. Fair value is determined by discounted cash flow analyses using appropriate assumptions for servicing fee income, servicing fee costs, prepayment rates, and discount rates. For mortgage servicing rights acquired separate from the mortgage loans, the Company capitalizes the amount paid. The cost of the mortgage servicing rights is amortized in proportion to and over the period of net servicing income which is estimated to be generated by the underlying mortgage servicing rights. In accordance with SFAS No. 140, the Company periodically assesses its capitalized mortgage servicing rights for impairment based upon the fair value of those rights. To measure the fair value of F-12 (Continued)
125 CHARTER FINANCIAL CORPORATION AND SUBSIDIARIES Notes to Consolidated Financial Statements September 30, 2006, 2005, and 2004 its mortgage servicing rights, the Company uses discounted cash flow analyses taking into consideration appropriate assumptions for servicing fee income, servicing fee costs, prepayment rates, and discount rates. The Company stratifies its capitalized mortgage servicing rights for the purpose of evaluating impairment, taking into consideration relevant risk characteristics, including loan type, note rate, and note term. If the recorded amount of the mortgage servicing rights exceeds the fair value, the amount of the impairment is recognized through a valuation allowance, with a corresponding charge to operations. Additionally, the Company will prospectively accelerate future amortization if a reduction in expected future net servicing income is estimated. Fees for servicing loans for investors are based on the outstanding principal balance of the loans serviced and are recognized as income when earned. (i) Insurance At September 30, 2006 the Company was covered under a $5 million banker s blanket bond policy and a $3 million errors and omissions policy. The Company is also covered with a $10 million umbrella policy. (j) Income Taxes The Company accounts for income taxes in accordance with the provisions of SFAS No. 109, Accounting for Income Taxes. Under the asset and liability method of SFAS No. 109, deferred tax assets and liabilities are recognized for the future tax consequences attributable to differences between the financial statement carrying amounts of existing assets and liabilities and their respective tax bases. Deferred tax assets and liabilities are measured using enacted tax rates expected to apply to taxable income in the years in which those temporary differences are expected to be recovered or settled. Under SFAS No. 109, the effect on deferred tax assets and liabilities of a change in tax rates is recognized in income in the period that includes the enactment date. (k) Comprehensive Income Comprehensive income for the Company consists of net income for the period and unrealized holding gains and losses on investments, mortgage backed securities, and collateralized mortgage obligations classified as available for sale, net of income taxes. (l) Intangible Assets Intangible assets include costs in excess of net assets acquired and deposit premiums recorded in connection with the acquisition of EBA Bancshares, Inc. ( EBA ). The deposit premium is being amortized over 13 years (See note 2). In accordance with the provisions of SFAS No. 142, the Company tests its goodwill for impairment annually. If indicators of impairment were present in amortizable intangible assets and undiscounted future cash flows were not expected to be sufficient to recover the assets carrying amount, an impairment loss would be charged to expense in the period identified. No impairment charges have been recognized through September 30, F-13 (Continued)
126 (m) Stock Based Compensation CHARTER FINANCIAL CORPORATION AND SUBSIDIARIES Notes to Consolidated Financial Statements September 30, 2006, 2005, and 2004 Effective October 1, 2005, the Company implemented SFAS No. 123R using the modified prospective transition method. According to SFAS No. 123R, the total cost of the Company s share based awards is equal to the grant date fair value and recognized as expense on a straight line basis over the service periods of the awards. For the year ended September 30, 2006 stock option expense of $221,279 was recorded in the income statement in income before taxes. The net income impact was approximately $187,975. As of September 30, 2006, the Company had $335,953 of unrecognized stock option expense not yet recognized which will be recognized over 3 years. As allowed under SFAS No. 123, the Company applied APB Opinion No. 25, Accounting for Stock Issued to Employees, and related interpretations in accounting for its stock option plans prior to October Accordingly, compensation cost was measured as the excess, if any, of the quoted market price of the Company s stock at the date of grant over the amount an employee must pay to acquire the stock. Had compensation cost for the Company s stock option plans and restricted stock awards have been determined based on the fair value at the grant dates for awards under those plans consistent with the method included in SFAS No. 123, the Company s net income and income per share would have been reduced to the pro forma amounts indicated below: Net income $11,413,103 8,217,276 Add: Total stock based compensation expense inclued in reported net income, net of tax 1,059, ,118 Deduct: Total stock based compensation expense determined under fair value based method, net of related tax effect 1,283,114 1,021,442 Pro forma net income $11,189,411 7,978,952 Net income per common share basic: As reported $ Pro forma Net income per common share diluted: As reported $ Pro forma F-14 (Continued)
127 (n) Income Per Share CHARTER FINANCIAL CORPORATION AND SUBSIDIARIES Notes to Consolidated Financial Statements September 30, 2006, 2005, and 2004 Basic net income per share is computed on the weighted average number of shares outstanding in accordance with SFAS No. 128, Earnings Per Share. Diluted net income per share is computed by dividing net income by weighted average shares outstanding plus common share equivalents resulting from dilutive stock options, determined using the treasury stock method. Year Ended September 30, Net income $13,344,469 $11,413,103 Denominator: Weighted average common shares outstanding 19,414,941 19,523,748 Equivalent shares issuable upon exercise of stock options 161,545 45,349 Diluted shares 19,576,486 19,569,097 Net income per share Basic $ 0.69 $ 0.58 Diluted $ 0.68 $ 0.58 For the year ended September 30, 2006 and September 30, 2005 there were no antidulitive shares. See Note 19 Subsequent Event. (o) Treasury Stock Treasury stock is accounted for at cost. (p) Derivatives The Company recognizes all derivatives as either assets or liabilities in the Company s consolidated balance sheets and measures these instruments at fair value. At present, the Company s use of derivatives is limited to commitments to originate loans held for sale and call options written on certain shares of its Freddie Mac common stock. (q) Bank Owned Life Insurance The Company owns life insurance policies to provide for the payment of death benefits related to existing deferred compensation and supplemental income plans maintained for the benefit of certain executives and directors of the Company. The total cash surrender value amounts of such policies at September 30, 2006 was $12,265,590. The Company recorded increases to the cash surrender value of $265,590 for the year ended September 30, (r) Recent Accounting Pronouncements In December 2004, the Financial Accounting Standard Board ( FASB ) issued SFAS No. 123(R) (revised 2004), Share-Based Payment. This Statement is a revision of SFAS No. 123, Accounting for Stock-Based Compensation, and supersedes APB Opinion No. 25, Accounting for Stock Issued to Employees, and its related implementation guidance. SFAS No. 123(R) established standards for the accounting for transactions in which an entity exchanges its equity instruments for F-15 (Continued)
128 CHARTER FINANCIAL CORPORATION AND SUBSIDIARIES Notes to Consolidated Financial Statements September 30, 2006, 2005, and 2004 goods or services. This Statement requires that the cost resulting from all share-based payment transactions be recognized in the financial statements. This Statement establishes grant date fair value as the measurement objective in accounting for share-based payment arrangements and requires all entities to apply a fair-value-based measurement method in accounting for sharebased payment transactions with employees, except for equity instruments held by employee stock ownership plans. The Company adopted SFAS No. 123(R) effective October 1, 2005, resulting in additional compensation expense of $221,279 for the year ended September 30, In March 2005, the SEC released Staff Accounting Bulletin ( SAB ) No. 107, Share-Based Payment. SAB No. 107 expresses views of the SEC staff regarding the application of SFAS No. 123(R). Among other things, SAB No. 107 provides interpretive guidance related to the interaction between SFAS No. 123(R) and certain SEC rules and regulations and provides the staff s view regarding the valuation of share-based payment arrangements for public companies. SAB No. 107 has been considered by the Company in its adoption of SFAS No. 123(R). In May 2005, the FASB issued SFAS No. 154, Accounting Changes and Error Corrections. This statement replaces APB Opinion No. 20, Accounting Changes, and SFAS No. 3, Reporting Accounting Changes in Interim Financial Statements. SFAS No. 154 changes the requirements for the accounting for and reporting of a voluntary change in accounting principle. SFAS No. 154 requires retrospective application to prior periods financial statements of changes in accounting principles or error corrections, unless it is impractical to determine the period-specific effects or when a pronouncement includes specific transition provisions. This statement is effective for accounting changes and corrections of error made in fiscal years beginning after December 15, The Company does not expect the adoption of SFAS No. 154 (revised 2004) to have a material impact on its financial condition or results of operation. FASB Staff Position No. FAS and FAS 124-1, The Meaning of Other-Than-Temporary Impairment and Its Application to Certain Investments (the FSP ), was issued on November 3, 2005 and addresses the determination of when an investment is considered impaired; whether the impairment is other than temporary; and how to measure an impairment loss. The FSP also addresses accounting considerations subsequent to the recognition of an other-than-temporary impairment on a debt security, and requires certain disclosures about unrealized losses that have not been recognized as other-than-temporary impairments. The FSP replaces the impairment guidance in EITF Issue No with references to existing authoritative literature concerning other-than-temporary determinations SFAS No. 115 and SEC Staff Accounting Bulletin 59). Under the FSP, impairment losses must be recognized in earnings equal to the entire difference between the security s cost and its fair value at the financial statement date, without considering partial recoveries subsequent to that date. The FSP also requires that an investor recognize an other-than-temporary impairment loss when a decision to sell a security has been made and the investor does not expect the fair value of the security to fully recover prior to the expected time of sale. The FSP is effective for reporting periods beginning after December 15, The application of the FSP did not have a material impact on the Company s financial condition or results of operations. In February 2006, the FASB issued SFAS No. 155, Accounting for Certain Hybrid Financial Instruments-an amendment of FASB statements No. 133 and 140. This statement permits fair value remeasurement of certain hybrid financial instruments, clarifies the scope of SFAS No. 133, F-16 (Continued)
129 CHARTER FINANCIAL CORPORATION AND SUBSIDIARIES Notes to Consolidated Financial Statements September 30, 2006, 2005, and 2004 Accounting for Derivative Instruments and Hedging Activities regarding interest-only and principal-only strips, and provides further guidance on certain issues regarding beneficial interests in securitized financial assets, concentrations of credit risk and qualifying special purpose entities. SFAS No. 155 is effective as of the beginning of the first fiscal year that begins after September 15, The application of SFAS No. 155 is not expected to have an impact on the Company s financial condition or results of operations. In March 2006, the FASB issued SFAS No. 156, Accounting for Servicing of Financial Assets-an amendment of FASB Statement No This statement requires that an entity recognize a servicing asset or servicing liability each time it undertakes an obligation to service a financial asset, and that the servicing assets and servicing liabilities be initially measured at fair value. The statement also permits an entity to choose a subsequent measurement method for each class of separately recognized servicing assets and servicing liabilities. SFAS No. 156 is effective as of the beginning of the first fiscal year that begins after September 15, The application of SFAS No. 156 is not expected to have a material impact on the Company s financial condition or results of operations. In July 2006, the FASB issued Interpretation No. 48, Accounting for Uncertainty in Income Taxes, an interpretation of FASB Statement No This interpretation clarifies the accounting for uncertainty in income taxes recognized in an enterprise s financial statements in accordance with FASB Statement No. 109, Accounting for Income Taxes. The interpretation prescribes a recognition threshold and measurement attribute for the financial statement recognition and measurement of a tax position taken or expected to be taken in a tax return. The interpretation also provides guidance on derecognition, classification, interest and penalties, accounting in interim periods, disclosure and transition. FASB Interpretation No. 48 is effective for fiscal years beginning after December 31, The application of FASB Interpretation No. 48 is not expected to have a material impact on the Company s financial condition or results of operations. On September 15, 2006, the FASB issued SFAS No. 157, Fair Value Measurements, which provides for enhanced guidance for using fair value to measure assets and liabilities. SFAS No. 157 defines fair value, establishes a framework for measuring fair value in generally accepted accounting principles, and expands disclosures about fair value measurements. SFAS No. 157 is applicable under other accounting pronouncements that either require or permit fair value measurements and does not require any new fair value measurements. SFAS No. 157 is effective for financial statements issued for fiscal years beginning after November 15, 2007, and interim periods within those fiscal years. The Company has not yet evaluated the impact of the implementation of SFAS No On September 20, 2006, the FASB ratified EITF Issue 06-4, Accounting for Deferred Compensation and Postretirement Benefit Aspects of Endorsement Split-Dollar Life Insurance Arrangements. EITF Issue 06-4 addresses accounting for split-dollar life insurance arrangements after the employer purchases a life insurance policy on the covered employee. This Issue states that an obligation arises as a result of a substantive agreement with an employee to provide future postretirement benefits. Under Issue EITF 06-4, the obligation is not settled upon entering into an insurance arrangement. Since the obligation is not settled, a liability should be recognized in accordance with applicable authoritative guidance. Issue EITF 06-4 is effective for fiscal years beginning after December 15, The Company has not yet evaluated the impact of the implementation of EITF Issue F-17 (Continued)
130 CHARTER FINANCIAL CORPORATION AND SUBSIDIARIES Notes to Consolidated Financial Statements September 30, 2006, 2005, and 2004 On September 20, 2006, the FASB ratified EITF Issue 06-5, Accounting for Purchases of Life Insurance Determining the Amount That Could Be Realized in Accordance with FASB Technical Bulletin ( FTB ) No. 85-4, Accounting for Purchases of Life Insurance. This Issue addresses how an entity should determine the amount that could be realized under the insurance contract at the balance sheet date in applying FTB 85-4 and if the determination should be on an individual or group policy basis. EITF Issue 06-5 is effective for fiscal years beginning after December 15, The adoption of EITF Issue 06-5 is not expected to have a material effect on the Company s financial statements. In September 2006, the SEC issued SAB No. 108, Considering the Effects of Prior Year Misstatements when Quantifying Misstatements in Current Year Financial Statements. SAB 108 provides interpretive guidance on how the effects of prior-year uncorrected misstatements should be considered when quantifying misstatements in the current year financial statements. SAB 108 requires registrants to quantify misstatements using both an income statement and balance sheet approach and evaluate whether either approach results in a misstatement that, when all relevant quantitative and qualitative factors are considered, is material. If prior year errors that had been previously considered immaterial now are considered material based on either approach, no restatement is required so long as management properly applied its previous approach and all relevant facts and circumstances were considered. If prior years are not restated, the cumulative effect adjustment is recorded in opening accumulated earnings as of the beginning of the fiscal year of adoption. SAB 108 is effective for fiscal years ending on or after November 15, 2006, with earlier adoption encouraged. The Company has not yet evaluated the impact of the implementation of SFAS No (s) Reclassifications Certain reclassifications have been made to the 2005 and 2004 financial statements to conform to the presentation adopted in (2) Goodwill and Other Intangible Assets In conjunction with the acquisition of EBA, the Company recorded the following goodwill and other intangible assets: Goodwill $ 4,325,282 Deposit premium 1,975,941 $ 6,301,223 Goodwill and other intangible assets include cost in excess of net assets acquired and deposit premiums recorded in connection with the acquisition of EBA. The deposit premium is being amortized over 13 years. The Company recorded amortization expense related to the deposit premium of $166,675, $188,627, and $213,955 for the years ended September 30, 2006, 2005 and 2004, respectively. F-18 (Continued)
131 CHARTER FINANCIAL CORPORATION AND SUBSIDIARIES Notes to Consolidated Financial Statements September 30, 2006, 2005, and 2004 At September 30, 2006 and 2005, other intangible assets is summarized as follows: Deposit premium $1,975,941 1,975,941 Less accumulated amortization 702, ,731 Amortization expense for the next five years is as follows: $1,273,535 1,440, $ 146, , , , ,402 Thereafter 587,749 $ 1,273,535 (3) Investment Securities Investment securities available for sale are summarized as follows: Amortized cost September 30, 2006 Gross unrealized gains Gross unrealized losses Estimated fair value Freddie Mac common stock $ 5,918, ,420, ,339,375 Other: U.S. government agencies 36,672,523 78,425 (195,954) 36,554,994 Municipals 1,009,635 17,769 1,027,404 37,682,158 96,194 (195,954) 37,582,398 Amortized cost September 30, 2005 Gross unrealized gains Gross unrealized losses Estimated fair value Freddie Mac common stock $ 6,060, ,714, ,775,750 Other: U.S. government agencies 17,858,691 (147,050) 17,711,641 The amortized cost and estimated fair value of investment debt securities available for sale as of September 30, 2006, by contractual maturity, are shown below. Expected maturities may differ from F-19 (Continued)
132 CHARTER FINANCIAL CORPORATION AND SUBSIDIARIES Notes to Consolidated Financial Statements September 30, 2006, 2005, and 2004 contractual maturities because borrowers may have the right to call or prepay obligations with or without call or prepayment penalties. Amortized cost Estimated fair value 0-1 years $ 5,000,000 4,976, years 25,000,000 25,078, years 6,672,523 6,499,824 After 10 years 1,009,635 1,027,404 $37,682,158 37,582,398 The Company s investment in FHLB stock was $15,981,200 and $14,869,300 at September 30, 2006 and 2005, respectively. Under SFAS No. 115, Accounting for Certain Investments in Debt and Equity Securities, the investment in FHLB stock is carried at cost because it is considered a restricted stock investment. The investment in FHLB stock was not considered impaired at September 30, 2006 and Proceeds from called, matured, or sold investment securities during 2006, 2005, and 2004 were $5,000,000, $12,300,000 and $20,777,721, respectively. There were no sales in 2006 or Gross gains of $8,486 were realized on those sales for 2004, and gross realized losses on sales of investment securities for 2004 were $0. Investment securities available for sale that have been in a continuous unrealized loss position for less than 12 months at September 30, 2006 follow: Amortized cost Gross unrealized losses Estimated fair value $ Investment securities available for sale that have been in a continuous unrealized loss position for 12 months or greater at September 30, 2006 are as follows: Amortized cost Gross unrealized losses Estimated fair value $11,672,523 (195,954) 11,476,569 There are two investments in an unrealized loss position. The investments have no credit deterioration and are impaired due to interest rates and therefore is not considered other than temporarily impaired because the Company has the intent and ability to hold them until maturity. Investment securities with an aggregate carrying amount of $36,672,523 and $18,000,507 at September 30, 2006 and 2005, respectively, were pledged to collateralize FHLB advances and securities sold under agreements to repurchase. F-20 (Continued)
133 CHARTER FINANCIAL CORPORATION AND SUBSIDIARIES Notes to Consolidated Financial Statements September 30, 2006, 2005, and 2004 Proceeds from the sale of Freddie Mac common stock during 2006, 2005 and 2004 were $4,910,794, $6,236,973 and $2,186,107, respectively. Net gains of $4,768,735, $6,085,297 and $2,113,336 were realized on those sales for 2006, 2005 and 2004, respectively. (4) Mortgage Backed Securities and Collateralized Mortgage Obligations Mortgage backed securities and collateralized mortgage obligations available for sale are summarized as follows: Amortized cost September 30, 2006 Gross unrealized gains Gross unrealized losses Estimated fair value Mortgage backed securities: FNMA certificates $106,114, ,882 (3,337,445) 102,881,208 GNMA certificates 12,969,587 80,182 13,049,769 FHLMC certificates 7,521,605 (150,655) 7,370,950 Collateralized mortgage obligations: FNMA 39,948,854 23,804 (1,636,170) 38,336,488 FHLMC 41,018,629 27,838 (1,207,129) 39,839,338 GNMA 996,681 (19,473) 977,208 Other 106,972,853 7,589 (1,285,863) 105,694,579 $315,542, ,295 (7,636,735) 308,149,540 Amortized cost September 30, 2005 Gross unrealized gains Gross unrealized losses Estimated fair value Mortgage backed securities: FNMA certificates $127,547, ,200 (2,506,476) 125,449,047 GNMA certificates 16,019, ,729 (17,992) 16,266,358 FHLMC certificates 10,285,074 14,370 (108,562) 10,190,882 Collateralized mortgage obligations: FNMA 60,949,862 3,595 (1,770,445) 59,183,012 FHLMC 56,823,607 20,098 (758,607) 56,085,098 GNMA 996,133 1, ,987 Other 91,076,517 76,956 (864,810) 90,288,663 $363,698, ,802 (6,026,892) 358,461,047 F-21 (Continued)
134 CHARTER FINANCIAL CORPORATION AND SUBSIDIARIES Notes to Consolidated Financial Statements September 30, 2006, 2005, and 2004 Proceeds from sales of mortgage backed securities and collateralized mortgage obligations during 2006, 2005, and 2004 were $0, $6,428,323, and $104,608,929, respectively. Gross gains of $0, $38,069, and $693,035, and gross losses of $0, $0, and $577,774, were realized on those sales for 2006, 2005, and 2004, respectively. Mortgage backed securities and collateralized mortgage obligations with an aggregate carrying amount of $289,534,183 and $314,040,698 at September 30, 2006 and 2005, respectively, were pledged to secure FHLB advances and to collateralize securities sold under agreements to repurchase. The following table shows additional information related to the collateralized mortgage obligations held by the Company: Fair value September 30, 2006 Weighted average life Yield Net unrealized gain (loss) Fixed rate $ 97,913, years 4.51% $(3,492,822) Variable rate 86,933, years 5.70 (596,582) Total $184,847, years 5.06% $(4,089,404) Fair value September 30, 2005 Weighted average life Yield Net unrealized gain (loss) Fixed rate $125,019, years 4.20% $(2,725,420) Variable rate 81,535, years 4.84 (565,939) Total $206,554, years 4.45% $(3,291,359) The weighted average lives and yields in the above table are based on the average life utilizing the previous three months of prepayment speeds from September 30, 2006 and 2005, respectively. Different prepayment assumptions may result in different average lives and thus different yields. F-22 (Continued)
135 CHARTER FINANCIAL CORPORATION AND SUBSIDIARIES Notes to Consolidated Financial Statements September 30, 2006, 2005, and 2004 Mortgage backed securities and collateralized mortgage obligations that have been in a continuous unrealized loss position for less than 12 months at September 30, 2006 are as follows: Amortized cost Gross unrealized losses Estimated fair value Mortgage backed securities: FNMA certificates $12,017,576 (136,776) 11,880,800 FHLMC certificates 3,077,725 (31,369) 3,046,356 Collateralized mortgage obligations: GNMA 996,681 (19,473) 977,208 FNMA 4,449 (14) 4,435 FHLMC 6,909,880 (153,718) 6,756,162 Other 39,189,758 (365,923) 38,823,835 $62,196,069 (707,273) 61,488,796 Mortgage backed securities and collateralized mortgage obligations that have been in a continuous unrealized loss position for greater than 12 months at September 30, 2006 are as follows: Amortized cost Gross unrealized losses Estimated fair value Mortgage backed securities: FNMA certificates $ 84,068,222 (3,200,670) 80,867,552 FHLMC certificates 4,443,879 (119,285) 4,324,594 Collateralized mortgage obligations: FNMA 31,495,706 (1,604,034) 29,891,672 FHLMC 32,056,773 (1,085,532) 30,971,241 Other 61,031,705 (919,941) 60,111,764 $213,096,285 (6,929,462) 206,166,823 There are 70 investments in an unrealized loss position all of which are mortgage security investments. They have no credit deterioration and are impaired due to interest rates and therefore are not considered to be other than temporarily impaired because the Company has the intent and ability to hold the investments to maturity. (5) Derivative Instruments During 2006, the Company sold a total of 1,025,000 options under its covered call program on Freddie Mac common stock, of which 880,000 options expired or were bought back by the Company and 75,000 options were exercised by the holders. At no time during 2006 did the Company have more than 400,000 options outstanding. F-23 (Continued)
136 CHARTER FINANCIAL CORPORATION AND SUBSIDIARIES Notes to Consolidated Financial Statements September 30, 2006, 2005, and 2004 During 2005, the Company sold a total of 883,700 options, of which 876,400 options expired or were bought back by the Company and 92,500 options were exercised by the holders. At no time during 2005 did the Company have more than 265,000 options outstanding. During 2004, the Company sold a total of 567,900 options, of which 594,200 options expired or were bought back by the Company and 35,000 were exercised by the holder. At no time during 2004 did the Company have more than 400,000 options outstanding The covered call options written on Freddie Mac common stock are derivative instruments as defined by SFAS No. 133 and as such are recorded at fair value. The Company does not account for the options as hedges and as a result the change in fair value is recorded in the consolidated statements of income. There were 70,000 options outstanding at September 30, 2006 with a fair value loss of $277,375 included in other liabilities and at September 30, 2005, no options were outstanding. (6) Loans Receivable Loans receivable are summarized as follows: September family residential real estate mortgage $143,887,573 $148,465,648 Commercial real estate 158,003, ,992,637 Commercial 16,921,310 13,489,864 Real estate construction 43,654,722 32,163,182 Consumer and other 19,255,263 18,787,461 Loans receivable, net of undisbursed proceeds of loans in process 381,721, ,898,792 Less: Unamortized loan origination fees, net 909, ,936 Allowance for loan losses 6,086,205 6,160,314 $374,726, ,807,542 In addition to the above, the Company was servicing loans primarily for others with aggregate principal balances of $22,139,062, $28,330,192, and $36,877,285 at September 30, 2006, 2005, and 2004, respectively. F-24 (Continued)
137 CHARTER FINANCIAL CORPORATION AND SUBSIDIARIES Notes to Consolidated Financial Statements September 30, 2006, 2005, and 2004 Loans to certain executive officers, directors, and their associates totaled $1,323,953 and $1,346,032 at September 30, 2006 and 2005, respectively. Management believes that such loans were made in the ordinary course of business on substantially the same terms, including interest rate and collateral, as those prevailing at the time for comparable transactions with other persons, and did not involve more than the normal credit risk nor present other unfavorable features. The following is a summary of activity during 2006 with respect to such aggregate loans to these individuals and their associates and affiliated companies: Beginning Balance $1,346,032 1,496,440 New loans 34,500 Repayments 22, ,908 Ending Balance $1,323,953 1,346,032 At September 30, 2006 and 2005, the Company had $2,836,807 and $4,075,427 respectively, of nonaccrual loans. At September 30, 2006 and 2005, the Company did not have any commitments to debtors whose loans were nonperforming. The following is a summary of interest income relating to nonaccrual loans for the years ended September 30, 2006, 2005, and Interest income at contractual rates $ 249, , ,906 Interest income actually recorded (115,949) (161,865) (206,882) Reduction of interest income $ 134, , ,024 The following is a summary of transactions in the allowance for loan losses: Balance, beginning of year $6,160,314 6,622,597 6,779,576 Loans charged off (242,342) (659,084) (650,377) Recoveries on loans previously charged off 168, , ,398 Provision for loan losses charged to operations 75,000 30,000 Balance, end of year $6,086,205 6,160,314 6,622,597 At September 30, 2006, 2005, and 2004, pursuant to the definition within SFAS No. 114, the Company had impaired loans of approximately $1,613,000, $2,527,000, and $3,876,000, respectively. There were specific allowances attributable to impaired loans at September 30, 2006, 2005, and 2004 of $46,073, $70,211, and $22,000, respectively. The average recorded investments in impaired loans for the years ended September 30, 2006, 2005, and 2004 were approximately $2,070,000, $3,200,000, and $3,048,000, respectively. Interest income recognized on impaired loans for the years ended September 30, 2006, 2005, and 2004, was $122,000, $206,000, and $295,000, respectively. F-25 (Continued)
138 (7) Real Estate Owned CHARTER FINANCIAL CORPORATION AND SUBSIDIARIES Notes to Consolidated Financial Statements September 30, 2006, 2005, and 2004 At September 30, 2006 and 2005, real estate owned is summarized as follows: Real estate acquired through foreclosure $460,223 1,120,418 (8) Accrued Interest and Dividends Receivable At September 30, 2006 and 2005, accrued interest and dividends receivable are summarized as follows: Loans $1,996,070 1,648,149 Mortgage backed securities and collateralized mortgage obligations 1,245,769 1,410,909 Investment securities 98,716 56,512 Other 237, ,284 $3,578,371 3,222,854 (9) Premises and Equipment Premises and equipment at September 30, 2006 and 2005 is summarized as follows: Land $ 5,781,355 4,844,213 Buildings and improvements 11,417,790 9,405,017 Furniture, fixtures, and equipment 3,195,800 3,887,772 Construction in progress 1, ,461 20,396,195 18,757,463 Less accumulated depreciation 3,370,797 4,788,326 $17,025,398 13,969,137 Depreciation expense for premises and equipment for the years ended September 30, 2006, 2005, and 2004, was $765,558, $945,136 and $733,539, respectively. During year ended September 30, 2006 the Company recorded $184,000 for impairment due to a building being structural unsound. This expense is included in occupancy expense in the consolidated statements of income. The Company transferred three buildings with a net book value of $486,988 into assets available for sale during the year ended September 30, These assets are included in other assets in the consolidated balance sheets. F-26 (Continued)

139
UNITED STATES SECURITIES AND EXCHANGE COMMISSION Washington, D.C FORM 10-K. For the transition period from to.
 UNITED STATES SECURITIES AND EXCHANGE COMMISSION Washington, D.C. 20549 FORM 10-K (Mark One) ANNUAL REPORT PURSUANT TO SECTION 13 OR 15(d) OF THE SECURITIES EXCHANGE ACT OF 1934 For the fiscal year ended
ESSA Bancorp, Inc. (Exact name of registrant as specified in its charter)
") SECURITIES AND EXCHANGE COMMISSION 100 F Street NE Washington, D.C. 20549 FORM 10-K Annual Report Pursuant to Section 13 or 15(d) of the Securities Exchange Act of 1934 For the Fiscal Year Ended September
SECURITIES AND EXCHANGE COMMISSION 100 F Street NE Washington, D.C. 20549 FORM 10-K Annual Report Pursuant to Section 13 or 15(d) of the Securities Exchange Act of 1934 For the Fiscal Year Ended September
COMMUNITY SAVINGS BANCORP, INC. (Exact name of registrant as specified in its charter)
") UNITED STATES SECURITIES AND EXCHANGE COMMISSION Washington, D. C. 20549 (Mark One) FORM 10-Q QUARTERLY REPORT PURSUANT TO SECTION 13 OR 15(d) OF THE SECURITIES EXCHANGE ACT OF 1934 For the quarterly period
UNITED STATES SECURITIES AND EXCHANGE COMMISSION Washington, D. C. 20549 (Mark One) FORM 10-Q QUARTERLY REPORT PURSUANT TO SECTION 13 OR 15(d) OF THE SECURITIES EXCHANGE ACT OF 1934 For the quarterly period
EAGLE FINANCIAL BANCORP, INC. (Exact name of registrant as specified in its charter)
") UNITED STATES SECURITIES AND EXCHANGE COMMISSION Washington, D.C. 20549 FORM 10-K (Mark One) ANNUAL REPORT PURSUANT TO SECTION 13 OR 15(d) OF THE SECURITIES EXCHANGE ACT OF 1934 For the fiscal year ended
UNITED STATES SECURITIES AND EXCHANGE COMMISSION Washington, D.C. 20549 FORM 10-K (Mark One) ANNUAL REPORT PURSUANT TO SECTION 13 OR 15(d) OF THE SECURITIES EXCHANGE ACT OF 1934 For the fiscal year ended
2014 Annual Report. & Form 10K. Corporate Center 1233 O.G. Skinner Drive, West Point, Georgia (706) (800)
 (800)") 2014 Annual Report & Form 10K Corporate Center 1233 O.G. Skinner Drive, West Point, Georgia 31833 (706)645-1391 (800)763-4444 Banking Offices Georgia 65 75 59 Norcross ATLANTA BIRMINGHAM 2231 West Point
2014 Annual Report & Form 10K Corporate Center 1233 O.G. Skinner Drive, West Point, Georgia 31833 (706)645-1391 (800)763-4444 Banking Offices Georgia 65 75 59 Norcross ATLANTA BIRMINGHAM 2231 West Point
FORM 10-Q. Commission File No New Bancorp, Inc. (Exact name of registrant as specified in its charter)
") 10-Q 1 nwbb20170630_10q.htm FORM 10-Q SECURITIES AND EXCHANGE COMMISSION Washington, D.C. 20549 FORM 10-Q [X] Quarterly Report Pursuant To Section 13 or 15(d) of the Securities Exchange Act of 1934 For
10-Q 1 nwbb20170630_10q.htm FORM 10-Q SECURITIES AND EXCHANGE COMMISSION Washington, D.C. 20549 FORM 10-Q [X] Quarterly Report Pursuant To Section 13 or 15(d) of the Securities Exchange Act of 1934 For
SECURITIES AND EXCHANGE COMMISSION 100 F Street NE Washington, D.C FORM 10-K
 Page 1 of 56 10-K 1 a14-3659_110k.htm 10-K SECURITIES AND EXCHANGE COMMISSION 100 F Street NE Washington, D.C. 20549 FORM 10-K Annual Report Pursuant to Section 13 or 15(d) of the Securities Exchange Act
LOUISIANA BANCORP, INC. (Exact name of Registrant as specified in its charter)
") LABC 10-K 12/31/2008 Section 1: 10-K (FORM 10-K FOR FISCAL YEAR ENDED DECEMBER 31, 2008) (Mark One) UNITED STATES SECURITIES AND EXCHANGE COMMISSION Washington, D.C. 20549 FORM 10-K x Annual report pursuant
LABC 10-K 12/31/2008 Section 1: 10-K (FORM 10-K FOR FISCAL YEAR ENDED DECEMBER 31, 2008) (Mark One) UNITED STATES SECURITIES AND EXCHANGE COMMISSION Washington, D.C. 20549 FORM 10-K x Annual report pursuant
Best Hometown Bancorp, Inc.
 Page 1 of 74 UNITED STATES SECURITIES AND EXCHANGE COMMISSION Washington, D.C. 20549 FORM 10-Q Quarterly Report Pursuant To Section 13 or 15(d) of the Securities Exchange Act of 1934 For the quarterly
CLIFTON BANCORP INC. (Exact Name of Registrant as Specified in Its Charter)
") o UNITED STATES SECURITIES AND EXCHANGE COMMISSION Washington, DC 20549 FORM 10-Q QUARTERLY REPORT PURSUANT TO SECTION 13 OR 15(d) OF THE SECURITIES EXCHANGE ACT OF 1934 For the quarterly period ended
o UNITED STATES SECURITIES AND EXCHANGE COMMISSION Washington, DC 20549 FORM 10-Q QUARTERLY REPORT PURSUANT TO SECTION 13 OR 15(d) OF THE SECURITIES EXCHANGE ACT OF 1934 For the quarterly period ended
Securities and Exchange Commission Washington, DC FORM 10-Q
 Securities and Exchange Commission Washington, DC 20549 FORM 10-Q [X] Quarterly Report pursuant to Section 13 or 15(d) of the Securities Exchange Act of 1934 For the period ended March 31, 2010 or [ ]
THE SOUTHERN BANC COMPANY, INC.
 2015 A N N U A L R E P O R T THE SOUTHERN BANC COMPANY, INC. THE SOUTHERN BANC COMPANY, INC. The Southern Banc Company, Inc. (the Company ) was incorporated at the direction of management of The Southern
FORM 10-Q FEDERAL DEPOSIT INSURANCE CORPORATION WASHINGTON, D.C
 FORM 10-Q FEDERAL DEPOSIT INSURANCE CORPORATION WASHINGTON, D.C. 20429 (X) QUARTERLY REPORT PURSUANT TO SECTION 13 OR 15(d) OF THE SECURITIES EXCHANGE ACT OF 1934. For the quarterly period ended March
PEOPLE S UNITED FINANCIAL, INC.
 UNITED STATES SECURITIES AND EXCHANGE COMMISSION Washington, D.C. 20549 FORM 10-Q QUARTERLY REPORT PURSUANT TO SECTION 13 OR 15(d) OF THE SECURITIES EXCHANGE ACT OF 1934 For the quarterly period ended
WEST TOWN BANK & TRUST AND SUBSIDIARY Cicero, Illinois. CONSOLIDATED FINANCIAL STATEMENTS December 31, 2015 and 2014
 Cicero, Illinois CONSOLIDATED FINANCIAL STATEMENTS Cicero, Illinois CONSOLIDATED FINANCIAL STATEMENTS CONTENTS INDEPENDENT AUDITOR'S REPORT... 1 CONSOLIDATED FINANCIAL STATEMENTS CONSOLIDATED BALANCE SHEETS...
Securities and Exchange Commission Washington, DC FORM 10-Q
 Securities and Exchange Commission Washington, DC 20549 FORM 10-Q [X] Quarterly Report pursuant to Section 13 or 15(d) of the Securities Exchange Act of 1934 For the period ended March 31, 2011 or [ ]
UNITED STATES SECURITIES AND EXCHANGE COMMISSION Washington, D.C FORM 10-K
 UNITED STATES SECURITIES AND EXCHANGE COMMISSION Washington, D.C. 20549 FORM 10-K ANNUAL REPORT PURSUANT TO SECTION 13 OR 15(d) OF THE SECURITIES EXCHANGE ACT OF 1934 For the Fiscal Year Ended December
M&T BANK CORP FORM 10-Q. (Quarterly Report) Filed 08/09/12 for the Period Ending 06/30/12
 Filed 08/09/12 for the Period Ending 06/30/12") M&T BANK CORP FORM 10-Q (Quarterly Report) Filed 08/09/12 for the Period Ending 06/30/12 Address C/O CORPORATE REPORTING ONE M&T PLAZA 5TH FLOOR BUFFALO, NY 14203 Telephone 7168425390 CIK 0000036270 Symbol
M&T BANK CORP FORM 10-Q (Quarterly Report) Filed 08/09/12 for the Period Ending 06/30/12 Address C/O CORPORATE REPORTING ONE M&T PLAZA 5TH FLOOR BUFFALO, NY 14203 Telephone 7168425390 CIK 0000036270 Symbol
UNITED STATES SECURITIES AND EXCHANGE COMMISSION WASHINGTON, D.C FORM 10-Q
 UNITED STATES SECURITIES AND EXCHANGE COMMISSION WASHINGTON, D.C. 20549 FORM 10-Q Quarterly Report Pursuant to Section 13 or 15(d) of the Securities Exchange Act of 1934 for the quarterly period ended:
AJS Bancorp, Inc. Table of Contents
 2017 Annual Report AJS Bancorp, Inc. Table of Contents LETTER FROM THE CHAIRMAN OF THE BOARD AND CHIEF EXECUTIVE OFFICER... 1 FORWARD-LOOKING STATEMENTS... 2 BUSINESS OF AJS BANCORP, INC. AND A.J. SMITH
PEOPLE S UNITED FINANCIAL, INC. (Exact name of registrant as specified in its charter)
") UNITED STATES SECURITIES AND EXCHANGE COMMISSION Washington, D.C. 20549 FORM 10-Q QUARTERLY REPORT PURSUANT TO SECTION 13 OR 15(d) OF THE SECURITIES EXCHANGE ACT OF 1934 For the quarterly period ended
UNITED STATES SECURITIES AND EXCHANGE COMMISSION Washington, D.C. 20549 FORM 10-Q QUARTERLY REPORT PURSUANT TO SECTION 13 OR 15(d) OF THE SECURITIES EXCHANGE ACT OF 1934 For the quarterly period ended
Trustmark Corporation (Exact name of registrant as specified in its charter)
") Section 1: 10-Q (10-Q) UNITED STATES SECURITIES AND EXCHANGE COMMISSION Washington, D.C. 20549 Form 10-Q QUARTERLY REPORT PURSUANT TO SECTION 13 OR 15(d) OF THE SECURITIES EXCHANGE ACT OF 1934 For the
Section 1: 10-Q (10-Q) UNITED STATES SECURITIES AND EXCHANGE COMMISSION Washington, D.C. 20549 Form 10-Q QUARTERLY REPORT PURSUANT TO SECTION 13 OR 15(d) OF THE SECURITIES EXCHANGE ACT OF 1934 For the
Jacksonville Bancorp, Inc. (Exact name of registrant as specified in its charter)
") UNITED STATES SECURITIES AND EXCHANGE COMMISSION WASHINGTON, D.C. 20549 FORM 10-Q (Mark One) QUARTERLY REPORT PURSUANT TO SECTION 13 OR 15(d) OF THE SECURITIES EXCHANGE ACT OF 1934 For the quarterly period
UNITED STATES SECURITIES AND EXCHANGE COMMISSION WASHINGTON, D.C. 20549 FORM 10-Q (Mark One) QUARTERLY REPORT PURSUANT TO SECTION 13 OR 15(d) OF THE SECURITIES EXCHANGE ACT OF 1934 For the quarterly period
UNITED STATES SECURITIES AND EXCHANGE COMMISSION
 UNITED STATES SECURITIES AND EXCHANGE COMMISSION 450 Fifth Street, N.W. Washington, D.C. 20549 FORM 10-K Annual Report Pursuant to Section 13 or 15(d) of the Securities Exchange Act of 1934 For the Year
WASHINGTON, D.C QUARTERLY REPORT PURSUANT TO SECTION 13 OR 15(d) OF THE SECURITIES EXCHANGE ACT OF 1934
 OF THE SECURITIES EXCHANGE ACT OF 1934") 10-Q 1 usbi-10q_20150630.htm 10-Q WASHINGTON, D.C. 20549 x QUARTERLY REPORT PURSUANT TO SECTION 13 OR 15(d) OF THE SECURITIES EXCHANGE ACT OF 1934 For the quarterly period ended June 30, 2015 OR TRANSITION
10-Q 1 usbi-10q_20150630.htm 10-Q WASHINGTON, D.C. 20549 x QUARTERLY REPORT PURSUANT TO SECTION 13 OR 15(d) OF THE SECURITIES EXCHANGE ACT OF 1934 For the quarterly period ended June 30, 2015 OR TRANSITION
Ben Franklin Financial, Inc Annual Report
 Ben Franklin Financial, Inc. 2017 Annual Report Ben Franklin Financial, Inc. Annual Report For the Year Ended December 31, 2017 Table of Contents Business... 1 Management s Discussion and Analysis of
First PacTrust Bancorp, Inc Annual Report
 First PacTrust Bancorp, Inc. 2007 Annual Report Letter to Shareholders Although 2007 was a challenging year for the financial services industry in general and for our Company in particular, First PacTrust
PEOPLE S UNITED FINANCIAL, INC. (Exact name of registrant as specified in its charter)
") UNITED STATES SECURITIES AND EXCHANGE COMMISSION Washington, D.C. 20549 FORM 10-Q QUARTERLY REPORT PURSUANT TO SECTION 13 OR 15(d) OF THE SECURITIES EXCHANGE ACT OF 1934 For the quarterly period ended
UNITED STATES SECURITIES AND EXCHANGE COMMISSION Washington, D.C. 20549 FORM 10-Q QUARTERLY REPORT PURSUANT TO SECTION 13 OR 15(d) OF THE SECURITIES EXCHANGE ACT OF 1934 For the quarterly period ended
Form 10-Q. T Bancshares, Inc. - TBNC. Filed: November 14, 2008 (period: September 30, 2008)
") Form 10-Q T Bancshares, Inc. - TBNC Filed: November 14, 2008 (period: September 30, 2008) Quarterly report which provides a continuing view of a company's financial position UNITED STATES SECURITIES AND
Form 10-Q T Bancshares, Inc. - TBNC Filed: November 14, 2008 (period: September 30, 2008) Quarterly report which provides a continuing view of a company's financial position UNITED STATES SECURITIES AND
LBC BANCSHARES,INC. AND SUBSIDIARY. Financial Statements December 31, 2014 and (with Independent Auditor s Report thereon)
") LBC BANCSHARES,INC. AND SUBSIDIARY Financial Statements December 31, 2014 and 2013 (with Independent Auditor s Report thereon) INDEPENDENT AUDITOR S REPORT To the Board of Directors and Stockholders LBC
LBC BANCSHARES,INC. AND SUBSIDIARY Financial Statements December 31, 2014 and 2013 (with Independent Auditor s Report thereon) INDEPENDENT AUDITOR S REPORT To the Board of Directors and Stockholders LBC
ANNUAL REPORT. Financial, Inc.
 2010 ANNUAL REPORT Financial, Inc. NASB Financial, Inc. December 14, 2010 Dear Shareholder: While we had positive results in many areas during the past year, our net income decreased by 66%, to $6,323,000.
MW Bancorp, Inc. Consolidated Financial Statements. June 30, 2018 and 2017
 Consolidated Financial Statements June 30, 2018 and 2017 June 30, 2018 and 2017 Contents Independent Auditor s Report... 1 Financial Statements Consolidated Balance Sheets... 2 Consolidated Statements
UNITED STATES SECURITIES AND EXCHANGE COMMISSION Washington D.C FORM 10-Q
 UNITED STATES SECURITIES AND EXCHANGE COMMISSION Washington D.C. 20549 FORM 10-Q (Mark One) [X] QUARTERLY REPORT UNDER SECTION 13 OR 15(d) OF THE SECURITIES EXCHANGE ACT OF 1934 For the quarterly period
Best Hometown Bancorp, Inc. (Exact name of registrant as specified in its charter)
") UNITED STATES SECURITIES AND EXCHANGE COMMISSION WASHINGTON, D.C. 20549 FORM 10-Q X Quarterly Report Pursuant To Section 13 or 15(d) of the Securities Exchange Act of 1934 For the quarterly period ended
UNITED STATES SECURITIES AND EXCHANGE COMMISSION WASHINGTON, D.C. 20549 FORM 10-Q X Quarterly Report Pursuant To Section 13 or 15(d) of the Securities Exchange Act of 1934 For the quarterly period ended
Western New England Bancorp
 Annual Report 2016 Western New England Bancorp Local banking is better than ever. Dear Shareholder, For customers of Westfield Bank, local banking is better than it s ever been before. That s the case
UNITED STATES SECURITIES AND EXCHANGE COMMISSION WASHINGTON, D.C FORM 10-Q
 UNITED STATES SECURITIES AND EXCHANGE COMMISSION WASHINGTON, D.C. 20549 FORM 10-Q (Mark One) QUARTERLY REPORT PURSUANT TO SECTION 13 OR 15(d) OF THE SECURITIES EXCHANGE ACT OF 1934 For the quarterly period
VERSAILLES FINANCIAL CORPORATION Versailles, Ohio. CONSOLIDATED FINANCIAL STATEMENTS June 30, 2018 and 2017
 Versailles, Ohio CONSOLIDATED FINANCIAL STATEMENTS Versailles, Ohio CONSOLIDATED FINANCIAL STATEMENTS CONTENTS INDEPENDENT AUDITOR S REPORT... 1 CONSOLIDATED FINANCIAL STATEMENTS CONSOLIDATED BALANCE
THE SOUTHERN BANC COMPANY, INC.
 A N N U A L R E P O R T THE SOUTHERN BANC COMPANY, INC. Dear Fellow Shareholders, 2018 was almost a break out year for us. We produced pre-tax net income of $154,000, a 9.64% increase in Net Loans, an
Community First Financial Corporation
 Independent Auditor s Report and Consolidated Financial Statements Contents Independent Auditor s Report... 1 Consolidated Financial Statements Balance Sheets... 3 Statements of Income... 4 Statements
Best Hometown Bancorp, Inc. (Exact name of registrant as specified in its charter)
") UNITED STATES SECURITIES AND EXCHANGE COMMISSION WASHINGTON, D.C. 20549 FORM 10-Q Quarterly Report Pursuant To Section 13 or 15(d) of the Securities Exchange Act of 1934 For the quarterly period ended
UNITED STATES SECURITIES AND EXCHANGE COMMISSION WASHINGTON, D.C. 20549 FORM 10-Q Quarterly Report Pursuant To Section 13 or 15(d) of the Securities Exchange Act of 1934 For the quarterly period ended
EXHIBIT INFORMATION Financial Statements OFFERING
 EXHIBIT INFORMATION Financial Statements OFFERING Consolidated Financial Statements (with Independent Auditors Report) TABLE OF CONTENTS Independent Auditors Report... 1-2 Consolidated Financial Statements:
TOUCHMARK BANCSHARES, INC.
 TOUCHMARK BANCSHARES, INC. AND SUBSIDIARY Consolidated Financial Statements December 31, 2017 and 2016 (with Independent Auditor s Report thereon) To the Board of Directors and Stockholders Touchmark Bancshares,
UNITED STATES SECURITIES AND EXCHANGE COMMISSION WASHINGTON, DC FORM 10-Q
 Merrill Corporation 17-8838-1 Wed Apr 26 15:20:39 2017 (V 2.4m-2-P95604CBE) 109417 c:\jms\109417\17-8838-1\task8403450\8838-1-ba.pdf Chksum: 97512 Cycle 2.0 Doc 1 Page 1 UNITED STATES SECURITIES AND EXCHANGE
TRUSTCO BANK CORP N Y
 TRUSTCO BANK CORP N Y FORM 10-Q (Quarterly Report) Filed 08/07/15 for the Period Ending 06/30/15 Address 5 SARNOWSKI DRIVE GLENVILLE, NY, 12302 Telephone 5183773311 CIK 0000357301 Symbol TRST SIC Code
FIRST BANK OF KENTUCKY CORPORATION Maysville, Kentucky. CONSOLIDATED FINANCIAL STATEMENTS December 31, 2016 and 2015
 Maysville, Kentucky CONSOLIDATED FINANCIAL STATEMENTS Maysville, Kentucky CONSOLIDATED FINANCIAL STATEMENTS CONTENTS INDEPENDENT AUDITOR S REPORT... 1 FINANCIAL STATEMENTS CONSOLIDATED BALANCE SHEETS...
Maspeth Federal Savings and Loan Association and Subsidiaries
 Maspeth Federal Savings and Loan Association and Subsidiaries Consolidated Financial Statements Table of Contents Page Independent Auditor s Report 1 Consolidated Financial Statements Consolidated Statements
Bangor Bancorp, MHC, Parent of Bangor Savings Bank Consolidated Financial Statements March 31, 2016 and 2015
 Bangor Bancorp, MHC, Parent of Bangor Savings Bank Consolidated Financial Statements Page 1 Table of Contents Page(s) Independent Auditor s Report... 1 Consolidated Financial Statements Balance Sheets...
UNITED STATES SECURITIES AND EXCHANGE COMMISSION FORM 10-Q. HSBC USA Inc. (Exact name of registrant as specified in its charter)
") (Mark One) UNITED STATES SECURITIES AND EXCHANGE COMMISSION Washington, D.C. 20549 FORM 10-Q QUARTERLY REPORT PURSUANT TO SECTION 13 OR 15(d) OF THE SECURITIES EXCHANGE ACT OF 1934 For the quarterly period
(Mark One) UNITED STATES SECURITIES AND EXCHANGE COMMISSION Washington, D.C. 20549 FORM 10-Q QUARTERLY REPORT PURSUANT TO SECTION 13 OR 15(d) OF THE SECURITIES EXCHANGE ACT OF 1934 For the quarterly period
West Town Bancorp, Inc.
 Report on Consolidated Financial Statements Contents Page Independent Auditor's Report... 1-2 Consolidated Financial Statements Consolidated Balance Sheets... 3 Consolidated Statements of Income... 4 Consolidated
Bangor Bancorp, MHC and its Subsidiary, Bangor Savings Bank Consolidated Financial Statements March 31, 2017 and 2016
 Bangor Bancorp, MHC and its Subsidiary, Bangor Savings Bank Consolidated Financial Statements Page 1 Table of Contents Page(s) Independent Auditor s Report... 1 Consolidated Financial Statements Balance
1895 Bancorp of Wisconsin, Inc.
 SECURITIES AND EXCHANGE COMMISSION Washington, D.C. 20549 FORM 10-Q QUARTERLY REPORT PURSUANT TO SECTION 13 or 15(d) OF THE SECURITIES EXCHANGE ACT OF 1934 For the quarterly period ended September 30,
A N N U A L R E P O RT
 2 0 1 7 A N N U A L R E P O RT ANNUAL REPORT June 30, 2017 CONTENTS LETTER TO SHAREHOLDERS... 2 INDEPENDENT AUDITOR S REPORT... 3 CONSOLIDATED FINANCIAL STATEMENTS Consolidated Balance Sheets... 5 Consolidated
Mercantil Commercebank, N.A. and Subsidiaries
 Mercantil Commercebank, N.A. and Subsidiaries (A wholly owned subsidiary of Mercantil Commercebank Florida Bancorp Inc.) Consolidated Financial Statements Index Page(s) Report of Independent Certified
FEDERAL DEPOSIT INSURANCE CORPORATION WASHINGTON, DC FORM 10-Q
 FEDERAL DEPOSIT INSURANCE CORPORATION WASHINGTON, DC 20429 FORM 10-Q QUARTERLY REPORT PURSUANT TO SECTION 13 OR 15 (d) OF THE SECURITIES EXCHANGE ACT OF 1934 FOR THE QUARTER ENDED JUNE 30, 2016 FDIC CERTIFICATE
Monona Bankshares, Inc. and Subsidiary Monona, Wisconsin. Consolidated Financial Statements Years Ended December 31, 2017 and 2016
 Monona, Wisconsin Consolidated Financial Statements Years Ended December 31, 2017 and 2016 Years Ended December 31, 2017 and 2016 Table of Contents Independent Auditor's Report... 1 Consolidated Financial
A N N U A L R E P O RT
 2 0 1 6 A N N U A L R E P O RT ANNUAL REPORT June 30, 2016 CONTENTS LETTER TO SHAREHOLDERS... 2 INDEPENDENT AUDITOR S REPORT... 3 CONSOLIDATED FINANCIAL STATEMENTS Consolidated Balance Sheets... 5 Consolidated
A N N UA L R E P O RT
 2015 ANNUAL REPORT ANNUAL REPORT June 30, 2015 CONTENTS LETTER TO SHAREHOLDERS... 2 INDEPENDENT AUDITOR S REPORT... 3 CONSOLIDATED FINANCIAL STATEMENTS Consolidated Balance Sheets... 5 Consolidated Statements
TABLE OF CONTENTS. President's Letter to Shareholders Selected Consolidated Financial and Other Data... 2
 3 TABLE OF CONTENTS Page President's Letter to Shareholders... 1 Selected Consolidated Financial and Other Data... 2 Management's Discussion and Analysis of Financial Condition and Results of Operations...
Maspeth Federal Savings and Loan Association and Subsidiaries
 Maspeth Federal Savings and Loan Association and Subsidiaries Consolidated Financial Statements Table of Contents Page Independent Auditor s Report 1 Consolidated Financial Statements Consolidated Statements
Stonebridge Bank and Subsidiaries
 Stonebridge Bank and Subsidiaries Consolidated Financial Statements December 31, 2017 and 2016 The report accompanying these financial statements was issued by BDO USA, LLP, a Delaware limited liability
Bank of Ocean City. Financial Statements. December 31, 2017
 Financial Statements December 31, 2017 Table of Contents Page Report of Independent Auditors 1 Financial Statements Balance Sheets 2 Statements of Income 3 Statements of Comprehensive Income 4 Statements
A N N U A L R E P O R T
 First Niles Financial, Inc. 2015 ANNUAL REPORT TABLE OF CONTENTS Page No. President s Message... 1 Management s Discussion and Analysis of Financial Condition and Results of Operations... 2 Report of
FORM 10-Q TEXTRON FINANCIAL CORPORATION
 UNITED STATES SECURITIES AND EXCHANGE COMMISSION Washington, D.C. 20549 FORM 10-Q [x] QUARTERLY REPORT PURSUANT TO SECTION 13 OR 15(d) OF THE SECURITIES EXCHANGE ACT OF 1934 For the fiscal quarter ended
Great American Bancorp, Inc. Annual Report
 Great American Bancorp, Inc. Annual Report 2015 TABLE OF CONTENTS Independent Auditors Report...2 Consolidated Balance Sheets...3 Consolidated Statements of Income...4 Consolidated Statements of Comprehensive
Bank of Ocean City. Financial Statements. December 31, 2016
 Financial Statements December 31, 2016 Table of Contents Page Report of Independent Auditors 1 Financial Statements Balance Sheets 2 Statements of Income 3 Statements of Comprehensive Income 4 Statements
Atlantic Community Bankers Bank and Subsidiary
 Atlantic Community Bankers Bank and Subsidiary Financial Statements December 31, 2015 Table of Contents December 31, 2015 Page Independent Auditor s Report 1 Financial Statements Consolidated Balance Sheet
Catskill Hudson Bancorp, Inc.
 Consolidated Financial Statements December 31, 2017 and 2016 The report accompanying these financial statements was issued by BDO USA, LLP, a Delaware limited liability partnership and the U.S. member
Atlantic Community Bancshares, Inc. and Subsidiary
 Atlantic Community Bancshares, Inc. and Subsidiary Financial Statements December 31, 2016 Table of Contents December 31, 2016 Page Independent Auditor s Report 1 Financial Statements Consolidated Balance
Mercantil Commercebank, N.A. and Subsidiaries (A wholly owned subsidiary of Mercantil Commercebank Florida Bancorp Inc.) Consolidated Financial
 Consolidated Financial") Mercantil Commercebank, N.A. and Subsidiaries (A wholly owned subsidiary of Mercantil Commercebank Florida Bancorp Inc.) Consolidated Financial Statements 1 Index Page(s) Report of Independent Certified
Mercantil Commercebank, N.A. and Subsidiaries (A wholly owned subsidiary of Mercantil Commercebank Florida Bancorp Inc.) Consolidated Financial Statements 1 Index Page(s) Report of Independent Certified
HOME LOAN FINANCIAL CORPORATION Coshocton, Ohio. ANNUAL REPORT June 30, 2013
 Coshocton, Ohio ANNUAL REPORT June 30, 2013 ANNUAL REPORT June 30, 2013 CONTENTS LETTER TO SHAREHOLDERS... 2 INDEPENDENT AUDITOR S REPORT... 3 CONSOLIDATED FINANCIAL STATEMENTS Consolidated Balance Sheets...
UNITED STATES SECURITIES AND EXCHANGE COMMISSION. Washington, D.C FORM 8-K
 UNITED STATES SECURITIES AND EXCHANGE COMMISSION Washington, D.C. 20549 FORM 8-K CURRENT REPORT Pursuant to Section 13 or 15(d) of the Securities Exchange Act of 1934 Date of Report (Date of earliest event
Bank of Ocean City. Financial Statements. December 31, 2015
 Financial Statements December 31, 2015 Table of Contents Page Report of Independent Auditors 1 Financial Statements Balance Sheets 2 Statements of Income 3 Statements of Comprehensive Income 4 Statements
REPORT OF INDEPENDENT AUDITORS AND CONSOLIDATED FINANCIAL STATEMENTS FOR REDSTONE FEDERAL CREDIT UNION AND SUBSIDIARIES
 REPORT OF INDEPENDENT AUDITORS AND CONSOLIDATED FINANCIAL STATEMENTS FOR REDSTONE FEDERAL CREDIT UNION AND SUBSIDIARIES June 30, 2017 and 2016 Table of Contents PAGE Report of Independent Auditors 1 2
CHEVRON FEDERAL CREDIT UNION Oakland, California. FINANCIAL STATEMENTS December 31, 2013 and 2012
 Oakland, California FINANCIAL STATEMENTS Oakland, California FINANCIAL STATEMENTS CONTENTS INDEPENDENT AUDITOR S REPORT... 1 FINANCIAL STATEMENTS STATEMENTS OF FINANCIAL CONDITION... 3 STATEMENTS OF INCOME...
UNITED STATES SECURITIES AND EXCHANGE COMMISSION WASHINGTON, DC FORM 10-Q
 Merrill Corporation 18-8624-1 Wed Apr 25 12:18:02 2018 (V 2.4m-2-P95789CHE) C902503 c:\jms\c902503\18-8624-1\task8860238\8624-1-ba.pdf Chksum: 994515 Cycle 2.0 Doc 1 Page 1 UNITED STATES SECURITIES AND
UNITED STATES SECURITIES AND EXCHANGE COMMISSION FORM 10-Q. UnionBanCal Corporation
 UNITED STATES SECURITIES AND EXCHANGE COMMISSION Washington, D.C. 20549 È FORM 10-Q QUARTERLY REPORT PURSUANT TO SECTION 13 OR 15(d) OF THE SECURITIES EXCHANGE ACT OF 1934 For the quarterly period ended
 AMENDED LETTER TO SHAREHOLDERS O n behalf of your Board of Directors, management team and staff, I am pleased to present the annual report for the fiscal year ended December 31, 2016, for Minden Bancorp,
TEXTRON FINANCIAL CORPORATION
 UNITED STATES SECURITIES AND EXCHANGE COMMISSION Washington, D.C. 20549 Form 10-Q QUARTERLY REPORT PURSUANT TO SECTION 13 OR 15(d) OF THE SECURITIES EXCHANGE ACT OF 1934 n For the fiscal quarter ended
UNITED STATES SECURITIES AND EXCHANGE COMMISSION FORM 10-Q. Prudential Bancorp, Inc. (Exact Name of Registrant as Specified in Its Charter)
") UNITED STATES SECURITIES AND EXCHANGE COMMISSION Washington, DC 20549 FORM 10-Q (Mark One) QUARTERLY REPORT PURSUANT TO SECTION 13 OR 15(d) OF THE SECURITIES EXCHANGE ACT OF 1934 For the quarterly period
UNITED STATES SECURITIES AND EXCHANGE COMMISSION Washington, DC 20549 FORM 10-Q (Mark One) QUARTERLY REPORT PURSUANT TO SECTION 13 OR 15(d) OF THE SECURITIES EXCHANGE ACT OF 1934 For the quarterly period
UNITED STATES SECURITIES AND EXCHANGE COMMISSION FORM 10-Q. UnionBanCal Corporation
 UNITED STATES SECURITIES AND EXCHANGE COMMISSION Washington, D.C. 20549 FORM 10-Q (Mark One) QUARTERLY REPORT PURSUANT TO SECTION 13 OR 15(d) OF THE SECURITIES EXCHANGE ACT OF 1934 For the quarterly period
M&T BANK CORP FORM 8-K/A. (Amended Current report filing) Filed 01/15/16 for the Period Ending 11/01/15
 Filed 01/15/16 for the Period Ending 11/01/15") M&T BANK CORP FORM 8-K/A (Amended Current report filing) Filed 01/15/16 for the Period Ending 11/01/15 Address C/O CORPORATE REPORTING ONE M&T PLAZA 5TH FLOOR BUFFALO, NY 14203 Telephone 7168425390 CIK
M&T BANK CORP FORM 8-K/A (Amended Current report filing) Filed 01/15/16 for the Period Ending 11/01/15 Address C/O CORPORATE REPORTING ONE M&T PLAZA 5TH FLOOR BUFFALO, NY 14203 Telephone 7168425390 CIK
UNITED STATES SECURITIES AND EXCHANGE COMMISSION FORM 10-Q. UnionBanCal Corporation
 UNITED STATES SECURITIES AND EXCHANGE COMMISSION Washington, D.C. 20549 FORM 10-Q (Mark One) QUARTERLY REPORT PURSUANT TO SECTION 13 OR 15(d) OF THE SECURITIES EXCHANGE ACT OF 1934 For the quarterly period
Financial Report December 31, 2015
 Financial Report December 31, 2015 Contents Independent auditor s report 1 Financial statements Balance sheets 2 Statements of income 3 Statements of changes in stockholders equity 4 Statements of cash
Ben Franklin Financial, Inc. 830 E. Kensington Road Arlington Heights, IL (847)
") Ben Franklin Financial, Inc. 830 E. Kensington Road Arlington Heights, IL 60004 (847) 398-0990 Financial Report For the Six Months Ended June 30, 2014 Note: This report is intended to be read in conjunction
Ben Franklin Financial, Inc. 830 E. Kensington Road Arlington Heights, IL 60004 (847) 398-0990 Financial Report For the Six Months Ended June 30, 2014 Note: This report is intended to be read in conjunction
Financial Statements and Report of Independent Certified Public Accountants. Bank-Fund Staff Federal Credit Union. December 31, 2013 and 2012
 Financial Statements and Report of Independent Certified Public Accountants Bank-Fund Staff Federal Credit Union Contents Report of Independent Certified Public Accountants 3 Page Financial Statements
Umpqua Holdings Corporation (Exact Name of Registrant as Specified in Its Charter)
") Page 1 of 62 10-Q 1 d10q.htm FORM 10-Q UNITED STATES SECURITIES AND EXCHANGE COMMISSION WASHINGTON, D.C. 20549 FORM 10-Q Quarterly Report Pursuant to Section 13 or 15(d) of the Securities Exchange Act
Page 1 of 62 10-Q 1 d10q.htm FORM 10-Q UNITED STATES SECURITIES AND EXCHANGE COMMISSION WASHINGTON, D.C. 20549 FORM 10-Q Quarterly Report Pursuant to Section 13 or 15(d) of the Securities Exchange Act
TEXTRON FINANCIAL CORPORATION
 UNITED STATES SECURITIES AND EXCHANGE COMMISSION Washington, D.C. 20549 Form 10-Q QUARTERLY REPORT PURSUANT TO SECTION 13 OR 15(d) OF THE SECURITIES EXCHANGE ACT OF 1934 n For the fiscal quarter ended
FINANCIAL STATEMENTS DECEMBER 31, 2016
 FINANCIAL STATEMENTS DECEMBER 31, 2016 PO Box 1430 18 Georgia Heritage Place Dallas, GA 30132 P: 770.445.8888 F: 770.445.8889 www.georgiaheritagebank.com GEORGIA HERITAGE BANK FINANCIAL REPORT DECEMBER
PILGRIM BANCSHARES, INC. (Exact name of registrant as specified in its charter)
") UNITED STATES SECURITIES AND EXCHANGE COMMISSION Washington, D.C. 20549 (Mark One) FORM 10-Q QUARTERLY REPORT PURSUANT TO SECTION 13 OR 15(d) OF THE SECURITIES EXCHANGE ACT OF 1934 For the quarterly period
UNITED STATES SECURITIES AND EXCHANGE COMMISSION Washington, D.C. 20549 (Mark One) FORM 10-Q QUARTERLY REPORT PURSUANT TO SECTION 13 OR 15(d) OF THE SECURITIES EXCHANGE ACT OF 1934 For the quarterly period
 SELECTED FINANCIAL DATA (dollars in thousands, except share and per share data) Years Ended December 31 2014 2013 2012 2011 2010 SUMMARY OF OPERATIONS: Total interest income.. $ 36,355 $ 35,958 $ 39,001
PEOPLE S UNITED FINANCIAL, INC.
 UNITED STATES SECURITIES AND EXCHANGE COMMISSION Washington, D.C. 20549 FORM 10-Q QUARTERLY REPORT PURSUANT TO SECTION 13 OR 15(d) OF THE SECURITIES EXCHANGE ACT OF 1934 For the quarterly period ended
Financial Statements Years Ended December 31, 2015 and 2014
 Financial Statements Years Ended December 31, 2015 and 2014 Report to Shareholders As Providence Bank (the Bank ) concludes its tenth year of operations, I believe the Bank has successfully operated under
AJS BANCORP, INC. Midlothian, Illinois. CONSOLIDATED FINANCIAL STATEMENTS December 31, 2010 and 2009
 Midlothian, Illinois CONSOLIDATED FINANCIAL STATEMENTS Midlothian, Illinois CONSOLIDATED FINANCIAL STATEMENTS CONTENTS REPORT OF INDEPENDENT AUDITORS... 1 CONSOLIDATED FINANCIAL STATEMENTS CONSOLIDATED
UNITED STATES SECURITIES AND EXCHANGE COMMISSION Washington, D.C FORM 10-Q
 (Mark One) UNITED STATES SECURITIES AND EXCHANGE COMMISSION Washington, D.C. 20549 FORM 10-Q QUARTERLY REPORT PURSUANT TO SECTION 13 OR 15(d) OF THE SECURITIES EXCHANGE ACT OF 1934 For the quarterly period
UNITED STATES SECURITIES AND EXCHANGE COMMISSION WASHINGTON, DC FORM 10-Q. For the quarterly period ended September 30, 2018
 UNITED STATES SECURITIES AND EXCHANGE COMMISSION WASHINGTON, DC 20549 FORM 10-Q (Mark One) QUARTERLY REPORT PURSUANT TO SECTION 13 OR 15(d) OF THE SECURITIES EXCHANGE ACT OF 1934 For the quarterly period
Home Financial Bancorp
 Auditor s Report and Consolidated Financial Statements Contents Independent Auditor s Report... 1 Consolidated Financial Statements Balance Sheets... 3 Statements of Income... 4 Statements of Comprehensive
Mercantil Commercebank, N.A. and Subsidiaries (A wholly owned subsidiary of Mercantil Commercebank Florida Bancorp Inc.) Consolidated Financial
 Consolidated Financial") Mercantil Commercebank, N.A. and Subsidiaries (A wholly owned subsidiary of Mercantil Commercebank Florida Bancorp Inc.) Consolidated Financial Statements Index Page(s) Report of Independent Certified
Mercantil Commercebank, N.A. and Subsidiaries (A wholly owned subsidiary of Mercantil Commercebank Florida Bancorp Inc.) Consolidated Financial Statements Index Page(s) Report of Independent Certified
FIRST NATIONAL BANK ALASKA Anchorage, Alaska. FINANCIAL STATEMENTS December 31, 2015 and 2014
 Anchorage, Alaska FINANCIAL STATEMENTS Anchorage, Alaska FINANCIAL STATEMENTS CONTENTS INDEPENDENT AUDITOR S REPORT... 1 FINANCIAL STATEMENTS STATEMENTS OF FINANCIAL CONDITION... 3 STATEMENTS OF INCOME...
Stonebridge Bank and Subsidiaries
 Stonebridge Bank and Subsidiaries Consolidated Financial Statements December 31, 2016 and 2015 The report accompanying these financial statements was issued by BDO USA, LLP, a Delaware limited liability