Yirendai Reports Fourth Quarter and Full Year 2016 Financial Results
|
|
|
- Noreen Barton
- 6 years ago
- Views:
Transcription
1 Yirendai Reports Fourth Quarter and Full Year 2016 Financial Results BEIJING, March 15, 2017 Yirendai Ltd. (NYSE: YRD) ( Yirendai or the Company ), a leading online consumer finance marketplace in China, today announced its unaudited financial results for the quarter and full year ended. Starting from the second quarter of 2016, the Company changed its reporting currency from the U.S. dollar ( US$ ) to the Renminbi ( RMB ), to reduce the impact of increased volatility of the RMB to US$ exchange rate on the Company s reported operating results. The aligning of the reporting currency with the underlying operations will better depict the Company s results of operations for each period. This release contains translations of certain RMB amounts into US$ for convenience 1. Prior period numbers have been recast into the new reporting currency. For Three Months Ended For Twelve Months Ended in RMB million 31, 2015 YoY Change 31, 2015 YoY Change Amount of Loans Facilitated 6, , % 20, , % Total Net Revenue 1, % 3, , % Total Fees Billed (non-gaap) 1, % 4, , % Net Income % 1, % Adjusted EBITDA (non-gaap) % 1, % In the fourth quarter of 2016, Yirendai facilitated RMB 6,675.2 million (US$961.4 million) of loans to 110,785 qualified individual borrowers on its online marketplace, representing a 102% year-over-year growth; 57% of the borrowers were acquired from online channels; 37% of the loan volume was originated from online channels and 98.8% of the online volume was facilitated through the Yirendai mobile application. In the fourth quarter of 2016, Yirendai facilitated 194,505 investors with total investment amount of RMB 7,806.9 million (US$1,124.4 million), 100% of which was facilitated through its online platform and 85.0% of which was facilitated through its mobile application. For the fourth quarter of 2016, total net revenue was RMB 1,071.1 million (US$154.3 million), up by 137% from the same period in 2015; net income was RMB million (US$54.7 million), representing an increase of 356% from the same period in In the full year of 2016, Yirendai facilitated RMB 20,277.9 million (US$2,920.6 million) of loans to 321,019 qualified individual borrowers on its online marketplace, representing a 112% year-over-year growth; 57% of the borrowers were acquired from online channels; 38% of the loan volume was originated from online channels and 97.8% of the online volume was facilitated through the Yirendai mobile application. 1 Unless otherwise noted, all translations from RMB to U.S. dollars are made at a rate of RMB to US$1.00, the effective noon buying rate for 30, 2016 as set forth in the H.10 statistical release of the Federal Reserve Board. 1 / 13
2 In the full year of 2016, Yirendai facilitated 597,765 investors with total investment amount of RMB 25,038.3 million (US$3,606.3 million), 100% of which was facilitated through its online platform and 83.0% of which was facilitated through its mobile application. For the full year of 2016, total net revenue was RMB 3,238.0 million (US$466.4 million), up 146% from the same period in 2015; net income was RMB 1,116.4 million (US$160.8 million), representing an increase of 305% from the same period in The fourth quarter of 2016 continued to be strong for us as our loan facilitation volume reached another record high of RMB 6.7 billion, commented Ms. Yihan Fang, Chief Executive Officer of Yirendai. In the past year, we executed a number of initiatives to drive our business growth and enhance our market leadership. We have made remarkable achievements in many fronts, including new product development, credit underwriting, risk management and new partnerships. In our effort to set up best practice in the industry, we have been in frequent communication with governmental authorities relating to the regulatory requirements. In 2017, we will ensure our full compliance with regulatory requirements. In addition, we will continue to invest in brand building and customer engagement for both borrowers and investors. Furthermore, we are committed to driving the robust momentum of business growth by establishing strong partnerships with vertical industries and financial institutions and leveraging the Yirendai Enabling Platform that we launched recently. Our solid financial results were mainly driven by the robust growth of loan origination and generally stable operating cost and expenses, said Mr. Dennis Cong, Chief Financial Officer of Yirendai. Looking into 2017, we are seeing a healthier business environment as the regulation-driven industry consolidation continues. We will continue to grow our marketplace lending business and explore new revenue opportunities by leveraging our established customer base. At the same time, we will enhance cooperation with industry partners to improve customer acquisition efficiency and reduce funding cost. We are confident to continue the momentum of business growth and set our corporate goal of reaching RMB 100 billion loan origination volume per year in Fourth Quarter 2016 Financial Results Total amount of loans facilitated in the fourth quarter of 2016 was RMB 6,675.2 million (US$961.4 million), increased by 102% year over year from RMB 3,301.5 million in the same period of 2015, reflecting strong demand for our products and services. As of, the Yirendai platform had facilitated approximately RMB 32.3 billion (US$4.7 billion) in loan principal since its inception. Total net revenue in the fourth quarter of 2016 was RMB 1,071.1 million (US$154.3 million), increased by 137% from RMB million in the same period of The increase of total net revenue was mainly attributable to the growth of loan origination volume. Total fees billed (non-gaap) in the fourth quarter of 2016 were RMB 1,630.4 million (US$234.8million), increased by 111% from RMB million in the same period of 2015, driven 2 / 13
3 by the growth of loan origination volume. Upfront fees billed to borrowers in the fourth quarter of 2016 were RMB 1,468.3 million (US$211.5 million), increased by 100% from RMB million in the same period of Monthly fees billed to borrowers in the fourth quarter of 2016 were RMB million (US$18.9 million), increased by 223% from RMB 40.6 million in the same period of The significant year-over-year increase of monthly fees billed to borrowers was primarily attributable to the increase of loans generated from online channels, which features a fee collection schedule with monthly payments in addition to the upfront portion. Service fees billed to investors in the fourth quarter of 2016 were RMB million (US$19.6 million), increased by 196% from RMB 45.9 million in the same period of Operating costs and expenses in the fourth quarter of 2016 were RMB million (US$97.3 million), compared to RMB million in the previous quarter and RMB million in the same period of Sales and marketing expenses in the fourth quarter of 2016 were RMB million (US$77.5 million), compared to RMB million in the previous quarter and RMB million in the same period of Sales and marketing expenses in the fourth quarter of 2016 accounted for 8.1% of amount of loans facilitated, increased from 7.5% in the previous quarter and 7.4% in the same period of Origination and servicing costs in the fourth quarter of 2016 were RMB 58.0 million (US$8.3 million), compared to RMB 62.4 million in the previous quarter and RMB 38.7 million in the same period of Origination and servicing costs in the fourth quarter of 2016 accounted for 0.9% of amount of loans facilitated, decreased from 1.1% in the previous quarter and 1.2% in the same period of General and administrative expenses in the fourth quarter of 2016 were RMB 79.7 million (US$11.5 million), compared to RMB million in the previous quarter and RMB 44.8 million in the same period of General and administrative expenses in the fourth quarter of 2016 accounted for 7.4% of total net revenue, decreased from 21.6% in the previous quarter and 9.9% in the same period of In the third quarter of 2016, the Company recognized an expense of RMB 81.3 million related to an organized fraud incident. Excluding the expense mentioned above, general and administrative expenses in the third quarter of 2016 was RMB million, accounting for 12.3% of total net revenue. The decrease of general and administrative expenses as percentage of total net revenue was primarily attributable to the improved operating leverage. Income tax expense in the fourth quarter of 2016 was RMB 30.7 million (US$4.4 million), compared to income tax expense of RMB 44.8 million in the same period of The decrease of income tax expense was primarily because the Company s subsidiary Yi Ren Heng Ye Technology Development (Beijing) Co., Ltd. became qualified as a software enterprise which is confirmed by local tax bureau and makes it eligible for an exemption of enterprise income tax for 2015 and 2016 and a favorable enterprise income tax rate of 12.5% for 2017, 2018 and Net income in the fourth quarter of 2016 was RMB million (US$54.7 million), increased by 3 / 13
4 356% from RMB 83.3 million in the same period of Adjusted EBITDA (non-gaap) in the fourth quarter of 2016 was RMB million (US$57.8 million), increased by 82% from RMB million in the previous quarter and 217% from RMB million in the same period of Basic income per ADS in the fourth quarter of 2016 was RMB 6.36 (US$0.92), increased by 10% from RMB 5.76 in the previous quarter and 291% from RMB 1.62 in the same period of Diluted income per ADS in the fourth quarter of 2016 was RMB 6.28 (US$0.91), increased by 10% from RMB 5.70 in the previous quarter and 287% from RMB 1.62 in the same period of Net cash generated from operating activities 2 in the fourth quarter of 2016 was RMB million (US$120.4 million), increased by 86% from RMB million in the previous quarter and 150% from RMB million in the same period of As of, cash and cash equivalents excluding the risk reserve fund balance was RMB million (US$ million), compared to RMB 1,106.3 million as of September 30, The decrease of cash and cash equivalents was primarily due to the Company s increased investment in short-term assets, presented as available-for-sale investments and held-to-maturity investments on balance sheet, to enhance its return from operating cash. As of, balance of held-to-maturity investments was RMB 98.9 million (US$14.2 million) and balance of available-for-sale investments was RMB 1,158.0 million (US$166.8 million), compared to balance of held-to-maturity investments of RMB million and balance of available-for-sale investments of RMB million as of September 30, Risk Reserve Fund. In the fourth quarter of 2016, Yirendai set aside in the risk reserve fund an amount of RMB million (US$69.2 million), which is equal to 7% of the loans facilitated through its marketplace 3 during the period. In the fourth quarter of 2016, the Company made payments in a total amount of RMB million (US$42.7 million) out of the risk reserve fund to pay out the outstanding principal and accrued interest of default loans. As of, restricted cash balance associated with the risk reserve fund was RMB 1,114.8 million (US$160.6 million), compared to RMB million as of September 30, As of, the principal balance of performing loans 4 covered by the risk reserve fund was RMB 20,103.0 million (US$2,895.4 million), compared to RMB 16,204.6 million as of September 30, In the fourth quarter of 2016, Yirendai accrued liabilities from risk reserve fund guarantee of RMB 2 Starting from the fourth quarter of 2016, the Company early adopt ASU , that includes restricted cash in cash and cash equivalent balances in the statement of cash flows, and apply to all periods presented retrospectively. 3 In the fourth quarter of 2016, the Company facilitated RMB 64.6 million (US$9.3 million) of loans invested by a trust, which was not covered by the risk reserve fund. The Company transferred cash to the trust in an amount equal to 7% of the loan amount as a security fund to protect the trust from potential losses resulting from defaults of these loans. 4 Performing loans refer to loans on which payments of interest and principal are less than 90 days past due. 4 / 13
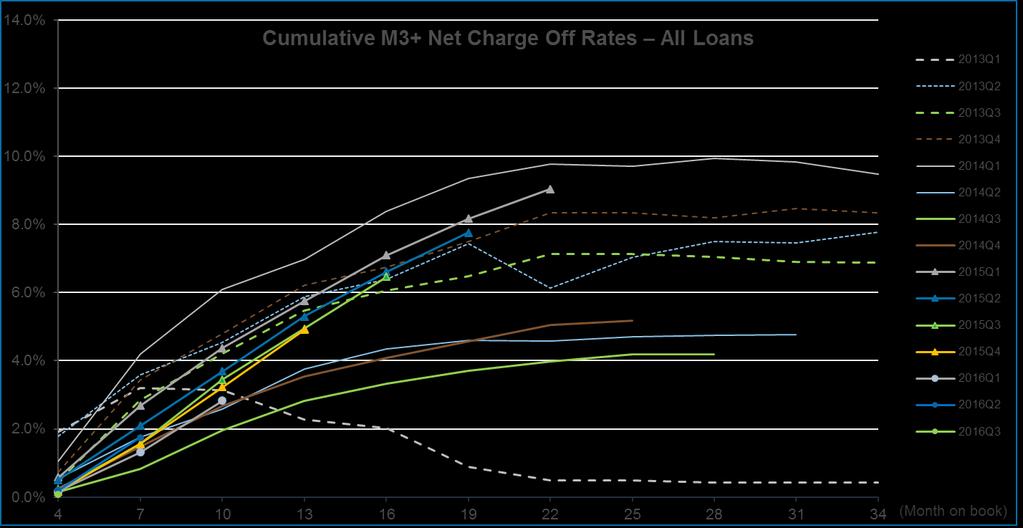
5 528.9 million (US$76.2 million), which is equal to 8% of the loans facilitated through its marketplace during the period. During the quarter, the Company released liabilities of RMB million (US$42.7 million) to pay out the outstanding principal and accrued interest of default loans. As of, liabilities from risk reserve fund guarantee was RMB 1,471.0 million (US$211.9 million). Delinquency rates. As of, the overall delinquency rate for loans that are days past due was 1.7%, decreased from 1.9% as of September 30, The decrease of delinquency rates was due to the increase of loan facilitation volume and more efficient risk management for loans generated from offline channels. Cumulative M3+ net charge-off rates 5. As of, the cumulative M3+ net charge-off rates for Grade A, B, C, and D loans originated in 2015 were 5.1%, 6.6%, 8.2% and 6.7%, respectively, compared to 4.6%, 5.3%, 6.7% and 5.2% as of September 30, As the 2015 vintage loans continues to mature, the charge off level is consistent with our risk performance expectation. Other Operating Metrics and Business Results As of, Yirendai had facilitated RMB 32.3 billion (US$4.7 billion) of loans on the Yirendai online marketplace since its inception in As of, remaining principal of performing loans totaled RMB 20.8 billion (US$3.0 billion), increased by 22% from RMB 17.0 billion as of September 30, 2016 and 132% from RMB 9.0 billion as of 31, In the fourth quarter of 2016, the Yirendai platform facilitated loans for 110,785 borrowers, 57% of whom were acquired from online channels. Total amount of loans facilitated in the fourth quarter of 2016 was RMB 6,675.2 million (US$961.4 million); 37% of the loans was originated from online channel, and 98.8% of the online volume was facilitated through Yirendai s mobile application. In the fourth quarter of 2016, the Yirendai platform facilitated loans for 194,505 investors, 100% of whom were acquired from online channels, with annual rates of return ranging from 5.00% to 11.25%. In the fourth quarter of 2016, loans made to Grade A, B, C, and D borrowers represented 4.3%, 3.2%, 4.7% and 87.8% of the Company s product portfolio, respectively. Business Outlook Based on the information available as of the date of this press release, Yirendai provides the following outlook, which reflects the Company s current and preliminary view and is subject to change. The 5 Starting from the fourth quarter of 2016, the Company adjusted the calculation of M3+ net charge-off rate to better reflect the performance of loans. The related numbers reported in prior periods have been adjusted for comparison to the numbers as of. The adjusted M3+ net charge-off rate, with respect to loans facilitated during a specified time period, which we refer to as a vintage, is defined as the difference between (i) the total balance of outstanding principal of loans that become over three months delinquent during a specified period and (ii) the total amount of recovered past due payments of principal and accrued interest in the same period with respect to all loans in the same vintage that have ever become over three months delinquent, divided by (iii) the total initial principal of the loans facilitated in such vintage. 5 / 13
6 following outlook does not take into consideration the impact of stock-based compensation expenses. First Quarter 2017 Total loans facilitated will be in the range of RMB 6,400 million to RMB 6,500 million (US$922 million to US$936 million). Total net revenue will be in the range of RMB 900 million to RMB 930 million (US$130 million to US$134 million). Adjusted EBITDA (non-gaap) will be in the range of RMB 280 million to RMB 300 million (US$40 million to US$43 million). Full Year 2017 Total loans facilitated will be in the range of RMB 33,000 million to RMB 35,000 million (US$4,753 million to US$5,041 million). Total net revenue will be in the range of RMB 4,400 million to RMB 4,600 million (US$634 million to US$663 million). Adjusted EBITDA margin (non-gaap) will be in the range of 23% to 26%. Non-GAAP Financial Measures In evaluating the business, the Company considers and uses several non-gaap financial measures, such as fees billed and adjusted EBITDA as supplemental measures to review and assess operating performance. We believe that fees billed and adjusted EBITDA provide useful information about our core operating results, enhance the overall understanding of our past performance and prospects and allow for greater visibility with respect to key metrics used by our management in our financial and operational decision-making. The presentation of these non-gaap financial measures is not intended to be considered in isolation or as a substitute for the financial information prepared and presented in accordance with accounting principles generally accepted in the United States of America ( U.S. GAAP ). The non-gaap financial measures have limitations as analytical tools. Other companies, including peer companies in the industry, may calculate these non-gaap measures differently, which may reduce their usefulness as a comparative measure. The Company compensates for these limitations by reconciling the non-gaap financial measures to the nearest U.S. GAAP performance measure, all of which should be considered when evaluating our performance. See Operating Highlights and Reconciliation of GAAP to Non-GAAP measures at the end of this press release. Currency Conversion Effective April 1, 2016, the Company changed its reporting currency from US$ to RMB. The change in reporting currency is to reduce the impact of increased volatility of the RMB to the US$ exchange rate on the Company s reported operating results. The aligning of the reporting currency with the underlying operations will better depict the Company s results of operations for each period. Prior to April 1, 2016, the Company reported its annual and quarterly consolidated statement of operations, cash flow data and balance sheet in US$. In this announcement, the unaudited financial results for the quarter ended are stated in RMB. The related financial statements prior to April 1, 2016 have been recast to reflect RMB as the reporting currency for comparison to the financial results for the quarter and the year ended. 6 / 13
7 This announcement contains currency conversions of certain RMB amounts into US$ at specified rates solely for the convenience of the reader. Unless otherwise noted, all translations from RMB to US$ are made at a rate of RMB to US$1.00, the effective noon buying rate for 30, 2016 as set forth in the H.10 statistical release of the Federal Reserve Board. Conference Call Yirendai will host a conference call to discuss about its fourth quarter and full year 2016 financial results at 8:00 AM U.S. Eastern Time on March 16, 2017, which corresponds to 8:00 PM Beijing/Hong Kong time on the same day. The dial-in details for the live conference call are as follows: International: U.S. Toll Free: Hong Kong Toll Free: China Toll Free: Conference ID: Yirendai A replay of the conference call will be available until March 23, 2017 by dialing: International: U.S. Toll Free: Replay Access Code: A live and archived webcast of the conference call will be available on Yirendai s website at yirendai.investorroom.com. Safe Harbor Statement This press release contains forward-looking statements. These statements constitute forward-looking statements within the meaning of Section 21E of the Securities Exchange Act of 1934, as amended, and as defined in the U.S. Private Securities Litigation Reform Act of These forward-looking statements can be identified by terminology such as will, expects, anticipates, future, intends, plans, believes, estimates, target, confident and similar statements. Such statements are based upon management s current expectations and current market and operating conditions, and relate to events that involve known or unknown risks, uncertainties and other factors, all of which are difficult to predict and many of which are beyond Yirendai s control. Forward-looking statements involve risks, uncertainties and other factors that could cause actual results to differ materially from those contained in any such statements. Potential risks and uncertainties include, but are not limited to, uncertainties as to Yirendai s ability to attract and retain borrowers and investors on its marketplace, its ability to introduce new loan products and platform enhancements, its ability to compete effectively, PRC regulations and policies relating to the peer-to-peer lending service industry in China, general economic conditions in China, and Yirendai s ability to meet the standards necessary to maintain listing of its ADSs on the NYSE or other stock exchange, including its ability to cure any non-compliance with the NYSE s continued listing criteria. Further information regarding these and other risks, uncertainties or factors is included in Yirendai s filings with the U.S. Securities and Exchange Commission. All information provided in this press 7 / 13
8 release is as of the date of this press release, and Yirendai does not undertake any obligation to update any forward-looking statement as a result of new information, future events or otherwise, except as required under applicable law. About Yirendai Yirendai Ltd. (NYSE: YRD) is a leading online consumer finance marketplace in China connecting investors and individual borrowers. The Company provides an effective solution to address largely underserved investor and individual borrower demand in China through an online platform that automates key aspects of its operations to efficiently match borrowers with investors and execute loan transactions. Yirendai deploys a proprietary risk management system, which enables the Company to effectively assess the creditworthiness of borrowers, appropriately price the risks associated with borrowers, and offer quality loan investment opportunities to investors. Yirendai s online marketplace provides borrowers with quick and convenient access to consumer credit at competitive prices and investors with easy and quick access to an alternative asset class with attractive returns. For more information, please visit yirendai.investorroom.com. For investor and media inquiries, please contact: Yirendai Hui (Matthew) Li Director of Investor Relations matthewli@yirendai.com Christensen IR In China Christian Arnell Phone: +86 (0) carnell@christensenir.com In U.S. Linda Bergkamp Phone: +1 (480) lbergkamp@christensenir.com 8 / 13
9 Unaudited Condensed Consolidated Statements of Operations (in thousands, except for share, per share and per ADS data, and percentages) For the Three Months Ended For the Year Ended 31, 2015 September 30, , 2015 RMB RMB RMB USD RMB RMB USD Net revenue: Loan facilitation services 436, ,322 1,036, ,306 1,278,539 3,133, ,307 Post-origination services 12,586 23,487 25,039 3,606 27,086 84,154 12,121 Others 2,881 4,902 9,441 1,360 8,014 20,414 2,940 Total net revenue 451, ,711 1,071, ,272 1,313,639 3,237, ,368 Operating costs and expenses: Sales and marketing 243, , ,953 77, ,771 1,571, ,277 Origination and servicing 38,680 62,449 57,955 8,347 97, ,811 28,778 General and administrative 44, ,961 79,714 11, , ,111 57,916 Total operating costs and expenses 326, , ,622 97, ,578 2,172, ,971 Interest income 3,114 9,778 14,778 2,128 4,799 36,843 5,306 Non operating income, net Income before provision for income taxes 128, , ,491 59, ,860 1,102, ,786 Income tax expense/(benefit) 44,835 (131,946) 30,710 4, ,521 (13,949) (2,009) Net income 83, , ,781 54, ,339 1,116, ,795 shares used in computing basic net income per share 102,586, ,441, ,493, ,493, ,652, ,240, ,240,414 Basic income per share Basic income per ADS shares used in computing diluted net income per share 102,586, ,861, ,859, ,859, ,652, ,937, ,937,082 Diluted income per share Diluted income per ADS Unaudited Condensed Consolidated Balance Sheets Cash and cash equivalents 846,120 1,106, , , , , ,453 Restricted cash 483, ,345 1,218, , ,965 1,218, ,470 Loans at fair value 221, , ,033 53, , ,033 53,440 Held-to-maturity investments 30, ,500 98,917 14,247 30,000 98,917 14,247 Available-for-sale investments - 298,000 1,158, ,787-1,158, ,787 Other assets 608,650 1,111, , , , , ,555 Total assets 2,190,003 4,031,002 4,783, ,952 2,190,003 4,783, ,952 Liabilities from risk reserve fund guarantee 546,332 1,238,689 1,471, , ,332 1,471, ,868 Payable to investors at fair value 252, , ,686 60, , ,686 60,303 Other liabilities 413, , , , , , ,568 Total liabilities 1,213,060 2,289,936 2,643, ,739 1,213,060 2,643, ,739 Total equity 976,943 1,741,066 2,139, , ,943 2,139, ,213 Unaudited Condensed Consolidated Cash Flow Data Net cash generated from operating 334, , , , ,277 2,113, ,398 Net cash provided by/(used in) investing activities (194,918) (679,486) (807,744) (116,339) (282,589) (1,421,663) (204,762) Net cash (used in)/provided by financing activities 749, ,221 60,400 8, , ,298 19,487 Effect of foreign exchange rate changes 359 1,323 17,193 2, ,356 4,228 Net increase/(decrease) in cash and cash equivalents 890,060 (48,359) 105,904 15,253 1,328, , ,351 Cash, cash equivalents and restricted cash, beginning of period 440,025 2,128,966 2,080, ,670 1,378 1,330, ,572 Cash, cash equivalents and restricted cash, end of period 1,330,085 2,080,607 2,186, ,923 1,330,085 2,186, ,923 9 / 13
10 Operating Highlights and Reconciliation of GAAP to Non-GAAP Measures (in thousands, except for number of borrowers, number of investors and percentages) For the Three Months Ended For the Year Ended 31, 2015 September 30, , 2015 RMB RMB RMB USD RMB RMB USD Operating Highlights: Amount of loans facilitated 3,301,547 5,617,485 6,675, ,435 9,557,613 20,277,927 2,920,629 Loans generated from online channels 1,135,590 2,275,473 2,462, ,716 3,152,272 7,745,724 1,115,616 Loans generated from offline channels 2,165,957 3,342,012 4,212, ,719 6,405,341 12,532,203 1,805,013 Fees billed 773,581 1,322,598 1,630, ,821 2,154,099 4,911, ,363 Remaining principal of performing loans 8,969,949 17,028,346 20,780,617 2,993,031 8,969,949 20,780,617 2,993,031 Remaining principal of performing loans covered by risk reserve fund 7,690,401 16,204,583 20,103,043 2,895,440 7,690,401 20,103,043 2,895,440 Number of borrowers 48,072 92, , , , , ,019 Borrowers from online channels 25,506 54,585 63,010 63,010 74, , ,430 Borrowers from offline channels 22,566 37,894 47,775 47,775 72, , ,589 Number of investors 177, , , , , , ,765 Investors from online channels 177, , , , , , ,765 Investors from offline channels , Adjusted EBITDA 126, , ,146 57, ,696 1,093, ,488 Adjusted EBITDA margin 28.0% 25.2% 37.5% 37.5% 30.7% 33.8% 33.8% Reconciliation of Net Revenues Fees billed: Transaction fees billed to borrowers 775,580 1,298,247 1,599, ,401 2,179,611 4,830, ,746 Upfront fees billed to borrowers 734,934 1,192,449 1,468, ,484 2,099,146 4,450, ,000 Monthly fees billed to borrowers 40, , ,344 18,917 80, ,101 54,746 Service fees billed to investors 45, , ,747 19,552 97, ,311 57,513 Others 3,053 5,196 10,007 1,441 8,489 21,639 3,117 Value-added tax (50,988) (91,788) (115,070) (16,573) (131,817) (340,295) (49,013) Total fees billed 773,581 1,322,598 1,630, ,821 2,154,099 4,911, ,363 Stand-ready liabilities associated with risk reserve fund (244,329) (430,569) (528,852) (76,171) (682,254) (1,598,238) (230,194) Deferred revenue (73,074) (16,553) (18,545) (2,671) (117,484) (71,322) (10,272) Cash incentives (21,964) (24,074) (42,836) (6,170) (80,952) (98,173) (14,140) Value-added tax 17,402 25,309 30,985 4,463 40,230 94,503 13,611 Net revenues 451, ,711 1,071, ,272 1,313,639 3,237, ,368 Reconciliation of EBITDA Net income 83, , ,781 54, ,339 1,116, ,795 Interest income (3,114) (9,778) (14,778) (2,128) (4,799) (36,843) (5,306) Income tax expense 44,835 (131,946) 30,710 4, ,521 (13,949) (2,009) Depreciation and amortization 1,467 2,816 3, ,635 10,609 1,528 Share-based compensation - 15,343 1, ,222 2,480 Adjusted EBITDA 126, , ,146 57, ,696 1,093, , / 13
11 Delinquency Rates Delinquent for days days days All Loans 31, % 0.4% 0.3% 31, % 0.2% 0.2% 31, % 0.5% 0.4% 0.4% 0.7% 0.6% Online Channels 31, % 0.9% 0.3% 31, % 0.3% 0.2% 31, % 0.8% 0.6% 0.6% 1.0% 0.8% Offline Channels 31, % 0.2% 0.2% 31, % 0.2% 0.2% 31, % 0.4% 0.3% 0.4% 0.6% 0.4% Net Charge-Off Rate Loan issued period Pricing grade facilitated during the period Charge-Off as of Rate as of 31, 2016 (in RMB thousands) (in RMB thousands) 2013 A 258,322 18, % B C D Total 258,322 18, % 2014 A 1,917,542 94, % B 303,030 19, % C D 7, % Total 2,228, , % 2015 A 873,995 44, % B 419,630 27, % C 557,414 45, % D 7,706, , % Total 9,557, , % 2016 A 1,111,974 2, % B 755,132 4, % C 1,417,430 14, % D 16,993, , % Total 20,277, , % 11 / 13
12 Net Charge-Off Rate Loan issued period Month on Book Q1 1.9% 3.2% 3.1% 2.3% 2.0% 0.9% 0.5% 0.5% 0.4% 0.4% 0.4% 2013Q2 1.8% 3.6% 4.5% 5.9% 6.4% 7.4% 6.1% 7.0% 7.5% 7.5% 7.8% 2013Q3 0.5% 2.8% 4.2% 5.5% 6.1% 6.5% 7.1% 7.1% 7.0% 6.9% 6.9% 2013Q4 0.7% 3.4% 4.8% 6.2% 6.8% 7.5% 8.3% 8.3% 8.2% 8.5% 8.3% 2014Q1 1.0% 4.2% 6.1% 7.0% 8.4% 9.3% 9.8% 9.7% 9.9% 9.8% 9.5% 2014Q2 0.5% 1.8% 2.6% 3.8% 4.3% 4.6% 4.6% 4.7% 4.7% 4.8% 2014Q3 0.2% 0.8% 2.0% 2.8% 3.3% 3.7% 4.0% 4.2% 4.2% 2014Q4 0.3% 1.5% 2.7% 3.5% 4.1% 4.6% 5.1% 5.2% 2015Q1 0.6% 2.7% 4.4% 5.8% 7.1% 8.2% 9.0% 2015Q2 0.5% 2.1% 3.7% 5.3% 6.6% 7.8% 2015Q3 0.2% 1.6% 3.4% 4.9% 6.5% 2015Q4 0.2% 1.6% 3.2% 4.9% 2016Q1 0.2% 1.3% 2.8% 2016Q2 0.2% 1.7% 2016Q3 0.1% 12 / 13
13 13 / 13
Pinduoduo Announces Fourth Quarter and Fiscal Year 2018 Results
 Pinduoduo Announces Fourth Quarter and Fiscal Year 2018 Results March 13, 2019 SHANGHAI, China, March 13, 2019 (GLOBE NEWSWIRE) -- Pinduoduo Inc. ("Pinduoduo" or the "Company") (NASDAQ: PDD), an innovative
Pinduoduo Announces Second Quarter 2018 Unaudited Financial Results
 Pinduoduo Announces Second Quarter 2018 Unaudited Financial Results SHANGHAI, CHINA August 30, 2018 Pinduoduo Inc. ("Pinduoduo" or the "Company") (NASDAQ:PDD), an innovative and fast growing new e-commerce
Pinduoduo Announces Third Quarter 2018 Unaudited Financial Results
 Pinduoduo Announces Third Quarter 2018 Unaudited Financial Results SHANGHAI, CHINA November 20, 2018 Pinduoduo Inc. ("Pinduoduo" or the "Company") (NASDAQ:PDD), an innovative and fast growing new e-commerce
Baozun Announces Third Quarter 2018 Unaudited Financial Results
 Baozun Announces Third Quarter 2018 Unaudited Financial Results SHANGHAI, CHINA November 21, 2018 Baozun Inc. (Nasdaq: BZUN) ("Baozun" or the "Company"), the leading brand e-commerce service partner that
Baozun Announces Fourth Quarter and Fiscal Year 2016 Unaudited Financial Results
 Baozun Announces Fourth Quarter and Fiscal Year 2016 Unaudited Financial Results SHANGHAI, China, Feb. 21, 2017 (GLOBE NEWSWIRE) -- Baozun Inc. (Nasdaq:BZUN) ("Baozun" or the "Company"), the leading brand
Baozun Announces Second Quarter 2018 Unaudited Financial Results
 Baozun Announces Second Quarter 2018 Unaudited Financial Results SHANGHAI, CHINA August 14, 2018 Baozun Inc. (Nasdaq: BZUN) ("Baozun" or the "Company"), the leading brand e-commerce service partner that
Baozun Announces Second Quarter 2017 Unaudited Financial Results
 Baozun Announces Second Quarter 2017 Unaudited Financial Results SHANGHAI, CHINA August 21, 2017 Baozun Inc. (Nasdaq: BZUN) ("Baozun" or the "Company"), the leading brand e-commerce service partner that
Baozun Announces First Quarter 2017 Unaudited Financial Results
 Baozun Announces First Quarter 2017 Unaudited Financial Results SHANGHAI, CHINA May 16, 2017 Baozun Inc. (Nasdaq: BZUN) ("Baozun" or the "Company"), the leading brand e-commerce service partner that helps
Baozun Announces First Quarter 2018 Unaudited Financial Results
 Baozun Announces First Quarter 2018 Unaudited Financial Results SHANGHAI, CHINA May 17, 2018 Baozun Inc. (Nasdaq: BZUN) ("Baozun" or the "Company"), the leading brand e-commerce service partner that helps
Q Earnings Conference Call. May 22, 2017
 Q1 2017 Earnings Conference Call May 22, 2017 WARDED2014\7. Analyst Presentation\Cruise_AP_v31.pptx Safe Harbor Statement This material contains forward-looking statements. These statements constitute
58.com Reports Third Quarter 2017 Unaudited Financial Results
 58.com Reports Third Quarter 2017 Unaudited Financial Results BEIJING, November 12, 2017 --58.com Inc. (NYSE: WUBA) ( 58.com or the Company ), China s largest online market place for classifieds, today
PPDAI Group Inc. Reports Third Quarter 2018 Unaudited Financial Results
 PPDAI Group Inc. Reports Third Quarter 2018 Unaudited Financial Results SHANGHAI, November 20, 2018 /PRNewswire/ PPDAI Group Inc. ( PPDAI, Paipaidai, or the Company ) (NYSE: PPDF), a leading online consumer
New Oriental Announces Results for the Fourth Quarter and Fiscal Year Ended May 31, 2007
 New Oriental Announces Results for the Fourth Quarter and Fiscal Year Ended May 31, 2007 Beijing, July 24, 2007 New Oriental Education and Technology Group Inc. (the Company ) (NYSE: EDU), the largest
Q Earnings Conference Call. August 1, 2017
 Q2 2017 Earnings Conference Call August 1, 2017 Safe Harbor Statement This material contains forward-looking statements. These statements constitute forward-looking statements within the meaning of Section
PPDAI Group Inc. Reports Second Quarter 2018 Unaudited Financial Results
 PPDAI Group Inc. Reports Second Quarter 2018 Unaudited Financial Results SHANGHAI, August 22, 2018 /PRNewswire/ PPDAI Group Inc. ( PPDAI, Paipaidai, or the Company ) (NYSE: PPDF), a leading online consumer
News Release. Baidu Announces First Quarter 2015 Results. 4/5/2015 Baidu News Release. Print Page Close Window
 Print Page Close Window News Release Baidu Announces First Quarter 2015 Results BEIJING, April 29, 2015 /PRNewswire/ (NASDAQ: BIDU) ("Baidu" or the "Company"), the leading Chinese language Internet search
Autohome Inc. Announces Unaudited Second Quarter Ended June 30, 2017 Financial Results
 Autohome Inc. Announces Unaudited Second Quarter Ended June 30, 2017 Financial Results August 9, 2017 5:33 AM ET Net Revenues Increased 13.3% Year-over-Year to RMB1.6 Billion Net Income Attributable to
Phoenix New Media Reports Unaudited First Quarter 2018 Financial Results. Live Conference Call to be Held at 9:00 PM U.S. Eastern Time on May 14, 2018
 Phoenix New Media Reports Unaudited First Quarter 2018 Financial Results Live Conference Call to be Held at 9:00 PM U.S. Eastern Time on May 14, 2018 BEIJING, China, May 15, 2018 Phoenix New Media Limited
Uxin Reports Unaudited Third Quarter of 2018 Financial Results
 Uxin Reports Unaudited Third Quarter of 2018 Financial Results November 20, 2018 BEIJING, Nov. 20, 2018 (GLOBE NEWSWIRE) -- Uxin Limited ( Uxin or the Company ) (Nasdaq: UXIN), the largest used car e-commerce
Phoenix New Media Reports Fourth Quarter and Fiscal Year 2017 Unaudited Financial Results
 Phoenix New Media Reports Fourth Quarter and Fiscal Year 2017 Unaudited Financial Results Live Conference Call to be Held at 9:00 PM U.S. Eastern Time on March 12, 2018 BEIJING, China, March 13, 2018 Phoenix
Q Investor Presentation
 Q1 2018 Investor Presentation Safe Harbor Statement This material contains forward-looking statements. These statements constitute forward-looking statements within the meaning of Section 21E of the Securities
China Online Education Group Announces Second Quarter 2016 Results
 China Online Education Group Announces Second Quarter 2016 Results Gross billings 1 increased by 162.9% year-over-year Net revenues increased by 203.5% year-over-year Net operating cash flow reached RMB13.6
21VIANET GROUP, INC. REPORTS UNAUDITED FIRST QUARTER 2018 FINANCIAL RESULTS
 21VIANET GROUP, INC. REPORTS UNAUDITED FIRST QUARTER 2018 FINANCIAL RESULTS Adjusted EBITDA up 95.5% YoY to RMB196.0 million Adjusted EBITDA margin expanded to 24.5% from 11.6% in prior year period BEIJING,
GDS Reports Second Quarter 2018 Results
 GDS Reports Second Quarter 2018 Results GDS Holdings Limited Reports Second Quarter 2018 Results Shanghai, China, August 14, 2018 GDS Holdings Limited ( GDS Holdings, GDS or the Company ) (NASDAQ: GDS),
Phoenix New Media Reports Second Quarter 2013 Unaudited Financial Results
 Phoenix New Media Reports Second Quarter 2013 Unaudited Financial Results 2Q13 Total Revenues Up 28.5% YOY 2Q13 Net Advertising Revenues Up 41.9% YOY 2Q13 Net Income attributable to Phoenix New Media Limited
First Quarter 2018 Financial Highlights
 Leju Reports First Quarter 2018 Results BEIJING, May 28, 2018 /PRNewswire/ -- Leju Holdings Limited ("Leju" or the "Company") (NYSE: LEJU), a leading online-to-offline ("O2O") real estate services provider
Leju Reports First Quarter 2014 Results
 Page 1 Leju Reports First Quarter 2014 Results BEIJING, May 20, 2014 Leju Holdings Limited ("Leju" or the "Company") (NYSE: LEJU), a leading online-to-offline ("O2O") real estate services provider in China,
GDS Reports Fourth Quarter and Full Year 2017 Results
 GDS Reports Fourth Quarter and Full Year 2017 Results GDS Reports Fourth Quarter and Full Year 2017 Results Shanghai, China, March 13, 2018 GDS Holdings Limited ( GDS Holdings or the Company ) (NASDAQ:
Highlights for the Third Quarter of 2018
 Tuniu Announces Unaudited Third Quarter 2018 Financial Results Non-GAAP 1 Net Income in Q3 2018 Increased by 109.2% Year-Over-Year to RMB83.0 million Added 251 Offline Retail Stores During 2018 2 NANJING,
Highlights for the Fourth Quarter of 2017
 Tuniu Announces Unaudited Fourth Quarter and Fiscal Year 2017 Financial Results Net Revenues 1 in 2017 Increased by 53.3% Year-Over-Year Gross Profit in 2017 Increased by 80.9% Year-Over-Year NANJING,
ehi Car Services Announces Second Quarter 2017 Results
 ehi Car Services Announces Second Quarter Results Net revenues increased by 27.6% year-over-year to RMB639.7million Net income was RMB30.4 million comparing to RMB0.8 million year-over-year Non-GAAP adjusted
Phoenix New Media Reports Third Quarter 2014 Unaudited Financial Results
 Phoenix New Media Reports Third Quarter 2014 Unaudited Financial Results 3Q14 Net Advertising Revenues Up 45.5% YOY 3Q14 Income from Operations was RMB70.1 million 3Q14 Adjusted Income from Operations
YY Reports Fourth Quarter and Full Year 2016 Unaudited Financial Results
 YY Reports Fourth Quarter and Full Year Unaudited Financial Results Guangzhou, China, March 14, 2017 YY Inc. (NASDAQ: YY) ("YY" or the "Company"), a live streaming platform, today announced its unaudited
LexinFintech Holdings Ltd. Reports First Quarter 2018 Unaudited Financial Results
 Reports First Quarter 2018 Unaudited Financial Results SHENZHEN, China, May 21, 2018 /PRNewswire//-- ( Lexin or the Company ) (NASDAQ: LX), a leading online consumer finance platform for educated young
Uxin Reports Unaudited Second Quarter of 2018 Financial Results
 Uxin Reports Unaudited Second Quarter of 2018 Financial Results August 22, 2018 BEIJING, Aug. 22, 2018 (GLOBE NEWSWIRE) -- Uxin Limited ( Uxin or the Company ) (Nasdaq: UXIN), the largest used car e-commerce
Baidu Announces Third Quarter 2011 Results
 Baidu Announces Third Quarter 2011 Results BEIJING, China, October 27, 2011 Baidu, Inc. (NASDAQ: BIDU), the leading Chinese language Internet search provider, today announced its unaudited financial results
Phoenix New Media Reports Fourth Quarter and Fiscal Year 2018 Unaudited Financial Results
 Phoenix New Media Reports Fourth Quarter and Fiscal Year 2018 Unaudited Financial Results Live Conference Call to be Held at 9:00 PM U.S. Eastern Time on March 18, 2019 BEIJING, China, March 19, 2019 Phoenix
Secoo Reports Unaudited First Quarter 2018 Results
 Secoo Reports Unaudited First Quarter 2018 Results BEIJING, June 19, 2018 (GLOBE NEWSWIRE) -- Secoo Holding Limited ( Secoo, the Company or We ) (NASDAQ:SECO), Asia's largest online integrated upscale
Cheetah Mobile Announces First Quarter 2017 Unaudited Consolidated Financial Results
 Cheetah Mobile Announces First Quarter 2017 Unaudited Consolidated Financial Results Beijing, China, May 22, 2017 Cheetah Mobile Inc. (NYSE: CMCM) ( Cheetah Mobile or the Company ), a leading mobile internet
Huya Reports First Quarter 2018 Unaudited Financial Results
 Huya Reports First Quarter 2018 Unaudited Financial Results GUANGZHOU, China, June 5, 2018 /PRNewswire/ -- HUYA Inc. ("Huya" or the "Company") (NYSE: HUYA), a leading game live streaming platform in China,
21Vianet Group, Inc. Reports Unaudited Third Quarter 2018 Financial Results
 21Vianet Group, Inc. Reports Unaudited Third Quarter 2018 Financial Results November 20, 2018 3Q18 adjusted EBITDA margin expanded to 28.2% Raising full year 2018 adjusted EBITDA guidance BEIJING, Nov.
China Online Education Group Announces Third Quarter 2017 Results
 China Online Education Group Announces Third Quarter 2017 Results Net revenues increased by 95.1% year-over-year Gross billings 1 increased by 51.5% year-over-year BEIJING, December 4, 2017 -- China Online
Baidu Announces Second Quarter 2007 Results. Second Quarter 2007 Net Income Grows 143% Year-Over-Year
 Baidu Announces Second Quarter 2007 Results Second Quarter 2007 Net Income Grows 143% Year-Over-Year BEIJING, China, July 26, 2007 Baidu.com, Inc. (NASDAQ: BIDU), the leading Chinese language Internet
YY Reports First Quarter 2016 Unaudited Financial Results
 YY Reports First Quarter Unaudited Financial Results Guangzhou, China, May 31, YY Inc. (NASDAQ: YY) ("YY" or the "Company"), a revolutionary real-time interactive social platform, today announced its unaudited
21Vianet Group, Inc. Reports Unaudited Second Quarter 2018 Financial Results
 21Vianet Group, Inc. Reports Unaudited Second Quarter Financial Results August 16, Adjusted EBITDA up 103.6% YoY to RMB221.1 million Adjusted EBITDA margin expanded to 26.7% Raised full year guidance for
Leju Reports First Quarter 2017 Results. June 14, :00 AM ET
 Leju Reports First Quarter 2017 Results June 14, 2017 6:00 AM ET BEIJING, June 14, 2017 /PRNewswire/ -- Leju Holdings Limited ("Leju" or the "Company") (NYSE: LEJU), a leading online-to-offline ("O2O")
YY Reports Third Quarter 2016 Unaudited Financial Results
 YY Reports Third Quarter Unaudited Financial Results Guangzhou, China, November 21, YY Inc. (NASDAQ: YY) ("YY" or the "Company"), a live streaming platform, today announced its unaudited financial results
YY Reports First Quarter 2017 Unaudited Financial Results
 YY Reports First Quarter Unaudited Financial Results Guangzhou, China, May 10, YY Inc. (NASDAQ: YY) ("YY" or the "Company"), a live streaming platform, today announced its unaudited financial results for
Cheetah Mobile Announces Third Quarter 2016 Unaudited Consolidated Financial Results
 Cheetah Mobile Announces Third Quarter 2016 Unaudited Consolidated Financial Results Beijing, China, November 21, 2016 Cheetah Mobile Inc. (NYSE: CMCM) ( Cheetah Mobile or the Company ), a leading mobile
YY Reports Second Quarter 2017 Unaudited Financial Results
 YY Reports Second Quarter Unaudited Financial Results Guangzhou, China, August 10, YY Inc. (NASDAQ: YY) ("YY" or the "Company"), a leading live streaming social media platform in China, today announced
Vipshop Reports Unaudited Third Quarter 2018 Financial Results. Conference Call to Be Held at 8:00 A.M. U.S. Eastern Time on November 15, 2018
 Vipshop Reports Unaudited Third Quarter 2018 Financial Results Conference Call to Be Held at 8:00 A.M. U.S. Eastern Time on November 15, 2018 Guangzhou, China, November 14, 2018 Vipshop Holdings Limited
YY Reports Fourth Quarter and Full Year 2018 Unaudited Financial Results
 YY Reports Fourth Quarter and Full Year 2018 Unaudited Financial Results March 4, 2019 GUANGZHOU, China, March 05, 2019 (GLOBE NEWSWIRE) -- YY Inc. (NASDAQ: YY) ( YY or the Company ), a leading live streaming
Bilibili Inc. Announces Second Quarter 2018 Financial Results
 Bilibili Inc. Announces Second Quarter 2018 Financial Results SHANGHAI, August 27, 2018 -- Bilibili Inc. ( Bilibili or the Company ) (NASDAQ: BILI), a leading online entertainment platform for young generations
YY Reports Second Quarter 2017 Unaudited Financial Results
 August 10, YY Reports Second Quarter Unaudited Financial Results GUANGZHOU, China, Aug. 10, (GLOBE NEWSWIRE) -- YY Inc. (NASDAQ:YY) ("YY" or the "Company"), a leading live streaming social media platform
TAL Education Group Announces Unaudited Financial Results for the Second. Fiscal Quarter Ended August 31, 2018, and Adoption of up to US$100 Million
 TAL Education Group Announces Unaudited Financial Results for the Second Fiscal Quarter Ended August 31, 2018, and Adoption of up to US$100 Million Share Repurchase Program -Quarterly Net Revenues up by
YY Reports Fourth Quarter and Full Year 2012 Unaudited Financial Results
 March 7, 2013 YY Reports Fourth Quarter and Full Year Unaudited Financial Results 4Q12 Net Revenues Up 136.3% YOY 4Q12 Net Income of RMB33.2Million 4Q12 Non-GAAP Net Income Up 80.9% YOY GUANGZHOU, China,
21Vianet Group, Inc. Reports Fourth Quarter and Full Year 2016 Unaudited Financial Results
 March 8, 2017 21Vianet Group, Inc. Reports Fourth Quarter and Full Year 2016 Unaudited Financial Results BEIJING, March 08, 2017 (GLOBE NEWSWIRE) -- 21Vianet Group, Inc. (Nasdaq:VNET) ("21Vianet" or the
YY Reports First Quarter 2018 Unaudited Financial Results
 YY Reports First Quarter Unaudited Financial Results June 5, GUANGZHOU, China, June 06, (GLOBE NEWSWIRE) -- YY Inc. (NASDAQ:YY) ( YY or the Company ), a leading live streaming social media platform in
Niu Technologies Announces Third Quarter 2018 Financial Results
 Niu Technologies Announces Third Quarter 2018 Financial Results -- Total volume of e-scooter sales up 76.3% year over year -- Total net revenues of RMB493.2 million, up 86.1% year over year -- Net loss
Vipshop Reports Unaudited First Quarter 2016 Financial Results
 Vipshop Reports Unaudited First Quarter 2016 Financial Results 1Q16 Total Net Revenue up 41% YoY to RMB12.17 Billion (US$1.89 Billion) 1Q16 Income from Operations up 51% YoY to RMB596 Million (US$92 Million)
New Oriental Announces Results for the First Fiscal Quarter Ended August 31, 2018 and Adoption of up to US$200 Million Share Repurchase Program
 New Oriental Announces Results for the First Fiscal Quarter Ended August 31, 2018 and Adoption of up to US$200 Million Share Repurchase Program Quarterly Net Revenues Increased by 30.1% Year-Over-Year
21Vianet Group, Inc. Reports Unaudited Fourth Quarter and Full Year 2017 Financial Results
 March 12, 2018 21Vianet Group, Inc. Reports Unaudited Fourth Quarter and Full Year 2017 Financial Results Adjusted EBITDA up 228.9% YoY to RMB171.0 million Adjusted EBITDA margin expanded to 22.3% from
China Online Education Group Announces Third Quarter 2016 Results
 China Online Education Group Announces Third Quarter 2016 Results Gross billings 1 increased by 135.2% year-over-year Net revenues increased by 180.9% year-over-year BEIJING, November 21, 2016 -- China
Concord Medical Announces Fourth Quarter and Fiscal Year 2010 Financial Results Full Year Revenues up 33%, Company Opens 33 New Centers in 2010
 Concord Medical Announces Fourth Quarter and Fiscal Year 2010 Financial Results Full Year Revenues up 33%, Company Opens 33 New Centers in 2010 BEIJING, March 28, 2011 /PRNewswire-Asia-FirstCall/ -- Concord
Leju Reports Fourth Quarter and Full Year 2017 Results. March 19, :38 AM ET
 Leju Reports Fourth Quarter and Full Year 2017 Results March 19, 2018 5:38 AM ET BEIJING, March 19, 2018 /PRNewswire/ -- Leju Holdings Limited ("Leju" or the "Company") (NYSE: LEJU), a leading online-to-offline
YY Reports Second Quarter 2016 Unaudited Financial Results
 YY Reports Second Quarter Unaudited Financial Results Guangzhou, China, August 17, YY Inc. (NASDAQ: YY) ("YY" or the "Company"), a live streaming platform, today announced its unaudited financial results
Home Inns Reports Fourth Quarter and Full Year 2007 un-audited Financial Results
 Home Inns Reports Fourth Quarter and Full Year 2007 un-audited Financial Results Full Year Total Revenues Increase 71.5% Year-over-Year; Home Inns Chain Consisted of 266 Hotels in Operation as of the end
Sogou Announces First Quarter 2018 Results
 Sogou Announces First Quarter 2018 Results BEIJING, China, April 25, 2018 Sogou Inc. (NYSE: SOGO) ( Sogou or the Company ), an innovator in search and a leader in China's internet industry, today announced
China Online Education Group Announces First Quarter 2018 Results
 China Online Education Group Announces First Quarter 2018 Results First quarter net revenues increased by 64.6% year-over-year First quarter gross billings 1 increased by 9.3% year-over-year BEIJING, June
Noah Holdings Limited
 ˆ200F$ot#g%uakvnsÊ 200F$ot#g%uakvnsˆ VDI-W7-PFL-0337 12.6.29 ADG subah0dc 29-May-2018 23:01 EST 594574 TX 1 2* UNITED STATES SECURITIES AND EXCHANGE COMMISSION Washington, D.C. 20549 REPORT OF FOREIGN
21Vianet Group, Inc. Reports Unaudited Second Quarter 2014 Financial Results
 August 27, 2014 21Vianet Group, Inc. Reports Unaudited Second Quarter 2014 Financial Results 2Q14 Net Revenues Up 39.7% YOY to RMB658.0 Million 2Q14 Adjusted EBITDA Up 51.3% YOY to RMB132.0 Million Live
ehi Car Services Announces First Quarter 2016 Results Net revenues increased by 55.8% year-over-year Gross profit margin increased to 28.
 ehi Car Services Announces First Quarter Results Net revenues increased by 55.8% year-over-year Gross profit margin increased to 28.2% SHANGHAI, May 24, ehi Car Services Limited ( ehi or the Company )
YY Reports Second Quarter 2013 Unaudited Financial Results
 August 1, 2013 YY Reports Second Quarter 2013 Unaudited Financial Results 2Q13 Net Revenues Up 117.8% YOY 2Q13 Gross Margin Expands to 53.3% 2Q13 Net Income of RMB92.8 Million 2Q13 Non-GAAP Net Income
ehi Car Services Announces Third Quarter 2015 Results Net revenues increased 78.9% year-over-year
 ehi Car Services Announces Third Quarter Results Net revenues increased 78.9% yearoveryear SHANGHAI, November 18, ehi Car Services Limited ( ehi or the Company ) (NYSE: EHIC), a leading car rentals and
Vipshop Reports Unaudited Fourth Quarter and Full Year 2016 Financial Results
 Vipshop Reports Unaudited Fourth Quarter and Full Year Financial Results Conference Call to be Held at 8:00 AM U.S. Eastern Time on February 21, 2017 Guangzhou, China, February 20, 2017 Vipshop Holdings
Home Inns Reports First Quarter Un-audited Financial Results
 Home Inns Reports First Quarter Un-audited Financial Results Shanghai, May 14th, 2008 Home Inns & Hotels Management Inc. (NASDAQ: HMIN), a leading economy hotel chain in China, today announced its unaudited
21Vianet Group, Inc. Reports Third Quarter 2016 Unaudited Financial Results
 November 28, 2016 21Vianet Group, Inc. Reports Third Quarter 2016 Unaudited Financial Results BEIJING, Nov. 28, 2016 (GLOBE NEWSWIRE) -- 21Vianet Group, Inc. (Nasdaq:VNET) ("21Vianet" or the "Company"),
NIO Inc. Reports Unaudited Fourth Quarter and Full Year 2018 Financial Results
 NIO Inc. Reports Unaudited Fourth Quarter and Full Year 2018 Financial s March 5, 2019 Quarterly Revenues reached RMB3,435.6 million (US$499.7 million) (1) Quarterly Deliveries of the ES8 reached 7,980
Qutoutiao Inc. Reports Third Quarter 2018 Unaudited Financial Results
 Qutoutiao Inc. Reports Third Quarter 2018 Unaudited Financial Results SHANGHAI, November 12, 2018 (GLOBE NEWSWIRE) -- Qutoutiao Inc. ( Qutoutiao, the Company or We ) (NASDAQ: QTT), an innovative and fast
ehi Car Services Announces First Quarter 2015 Results
 ehi Car Services Announces First Quarter Results SHANGHAI, May 27, ehi Car Services Limited ( ehi or the Company ) (NYSE: EHIC), a leading car rentals and car services provider in China, today announced
Cheetah Mobile Announces Third Quarter 2018 Unaudited Consolidated Financial Results
 Cheetah Mobile Announces Third Quarter 2018 Unaudited Consolidated Financial Results Beijing, China, November 21, 2018 Cheetah Mobile Inc. (NYSE: CMCM) ( Cheetah Mobile or the Company ), a leading mobile
Adjusted Net Income increased 44.3% year-over-year to RMB197.5 million ($31.9 million) for the first quarter of 2015.
 for the first quarter of 2015.") Autohome Inc. Announces Unaudited Results for the First Quarter Ended March 31, 2015 First Quarter Net Revenues Increased Significantly by 82.1% Year-over-Year to RMB622.9 Million BEIJING, May 6, 2015
Autohome Inc. Announces Unaudited Results for the First Quarter Ended March 31, 2015 First Quarter Net Revenues Increased Significantly by 82.1% Year-over-Year to RMB622.9 Million BEIJING, May 6, 2015
Cheetah Mobile Announces Third Quarter 2014 Unaudited Financial Results
 Cheetah Mobile Announces Third Quarter 2014 Unaudited Financial Results Beijing, China, November 10, 2014 Cheetah Mobile Inc. (NYSE: CMCM) ( Cheetah Mobile or the Company ), a leading mobile internet company
Vipshop Reports Unaudited Second Quarter 2014 Financial Results
 Vipshop Reports Unaudited Second Quarter 2014 Financial Results 2Q14 Total Net Revenues Up 136.1% YoY to US$829.4 Million 2Q14 Gross Margin Increased to 24.8% 2Q14 Net Income Attributable to Vipshop s
ehi Car Services Announces Fourth Quarter and Full Year 2016 Results Maintaining margin expansion and profitability
 ehi Car Services Announces Fourth Quarter and Full Year Results Maintaining margin expansion and profitability SHANGHAI, March 22, 2017 ehi Car Services Limited ( ehi or the Company ) (NYSE: EHIC), a leading
Bitauto Announces First Quarter 2018 Results
 Bitauto Announces First Quarter 2018 Results First quarter revenue increased 52.3% year-over-year Revenue from transaction services increased 101.0% year-over-year BEIJING, June 13, 2018 /PRNewswire/ --
YY Reports Third Quarter 2015 Unaudited Financial Results
 YY Reports Third Quarter Unaudited Financial Results Guangzhou, China, November 23, YY Inc. (NASDAQ: YY) ("YY" or the "Company"), a revolutionary real-time interactive social platform, today announced
Highlights for the First Quarter of 2016
 Tuniu Announces Unaudited First Quarter 2016 Financial Results Net Revenues in Q1 2016 Increased by 62.8% Year-Over-Year Total Number of Trips in Q1 2016 Increased by 80.2% Year-Over-Year NANJING, China,
YY Reports Third Quarter 2015 Unaudited Financial Results
 November 23, 2015 YY Reports Third Quarter 2015 Unaudited Financial Results GUANGZHOU, China, Nov. 23, 2015 (GLOBE NEWSWIRE) -- YY Inc. (NASDAQ:YY) ("YY" or the "Company"), a revolutionary real-time interactive
BEST Inc. Announces Unaudited Second Quarter 2018 Financial Results
 BEST Inc. Announces Unaudited Second Quarter 2018 Financial Results HANGZHOU, China, August 8, 2018 -- BEST Inc. (NYSE: BSTI) ( BEST or the Company ), a leading smart supply chain and logistics solutions
JinkoSolar Announces Fourth Quarter and Full Year 2017 Financial Results
 JinkoSolar Announces Fourth Quarter and Full Year 2017 Financial Results March 22, 2018 SHANGHAI, March 22, 2018 /PRNewswire/ -- JinkoSolar Holding Co., Ltd. ("JinkoSolar" or the "Company") (NYSE: JKS),
Agria Reports Third Quarter 2007 Results
 Agria Reports Third Quarter 2007 Results Revenues of US$47.1 million for first nine months of 2007, with diluted earnings per ADS of US$0.48 Expect 4Q/2007 revenue growth of 60% to 70% year-over-year Beijing,
UNITED STATES SECURITIES AND EXCHANGE COMMISSION Washington, D.C FORM 6-K. Weibo Corporation (Registrant s Name)
") Table of Contents UNITED STATES SECURITIES AND EXCHANGE COMMISSION Washington, D.C. 20549 FORM 6-K REPORT OF FOREIGN PRIVATE ISSUER PURSUANT TO RULE 13a-16 OR 15d-16 OF THE SECURITIES EXCHANGE ACT OF 1934
Table of Contents UNITED STATES SECURITIES AND EXCHANGE COMMISSION Washington, D.C. 20549 FORM 6-K REPORT OF FOREIGN PRIVATE ISSUER PURSUANT TO RULE 13a-16 OR 15d-16 OF THE SECURITIES EXCHANGE ACT OF 1934
Ctrip Reports Unaudited Fourth Quarter and Full Year 2015 Financial Results
 Print Page Close Window News Release Ctrip Reports Unaudited Fourth Quarter and Full Year 2015 Financial Results SHANGHAI, March 16, 2016 /PRNewswire/ (Nasdaq: CTRP), a leading travel service provider
JD.com Announces First Quarter 2016 Results
 JD.com Announces First Quarter Results Beijing, China---May 9, ---JD.com, Inc. (NASDAQ: JD), China's largest online direct sales company, today announced its unaudited financial results for the quarter
Ctrip Reports Unaudited Fourth Quarter and Full Year 2016 Financial Results
 Ctrip Reports Unaudited Fourth Quarter and Full Year 2016 Financial Results Shanghai, China, February 22, 2017 - Ctrip.com International, Ltd. (Nasdaq: CTRP), a leading travel service provider of accommodation
21Vianet Group, Inc. Reports Unaudited Fourth Quarter and Full Year 2018 Financial Results
 21Vianet Group, Inc. Reports Unaudited Fourth Quarter and Full Year 2018 Financial Results BEIJING, March 5, 2019 (GLOBE NEWSWIRE) -- 21Vianet Group, Inc. (Nasdaq: VNET) ("21Vianet" or the "Company"),
UNITED STATES SECURITIES AND EXCHANGE COMMISSION WASHINGTON, D.C FORM 6-K
 UNITED STATES SECURITIES AND EXCHANGE COMMISSION WASHINGTON, D.C. 20549 FORM 6-K REPORT OF FOREIGN PRIVATE ISSUER PURSUANT TO RULE 13a-16 OR 15d-16 OF THE SECURITIES EXCHANGE ACT OF 1934 For the Month
TAL Education Group Announces Unaudited Financial Results for the. First Fiscal Quarter Ended May 31, 2018
 TAL Education Group Announces Unaudited Financial Results for the First Fiscal Quarter Ended May 31, 2018 - Net Revenues up by 71.1% Year-Over-Year - Income from Operations up by 160.3% Year-Over-Year
Changyou Reports Fourth Quarter 2016 and Fiscal Year 2016 Unaudited Financial Results
 Changyou Reports Fourth Quarter 2016 and Fiscal Year 2016 Unaudited Financial Results Beijing, China, February 21, 2017 Changyou.com Limited ( Changyou or the Company ) (NASDAQ: CYOU), a leading online