Debt Statistics. A consumer focus. April 2017
|
|
|
- Louisa Bennett
- 6 years ago
- Views:
Transcription


1 Debt Statistics A consumer focus April 2017

2 Contents 3. Message from the Chair 4. About Debt Advice Foundation 5. At-a-glance 6. Overview 8. Age group 9. Gender 10. Region 11. Residential status 12. Employment status 13. Household demographics 14. Helpline outcomes 15. Appendix (data tables) Debt Advice Foundation 2017 Page 2


3 Message from the Chair Welcome to Debt Advice Foundation's April 2017 helpline statistics update. With the amount of personal borrowing approaching the record levels seen prior to the 2008 global economic recession, it's important that the debt advice sector does everything it can to prepare itself for the inevitable surge in demand for debt advice. One way we can do this is through research. Research not only helps the charity understand and adapt to the ever changing credit landscape and how service-users are impacted by those changes but it also shapes and informs Government and regulatory policy more broadly, both in the debt advice and related sectors. Understanding how and why people call the charity's helpline, how they use the information they are given and how effective that information is, allows us to develop and improve our service for the benefit of future service-users. The more research we have access to, the more likely we are to spot emerging trends that may, for example, influence the way borrowers use credit in the future and how we, both as a charity and as a sector more broadly, might react to those changes. That is why we have developed this monthly statistical resource. Please feel free to get in touch if you have any questions or comments regarding the charity's statistical releases. Dennis Benson OBE Chair Debt Advice Foundation 2017 Page 3

4 About Debt Advice Foundation Debt Advice Foundation is a registered national debt advice and education charity in England and Wales (no ). At the heart of the charity s philosophy is the prevention and cure of unmanageable consumer debt. Whilst our primary focus is on helping those that are in need of advice and support today, we strongly believe that improving financial literacy amongst the next generation of credit users is key to tackling increasing levels of unmanageable consumer debt in the UK. The charity seeks to carry out these objectives through its free telephone debt counselling service, which helps over 10,000 people every year, and through DebtAware, the charity's award winning debt education programme for schoolchildren. The charity holds the Advice Service Alliance s Advice Quality Standard (AQS) and is listed by Money Advice Service as an accredited, free provider of debt advice on its online debt advice locator page (the Money Advice Service is an independent service set up by government to help people manage their money). The charity is a member of AdviceUK, the UK s largest support network for free, independent advice centres, as well as the National Homelessness Advice Service (NHAS) and all of the charity's advisers are members of the Institute of Money Advisers (IMA), a charitable body that aims to promote free money advice and develop professional standards. The charity is also a registered supporter of the All-Party Parliamentary Group on Financial Education for Young People and the All-Party Parliamentary Group on Debt and Personal Finance. Debt Advice Foundation is authorised and regulated by the Financial Conduct Authority (no ). Debt Advice Foundation 2017 Page 4


5 Debt Advice Foundation 2017 Page 5
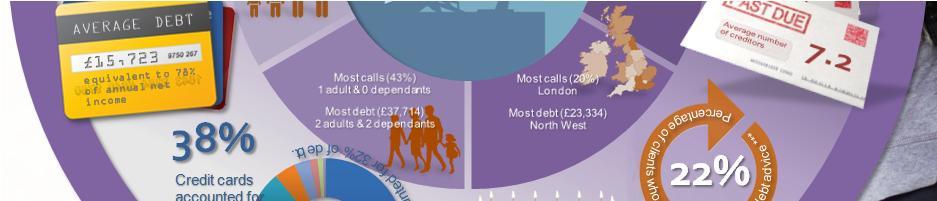
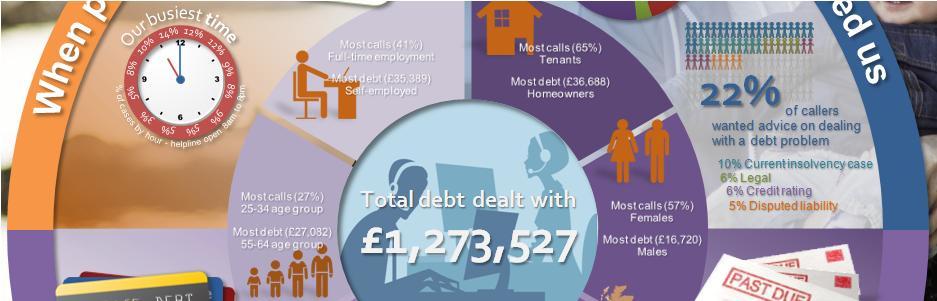
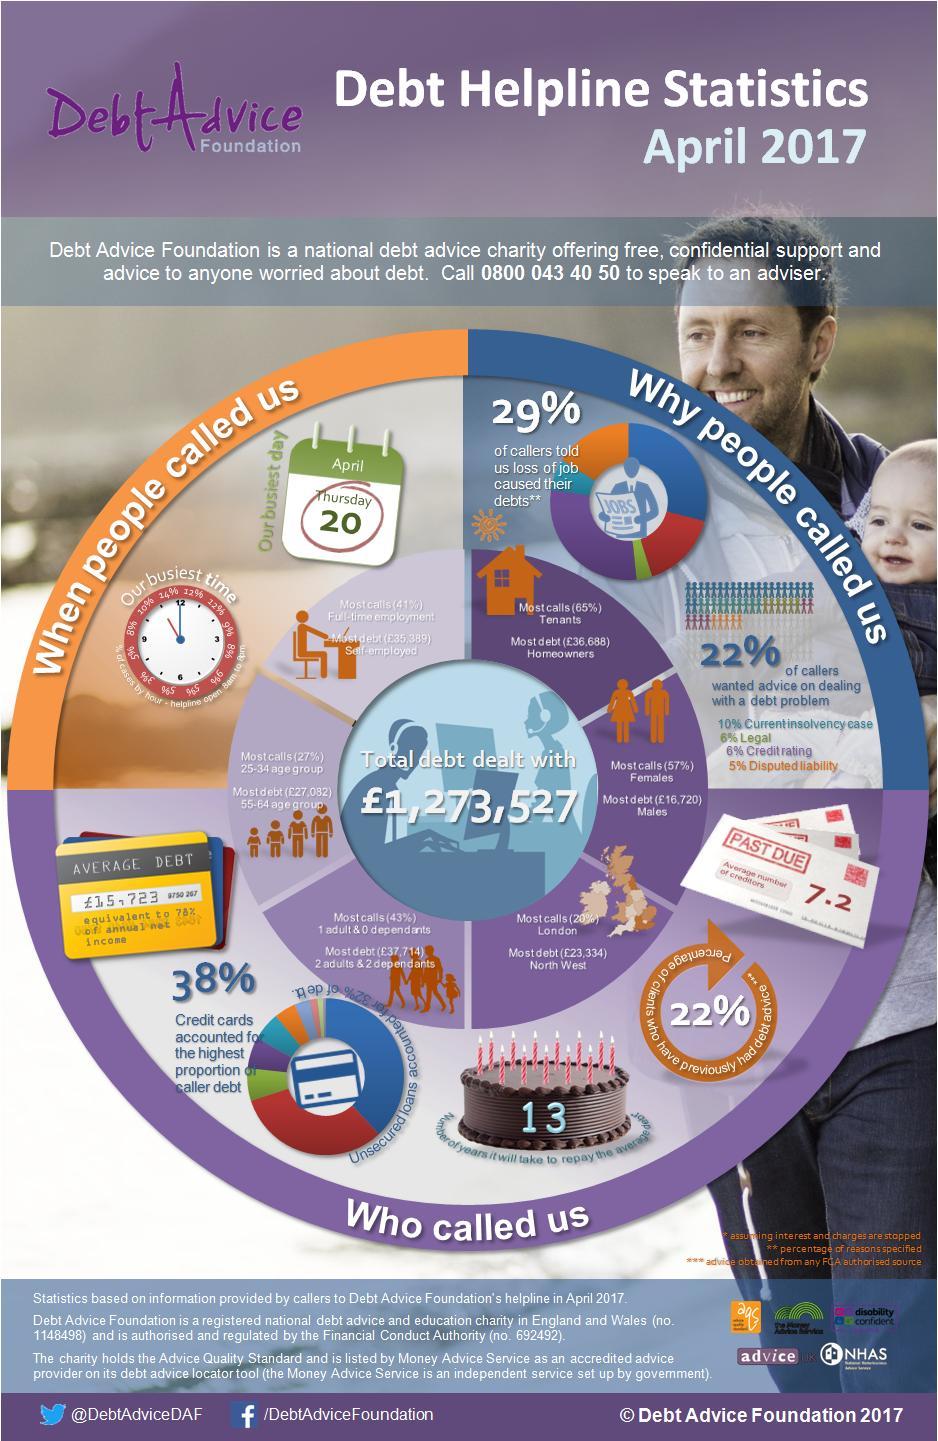
6 Apr month average Mar 17 Apr month average Mar % 1.5% 1.1% 1.3% % 2.3% 2.5% 4.5% 7.3% 7.3% 7.8% 6.3% 6.3% 9.1% 11.2% 12.5% 11.4% 11.4% 13.4% 15. Repayment term (months) % 18. -income ratio Apr month average Mar 17 5, ,062 1,632 1,468 1,654 1,508 1,557 1,439 1,676 1,575 5,890 5, Monthly amount ( ) Impoverishment index 5,422 1, May 16 Jun 16 Jul 16 Aug 16 Sep 16 Oct 16 Nov 16 Dec 16 Jan 17 Feb 17 Mar ,434 14,120 14,486 18,249 18,968 18,797 18,259 18,025 14,469 17,524 17,709 15,723 Number of creditors 28.4% % 7.4% % 2.5% 6.2% 1.2% 1.2% Percentage of cases Debt Advice Foundation - Debt Helpline Statistics (April 2017) 1. Overview This section provides an overview of callers to the charity's helpline in April The dataset comprises completed advice cases only (this means cases where a full financial assessment has taken place and a debt solution has been recommended). The charity's helpline advisers dealt with a total of 1,273,527 of unsecured debt in April 2017 at an average of 15,723 per case (full financial assessments). c1.1 overview c1.2 profile (April 2017) Average unsecured debt 1 20,000 18,000 16,000 14,000 12,000 10,000 8,000 6,000 4,000 2,000 Average number of unsecured creditors Includes unsecured credit facilities such as credit cards, unsecured loans, short term (payday) loans, overdrafts, store cards and catalogue debts. Secured debts, such as mortgages, and priority arrears (for example rent and council tax debts) are not included. Total unsecured debt band c1.3 by type (April 2017) Apr month average Mar 17 6,296 6,778 6,832 6,039 5,000 10,000 15,000 20,000 2,528 1,790 Credit card Unsecured loan Other debts Overdraft Store card Short term loan Utility debt Benefit overpayment Council tax debt Crown tax debt Trade debt c1.4 Client financial profile (April 2017) Net monthly household income Monthly household expenditure 2 Impoverishment index 3 1,700 1,650 1,600 1,550 1,500 1,450 1,400 1,350 1, % 20.8% 18.5% 15% 2 Monthly household expenditure does not include contractual unsecured debt repayments but does include priority arrears payments. 3 The percentage of cases that have a negative disposable income and are unable to meet the existing essential household expenditure. 5% 1.5 Specified cause of financial impairment (April 2017) 1.6 Debt servicing (April 2017) Loss of job Reduced working hours Pregnancy Illness Divorce Separation Average repayment term (months) 4 to annual income ratio 5 95% % % Average number of months to repay the total value of unsecured liabilities in full based on the available disposable income (after monthly essential household expenditure) assuming interest and charges are stopped. 5 Total amount of unsecured debt as a percentage of total annual net income. Debt Advice Foundation 2017 Page 6
7 Average client priority arrears Percentage of clients with priority arrears Debt Advice Foundation - Debt Helpline Statistics (April 2017) 1. Overview continued This section provides an overview of callers to the charity's helpline in April The dataset comprises completed advice cases only (this means cases where a full financial assessment has taken place and a debt solution has been recommended). In April 2017, 22.2% of callers told us they'd previously sought help with their debts. 34. of callers were identified as having a vulnerability that made them susceptible to potential detriment. c1.7 Priority debt arrears (April 2017)² c1.8 Priorty debt arrears by type (April 2017) Average priority arrears debt Percetntage of clients with priority arrears % 47. Rent arrears Secured debt arrears Council Tax arrears Utility arrears % 0. 2 Insolvency cases (DROs, bankrutcies and IVAs) have been ommitted from the priority debt arrears calculation due to the variable nature of arrears processing in these solutions. c1.9 Repeat advice (April 2017)¹ c1.10 Client vulnerability (April 2017) 77.8% 22.2% Clients that have previously received debt advice Clients that have not previously received debt advice 65.4% % % No vulnerability identified Circumstances Health Comprehension/ Decision making 1 Repeat advice is a measure of previous client engagment with an FCA authorised source, ranging from seeking advice through entering an agreement with a debt solution provider.
 Impoverishment index 5,927 5,760 18-24 25-34 35-44 45-54 55-64 65+ 18-24 25-34 35-44 45-54")
8 % 5% 5% Neg DI, can't repay 23 Number of months Percentage of cases ,176 1,133 5,134 1, ,705 1,482 1,798 1,778 1,884 1,747 1,604 1,746 1,908 1,404 12,673 4,612 Monthly amount ( ) Impoverishment index 5,927 5, ,861 13,757 17,573 15,801 27,082 11, % Percentage of cases Population weighting index 1 Debt Advice Foundation - Debt Helpline Statistics (April 2017) 2. Age group This section provides an overview of callers to the helpline in April 2017, broken down by age group. The age group with the highest average unsecured debt in April 2017 was the age group ( 27,082).The age group with the highest helpline engagement was the age group, which was 68% more likely to call the helpline than the UK average. c2.1 Average unsecured debt (April 2017) c2.2 Case weighting (April 2017) 30,000 25,000 20,000 15,000 10,000 5,000 Case weighting (April 2017) Regional contact population weighting index % % The population weighting index is calculated by dividing the number of helpline contacts by the latest ONS population estimate for each age -group and comparing it to the UK average. This statistic provides a more useful relative measure of age - group helpline engagement by removing age-group population bias. c2.3 c2.5 by type (April 2017) ,922 6,606 7,006 7,994 4,889 10,000 20,000 30,000 Specified cause of financial impairment (April 2017) Credit card Unsecured loan Other debts Overdraft Store card Short term loan Utility debt Benefit overpayment Council tax debt c2.4 c2.6 Client financial profile (April 2017) Net monthly household income Monthly household expenditure 2 Impoverishment index 3 2, % 36.4% 40. 2,000 1,500 1, % 14.3% 0. 2 Monthly household expenditure does not include contractual unsecured debt repayments but does include priority arrears payments. 3 The percentage of cases that have a negative disposable income and are unable to meet the existing essential household expenditure. Debt servicing (April 2017) Loss of job Reduced working hours Pregnancy Illness Divorce Separation Average repayment term (months) 4 to annual income ratio % % % % Average number of months to repay the total value of unsecured liabilities in full based on the available disposable income (after monthly essential household expenditure) assuming interest and charges are stopped. 5 Total amount of unsecured debt as a percentage of total annual net income. Debt Advice Foundation 2017 Page 8
9 Male Female Male Female % 2% 2% Number of months Percentage of cases 1 Male Female 5,195 6,787 1,604 1,551 1,731 1,593 7,133 4,102 Monthly amount ( ) Impoverishment index Male Female Male Female 16,720 14,963 43% 5 Percentage of cases (main client) Debt Advice Foundation - Debt Helpline Statistics (April 2017) 3. Gender This section provides an overview of callers to the helpline in April 2017, broken down by gender. Males had the highest average amount of debt in April 2017 ( 16,720).The highest weighting of callers to the helpline in the period was females (5). c3.1 Average unsecured debt (April 2017) c3.2 Case weighting (April 2017) 17, , , , ,000 14,500 14,000 c3.3 by type (April 2017) Credit card c3.4 Client financial profile (April 2017) Female Male Unsecured loan Other debts Overdraft Store card Short term loan Utility debt Benefit overpayment Council tax debt Crown tax debt 5,000 10,000 15,000 20,000 Average debt Net monthly household income Monthly household expenditure 1 Impoverishment index 2 1, ,700 1,650 1,600 1,550 1,500 1, Monthly household expenditure does not include contractual unsecured debt repayments but does include priority arrears payments. 2 The percentage of cases that have a negative disposable income and are unable to meet the existing essential household expenditure. c3.5 Specified cause of financial impairment (April 2017) c3.6 Debt servicing (April 2017) 18% 1 12% 8% 4% 2% Loss of job Reduced working hours Pregnancy Illness Divorce Separation Average repayment term (months) 3 to annual income ratio % Average number of months to repay the total value of unsecured liabilities in full based on the available disposable income (after monthly essential household expenditure) assuming interest and charges are stopped. 4 Total amount of unsecured debt as a percentage of total annual net income. Debt Advice Foundation 2017 Page 9

10 East Midlands East of England London North East North West Northern Ireland Scotland South East South West Wales West Midlands Yorkshire and East Midlands East of England London North East North West Northern Ireland Scotland South East South West Wales West Midlands Yorkshire and % 13% 13% 13% Neg DI, can't repay Neg DI, can't repay 83 22% 22% Number of months Percentage of cases 33% 33% East Midlands East of England London North East North West Northern Ireland Scotland South East South West Wales West Midlands Yorkshire and the Humber Monthly amount ( ) 1,111 1,033 1,496 1,228 1,582 1,448 1,162 1,023 2,402 2, ,572 1,460 2,117 1,966 1,596 1,573 1,384 1,416 1,855 1,653 Impoverishment index East Midlands East of England London North East North West Northern Ireland Scotland South East South West Wales West Midlands Yorkshire and the Humber East Midlands East of England London North East North West Northern Ireland Scotland South East South West Wales West Midlands Yorkshire and the Humber 9,829 21,346 16,385 5,335 23,334 1,755 10,566 18,705 9,824 18,206 16,783 4% 1% Percentage of cases Population weighting index 1 Debt Advice Foundation - Debt Helpline Statistics (April 2017) 4. Region This section provides an overview of callers to the helpline in April 2017, broken down by region. The region with the highest average unsecured debt in April 2017 was North West ( 23,334).The region with the highest helpline engagement was Wales which was 108% more likely to call the helpline than the UK average. c4.1 Average unsecured debt (April 2017) c4.2 Case weighting (April 2017) 25,000 20,000 15,000 10,000 15% Case weighting (April 2017) Regional contact population weighting index ,000 5% The population weighting index is calculated by dividing the number of helpline contacts by the latest ONS population estimate for each region and comparing it to the UK average. This statistic provides a more useful relative measure of regional helpline engagement by removing regional population bias. c4.3 by type (April 2017) Credit card c4.4 Client financial profile (April 2017) c4.5 Yorkshire and West Midlands Wales South West South East Scotland Northern Ireland North West North East London Unsecured loan Other debts Overdraft Store card Short term loan Utility debt Benefit overpayment Council tax debt East of England Crown tax debt East Midlands Trade debt 10,000 20,000 30,000 Specified cause of financial impairment (April 2017) c4.6 Net monthly household income Monthly household expenditure 2 Iimpoverishment index 3 3, ,500 2,000 1,500 1, % 18.8% 33.3% 11.1% % 12.5% % 12.5% Monthly household expenditure does not include contractual unsecured debt repayments but does include priority arrears payments. 3 The percentage of cases that have a negative disposable income and are unable to meet the existing essential household expenditure. Debt servicing (April 2017) 35% 3 15% 5% Loss of job Reduced working hours Pregnancy Illness Divorce Separation Average repayment term (months) 4 to annual income ratio 5 74% % 81% % 51% 1 75% Average number of months to repay the total value of unsecured liabilities in full based on the available disposable income (after monthly essential household expenditure) assuming interest and charges are stopped. 5 Total amount of unsecured debt as a percentage of total annual net income. Debt Advice Foundation 2017 Page 10
11 % 4% 12% Number of months Percentage of cases 2 33% 1,088 5,527 1, ,037 2, ,790 16,895 11,116 5,710 15,557 Monthly amount ( ) 1,684 Impoverishment index 4,610 3,078 9,767 36,688 24,152 10, % 65% Percentage of cases Debt Advice Foundation - Debt Helpline Statistics (April 2017) 5. Residential status This section provides an overview of callers to the helpline in April 2017, broken down by residential status. Homeowner was the group with the highest average unsecured debt ( 36,688) in April Tenant was the most likely group to call the charity for advice (65%). Homeowner was the group with the highest average unsecured debt ( 36,688) in April Tenant was the most likely group to call the charity for advice (65%). c5.1 Average unsecured debt (April 2017) c5.2 Case weighting (April 2017) 40,000 35,000 30,000 25,000 20,000 15,000 10, ,000 Living with Parents Homeowner Unknown Tenant Living with Parents Homeowner Unknown Tenant c5.3 c5.5 by type (April 2017) Tenant Unknown Homeowner Living with Parents Credit card Unsecured loan Other debts Overdraft Store card Short term loan Utility debt Benefit overpayment Council tax debt Crown tax debt Trade debt 10,000 20,000 30,000 40,000 Specified cause of financial impairment (April 2017) c5.4 c5.6 Client financial profile (April 2017) Net monthly household income Monthly household expenditure % Impoverishment index 2 2, ,000 1,500 1, Living with Parents 14.3% 22. Homeowner Unknown Tenant 1 Monthly household expenditure does not include contractual unsecured debt repayments but does include priority arrears payments. 2 The percentage of cases that have a negative disposable income and are unable to meet the existing essential household expenditure. Debt servicing (April 2017) % 3 15% 5% Living with Parents Homeowner Unknown Tenant Loss of job Reduced working hours Pregnancy Illness Divorce Separation Average repayment term (months) 3 to annual income ratio % % Living with Parents Homeowner Unknown Tenant 3 Average number of months to repay the total value of unsecured liabilities in full based on the available disposable income (after monthly essential household expenditure) assuming interest and charges are stopped. 4 Total amount of unsecured debt as a percentage of total annual net income. Debt Advice Foundation 2017 Page 11
 Unemployed (JSA) Retired Monthly amount ( ) 1,983 1,711")
12 Part-time Self-employed education Unemployed (Other) Unemployed (JSA) Retired Part-time Self-employed education Unemployed (Other) Unemployed (JSA) Retired 68 3% 15% 1 22% 33% 5 5 Neg DI, can't repay Neg DI, can't repay Number of months Percentage of cases 10 Part-time Selfemployed Selfemployed education Unemployed (Other) Unemployed (JSA) Retired Monthly amount ( ) 1,983 1,711 1,290 1,364 2,108 2,073 2,227 2,158 1,468 1, ,593 1,291 Impoverishment index Part-time education Unemployed (Other) Unemployed (JSA) Retired Part-time Selfemployed education Unemployed (Other) Unemployed (JSA) Retired 18,579 14,861 35,389 7,697 7,328 10,465 15,531 41% 8% 1% 3% 3% Percentage of cases Debt Advice Foundation - Debt Helpline Statistics (April 2017) 6. Employment status This section provides an overview of callers to the helpline in April 2017, broken down by Self-employed was the group with the highest average unsecured debt ( 35,389) in April Fulltime was the most likely group to call us for advice (41%). c6.1 Average unsecured debt (April 2017) c6.2 Case weighting (April 2017) 40,000 35,000 30,000 25,000 20,000 15,000 10,000 5,000 45% 4 35% 3 15% 5% c6.3 by type (April 2017) Retired Unemployed (JSA) Unemployed (Other) Other debts Overdraft Store card Short term loan education Utility debt Self-employed Benefit overpayment Part-time Council tax debt Crown tax debt Trade debt 10,000 20,000 30,000 40,000 Credit card Unsecured loan c6.4 Client financial profile (April 2017) Net monthly household income Monthly household expenditure Impoverishment index 2 2, , , , % c6.5 Specified cause of financial impairment (April 2017) c6.6 1 Monthly household expenditure does not include contractual unsecured debt repayments but does include priority arrears payments. 2 The percentage of cases that have a negative disposable income and are unable to meet the existing essential household expenditure. Debt servicing (April 2017) Loss of job Reduced working hours Pregnancy Illness Divorce Separation Average repayment term (months) 3 to annual income ratio % % % 35% Average number of months to repay the total value of unsecured liabilities in full based on the available disposable income (after monthly essential household expenditure) assuming interest and charges are stopped. 4 Total amount of unsecured debt as a percentage of total annual net income. Debt Advice Foundation 2017 Page 12
")
13 1 adult/0 1 adult/1 1 adult/2 1 adult/3+ 2 adults/0 2 adults/1 2 adults/2 2 adults/3+ 1 adult/0 1 adult/1 1 adult/2 1 adult/3+ 2 adults/0 2 adults/1 2 adults/2 2 adults/ % 13% Neg DI, can't repay Neg DI, can't repay Number of months Percentage of cases 43% 5 1 adult/0 1 adult/1 1 adult/2 1 adult/3+ 2 adults/0 2 adults/1 2 adults/2 2 adults/3+ Monthly amount ( ) 1,165 1,045 1,515 1,516 2,152 1,947 1,826 1,783 1,947 2,075 1,968 1,857 2,861 2,495 2,286 2,236 Impoverishment index 1 adult & 0 1 adult & 1 1 adult & 2 1 adult & 3+ 2 adults & 0 2 adults & 1 2 adults & 2 2 adults & 3+ 1 adult & 0 1 adult & 1 1 adult & 2 1 adult & 3+ 2 adults & 0 2 adults & 1 2 adults & 2 2 adults & 3+ 13,161 10,162 18,175 10,029 17,491 12,078 37,714 6,614 43% 4% 12% 12% 2% Percentage of cases Debt Advice Foundation - Debt Helpline Statistics (April 2017) 7. Household demographics This section provides an overview of callers to the helpline in April 2017, broken down by household 2 adults & 2 was the group with the highest average unsecured debt ( 37,714) in April adult & 0 was the most likely group to call us for advice (43%). c7.1 Average unsecured debt (April 2017) c7.2 Case weighting (April 2017) 40,000 35,000 30,000 25,000 20,000 15,000 10,000 5, % 4 35% 3 15% 5% c7.3 by type (April 2017) 2 adults/3+ 2 adults/2 2 adults/1 2 adults/0 1 adult/3+ 1 adult/2 1 adult/1 1 adult/0 10,000 20,000 30,000 40,000 50,000 Credit card Unsecured loan Other debts Overdraft Store card Short term loan Utility debt Benefit overpayment Council tax debt c7.4 Client financial profile (April 2017) Net monthly household income Monthly household expenditure 1 Impoverishment index 2 3, , , ,000 1, , % c7.5 Specified cause of financial impairment (April 2017) c7.6 1 Monthly household expenditure does not include contractual unsecured debt repayments but does include priority arrears payments. 2 The percentage of cases that have a negative disposable income and are unable to meet the existing essential household expenditure. Debt servicing (April 2017) Loss of job Reduced working hours Pregnancy Illness Divorce Separation Average repayment term (months) 3 to annual income ratio % % % 35% Average number of months to repay the total value of unsecured liabilities in full based on the available disposable income (after monthly essential household expenditure) assuming interest and charges are stopped. 4 Total amount of unsecured debt as a percentage of total annual net income. Debt Advice Foundation 2017 Page 13
 Council Tax (4) Benefits (3) Other (17) Enquiry May 16 Jun 16 Jul 16 Aug 16 Sep 16 Oct 16 Nov 16 Dec 16 Jan 17 Feb 17 Mar 17 May 16 Jun 16 Jul 16 Aug 16 Sep 16 Oct 16 Nov 16 Dec 16 Jan 17 Feb 17")
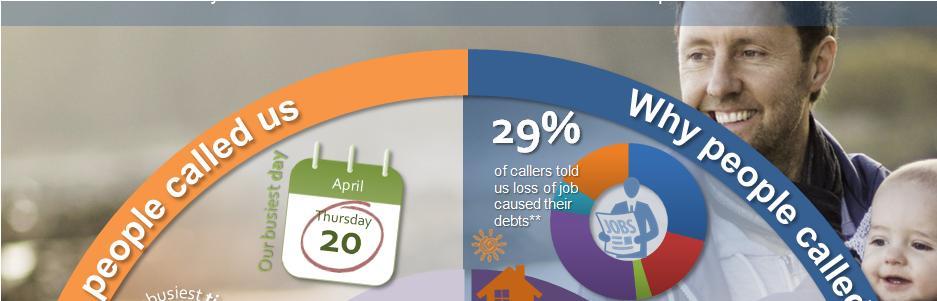
14 Outcome DRO (5) Bankruptcy (5) IVA/Trust Deed (5) Budgeting advice (3) Other (5) 3rd party call (19) Current insolvency case (11) Legal (7) Credit rating (6) Disputed liability (6) Bailiff assistance (5) Council Tax (4) Benefits (3) Other (17) Enquiry May 16 Jun 16 Jul 16 Aug 16 Sep 16 Oct 16 Nov 16 Dec 16 Jan 17 Feb 17 Mar 17 May 16 Jun 16 Jul 16 Aug 16 Sep 16 Oct 16 Nov 16 Dec 16 Jan 17 Feb 17 Mar 17 32% 2 34% % 28% 33% 31% 23% 23% 22% % 1 23% 1 12% 13% 18% 13% % 15% 3 23% 3 23% 32% 28% 31% 2 23% 68% 71% % 7 72% % % % 13% 13% 13% 12% 12% Debt Advice Foundation - Debt Helpline Statistics (April 2017) 8. Helpline outcomes This section provides an overview of helpline activity in April 2017, including the types of enquiries dealt with as well as the recommendations made by the charity's advisers. 32% of callers to the charity's helpline required a full financial assessment by a helpline adviser whilst 68% required assistance with a specific debt-related issue. 8.1 Case outcome analysis 8.2 Financial assessment outcomes 4 Financial assessment outcomes 2 Non-financial assessment outcomes Budgeting advice Other Individual Voluntary Arrangement/Trust Deed Debt Relief Order Informal Arrangement 5 Debt Arrangement Scheme Bankruptcy Cases that required a full financial assessment and managed solution intervention (see 8.2) 3 Cases that did not require a full financial assessment, for example, a specific question relating to a point of law (see 8.3). Non-financial assessment outcomes Advice recommendations made to the client following f inancial assessment and explanation of the available options (this may differ to the advice chosen by the client). 5 Informal arrangements can be managed interventions with a fairshare provider or a self managed programme via Money Advice Trust's Cashflow. Outcome map (per 100 cases in April 2017) May 16 Jun 16 Jul 16 Aug 16 Sep 16 Oct 16 Nov 16 Dec 16 Jan 17 Feb 17 Mar 17 22% 1 18% 1 8% 12% 8% 8% 5% 8% 4% 18% 22% 22% 23% 22% 3rd party call Bailiff assistance Benefits Council Tax Credit rating Current insolvency case Disputed liability 24% Housing assistance 3 5% Legal 28% 8% Mortgage 24% 4% Other 5 10 Financial assessment outcomes (23) Non-financial assessment outcomes (77) 8.5 Advice take-up (April 2017) Advice recommended by adviser 1 22% 48% 4% Advice chosen by client Budgeting advice Other Individual Voluntary Arrangement/Trust Deed Debt Relief Order Informal Arrangement Debt Arrangement Scheme Bankruptcy 6 Following a full financial assessment, each client is provided with a recommended course of action along with a comprehensive breakdown of each solution they legally have access to in order that they are able to make an informed choice. 8.6 Weekly call density map (April 2017) Saturday Friday Thursday Wednesday Tuesday Monday 7 The density map charts when calls to the charity's helpline were received during the month. The more calls the charity received on a given weekday and hour during the month, the higher the corresponding density value. Debt Advice Foundation 2017 Page 14
15 Appendix (data tables) T1.1 - overview May 16 Jun 16 Jul 16 Aug 16 Sep 16 Oct 16 Nov 16 Dec 16 Jan 17 Feb 17 Mar 17 Average unsecured debt 16,434 14,120 14,486 18,249 18,968 18,797 18,259 18,025 14,469 17,524 17,709 15,723 Average number of unsecured creditors T1.2 - profile (April 2017) Category weighting 28.4% % 7.4% % 2.5% 6.2% 1.2% 1.2% T1.3 - by type (April 2017)* Apr month average Mar 17 Credit card 6,039 6,832 6,778 6,296 Unsecured loan 5,422 5,781 5,890 5,262 Other debts 1,325 1,790 2, Overdraft ,062 Store card ,110 Short term loan Utility debt Benefit overpayment Council tax debt Crown tax debt Trade debt 32 * Some listed debts may not be included in the final unsecured totals dues to the laws governing treatment of certain liabilaities in different debt solutions. T1.4 - Client financial profile (April 2017) Apr month average Mar 17 Net monthly household income 1,632 1,654 1,557 1,676 Monthly household expenditure 1,468 1,508 1,439 1,575 Impoverishment index T1.5 - Specified cause of financial impairment (April 2017) Apr month average Mar 17 Loss of job 1 1 Reduced working hours 5% Pregnancy 1% 2% 1% 1% Illness 5% 8% Divorce 4% 3% 2% 3% Separation 13% 13% Other % 61% T1.6 - Debt servicing (April 2017) Apr month average Mar 17 Average repayment term (months) to annual income ratio 7 84% 95% 78% Debt Advice Foundation 2017 Page 15
16 Appendix (data tables) T1.7 - Priority debt arrears (April 2017)² Average priority arrears debt 244 Percetntage of clients with priority arrears 19. T1.8 - Priorty debt arrears by type (April 2017) Rent arrears 0. Secured debt arrears 47. Council Tax arrears 21.2% Utility arrears 31.2% T1.9 - Repeat advice (April 2017) Clients that have previously received debt advice Clients that have not previously received debt advice 22.2% 77.8% T Client vulnerability (April 2017) No vulnerability identified 65.4% Circumstances 2.4% Health 31. Comprehension/Decision making 1.2% Debt Advice Foundation 2017 Page 16
17 Appendix (data tables) T2.1 - Average unsecured debt (age group) Average unsecured debt (April 2017) 4,861 13,757 17,573 15,801 27,082 11,687 T2.2 - Case weighting (age group) Case weighting (April 2017) % 27.2% 17.3% % Regional contact population weighting index % % 5.2% T2.3 - Average debt by type (age group)* Credit card 1,176 4,922 6,606 7,006 12,673 5,927 Unsecured loan 1,133 5,134 7,994 4,889 4,612 5,760 Other debts ,191 1, Overdraft ,024 2,283 Store card 638 1,288 1,386 1, Short term loan 161 1, Utility debt Benefit overpayment ,192 Council tax debt Crown tax debt ,000 Trade debt * Some listed debts may not be included in the final unsecured totals dues to the laws governing treatment of certain liabilaities in different debt solutions. T2.4 - Client financial profile (age group) Net monthly household income 1,160 1,705 1,798 1,884 1,604 1,908 Monthly household expenditure 978 1,482 1,778 1,747 1,746 1,404 Impoverishment index % 36.4% 14.3% 36.4% 0. T2.5 - Cause of financial impairment (age group) Loss of job % 21.4% Reduced working hours Pregnancy Illness % 14.3% Divorce % 7.1% Impoverishment index % 36.4% 14.3% 36.4% 0. Impoverishment index % 36.4% 14.3% 36.4% 0. T2.6 - Debt servicing (age group) Average repayment term (months) to annual income ratio 35% 6 81% Neg DI, can't repay % 51% Debt Advice Foundation 2017 Page 17
18 Appendix (data tables) T3.1 - Average unsecured debt (gender) Male Female Average unsecured debt (April 2017) 16,720 14,963 T3.2 - Case weighting (gender) Male Female Case weighting (April 2017) 43.2% 56.8% T3.3 - Average debt by type (gender)* Male Female Credit card 5,195 7,133 Unsecured loan 6,787 4,102 Other debts 1, Overdraft 1, Store card 881 1,284 Short term loan Utility debt Benefit overpayment Council tax debt Crown tax debt 1, Trade debt * Some listed debts may not be included in the final unsecured totals dues to the laws governing treatment of certain liabilaities in different debt solutions. T3.4 - Client financial profile (gender) Male Female Net monthly household income 1,604 1,731 Monthly household expenditure 1,551 1,593 Impoverishment index % T3.5 - Cause of financial impairment (gender) Male Female Loss of job 17.1% 6.8% Reduced working hours % Pregnancy % Illness 14.3% 9.1% Divorce % Impoverishment index % Impoverishment index % T3.6 - Debt servicing (gender) Male Female Average repayment term (months) to annual income ratio 8 72% Debt Advice Foundation 2017 Page 18
19 Appendix (data tables) T4.1 - Average unsecured debt (region) East Midlands East of England London North East North West Average unsecured debt (April 2017) 9,829 21,346 16,385 5,335 Northern Ireland 23,334 Scotland South East South West Wales West Midlands Yorkshire and the Humber 1,755 10,566 18,705 9,824 18,206 16,783 T4.2 - Case weighting (region) East Midlands East of England London North East North West Case weighting (April 2017) 6.2% % 3. Northern Ireland 11.1% 0. Scotland South East South West Wales West Midlands Yorkshire and the Humber 1.2% 11.1% Regional contact population weighting index % % % 207.5% 97.8% 119.3% T4.3 - Average debt by type (region)* East Midlands East of England London North East North West Northern Ireland Credit card 5,946 8,061 7,071 2,127 7,680 Scotland South East South West Wales West Midlands 1,001 4,156 9,745 4,656 6,112 Yorkshire and the Humber 4,846 Unsecured loan 8,460 9,770 6,151 1,952 2,226 3,695 4,407 2,221 7,427 6,620 Other debts 315 1, , , ,538 Overdraft 1,158 1, , , Store card ,167 1,082 1,650 1,911 1,686 1,056 Short term loan , Utility debt Benefit overpayment 353 1, Council tax debt Crown tax debt 219 5, , Trade debt * Some listed debts may not be included in the final unsecured totals dues to the laws governing treatment of certain liabilaities in different debt solutions. T4.4 - Client financial profile (region) East Midlands East of England London North East North West Northern Ireland Net monthly household income 1,111 1,496 1,582 1,162 2,402 Scotland South East South West Wales West Midlands 909 1,572 2,117 1,596 1,384 Yorkshire and the Humber 1,855 Monthly household expenditure 1,033 1,228 1,448 1,023 2, ,460 1,966 1,573 1,416 1,653 Impoverishment index % 36.4% 14.3% 36.4% T4.5 - Cause of financial impairment (region) East Midlands East of England London North East North West Northern Ireland Loss of job % % Scotland South East South West Wales West Midlands % % Yorkshire and the Humber 12.5% Reduced working hours % % 12.5% Pregnancy % Illness % 33.3% 22.2% % % Divorce % % Impoverishment index % 36.4% 14.3% 36.4% Impoverishment index % 36.4% 14.3% 36.4% T4.6 - Debt servicing (region) East Midlands East of England London North East Average repayment term (months) North West Neg DI, can't repay Northern Ireland 0 Scotland South East South West Wales West Midlands Neg DI, can't repay Yorkshire and the Humber 83 to annual income ratio 74% % 81% % 51% 1 75% Debt Advice Foundation 2017 Page 19
20 Appendix (data tables) T5.1 - Average unsecured debt (housing status) Living with Parents Homeowner Unknown Tenant Average unsecured debt (April 2017) 9,767 36,688 24,152 10,943 T5.2 - Case weighting (housing status) Living with Parents Homeowner Unknown Tenant Case weighting (April 2017) % % T5.3 - Average debt by type (housing status)* Living with Parents Homeowner Unknown Tenant Credit card 1,088 16,895 5,710 4,610 Unsecured loan 5,527 11,116 15,557 3,078 Other debts ,596 1,107 Overdraft 622 2, Store card 322 1, ,223 Short term loan 1, Utility debt Benefit overpayment Council tax debt Crown tax debt 3, Trade debt * Some listed debts may not be included in the final unsecured totals dues to the laws governing treatment of certain liabilaities in different debt solutions. T5.4 - Client financial profile (housing status) Living with Parents Homeowner Unknown Tenant Net monthly household income 1,002 2, ,790 Monthly household expenditure 793 2, ,684 Impoverishment index % 36.4% 14.3% T5.5 - Cause of financial impairment (housing status) Living with Parents Homeowner Unknown Tenant Loss of job 27.3% 7.1% % Reduced working hours 9.1% 7.1% Pregnancy % 0. Illness 9.1% 14.3% % Divorce Impoverishment index % 36.4% 14.3% Impoverishment index % 36.4% 14.3% T5.6 - Debt servicing (housing status) Living with Parents Homeowner Unknown Tenant Average repayment term (months) to annual income ratio 35% 6 81% 7 Debt Advice Foundation 2017 Page 20
21 Appendix (data tables) T6.1 - Average unsecured debt ( status) employmen t Part-time Selfemployed Selfemployed education Average unsecured debt (April 2017) 18,579 14,861 35,389 7,697 Unemploye d (Other) Unemploye d (JSA) 7,328 10,465 T6.2 - Case weighting ( status) employmen t Part-time Selfemployed education Case weighting (April 2017) 41.3% % 1.3% Unemploye d (Other) Unemploye d (JSA) % T6.3 - Average debt by type ( status)* employmen t Part-time Selfemployed education Credit card 6,595 13,355 2,608 Unemploye d (Other) Unemploye d (JSA) 2,527 6,907 Unsecured loan 7,051 4,412 10,046 1,545 2,567 Other debts 739 1,187 2, Overdraft 1,167 1,502 1,618 1, ,850 Store card 1,276 1, ,360 1,233 Short term loan ,144 Utility debt Benefit overpayment Council tax debt Crown tax debt , Trade debt * Some listed debts may not be included in the final unsecured totals dues to the laws governing treatment of certain liabilaities in different debt solutions. T6.4 - Client financial profile ( status) employmen t Part-time Selfemployed education Net monthly household income 1,983 1,290 2,108 2,227 Unemploye d (Other) Unemploye d (JSA) 1, Monthly household expenditure 1,711 1,364 2,073 2,158 1, Impoverishment index % 36.4% 14.3% 36.4% 0. T6.5 - Cause of financial impairment ( status) employmen t Part-time Selfemployed education Loss of job 15.2% 6.3% Unemploye d (Other) Unemploye d (JSA) Reduced working hours Pregnancy % Illness 6.1% % % 0. Divorce % Impoverishment index % 36.4% 14.3% 36.4% 0. Impoverishment index % 36.4% 14.3% 36.4% 0. T6.6 - Debt servicing ( status) employmen t Average repayment term (months) 68 Part-time Neg DI, can't repay education Unemploye d (Other) Neg DI, can't repay Unemploye d (JSA) 1125 to annual income ratio 35% 6 81% 7 141% 51% Debt Advice Foundation 2017 Page 21
22 Appendix (data tables) T7.1 - Average unsecured debt (household demographics) 1 adult & 0 1 adult & 1 1 adult & 2 1 adult & 3+ 2 adults & 0 2 adults & 1 2 adults & 2 2 adults & 3+ Average unsecured debt (April 2017) 13,161 10,162 18,175 10,029 17,491 12,078 37,714 6,614 T7.2 - Case weighting (household demographics) 1 adult & 0 1 adult & 1 1 adult & 2 1 adult & 3+ 2 adults & 0 2 adults & 1 2 adults & 2 2 adults & 3+ Case weighting (April 2017) 43.2% % % 12.3% % T7.3 - Average debt by type (household demographics)* 1 adult/0 1 adult/1 1 adult/2 1 adult/3+ 2 adults/0 2 adults/1 2 adults/2 2 adults/3+ Credit card 4,306 3,846 9,378 1,423 6,923 6,268 17,775 1,604 Unsecured loan 6,281 2,866 4, ,678 3,051 13, Other debts 928 1,836 1,062 1, Overdraft , , Store card ,065 3,765 1,164 1,246 2, Short term loan , Utility debt , ,527 Benefit overpayment Council tax debt Crown tax debt , Trade debt * Some listed debts may not be included in the final unsecured totals dues to the laws governing treatment of certain liabilaities in different debt solutions. T7.4 - Client financial profile (household demographics) 1 adult/0 1 adult/1 1 adult/2 1 adult/3+ 2 adults/0 2 adults/1 2 adults/2 2 adults/3+ Net monthly household income 1,165 1,515 2,152 1,826 1,947 1,968 2,861 2,286 Monthly household expenditure 1,045 1,516 1,947 1,783 2,075 1,857 2,495 2,236 Impoverishment index % 36.4% 14.3% 36.4% T7.5 - Cause of financial impairment (household demographics) 1 adult/0 1 adult/1 1 adult/2 1 adult/3+ 2 adults/0 2 adults/1 2 adults/2 2 adults/3+ Loss of job 14.3% % 12.5% 50. Reduced working hours Pregnancy % Illness 11.4% 14.3% % 0. Divorce Impoverishment index % 36.4% 14.3% 36.4% Impoverishment index % 36.4% 14.3% 36.4% T7.6 - Debt servicing (household demographics) Average repayment term (months) to annual income ratio 1 adult/ adult/1 Neg DI, can't repay 1 adult/2 1 adult/ adults/0 Neg DI, can't repay 2 adults/1 35% 6 81% 7 141% 51% adults/2 2 adults/ Debt Advice Foundation 2017 Page 22
23 Appendix (data tables) T8.1 -Case outcome analysis May 16 Jun 16 Jul 16 Aug 16 Sep 16 Oct 16 Nov 16 Dec 16 Jan 17 Feb 17 Mar 17 Financial assessment outcomes 32% 2 34% % 28% 33% 31% 23% 23% Non-financial assessment outcomes 68% 71% % 7 72% % 7 7 T8.2 -Financial assessment outcomes May 16 Jun 16 Jul 16 Aug 16 Sep 16 Oct 16 Nov 16 Dec 16 Jan 17 Feb 17 Mar 17 Bankruptcy 22% % 1 23% 1 Debt Arrangement Scheme 1% 3% 1% 1% 2% 1% Informal Arrangement 12% 1 13% 18% 13% % 15% 3 Debt Relief Order 23% 3 23% 32% 28% 31% 2 23% Individual Voluntary Arrangement/Trust Deed % 1 1 Other 8% 12% 8% 5% Budgeting advice 15% 13% 13% 13% 12% 12% T8.3 -Non-financial assessment outcomes Mar 17 Feb 17 Jan 17 Dec 16 Nov 16 Oct 16 Sep 16 Aug 16 Jul 16 Jun 16 May 16 3rd party call 24% 28% 3 24% 1 18% 1 22% Bailiff assistance 5% Benefits 4% 8% 12% 8% Council Tax 5% 4% 4% 3% 5% 4% 2% 3% 3% 3% 2% 1% Credit rating 8% 4% 8% 5% 4% 5% 5% 5% 4% 3% Current insolvency case 8% 8% Disputed liability 5% 8% 8% 5% 8% Housing assistance 4% 2% 3% 3% 2% 2% 4% 5% 4% 4% 4% Legal 4% 8% 5% Mortgage 2% 1% 3% 3% 2% 4% 3% 5% 5% 4% 4% 4% Other 22% 23% 22% 22% 18% T8.5 -Advice take-up (April 2017) Advice recommended by adviser Advice chosen by client Bankruptcy 1 4% Debt Arrangement Scheme Informal Arrangement 3 48% Debt Relief Order 22% Individual Voluntary Arrangement/Trust Deed 1 1 Other Budgeting advice Debt Advice Foundation 2017 Page 23
24 Appendix (data tables) T8.6 -Weekly call density map (April 2017) Monday Tuesday Wednesday Thursday Friday Saturday 08: % 0.2% :00 2.3% 2.2% % 0. 10: % % 0. 11: % 2.2% 1.2% 12:00 2.8% 2.4% 1.3% 1.5% : % 2.8% 3.3% 2.2% 0. 14:00 1.2% % 2.4% % 15: % % : % : : % 1.5% :00 0.2% 1.1% 1.1% 0.4% 0.2% 0. Debt Advice Foundation 2017 Page 24

25 Debt Advice Foundation 1 Anchor Court Commercial Road Darwen BB3 0DB Telephone: press.office@debtadvicefoundation.org Website: Facebook: /DebtAdviceFoundation If you are experiencing financial difficulties, please call the charity's helpline on The helpline is open Monday to Friday 8am to 8pm and Saturday 9am to 3pm. Authorised and regulated by the Financial Conduct Authority No Charity registered in England and Wales No Debt Advice Foundation 2016
Debt Statistics. A consumer focus. May 2017
 Debt Statistics A consumer focus May 2017 Contents 3. Message from the Chair 4. About Debt Advice Foundation 5. At-a-glance 6. Overview 8. Age group 9. Gender 10. Region 11. Residential status 12. Employment
Debt Statistics. A consumer focus. June 2016
 Debt Statistics A consumer focus June 2016 Contents 3. Message from the Chair 4. About Debt Advice Foundation 5. At-a-glance 6. Overview 7. Age group 8. Gender 9. Region 10. Residential status 11. Employment
Debt Statistics. A consumer focus. December 2016
 Debt Statistics A consumer focus December 2016 Contents 3. Message from the Chair 4. About Debt Advice Foundation 5. At-a-glance 6. Overview 7. Age group 8. Gender 9. Region 10. Residential status 11.
Debt Statistics. A consumer focus. October 2016
 Debt Statistics A consumer focus October 2016 Contents 3. Message from the Chair 4. About Debt Advice Foundation 5. At-a-glance 6. Overview 7. Age group 8. Gender 9. Region 10. Residential status 11. Employment
Debt Statistics. A consumer focus. November 2016
 Debt Statistics A consumer focus November 2016 Contents 3. Message from the Chair 4. About Debt Advice Foundation 5. At-a-glance 6. Overview 7. Age group 8. Gender 9. Region 10. Residential status 11.
Debt Statistics. A consumer focus. January 2017
 Debt Statistics A consumer focus January 2017 Contents 3. Message from the Chair 4. About Debt Advice Foundation 5. At-a-glance 6. Overview 7. Age group 8. Gender 9. Region 10. Residential status 11. Employment
Personal debt in the UK Jan-Dec Statistics
 Personal debt in the UK Jan-Dec 2017 Statistics Demand for debt advice Between January and December 2017, 619,946 people contacted StepChange Debt Charity for help, or 1 in 100 adults in the UK. 1,698
Personal debt Jan-June Statistics. An in-depth look at over 300,000 people struggling with problem debt.
 Personal debt Jan-June 2017 Statistics An in-depth look at over 300,000 people struggling with problem debt. Demand for debt advice 326,639 people contacted StepChange Debt Charity for help and support
ESF Support for Families with Multiple Problems statistics to July 2014
 ESF Support for Families with Multiple Problems statistics to July 2014 September 2014 Contents Introduction... 2 Key Findings... 2 Background... 3 Data and Results... 4 Tables... 9 Contacts... 19 Introduction
Measuring Unemployment Some Key Terms
 Measuring Unemployment Some Key Terms Claimant Count (JSA) Labour Force Survey (LFS) The number of people officially claiming unemployment- related benefits must be actively seeking work All those actively
The Money Statistics. December.
 The Money Statistics December 2018 Welcome to the December 2018 edition of The Money Statistics, The Money Charity s monthly roundup of statistics about how we use money in the UK. If you have any questions,
Personal Debt Statistics. A look at the lives of half a million people in debt in the UK
 Personal Debt Statistics Yearbook A look at the lives of half a million people in debt in the UK Main findings Demand for debt advice 549,053 people contacted StepChange Debt Charity for help in. London
Statistics 2009/10 STATISTICS 2009/10 1
 Statistics 2009/10 STATISTICS 2009/10 1 STATISTICS 2009/10 VISITS TO OUR WEBSITES... 3 Participation in online self-help support services...3 CALLS TO THE HELPLINE AND NETLINE... 4 Calls... 4 Volume of
The Growth of In-Work Housing Benefit Claimants: Evidence and policy implications
 bshf The Growth of In-Work Housing Benefit Claimants: Evidence and policy implications The Growth of In-Work Housing Benefit Claimants: Evidence and policy implications Ben Pattison March 2012 Building
BTP Stop and Search Data - August 2012
 BTP Search Data - August 2012 Guidance Notes This analysis covers the period 01 September 2011 to 31 August 2012. These are the latest stop and search figures, compiled from data recorded on 03 October
PERSONAL DEBT FIRST HALF Statistics
 PERSONAL DEBT FIRST HALF 2016 Statistics Mid-Yearbook An in-depth look at 300,000 people with 2.4bn of debt in the first half of 2016 Main findings from the first half of 2016 Demand for debt advice More
YouGov / PHA Media Results
 YouGov / PHA Media Results Sample size: 2102 UK Adults Fieldwork: 13th - 15th August 2013 Gender Age Social Grade Region Male Female 18-24 25-34 35-44 45-54 55+ ABC1 C2DE North Midlands London South Wales
Personal Debt A look at the lives of half a million people in debt in the UK
 Personal Debt A look at the lives of half a million people in debt in the UK Main findings 2016 There was record demand for advice from StepChange Debt Charity in 2016. 599,026 people contacted us for
Labour Market Trends
 STUC SG Biannual June 2013 Employment in is increasing and unemployment is decreasing. is outperforming the on all headline labour market measures, employment, unemployment and inactivity. Recent increases
Leeds Building Society Covered Bonds - Investor Report
 Leeds Building Society Covered Bonds - Investor Report Investors (or other appropriate third parties) can register at www.bankofengland.co.uk/markets to download further disclosures in accordance with
Unemployment Briefing
 National Assembly for Wales Research paper Unemployment Briefing July 2014 Research Service The National Assembly for Wales is the democratically elected body that represents the interests of Wales and
Chartered Society of Physiotherapy. CSP Membership (as at 1 st March 2018) & NHS Data (2009 to 2017) UK/England /N Ireland/Scotland/Wales
 & NHS Data (2009 to 2017) UK/England /N Ireland/Scotland/Wales") Chartered Society of Physiotherapy CSP Membership (as at 1 st March 2018) & NHS Data (2009 to 2017) UK/England /N Ireland/Scotland/Wales Summary 1. CSP Members by Country 2. CSP Total Members from 2014
Chartered Society of Physiotherapy CSP Membership (as at 1 st March 2018) & NHS Data (2009 to 2017) UK/England /N Ireland/Scotland/Wales Summary 1. CSP Members by Country 2. CSP Total Members from 2014
Unemployment Briefing
 National Assembly for Wales Research paper Unemployment Briefing June 2014 Research Service The National Assembly for Wales is the democratically elected body that represents the interests of Wales and
Leeds Building Society Covered Bonds - Investor Report
 Leeds Building Society Covered Bonds - Investor Report Investors (or other appropriate third parties) can register at www.bankofengland.co.uk/markets to download further disclosures in accordance with
The Money Statistics. April
 The Money Statistics April 2018 Welcome to the April 2018 edition of The Money Statistics The Money Charity s monthly round-up of statistics about how we use money in the UK. These were previously published
A GUIDE TO IVAS Everything you need to know about an IVA
 A GUIDE TO IVAS Everything you need to know about an IVA THE FACTS An IVA (Individual Voluntary Arrangement) is a Debt Solution for people who cannot afford to pay their debts. It is a legal Agreement
Introduction to the UK Economy
 Introduction to the UK Economy What are the key objectives of macroeconomic policy? Price Stability (CPI Inflation of 2%) Growth of Real GDP (National Output) Falling Unemployment / Raising Employment
Leeds Building Society Covered Bonds - Investor Report
 Leeds Building Society Covered Bonds - Investor Report Investors (or other appropriate third parties) can register at www.bankofengland.co.uk/markets to download further disclosures in accordance with
Review of Registered Charites Compliance Rates with Annual Reporting Requirements 2016
 Review of Registered Charites Compliance Rates with Annual Reporting Requirements 2016 October 2017 The Charities Regulator, in accordance with the provisions of section 14 of the Charities Act 2009, carried
JSA claimant count rates as at October Devon Somerset Plymouth UK Torbay
 Job Seekers Allowance Latest Analysis November Unemployment in Devon For the first time since July the number of people claiming Job Seekers Allowance in Devon has fallen from 9,556 in September to 9,516
about this mortgage 1. About this illustration
 about this mortgage Personalised illustration for: James Sample & Vicky Sample Date produced: Any Date Valid until: This illustration is valid only on the date produced. This is not a legally binding mortgage
Approval levels fall back in February
 Approval levels fall back in February - Mortgage approvals decline slightly between January and February - Growth in number of first-time buyers and small deposit mortgages - Northern Ireland has highest
The Money Statistics. August
 The Money Statistics August 2018 Welcome to the August 2018 edition of The Money Statistics The Money Charity s monthly round-up of statistics about how we use money in the UK. These were previously published
Money Advice Performance Management Summary. Stirling Council
 Money Advice Performance Management Summary The Money Advice Performance Management Framework (MAPMF) has been developed in consultation with local authorities and other key stakeholders and it aims to
Insolvency Statistics and Debtor Profile Report 1 JULY 2015 TO 30 JUNE 2016
 Insolvency Statistics and Debtor Profile Report 1 JULY 2015 TO 30 JUNE 2016 MB12830 Contents Introduction 2 Annual Statistics 3 Key Characteristics of Debtors 11 Summary Instalment Orders 12 No Asset Procedures
LONG-TERM DMP? Could you be debt-free quicker? TACKLING DEBT MONEY ADVICE LIFESTYLE BUDGETING
 LONG-TERM DMP? Could you be debt-free quicker? TACKLING DEBT BUDGETING LIFESTYLE MONEY ADVICE STUCK IN A LONG-TERM DMP? Could you be debt-free quicker? Like most of our clients, you probably felt a great
Insolvency Statistics and Debtor Profile Report 1 JULY 2016 TO 30 JUNE 2017
 Insolvency Statistics and Debtor Profile Report 1 JULY 2016 TO 30 JUNE 2017 MB14340 Contents Introduction 2 Annual Statistics 3 Key Characteristics of Debtors 11 Summary Instalment Orders 12 No Asset Procedures
York, North Yorkshire And East Riding (Numbers)
") Labour Market Profile - The profile brings together data from several sources. Details about these and related terminology are given in the definitions section. Resident Population Total population (2017)
Labour Market Profile - The profile brings together data from several sources. Details about these and related terminology are given in the definitions section. Resident Population Total population (2017)
GCE AS/A Level 2520U20-1 NEW AS. ECONOMICS Unit 2 Economics in Action. A.M. MONDAY, 23 May hours PMT
 GCE AS/A Level 2520U20-1 NEW AS S16-2520U20-1 ECONOMICS Unit 2 Economics in Action A.M. MONDAY, 23 May 2016 2 hours 2520U201 01 ADDITIONAL MATERIALS In addition to this examination paper, you will need:
Mortgage Trends Update
 Mortgage Trends Update UK Finance: Mortgage Trends Update December 218 of first-time reaches 12-year high in 218 Key data highlights: There were 37, new first-time buyer mortgages completed in 218, some
Insolvency Statistics and Debtor Profile Report 1 JULY 2013 TO 30 JUNE 2014
 Insolvency Statistics and Debtor Profile Report 1 JULY 2013 TO 30 JUNE 2014 Contents Introduction 2 Annual Statistics 3 Key Characteristics of Debtors 11 Summary Instalment Orders 12 No Asset Procedures
Debt Dashboard Q2 2010
 Introduction Debt Dashboard Q2 Following the Government s announcement that it will review the debt solutions currently available in England and Wales 1, the focus of this quarter s Debt Dashboard is on
Great Britain (Numbers) All People 836,300 8,947,900 63,258,400 Males 405,700 4,404,400 31,165,300 Females 430,500 4,543,500 32,093,100
 All People 836,300 8,947,900 63,258,400 Males 405,700 4,404,400 31,165,300 Females 430,500 4,543,500 32,093,100") Labour Market Profile - The profile brings together data from several sources. Details about these and related terminology are given in the definitions section. Resident Population Total population (2015)
Labour Market Profile - The profile brings together data from several sources. Details about these and related terminology are given in the definitions section. Resident Population Total population (2015)
Insolvency Statistics and Debtor Profile Report 1 JULY 2014 TO 30 JUNE 2015
 Insolvency Statistics and Debtor Profile Report 1 JULY 2014 TO 30 JUNE 2015 Contents Introduction 2 Annual Statistics 3 Key Characteristics of Debtors 11 Summary Instalment Orders 12 No Asset Procedures
Money Advice Performance Management Summary. East Renfrewshire Council
 Money Advice Performance Management Summary The Money Advice Performance Management Framework (MAPMF) has been developed in consultation with local authorities and other key stakeholders and it aims to
ICE LIBOR Holiday Calendar 2019
 ICE LIBOR Holiday Calendar Date Day Holiday GBP CHF JPY 01-Jan- Tuesday New Year's Day O O O O O 21-Jan- Monday Martin Luther King's Birthday () P No O/N P P P 18-Feb- Monday President's Day () P No O/N
Money Advice Performance Management Summary. North Lanarkshire Council
 Money Advice Performance Management Summary North Lanarkshire Council The Money Advice Performance Management Framework (MAPMF) has been developed in consultation with local authorities and other key stakeholders
YouGov Survey Results
 Gender Age Social Grade Region Male Female 18 to 24 25 to 34 35 to 44 45 to 54 55+ ABC1 C2DE North Midlands East London South Wales Scotland 970 1145 207 348 347 349 864 1217 897 510 334 221 244 504 102
Great Britain (Numbers) All People 259,900 5,860,700 64,169,400 Males 128,900 2,904,300 31,661,600 Females 131,000 2,956,400 32,507,800
 All People 259,900 5,860,700 64,169,400 Males 128,900 2,904,300 31,661,600 Females 131,000 2,956,400 32,507,800") Labour Market Profile - Wolverhampton The profile brings together data from several sources. Details about these and related terminology are given in the definitions section. Resident Population Total
Labour Market Profile - Wolverhampton The profile brings together data from several sources. Details about these and related terminology are given in the definitions section. Resident Population Total
Great Britain (Numbers) All People 138,500 6,168,400 64,169,400 Males 69,400 3,040,300 31,661,600 Females 69,000 3,128,100 32,507,800
 All People 138,500 6,168,400 64,169,400 Males 69,400 3,040,300 31,661,600 Females 69,000 3,128,100 32,507,800") Labour Market Profile - The profile brings together data from several sources. Details about these and related terminology are given in the definitions section. Resident Population Total population (2017)
Labour Market Profile - The profile brings together data from several sources. Details about these and related terminology are given in the definitions section. Resident Population Total population (2017)
Guidance on consumer credit debt counselling
 Guidance on consumer credit debt counselling The following guidance explains when firms providing advice to a client will be performing the consumer credit regulated activity of debt counselling. The guidance
Market Monitor Q UK EQUITY RELEASE
 UK EQUITY RELEASE Market Monitor Q3 2014 EMBARGOED UNTIL 00:01 WEDNESDAY 12TH NOVEMBER 2014 Key Retirement, Baines House, 4 Midgery Court, Fulwood, Preston PR2 9ZH 02 03 04 05 06 08 Contents INTRODUCTION
Great Britain (Numbers) All People 564,600 5,860,700 64,169,400 Males 279,200 2,904,300 31,661,600 Females 285,400 2,956,400 32,507,800
 All People 564,600 5,860,700 64,169,400 Males 279,200 2,904,300 31,661,600 Females 285,400 2,956,400 32,507,800") Labour Market Profile - The profile brings together data from several sources. Details about these and related terminology are given in the definitions section. Resident Population Total population (2017)
Labour Market Profile - The profile brings together data from several sources. Details about these and related terminology are given in the definitions section. Resident Population Total population (2017)
West Midlands (Met County) (Numbers)
 (Numbers)") Labour Market Profile - The profile brings together data from several sources. Details about these and related terminology are given in the definitions section. Resident Population Total population (2017)
Labour Market Profile - The profile brings together data from several sources. Details about these and related terminology are given in the definitions section. Resident Population Total population (2017)
R3 Personal Debt Snapshot Wave 11 - June
 R Personal Debt Snapshot Wave June METHODOLOGY NOTE ComRes interviewed,00 GB adults online between st May and nd June 0. Data were weighted to be demographically representative of all British adults aged
A Creditfix info pack
 A Creditfix info pack In this guide How we can help Our process What is an IVA? Aimee Mann case study About Creditfix With over 70 years experience between our insolvency practitioners in the financial
Release date: 12 July 2018
 Release date: 12 July 218 UK Finance: Mortgage Trends Update May 218 Mortgage market sees pre-summer boost as remortgaging continues strong upward trend Key data highlights: There were 32,2 new first-time
Release date: 16 May 2018
 Release date: 16 May 218 UK Finance: Mortgage Trends Update March 218 Remortgaging market softens in March after busy start to year Key data highlights: There was 51bn of new lending to first-time in the
Linstock Budget 2014 UK Sample : 24th - 25th March 2014
 Total Gender within Gender Male Female Base Male Female 18-24 25-34 35-44 45-54 55+ 18-24 25-34 35-44 45-54 55+ 18-24 25-34 35-44 45-54 55+ OLB_q1. Thinking about managing your finances in, which ONE of
Money Advice Performance Management Summary. Angus Council
 Money Advice Performance Management Summary The Money Advice Performance Management Framework (MAPMF) has been developed in consultation with local authorities and other key stakeholders and it aims to
Money Advice Performance Management Summary. West Dunbartonshire Council
 Money Advice Performance Management Summary The Money Advice Performance Management Framework (MAPMF) has been developed in consultation with local authorities and other key stakeholders and it aims to
A guide to your new Prudential Annuity
 A guide to your new Prudential Annuity > Thank you for choosing Prudential to provide your pension annuity. You might be receiving your pension directly from us or we are paying it on behalf of your pension
Money Advice Performance Management Summary. Dumfries & Galloway Council
 Money Advice Performance Management Summary Dumfries & Galloway Council The Money Advice Performance Management Framework (MAPMF) has been developed in consultation with local authorities and other key
Money Advice Performance Management Summary. West Lothian Council
 Money Advice Performance Management Summary The Money Advice Performance Management Framework (MAPMF) has been developed in consultation with local authorities and other key stakeholders and it aims to
Great Britain (Numbers) All People 186,600 6,130,500 63,785,900 Males 92,600 3,021,700 31,462,500 Females 94,000 3,108,900 32,323,500
 All People 186,600 6,130,500 63,785,900 Males 92,600 3,021,700 31,462,500 Females 94,000 3,108,900 32,323,500") Labour Market Profile - The profile brings together data from several sources. Details about these and related terminology are given in the definitions section. Resident Population Total population (2016)
Labour Market Profile - The profile brings together data from several sources. Details about these and related terminology are given in the definitions section. Resident Population Total population (2016)
Great Britain (Numbers) All People 267,500 9,080,800 64,169,400 Males 132,500 4,474,400 31,661,600 Females 135,000 4,606,400 32,507,800
 All People 267,500 9,080,800 64,169,400 Males 132,500 4,474,400 31,661,600 Females 135,000 4,606,400 32,507,800") Labour Market Profile - The profile brings together data from several sources. Details about these and related terminology are given in the definitions section. Resident Population Total population (2017)
Labour Market Profile - The profile brings together data from several sources. Details about these and related terminology are given in the definitions section. Resident Population Total population (2017)
Great Britain (Numbers) All People 325,300 4,724,400 63,785,900 Males 164,500 2,335,000 31,462,500 Females 160,800 2,389,400 32,323,500
 All People 325,300 4,724,400 63,785,900 Males 164,500 2,335,000 31,462,500 Females 160,800 2,389,400 32,323,500") Labour Market Profile - The profile brings together data from several sources. Details about these and related terminology are given in the definitions section. Resident Population Total population (2016)
Labour Market Profile - The profile brings together data from several sources. Details about these and related terminology are given in the definitions section. Resident Population Total population (2016)
Great Britain (Numbers) All People 49,600 5,559,300 64,169,400 Males 24,000 2,734,200 31,661,600 Females 25,700 2,825,100 32,507,800
 All People 49,600 5,559,300 64,169,400 Males 24,000 2,734,200 31,661,600 Females 25,700 2,825,100 32,507,800") Labour Market Profile - The profile brings together data from several sources. Details about these and related terminology are given in the definitions section. Resident Population Total population (2017)
Labour Market Profile - The profile brings together data from several sources. Details about these and related terminology are given in the definitions section. Resident Population Total population (2017)
Great Britain (Numbers) All People 140,700 9,026,300 63,785,900 Males 68,100 4,447,200 31,462,500 Females 72,600 4,579,100 32,323,500
 All People 140,700 9,026,300 63,785,900 Males 68,100 4,447,200 31,462,500 Females 72,600 4,579,100 32,323,500") Labour Market Profile - The profile brings together data from several sources. Details about these and related terminology are given in the definitions section. Resident Population Total population (2016)
Labour Market Profile - The profile brings together data from several sources. Details about these and related terminology are given in the definitions section. Resident Population Total population (2016)
All People 280,000 6,168,400 64,169,400 Males 138,200 3,040,300 31,661,600 Females 141,800 3,128,100 32,507,800. Central Bedfordshire (Numbers)
") Labour Market Profile - The profile brings together data from several sources. Details about these and related terminology are given in the definitions section. Resident Population Total population (2017)
Labour Market Profile - The profile brings together data from several sources. Details about these and related terminology are given in the definitions section. Resident Population Total population (2017)
West Yorkshire (Met County) (Numbers)
 (Numbers)") Labour Market Profile - The profile brings together data from several sources. Details about these and related terminology are given in the definitions section. Resident Population Total population (2017)
Labour Market Profile - The profile brings together data from several sources. Details about these and related terminology are given in the definitions section. Resident Population Total population (2017)
Great Britain (Numbers) All People 64,000 6,168,400 64,169,400 Males 31,500 3,040,300 31,661,600 Females 32,500 3,128,100 32,507,800
 All People 64,000 6,168,400 64,169,400 Males 31,500 3,040,300 31,661,600 Females 32,500 3,128,100 32,507,800") Labour Market Profile - The profile brings together data from several sources. Details about these and related terminology are given in the definitions section. Resident Population Total population (2017)
Labour Market Profile - The profile brings together data from several sources. Details about these and related terminology are given in the definitions section. Resident Population Total population (2017)
All People 263,400 5,450,100 64,169,400 Males 129,400 2,690,500 31,661,600 Females 134,000 2,759,600 32,507,800. Rotherham (Numbers)
") Labour Market Profile - The profile brings together data from several sources. Details about these and related terminology are given in the definitions section. Resident Population Total population (2017)
Labour Market Profile - The profile brings together data from several sources. Details about these and related terminology are given in the definitions section. Resident Population Total population (2017)
Great Britain (Numbers) All People 283,500 7,224,000 63,785,900 Males 140,400 3,563,200 31,462,500 Females 143,100 3,660,800 32,323,500
 All People 283,500 7,224,000 63,785,900 Males 140,400 3,563,200 31,462,500 Females 143,100 3,660,800 32,323,500") Labour Market Profile - The profile brings together data from several sources. Details about these and related terminology are given in the definitions section. Resident Population Total population (2016)
Labour Market Profile - The profile brings together data from several sources. Details about these and related terminology are given in the definitions section. Resident Population Total population (2016)
North West Leicestershire (Numbers) All People 98,600 4,724,400 63,785,900 Males 48,900 2,335,000 31,462,500 Females 49,800 2,389,400 32,323,500
 All People 98,600 4,724,400 63,785,900 Males 48,900 2,335,000 31,462,500 Females 49,800 2,389,400 32,323,500") Labour Market Profile - The profile brings together data from several sources. Details about these and related terminology are given in the definitions section. Resident Population Total population (2016)
Labour Market Profile - The profile brings together data from several sources. Details about these and related terminology are given in the definitions section. Resident Population Total population (2016)
Great Britain (Numbers) All People 348,000 8,825,000 64,169,400 Males 184,000 4,398,800 31,661,600 Females 164,000 4,426,200 32,507,800
 All People 348,000 8,825,000 64,169,400 Males 184,000 4,398,800 31,661,600 Females 164,000 4,426,200 32,507,800") Labour Market Profile - The profile brings together data from several sources. Details about these and related terminology are given in the definitions section. Resident Population Total population (2017)
Labour Market Profile - The profile brings together data from several sources. Details about these and related terminology are given in the definitions section. Resident Population Total population (2017)
Great Britain (Numbers) All People 176,200 6,168,400 64,169,400 Males 87,200 3,040,300 31,661,600 Females 89,000 3,128,100 32,507,800
 All People 176,200 6,168,400 64,169,400 Males 87,200 3,040,300 31,661,600 Females 89,000 3,128,100 32,507,800") Labour Market Profile - The profile brings together data from several sources. Details about these and related terminology are given in the definitions section. Resident Population Total population (2017)
Labour Market Profile - The profile brings together data from several sources. Details about these and related terminology are given in the definitions section. Resident Population Total population (2017)
All People 437,100 5,450,100 64,169,400 Males 216,700 2,690,500 31,661,600 Females 220,500 2,759,600 32,507,800. Kirklees (Numbers)
") Labour Market Profile - The profile brings together data from several sources. Details about these and related terminology are given in the definitions section. Resident Population Total population (2017)
Labour Market Profile - The profile brings together data from several sources. Details about these and related terminology are given in the definitions section. Resident Population Total population (2017)
Power Accountants Association Annual Meeting Potential Impacts from Oct 2015 Rate Change
 Power Accountants Association Annual Meeting Potential Impacts from Oct 2015 Rate Change Material Provided by: Chris Mitchell Chris Mitchell Management Consultants (CMMC) mail@chrismitchellmc.com 5/14/2015
Fraser of Allander Institute & Scottish Centre for Employment Research Scottish Labour Market Trends
 Fraser of Allander Institute & Scottish Centre for Employment Research Scottish Vol 2 No 3 The Fraser of Allander Institute (FAI) is a leading economic research institute with over 40 years of experience
R3 Personal Debt Snapshot Wave 10 - February
 R Personal Debt Snapshot Wave 0 February METHODOLOGY NOTE ComRes interviewed,00 adults online between st and rd February 0. Data were weighted to be demographically representative of all British adults
Great Britain (Numbers) All People 497,900 7,219,600 63,785,900 Males 245,600 3,560,900 31,462,500 Females 252,300 3,658,700 32,323,500
 All People 497,900 7,219,600 63,785,900 Males 245,600 3,560,900 31,462,500 Females 252,300 3,658,700 32,323,500") Labour Market Profile - The profile brings together data from several sources. Details about these and related terminology are given in the definitions section. Resident Population Total population (2016)
Labour Market Profile - The profile brings together data from several sources. Details about these and related terminology are given in the definitions section. Resident Population Total population (2016)
YourPension. INSIDE Pensions Increase. Local Pensions Board. Fraud Prevention. Annual Forum. Pay Dates 2017/18. Pensioner Spring Newsletter 2017
 YourPension Pensioner Spring Newsletter 2017 INSIDE Pensions Increase Local Pensions Board Fraud Prevention Annual Forum Pay Dates 2017/18 YourPension 2017 Welcome......to the 2017 Spring Newsletter. As
All People 175,800 5,860,700 64,169,400 Males 87,400 2,904,300 31,661,600 Females 88,400 2,956,400 32,507,800. Telford And Wrekin (Numbers)
") Labour Market Profile - The profile brings together data from several sources. Details about these and related terminology are given in the definitions section. Resident Population Total population (2017)
Labour Market Profile - The profile brings together data from several sources. Details about these and related terminology are given in the definitions section. Resident Population Total population (2017)
Great Britain (Numbers) All People 1,201,900 7,258,600 64,169,400 Males 593,300 3,581,200 31,661,600 Females 608,600 3,677,400 32,507,800
 All People 1,201,900 7,258,600 64,169,400 Males 593,300 3,581,200 31,661,600 Females 608,600 3,677,400 32,507,800") Labour Market Profile - The profile brings together data from several sources. Details about these and related terminology are given in the definitions section. Resident Population Total population (2017)
Labour Market Profile - The profile brings together data from several sources. Details about these and related terminology are given in the definitions section. Resident Population Total population (2017)
Merseyside (Met County) (Numbers) All People 1,416,800 7,258,600 64,169,400 Males 692,300 3,581,200 31,661,600 Females 724,600 3,677,400 32,507,800
 (Numbers) All People 1,416,800 7,258,600 64,169,400 Males 692,300 3,581,200 31,661,600 Females 724,600 3,677,400 32,507,800") Labour Market Profile - The profile brings together data from several sources. Details about these and related terminology are given in the definitions section. Resident Population Total population (2017)
Labour Market Profile - The profile brings together data from several sources. Details about these and related terminology are given in the definitions section. Resident Population Total population (2017)
Stockton-On- Tees (Numbers) All People 196,500 2,644,700 64,169,400 Males 96,800 1,297,900 31,661,600 Females 99,700 1,346,800 32,507,800
 All People 196,500 2,644,700 64,169,400 Males 96,800 1,297,900 31,661,600 Females 99,700 1,346,800 32,507,800") Labour Market Profile - The profile brings together data from several sources. Details about these and related terminology are given in the definitions section. Resident Population Total population (2017)
Labour Market Profile - The profile brings together data from several sources. Details about these and related terminology are given in the definitions section. Resident Population Total population (2017)
Great Britain (Numbers) All People 843,800 9,026,300 63,785,900 Males 410,000 4,447,200 31,462,500 Females 433,800 4,579,100 32,323,500
 All People 843,800 9,026,300 63,785,900 Males 410,000 4,447,200 31,462,500 Females 433,800 4,579,100 32,323,500") Labour Market Profile - The profile brings together data from several sources. Details about these and related terminology are given in the definitions section. Resident Population Total population (2016)
Labour Market Profile - The profile brings together data from several sources. Details about these and related terminology are given in the definitions section. Resident Population Total population (2016)
All People 295,800 2,644,700 64,169,400 Males 149,400 1,297,900 31,661,600 Females 146,400 1,346,800 32,507,800. Newcastle Upon Tyne (Numbers)
") Labour Market Profile - The profile brings together data from several sources. Details about these and related terminology are given in the definitions section. Resident Population Total population (2017)
Labour Market Profile - The profile brings together data from several sources. Details about these and related terminology are given in the definitions section. Resident Population Total population (2017)
Capturing equity gains whilst protecting portfolios
 Capturing equity gains whilst protecting portfolios Edward Park Q2 2018 MSCI North America Total Return in USD (2017 Discrete Calendar Months) 4.00% 3.50% 3.00% 2.50% 2.00% 1.50% 1.00% 0% 0.00% Jan-17
Brighton And Hove (Numbers) All People 288,200 9,080,800 64,169,400 Males 144,800 4,474,400 31,661,600 Females 143,400 4,606,400 32,507,800
 All People 288,200 9,080,800 64,169,400 Males 144,800 4,474,400 31,661,600 Females 143,400 4,606,400 32,507,800") Labour Market Profile - The profile brings together data from several sources. Details about these and related terminology are given in the definitions section. Resident Population Total population (2017)
Labour Market Profile - The profile brings together data from several sources. Details about these and related terminology are given in the definitions section. Resident Population Total population (2017)
Understanding Landlords
 Understanding Landlords A study of private landlords in the UK using the Wealth and Assets Survey Chris Lord, James Lloyd and Matt Barnes July 2013 www.strategicsociety.org.uk! Published by the Strategic
Hammersmith And Fulham (Numbers) All People 183,000 8,825,000 64,169,400 Males 90,400 4,398,800 31,661,600 Females 92,600 4,426,200 32,507,800
 All People 183,000 8,825,000 64,169,400 Males 90,400 4,398,800 31,661,600 Females 92,600 4,426,200 32,507,800") Labour Market Profile - The profile brings together data from several sources. Details about these and related terminology are given in the definitions section. Resident Population Total population (2017)
Labour Market Profile - The profile brings together data from several sources. Details about these and related terminology are given in the definitions section. Resident Population Total population (2017)
All People 23,100 5,424,800 64,169,400 Males 11,700 2,640,300 31,661,600 Females 11,300 2,784,500 32,507,800. Shetland Islands (Numbers)
") Labour Market Profile - The profile brings together data from several sources. Details about these and related terminology are given in the definitions section. Resident Population Total population (2017)
Labour Market Profile - The profile brings together data from several sources. Details about these and related terminology are given in the definitions section. Resident Population Total population (2017)
Tonbridge And Malling (Numbers) All People 128,900 9,080,800 64,169,400 Males 63,100 4,474,400 31,661,600 Females 65,800 4,606,400 32,507,800
 All People 128,900 9,080,800 64,169,400 Males 63,100 4,474,400 31,661,600 Females 65,800 4,606,400 32,507,800") Labour Market Profile - The profile brings together data from several sources. Details about these and related terminology are given in the definitions section. Resident Population Total population (2017)
Labour Market Profile - The profile brings together data from several sources. Details about these and related terminology are given in the definitions section. Resident Population Total population (2017)
Great Britain (Numbers) All People 2,300 5,517,000 63,785,900 Males 1,200 2,712,300 31,462,500 Females 1,100 2,804,600 32,323,500
 All People 2,300 5,517,000 63,785,900 Males 1,200 2,712,300 31,462,500 Females 1,100 2,804,600 32,323,500") Labour Market Profile - The profile brings together data from several sources. Details about these and related terminology are given in the definitions section. Resident Population Total population (2016)
Labour Market Profile - The profile brings together data from several sources. Details about these and related terminology are given in the definitions section. Resident Population Total population (2016)
Great Britain (Numbers) All People 1,180,900 6,168,400 64,169,400 Males 578,500 3,040,300 31,661,600 Females 602,500 3,128,100 32,507,800
 All People 1,180,900 6,168,400 64,169,400 Males 578,500 3,040,300 31,661,600 Females 602,500 3,128,100 32,507,800") Labour Market Profile - The profile brings together data from several sources. Details about these and related terminology are given in the definitions section. Resident Population Total population (2017)
Labour Market Profile - The profile brings together data from several sources. Details about these and related terminology are given in the definitions section. Resident Population Total population (2017)
Cornwall And Isles Of Scilly (Numbers)
") Labour Market Profile - The profile brings together data from several sources. Details about these and related terminology are given in the definitions section. Resident Population Total population (2017)
Labour Market Profile - The profile brings together data from several sources. Details about these and related terminology are given in the definitions section. Resident Population Total population (2017)