Debt Statistics. A consumer focus. January 2017
|
|
|
- Camron Norris
- 6 years ago
- Views:
Transcription

1 Debt Statistics A consumer focus January 2017

2 Contents 3. Message from the Chair 4. About Debt Advice Foundation 5. At-a-glance 6. Overview 7. Age group 8. Gender 9. Region 10. Residential status 11. Employment status 12. Household demographics 13. Helpline outcomes 14. Appendix (data tables) Debt Advice Foundation 2017 Page 2

3 Message from the Chair Welcome to Debt Advice Foundation's January 2017 helpline statistics update. With the amount of personal borrowing approaching the record levels seen prior to the 2008 global economic recession, it's important that the debt advice sector does everything it can to prepare itself for the inevitable surge in demand for debt advice. One way we can do this is through research. Research not only helps the charity understand and adapt to the ever changing credit landscape and how service-users are impacted by those changes but it also shapes and informs Government and regulatory policy more broadly, both in the debt advice and related sectors. Understanding how and why people call the charity's helpline, how they use the information they are given and how effective that information is, allows us to develop and improve our service for the benefit of future service-users. The more research we have access to, the more likely we are to spot emerging trends that may, for example, influence the way borrowers use credit in the future and how we, both as a charity and as a sector more broadly, might react to those changes. That is why we have developed this monthly statistical resource. Please feel free to get in touch if you have any questions or comments regarding the charity's statistical releases. Dennis Benson OBE Chair Debt Advice Foundation 2017 Page 3
4 About Debt Advice Foundation Debt Advice Foundation is a registered national debt advice and charity in England and Wales (no ). At the heart of the charity s philosophy is the prevention and cure of unmanageable consumer debt. Whilst our primary focus is on helping those that are in need of advice and support today, we strongly believe that improving financial literacy amongst the next generation of credit users is key to tackling increasing levels of unmanageable consumer debt in the UK. The charity seeks to carry out these objectives through its free telephone debt counselling service, which helps over 10,000 people every year, and through DebtAware, the charity's award winning debt programme for schoolchildren. The charity holds the Advice Service Alliance s Advice Quality Standard (AQS) and is listed by Money Advice Service as an accredited, free provider of debt advice on its online debt advice locator page (the Money Advice Service is an independent service set up by government to help people manage their money). The charity is a member of AdviceUK, the UK s largest support network for free, independent advice centres and all of the charity's advisers are members of the Institute of Money Advisers (IMA), a charitable body that aims to promote free money advice and develop professional standards. The charity is also a registered supporter of the All-Party Parliamentary Group on Financial Education for Young People and the All-Party Parliamentary Group on Debt and Personal Finance. Debt Advice Foundation is authorised and regulated by the Financial Conduct Authority (no ). Debt Advice Foundation 2017 Page 4


5 Debt Advice Foundation 2017 Page 5
 242 113 126 159 -income ratio 21.3% 20.")

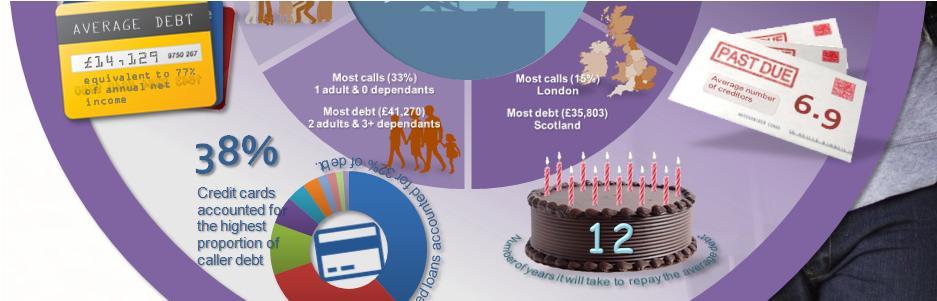
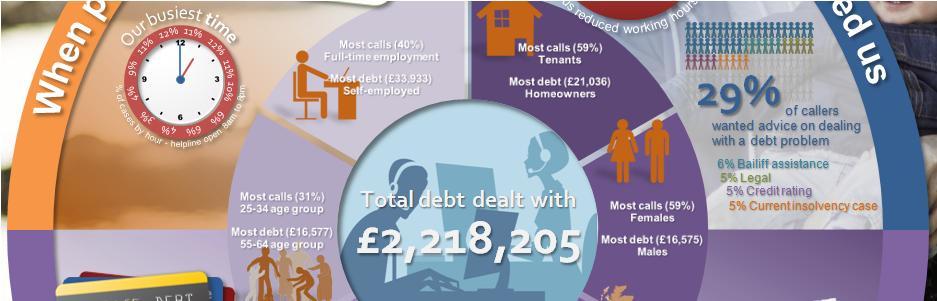
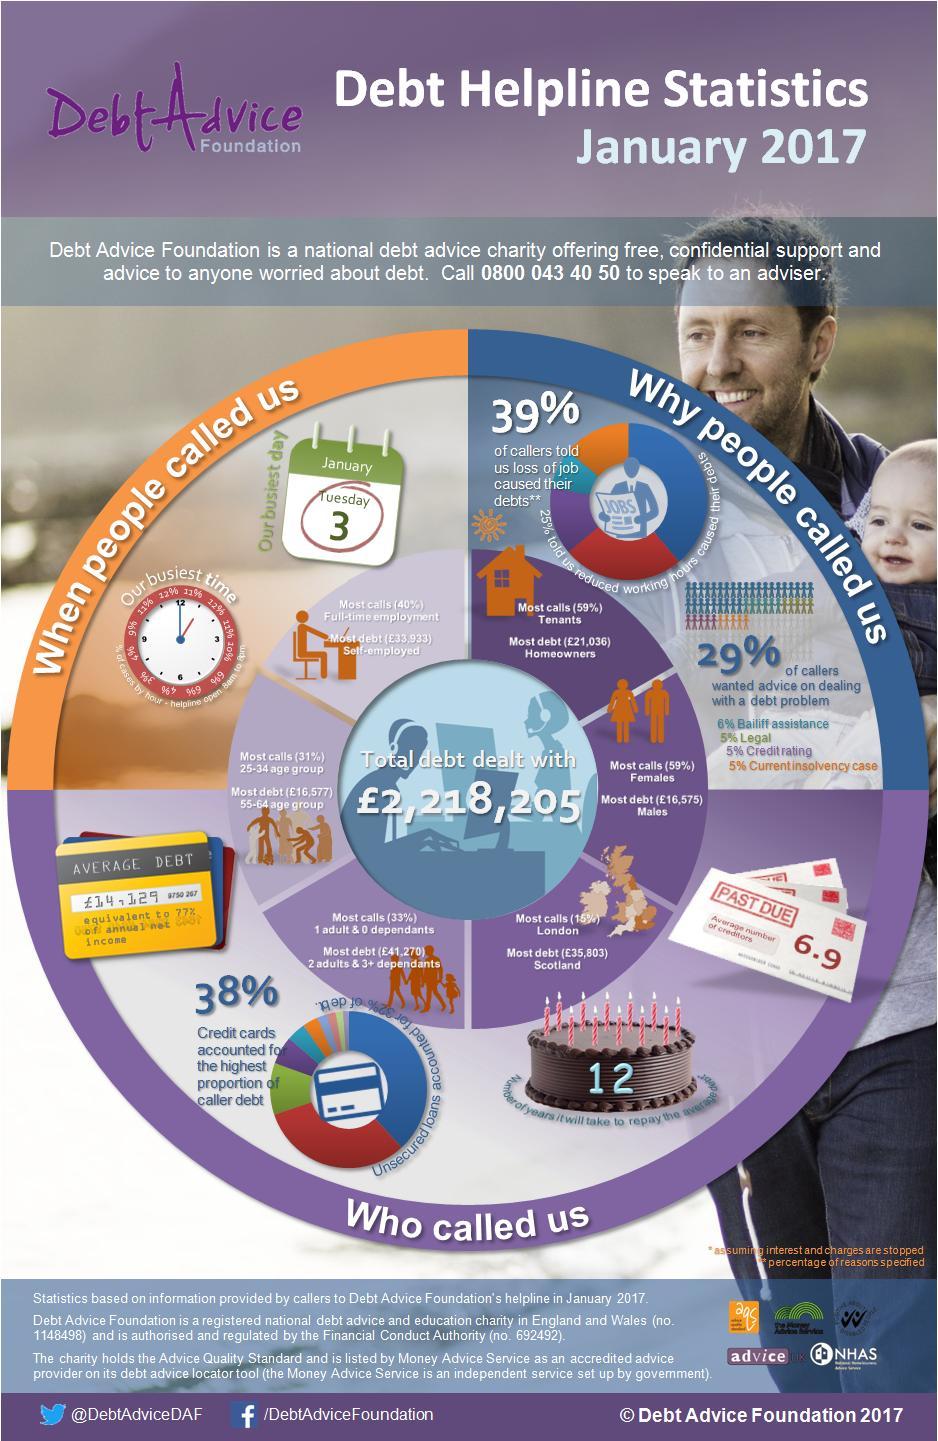
6 Jan month average Dec 16 Jan 17 Jan month average Dec 16 Jan % 1.1% % % 6.6% 8.7% 8.2% % 12.1% 10.2% 13.4% % 16.3% Repayment term (months) income ratio 21.3% 20. Jan month average Dec 16 Jan 17 5,530 4,580 1, ,568 1,496 1,663 1,518 1,738 1,619 1,538 1,437 6,219 2, ,009 Monthly amount ( ) Impoverishment index 908 Feb 16 Mar 16 Apr 16 May 16 Jun 16 Jul 16 Aug 16 Sep 16 Oct 16 Nov 16 Dec 16 Jan ,334 16,379 15,048 16,084 14,120 14,486 18,340 18,967 18,789 18,259 17,959 14,129 Number of creditors 30.6% % 16.6% 6.4% 3.2% % 1.3% 1.3% 1.3% Debt Advice Foundation - Debt Helpline Statistics (January 2017) 1. Overview This section provides an overview of callers to the charity's helpline in January The dataset comprises completed advice cases only (this means cases where a full financial assessment has taken place and a debt solution has been recommended). The charity's helpline advisers dealt with a total of 2,218,205 of unsecured debt in January 2017 at an average of 14,129 per case (full financial assessments). c1.1 overview c1.2 profile (January 2017) Average unsecured debt 1 20,000 18,000 16,000 14,000 12,000 10,000 8,000 6,000 4,000 2, Average number of unsecured creditors Includes unsecured credit facilities such as credit cards, unsecured loans, short term (payday) loans, overdrafts, store cards and catalogue debts. Secured debts, such as mortgages, and priority arrears (for example rent and council tax debts) are not included. Total unsecured debt band c1.3 by type (January 2017) Jan month average Dec 16 Jan 17 7,649 6,804 6,100 5,992 6,710 5,000 10,000 15,000 20,000 1,616 1,005 Credit card Unsecured loan Other debts Overdraft Store card Short term loan Utility debt Benefit overpayment Council tax debt Crown tax debt Trade debt c1.4 Client financial profile (January 2017) Net monthly household income Monthly household expenditure 2 Impoverishment index 3 2,000 1,500 1, % % 1 2 Monthly household expenditure does not include contractual unsecured debt repayments but does include priority arrears payments. 3 The percentage of cases that have a negative disposable income and are unable to meet the existing essential household expenditure. 1.5 Specified cause of financial impairment (January 2017) 1.6 Debt servicing (January 2017) Loss of job Reduced working hours Pregnancy Illness Divorce Separation Average repayment term (months) 4 to annual income ratio % 86% % 86% 84% % % % 50 74% 72% Average number of months to repay the total value of unsecured liabilities in full based on the available disposable income (after monthly essential household expenditure) assuming interest and charges are stopped. 5 Total amount of unsecured debt as a percentage of total annual net income. Debt Advice Foundation 2017 Page 6
 1,788 1,662 1,510 1,359 Impoverishment index 1,938 5,972 18-24 25-34 35-44 45-54 55-64 65+ 18-24 25-34 35-44 45-54 55-64 65+ 6,540")
7 % 7% 6% % % Number of months 36% ,734 3, ,483 1,360 1,737 1,639 1,546 1,471 7,322 6,739 Monthly amount ( ) 1,788 1,662 1,510 1,359 Impoverishment index 1,938 5, ,540 13,350 16,419 14,960 16,577 13,996 31% 2 1. Population weighting index 1 Debt Advice Foundation - Debt Helpline Statistics (January 2017) 2. Age group This section provides an overview of callers to the helpline in January 2017, broken down by age group. The age group with the highest average unsecured debt in January 2017 was the age group ( 16,577).The age group with the highest helpline engagement was the age group, which was 83% more likely to call the helpline than the UK average. c2.1 Average unsecured debt (January 2017) c2.2 Case weighting (January 2017) 18,000 16,000 14,000 12,000 10,000 8,000 6,000 4,000 2, Case weighting (January 2017) Regional contact population weighting index The population weighting index is calculated by dividing the number of helpline contacts by the latest ONS population estimate for each age -group and comparing it to the UK average. This statistic provides a more useful relative measure of age - group helpline engagement by removing age-group population bias. c2.3 c2.5 by type (January 2017) ,442 4,962 8,548 2,216 5,186 5,000 10,000 15,000 20,000 Specified cause of financial impairment (January 2017) Credit card Unsecured loan Other debts Overdraft Store card Short term loan Utility debt Benefit overpayment Council tax debt c2.4 c2.6 Client financial profile (January 2017) Net monthly household income Monthly household expenditure 2 Impoverishment index % 2, ,500 1, % 15.4% 15.6% 5.6% 2 Monthly household expenditure does not include contractual unsecured debt repayments but does include priority arrears payments. 3 The percentage of cases that have a negative disposable income and are unable to meet the existing essential household expenditure. Debt servicing (January 2017) Loss of job Reduced working hours Pregnancy Illness Divorce Separation Average repayment term (months) 4 to annual income ratio % % 77% Average number of months to repay the total value of unsecured liabilities in full based on the available disposable income (after monthly essential household expenditure) assuming interest and charges are stopped. 5 Total amount of unsecured debt as a percentage of total annual net income. Debt Advice Foundation 2017 Page 7
 Debt Advice Foundation - Debt Helpline Statistics (January 2017) 3.")
8 Male Female Male Female % 7% 12% 12% 1 Number of months 24% Male Female 6,070 6,301 1,333 1,215 1,671 1,579 5,019 3,360 Monthly amount ( ) Impoverishment index Male Female Male Female 16,575 12,316 41% 5 (main client) Debt Advice Foundation - Debt Helpline Statistics (January 2017) 3. Gender This section provides an overview of callers to the helpline in January 2017, broken down by gender. Males had the highest average amount of debt in January 2017 ( 16,575).The highest weighting of callers to the helpline in the period was females (5). c3.1 Average unsecured debt (January 2017) c3.2 Case weighting (January 2017) 18,000 16,000 14,000 12,000 10,000 8,000 6,000 4,000 2, c3.3 by type (January 2017) Credit card c3.4 Client financial profile (January 2017) Female Male Unsecured loan Other debts Overdraft Store card Short term loan Utility debt Benefit overpayment Council tax debt Crown tax debt 5,000 10,000 15,000 20,000 Average debt Net monthly household income Monthly household expenditure 1 Impoverishment index 2 1, % 1, % 1, % 1, , % % % % Monthly household expenditure does not include contractual unsecured debt repayments but does include priority arrears payments. 2 The percentage of cases that have a negative disposable income and are unable to meet the existing essential household expenditure. c3.5 Specified cause of financial impairment (January 2017) c3.6 Debt servicing (January 2017) 2 1 Loss of job Reduced working hours Pregnancy Illness Divorce Separation Average repayment term (months) 3 to annual income ratio % % Average number of months to repay the total value of unsecured liabilities in full based on the available disposable income (after monthly essential household expenditure) assuming interest and charges are stopped. 4 Total amount of unsecured debt as a percentage of total annual net income. Debt Advice Foundation 2017 Page 8

9 East East of England London North East North West Northern Ireland Scotland South East South West Wales West Yorkshire and East East of England London North East North West Northern Ireland Scotland South East South West Wales West Yorkshire and % 2 43% 4 Number of months East East of England London North East North West Northern Ireland Scotland South East South West Wales West Yorkshire and the Humber Monthly amount ( ) 2,178 1,931 1,415 1,345 1,601 1,568 1,129 1,067 1,524 1,434 1,908 1,654 1,553 1,293 1,460 1,369 1,244 1,104 1,453 1,367 1,497 1,440 1,768 1,664 Impoverishment index East East of England London North East North West Northern Ireland Scotland South East South West Wales West Yorkshire and the Humber East East of England London North East North West Northern Ireland Scotland South East South West Wales West Yorkshire and the Humber 21,282 12,062 16,021 9,434 8,850 14,983 35,803 14,419 9,782 11,432 16,397 13, % 1% 3% 4% Population weighting index 1 Debt Advice Foundation - Debt Helpline Statistics (January 2017) 4. Region This section provides an overview of callers to the helpline in January 2017, broken down by region. The region with the highest average unsecured debt in January 2017 was Scotland ( 35,803).The region with the highest helpline engagement was East of England which was 36% more likely to call the helpline than the UK average. c4.1 Average unsecured debt (January 2017) c4.2 Case weighting (January 2017) 40,000 35,000 30,000 25,000 20,000 15,000 10,000 5,000 16% 12% 6% 4% 2% Case weighting (January 2017) Regional contact population weighting index The population weighting index is calculated by dividing the number of helpline contacts by the latest ONS population estimate for each region and comparing it to the UK average. This statistic provides a more useful relative measure of regional helpline engagement by removing regional population bias. c4.3 by type (January 2017) Credit card c4.4 Client financial profile (January 2017) Yorkshire and West Wales South West South East Scotland Unsecured loan Other debts Overdraft Store card Short term loan Northern Ireland Utility debt North West North East Benefit overpayment London Council tax debt East of England Crown tax debt East Trade debt 10,000 20,000 30,000 40,000 c4.5 Specified cause of financial impairment (January 2017) c4.6 Net monthly household income Monthly household expenditure 2 Iimpoverishment index % 2, , % 2 1, % 16.7% 16.7% 16.7% 1, % Monthly household expenditure does not include contractual unsecured debt repayments but does include priority arrears payments. 3 The percentage of cases that have a negative disposable income and are unable to meet the existing essential household expenditure. Debt servicing (January 2017) Loss of job Reduced working hours Pregnancy Illness Divorce Separation Average repayment term (months) 4 to annual income ratio % % 81% 83% 82% % % 66% 64% Average number of months to repay the total value of unsecured liabilities in full based on the available disposable income (after monthly essential household expenditure) assuming interest and charges are stopped. 5 Total amount of unsecured debt as a percentage of total annual net income. Debt Advice Foundation 2017 Page 9
 5.")
10 % 1 1 Number of months 26% 2 2,421 2, ,854 1,717 1, ,338 6,253 2,607 8,082 Monthly amount ( ) 1,609 1,529 Impoverishment index 4,451 4,148 7,801 21,036 11,292 12, % 5 Debt Advice Foundation - Debt Helpline Statistics (January 2017) 5. Residential status This section provides an overview of callers to the helpline in January 2017, broken down by residential status. Homeowner was the group with the highest average unsecured debt ( 21,036) in January Tenant was the most likely group to call the charity for advice (5). c5.1 Average unsecured debt (January 2017) c5.2 Case weighting (January 2017) 25, ,000 15, ,000 5,000 Homeowner Unknown Tenant Homeowner Unknown Tenant c5.3 c5.5 by type (January 2017) Tenant Unknown Homeowner Credit card Unsecured loan Other debts Overdraft Store card Short term loan Utility debt Benefit overpayment Council tax debt Crown tax debt Trade debt 10,000 20,000 30,000 Specified cause of financial impairment (January 2017) c5.4 c5.6 Client financial profile (January 2017) Net monthly household income Monthly household expenditure 1 Impoverishment index , % 1,500 1, Homeowner Unknown Tenant 1 Monthly household expenditure does not include contractual unsecured debt repayments but does include priority arrears payments. 2 The percentage of cases that have a negative disposable income and are unable to meet the existing essential household expenditure. Debt servicing (January 2017) Homeowner Unknown Tenant Loss of job Reduced working hours Pregnancy Illness Divorce Separation Average repayment term (months) 3 to annual income ratio % Homeowner Unknown Tenant Average number of months to repay the total value of unsecured liabilities in full based on the available disposable income (after monthly essential household expenditure) assuming interest and charges are stopped. 4 Total amount of unsecured debt as a percentage of total annual net income. Debt Advice Foundation 2017 Page 10
 Retired 1,699 1,512 1,761 1,687 2,043 1,962 1,229 1,215 578 584 Monthly amount ( ) 1,644 1,510 Impoverishment index d (Other) d (JSA) Retired Selfemployed d (Other) d (JSA) Retired 13,075")

11 Self-employed d (Other) d (JSA) Retired Self-employed d (Other) d (JSA) Retired % 6% Neg DI, can't repay Number of months 67% Selfemployed Selfemployed d (Other) d (JSA) Retired 1,699 1,512 1,761 1,687 2,043 1,962 1,229 1, Monthly amount ( ) 1,644 1,510 Impoverishment index d (Other) d (JSA) Retired Selfemployed d (Other) d (JSA) Retired 13,075 14,513 33,933 7,294 9,372 22, % Debt Advice Foundation - Debt Helpline Statistics (January 2017) 6. Employment status This section provides an overview of callers to the helpline in January 2017, broken down by status. Self-employed was the group with the highest average unsecured debt ( 33,933) in January was the most likely group to call us for advice (4). c6.1 Average unsecured debt (January 2017) c6.2 Case weighting (January 2017) 40,000 35,000 30,000 25,000 20,000 15,000 10,000 5, c6.3 by type (January 2017) Retired d (JSA) d (Other) Other debts Overdraft Store card Short term loan Utility debt Self-employed Benefit overpayment Council tax debt Crown tax debt Trade debt 10,000 20,000 30,000 40,000 Credit card Unsecured loan c6.4 Client financial profile (January 2017) Net monthly household income Monthly household expenditure 1 Impoverishment index 2 2, , , % 15.4% 16.7% 20. 1, c6.5 Specified cause of financial impairment (January 2017) c6.6 1 Monthly household expenditure does not include contractual unsecured debt repayments but does include priority arrears payments. 2 The percentage of cases that have a negative disposable income and are unable to meet the existing essential household expenditure. Debt servicing (January 2017) Loss of job Reduced working hours Pregnancy Illness Divorce Separation Average repayment term (months) 3 to annual income ratio % 7 77% 77% Average number of months to repay the total value of unsecured liabilities in full based on the available disposable income (after monthly essential household expenditure) assuming interest and charges are stopped. 4 Total amount of unsecured debt as a percentage of total annual net income. Debt Advice Foundation 2017 Page 11
 1,560 1,477 1,530 1,469 1,855 1,769 1,711")
12 1 adult/0 1 adult/1 1 adult/2 1 adult/3+ 2 adults/0 2 adults/1 2 adults/2 2 adults/3+ 1 adult/0 1 adult/1 1 adult/2 1 adult/3+ 2 adults/0 2 adults/1 2 adults/2 2 adults/ % 1 Number of months 3 33% 33% adult/0 1 adult/1 1 adult/2 1 adult/3+ 2 adults/0 2 adults/1 2 adults/2 2 adults/ Monthly amount ( ) 1,560 1,477 1,530 1,469 1,855 1,769 1,711 1,590 1,735 1,623 3,068 2,834 2,497 2,232 Impoverishment index 1 adult & 0 1 adult & 1 1 adult & 2 1 adult & 3+ 2 adults & 0 2 adults & 1 2 adults & 2 2 adults & 3+ 1 adult & 0 1 adult & 1 1 adult & 2 1 adult & 3+ 2 adults & 0 2 adults & 1 2 adults & 2 2 adults & 3+ 10,705 9,719 9,452 13,270 19,357 9,690 26,345 41,270 33% 1 Debt Advice Foundation - Debt Helpline Statistics (January 2017) 7. Household demographics This section provides an overview of callers to the helpline in January 2017, broken down by household demographics. 2 adults & 3+ was the group with the highest average unsecured debt ( 41,270) in January adult & 0 was the most likely group to call us for advice (33%). c7.1 Average unsecured debt (January 2017) c7.2 Case weighting (January 2017) 45,000 40,000 35,000 30,000 25,000 20,000 15,000 10,000 5, c7.3 by type (January 2017) 2 adults/3+ 2 adults/2 2 adults/1 2 adults/0 1 adult/3+ 1 adult/2 1 adult/1 1 adult/0 10,000 20,000 30,000 40,000 Credit card Unsecured loan Other debts Overdraft Store card Short term loan Utility debt Benefit overpayment Council tax debt c7.4 Client financial profile (January 2017) Net monthly household income Monthly household expenditure % Impoverishment index 2 3, , , % 16.7% 16.7% 20. 2,000 1, % , c7.5 Specified cause of financial impairment (January 2017) c7.6 1 Monthly household expenditure does not include contractual unsecured debt repayments but does include priority arrears payments. 2 The percentage of cases that have a negative disposable income and are unable to meet the existing essential household expenditure. Debt servicing (January 2017) Loss of job Reduced working hours Pregnancy Illness Divorce Separation Average repayment term (months) 3 to annual income ratio % 77% 77% Average number of months to repay the total value of unsecured liabilities in full based on the available disposable income (after monthly essential household expenditure) assuming interest and charges are stopped. 4 Total amount of unsecured debt as a percentage of total annual net income. Debt Advice Foundation 2017 Page 12
 Benefits (5) Disputed liability (4) Other (22) Enquiry Feb 16 Mar 16 Apr 16 May 16 Jun 16 Jul 16 Aug 16 Sep 16 Oct 16 Nov 16 Dec 16 Jan 17 Feb 16 Mar 16 Apr 16 May 16 Jun 16 Jul 16 Aug 16")
13 Outcome DRO (7) IVA/Trust Deed (6) Bankruptcy (6) Budgeting advice (4) Informal Arrangement (4) Other (3) 3rd party call (17) Bailiff assistance (6) Legal (6) Credit rating (6) Current insolvency case (5) Benefits (5) Disputed liability (4) Other (22) Enquiry Feb 16 Mar 16 Apr 16 May 16 Jun 16 Jul 16 Aug 16 Sep 16 Oct 16 Nov 16 Dec 16 Jan 17 Feb 16 Mar 16 Apr 16 May 16 Jun 16 Jul 16 Aug 16 Sep 16 Oct 16 Nov 16 Dec 16 Jan 17 33% 32% 32% 32% 2 34% 26% 23% 2 33% % 26% 21% 21% 16% 12% 16% 16% 22% 22% 21% 23% 27% 32% 2 27% 21% 21% 31% 67% % 66% 7 74% 77% 72% 67% % % % 7% Debt Advice Foundation - Debt Helpline Statistics (January 2017) 8. Helpline outcomes This section provides an overview of helpline activity in January 2017, including the types of enquiries dealt with as well as the recommendations made by the charity's advisers. 33% of callers to the charity's helpline required a full financial assessment by a helpline adviser whilst 67% required assistance with a specific debt-related issue. 8.1 Case outcome analysis 8.2 Financial assessment outcomes 4 Financial assessment outcomes 2 Non-financial assessment outcomes Budgeting advice Other Individual Voluntary Arrangement/Trust Deed Debt Relief Order Informal Arrangement 5 Debt Arrangement Scheme Bankruptcy Cases that required a full financial assessment and managed solution intervention (see 8.2) 3 Cases that did not require a full financial assessment, for example, a specific question relating to a point of law (see 8.3). Non-financial assessment outcomes Advice recommendations made to the client following f inancial assessment and explanation of the available options (this may differ to the advice chosen by the client). 5 Informal arrangements can be managed interventions with a fairshare provider or a self managed programme via Money Advice Trust's Cashflow. Outcome map (per 100 cases in January 2017) Feb 16 Mar 16 Apr 16 May 16 Jun 16 Jul 16 Aug 16 Sep 16 Oct 16 Nov 16 Dec 16 Jan 17 22% 21% 1 22% 21% 1 21% 24% 7% 6% 12% 7% 7% 7% 6% 7% 7% 24% 23% 1 21% 22% 22% 23% 2 22% 3rd party call Bailiff assistance Benefits Council Tax Credit rating Current insolvency case Disputed liability Housing assistance Legal Mortgage 7% Other 5 10 Financial assessment outcomes (30) Non-financial assessment outcomes (70) 8.5 Advice take-up (January 2017) % Advice recommended by adviser 27% 47% 2% Advice chosen by client Budgeting advice Other Individual Voluntary Arrangement/Trust Deed Debt Relief Order Informal Arrangement Debt Arrangement Scheme Bankruptcy 6 Following a full financial assessment, each client is provided with a recommended course of action along with a comprehensive breakdown of each solution they legally have access to in order that they are able to make an informed choice. 8.6 Weekly call density map (January 2017) Saturday Friday Thursday Wednesday Tuesday Monday 7 The density map charts when calls to the charity's helpline were received during the month. The more calls the charity received on a given weekday and hour during the month, the higher the corresponding density value. Debt Advice Foundation 2017 Page 13
14 Appendix (data tables) T1.1 - overview Feb 16 Mar 16 Apr 16 May 16 Jun 16 Jul 16 Aug 16 Sep 16 Oct 16 Nov 16 Dec 16 Jan 17 Average unsecured debt 17,334 16,379 15,048 16,084 14,120 14,486 18,340 18,967 18,789 18,259 17,959 14,129 Average number of unsecured creditors T1.2 - profile (January 2017) Category weighting 30.6% % 16.6% 6.4% 3.2% % 1.3% 1.3% 1.3% T1.3 - by type (January 2017)* Jan month average Dec 16 Jan 17 Credit card 6,100 6,804 7,649 5,530 Unsecured loan 6,710 5,992 6,219 4,580 Other debts 1,005 1,616 2,077 1,545 Overdraft 908 1, Store card Short term loan Utility debt Benefit overpayment Council tax debt Crown tax debt Trade debt * Some listed debts may not be included in the final unsecured totals dues to the laws governing treatment of certain liabilaities in different debt solutions. T1.4 - Client financial profile (January 2017) Jan month average Dec 16 Jan 17 Net monthly household income 1,568 1,663 1,738 1,538 Monthly household expenditure 1,496 1,518 1,619 1,437 Impoverishment index T1.5 - Specified cause of financial impairment (January 2017) Jan month average Dec 16 Jan 17 Loss of job 21% 1 16% 21% Reduced working hours 6% 7% Pregnancy 1% 2% 2% Illness 16% 7% Divorce 1% 4% 2% 4% Separation 12% 7% Other 43% % T1.6 - Debt servicing (January 2017) Jan month average Dec 16 Jan 17 Average repayment term (months) to annual income ratio 86% 83% 86% 77% Debt Advice Foundation 2017 Page 14
15 Appendix (data tables) T2.1 - Average unsecured debt (age group) Average unsecured debt (January 2017) ,540 13,350 16,419 14,960 16,577 13,996 T2.2 - Case weighting (age group) Case weighting (January 2017) 10.2% 31.2% % Regional contact population weighting index % % 8.1% T2.3 - Average debt by type (age group)* Credit card 459 5,442 4,962 8,548 6,739 1,938 Unsecured loan 3,734 3,910 7,322 2,216 5,186 5,972 Other debts 1,221 1,105 1,593 1,275 3,051 3,667 Overdraft , ,167 Store card Short term loan Utility debt Benefit overpayment Council tax debt Crown tax debt Trade debt 64 * Some listed debts may not be included in the final unsecured totals dues to the laws governing treatment of certain liabilaities in different debt solutions. T2.4 - Client financial profile (age group) Net monthly household income 928 1,483 1,737 1,546 1,788 1,510 Monthly household expenditure 876 1,360 1,639 1,471 1,662 1,359 Impoverishment index % 15.4% 15.6% 5.6% 33.3% T2.5 - Cause of financial impairment (age group) Loss of job % % 0. Reduced working hours % 6.3% 9.1% 0. Pregnancy Illness % 0. Divorce % Impoverishment index % 15.4% 15.6% 5.6% 33.3% Impoverishment index % 15.4% 15.6% 5.6% 33.3% T2.6 - Debt servicing (age group) Average repayment term (months) to annual income ratio % 77% 77% Debt Advice Foundation 2017 Page 15
16 Appendix (data tables) T3.1 - Average unsecured debt (gender) Average unsecured debt (January 2017) Male Female 16,575 12,316 T3.2 - Case weighting (gender) Male Female Case weighting (January 2017) 41.3% 58.7% T3.3 - Average debt by type (gender)* Male Female Credit card 6,070 5,019 Unsecured loan 6,301 3,360 Other debts 1,869 1,310 Overdraft Store card Short term loan Utility debt Benefit overpayment Council tax debt Crown tax debt Trade debt 34 * Some listed debts may not be included in the final unsecured totals dues to the laws governing treatment of certain liabilaities in different debt solutions. T3.4 - Client financial profile (gender) Male Female Net monthly household income 1,333 1,671 Monthly household expenditure 1,215 1,579 Impoverishment index % T3.5 - Cause of financial impairment (gender) Male Female Loss of job Reduced working hours % Pregnancy Illness Divorce Impoverishment index % Impoverishment index % T3.6 - Debt servicing (gender) Male Female Average repayment term (months) to annual income ratio 104% 61% Debt Advice Foundation 2017 Page 16
17 Appendix (data tables) T4.1 - Average unsecured debt (region) Average unsecured debt (January 2017) East East of England London North East North West 21,282 12,062 16,021 9,434 Northern Ireland 8,850 14,983 Scotland South East South West Wales West Yorkshire and the Humber 35,803 14,419 9,782 11,432 16,397 13,521 T4.2 - Case weighting (region) East East of England London North East North West Case weighting (January 2017) 8.3% 12.7% 14.6% 3. Northern Ireland 13.4% 1.3% Scotland South East South West Wales West Yorkshire and the Humber 3.2% % % Regional contact population weighting index 115.3% % % 83.4% 113.7% 93.7% % T4.3 - Average debt by type (region)* East East of England London North East North West Northern Ireland Credit card 7,383 6,755 4,661 2,839 2,133 6,339 Scotland South East South West Wales West 10,749 9,240 4,949 4,876 5,112 Yorkshire and the Humber 4,615 Unsecured loan 9,334 2,475 6, ,120 2,672 16,926 2,552 2,824 1,724 6,047 4,379 Other debts ,902 1,233 1,125 4,029 6,205 1, ,339 2, Overdraft 2, , , Store card 1, , Short term loan , Utility debt Benefit overpayment Council tax debt Crown tax debt Trade debt 136 * Some listed debts may not be included in the final unsecured totals dues to the laws governing treatment of certain liabilaities in different debt solutions. T4.4 - Client financial profile (region) East East of England London North East North West Northern Ireland Net monthly household income 2,178 1,415 1,601 1,129 1,524 1,908 Scotland South East South West Wales West 1,553 1,460 1,244 1,453 1,497 Yorkshire and the Humber 1,768 Monthly household expenditure 1,931 1,345 1,568 1,067 1,434 1,654 1,293 1,369 1,104 1,367 1,440 1,664 Impoverishment index % 15.4% 15.6% 5.6% 33.3% T4.5 - Cause of financial impairment (region) East East of England London North East North West Northern Ireland Loss of job % Scotland South East South West Wales West % Yorkshire and the Humber 40. Reduced working hours 16.7% % Pregnancy Illness 16.7% Divorce Impoverishment index % 15.4% 15.6% 5.6% 33.3% Impoverishment index % 15.4% 15.6% 5.6% 33.3% T4.6 - Debt servicing (region) East East of England London North East North West Northern Ireland Average repayment term (months) Scotland South East South West Wales West Yorkshire and the Humber 130 to annual income ratio 81% 71% 83% % 82% 66% 66% 91% 64% Debt Advice Foundation 2017 Page 17
18 Appendix (data tables) T5.1 - Average unsecured debt (housing status) Average unsecured debt (January 2017) Homeowner 7,801 21,036 Unknown Tenant 11,292 12,839 T5.2 - Case weighting (housing status) Homeowner Unknown Tenant Case weighting (January 2017) 13.6% % T5.3 - Average debt by type (housing status)* Homeowner Unknown Tenant Credit card 2,421 10,338 2,607 4,451 Unsecured loan 2,323 6,253 8,082 4,148 Other debts 1,087 1,634 1,709 Overdraft 345 1, Store card Short term loan 1, Utility debt Benefit overpayment Council tax debt Crown tax debt Trade debt 34 * Some listed debts may not be included in the final unsecured totals dues to the laws governing treatment of certain liabilaities in different debt solutions. T5.4 - Client financial profile (housing status) Homeowner Unknown Tenant Net monthly household income 858 1,854 1,046 1,609 Monthly household expenditure 723 1, ,529 Impoverishment index % 15.4% 15.6% T5.5 - Cause of financial impairment (housing status) Homeowner Unknown Tenant Loss of job 28.6% 26.3% Reduced working hours 14.3% 5.3% Pregnancy Illness % Divorce Impoverishment index % 15.4% 15.6% Impoverishment index % 15.4% 15.6% T5.6 - Debt servicing (housing status) Homeowner Unknown Tenant Average repayment term (months) to annual income ratio % Debt Advice Foundation 2017 Page 18
19 Appendix (data tables) T6.1 - Average unsecured debt ( status) Average unsecured debt (January 2017) employmen t Selfemployed Selfemployed 13,075 14,513 33,933 d (Other) d (JSA) 7,294 9,372 T6.2 - Case weighting ( status) employmen t Selfemployed Case weighting (January 2017) 39.7% 18.6% 8.3% 0. d (Other) d (JSA) 19.2% 10.3% T6.3 - Average debt by type ( status)* employmen t Selfemployed Credit card 5,114 5,469 16,088 d (Other) d (JSA) 2,974 2,645 Unsecured loan 3,937 5,414 12,314 1,518 2,568 Other debts 1, ,514 1,390 1,401 Overdraft 984 1,067 1, Store card , Short term loan Utility debt Benefit overpayment Council tax debt Crown tax debt Trade debt 108 * Some listed debts may not be included in the final unsecured totals dues to the laws governing treatment of certain liabilaities in different debt solutions. T6.4 - Client financial profile ( status) employmen t Selfemployed Net monthly household income 1,699 1,761 2,043 d (Other) d (JSA) 1, Monthly household expenditure 1,512 1,687 1,962 1, Impoverishment index % 15.4% 15.6% 5.6% 33.3% T6.5 - Cause of financial impairment ( status) employmen t Selfemployed Loss of job 9.4% 18.2% d (Other) d (JSA) 28.6% 66.7% Reduced working hours % Pregnancy Illness % % 0. Divorce 6.3% Impoverishment index % 15.4% 15.6% 5.6% 33.3% Impoverishment index % 15.4% 15.6% 5.6% 33.3% T6.6 - Debt servicing ( status) employmen t Average repayment term (months) d (Other) 545 d (JSA) Neg DI, can't repay to annual income ratio % 77% 77% Debt Advice Foundation 2017 Page 19
20 Appendix (data tables) T7.1 - Average unsecured debt (household demographics) Average unsecured debt (January 2017) 1 adult & 0 1 adult & 1 1 adult & 2 1 adult & 3+ 10,705 9,719 9,452 13,270 2 adults & 0 2 adults & 1 19,357 9,690 2 adults & 2 2 adults & 3+ 26,345 41,270 T7.2 - Case weighting (household demographics) 1 adult & 0 1 adult & 1 1 adult & 2 1 adult & 3+ 2 adults & 0 2 adults & 1 2 adults & 2 2 adults & 3+ Case weighting (January 2017) 33.1% 19.7% % 15.3% 7.6% 5.1% 5.1% T7.3 - Average debt by type (household demographics)* 1 adult/0 1 adult/1 1 adult/2 1 adult/3+ 2 adults/0 2 adults/1 2 adults/2 2 adults/3+ Credit card 4,471 3,736 3,070 3,978 8,396 4,947 6,648 16,372 Unsecured loan 3,207 2,472 3,496 2,473 6, ,035 14,453 Other debts 945 1,338 1,033 2,490 2,616 1, ,741 Overdraft ,156 Store card , Short term loan Utility debt Benefit overpayment , Council tax debt , ,488 Crown tax debt ,438 Trade debt 101 * Some listed debts may not be included in the final unsecured totals dues to the laws governing treatment of certain liabilaities in different debt solutions. T7.4 - Client financial profile (household demographics) 1 adult/0 1 adult/1 1 adult/2 1 adult/3+ 2 adults/0 2 adults/1 2 adults/2 2 adults/3+ Net monthly household income 971 1,560 1,530 1,855 1,711 1,735 3,068 2,497 Monthly household expenditure 903 1,477 1,469 1,769 1,590 1,623 2,834 2,232 Impoverishment index % 15.4% 15.6% 5.6% 33.3% T7.5 - Cause of financial impairment (household demographics) 1 adult/0 1 adult/1 1 adult/2 1 adult/3+ 2 adults/0 2 adults/1 2 adults/2 2 adults/3+ Loss of job 35.3% % Reduced working hours Pregnancy Illness % Divorce % Impoverishment index % 15.4% 15.6% 5.6% 33.3% Impoverishment index % 15.4% 15.6% 5.6% 33.3% T7.6 - Debt servicing (household demographics) 1 adult/0 1 adult/1 1 adult/2 1 adult/3+ 2 adults/0 2 adults/1 2 adults/2 2 adults/3+ Average repayment term (months) to annual income ratio % 77% 77% Debt Advice Foundation 2017 Page 20
21 Appendix (data tables) T8.1 -Case outcome analysis Feb 16 Mar 16 Apr 16 May 16 Jun 16 Jul 16 Aug 16 Sep 16 Oct 16 Nov 16 Dec 16 Jan 17 Financial assessment outcomes 33% 32% 32% 32% 2 34% 26% 23% 2 33% Non-financial assessment outcomes 67% % 66% 7 74% 77% 72% 67% 7 T8.2 -Financial assessment outcomes Feb 16 Mar 16 Apr 16 May 16 Jun 16 Jul 16 Aug 16 Sep 16 Oct 16 Nov 16 Dec 16 Jan 17 Bankruptcy % 26% 21% 21% Debt Arrangement Scheme 1% 1% 3% 1% 1% 2% 1% Informal Arrangement 16% 12% 16% 16% Debt Relief Order 22% 27% 27% 22% 21% 21% 23% 32% 2 21% 31% Individual Voluntary Arrangement/Trust Deed 1 16% % 1 1 Other 7% 7% 12% 6% Budgeting advice % 7% T8.3 -Non-financial assessment outcomes Jan 17 Dec 16 Nov 16 Oct 16 Sep 16 Aug 16 Jul 16 Jun 16 May 16 Apr 16 Mar 16 Feb 16 3rd party call 24% 21% 1 21% 22% 1 21% 22% Bailiff assistance 6% 7% Benefits 7% 12% Council Tax 3% 4% 2% 3% 3% 3% 2% 1% 3% 1% 2% Credit rating 4% 4% 3% 7% 4% Current insolvency case 7% 7% 7% Disputed liability 6% 6% 6% Housing assistance 3% 3% 2% 2% 4% 4% 4% 4% 4% 4% Legal 7% 7% 6% Mortgage 3% 2% 4% 3% 4% 4% 4% 3% 4% 3% Other 22% 2 23% 22% 22% 21% 1 23% 24% T8.5 -Advice take-up (January 2017) Advice recommended by adviser Advice chosen by client Bankruptcy 2% Debt Arrangement Scheme Informal Arrangement 47% Debt Relief Order 31% 27% Individual Voluntary Arrangement/Trust Deed 1 Other 6% Budgeting advice Debt Advice Foundation 2017 Page 21
22 Appendix (data tables) T8.6 -Weekly call density map (January 2017) Monday Tuesday Wednesday Thursday Friday Saturday 08:00 0.7% 0.6% 1.3% 0.7% 0.7% 0. 09:00 2.4% 2.1% 1.3% 1.4% 1.6% 0.7% 10:00 1.4% 2.4% % 2.3% 1.4% 11:00 1.4% 3.1% % 2.1% 0. 12: % % 13:00 1.7% % % 14:00 1.7% 2.4% 1.4% 2.6% % 15:00 1.7% 1.3% 2.7% 2.3% 2.1% 0.2% 16:00 1.7% 1.7% 0.7% 1.2% 0.4% 0. 17:00 1.1% 1.3% 1.4% 1.6% 0.7% 0. 18: % 0.6% 1.1% :00 0.6% % Debt Advice Foundation 2017 Page 22

23 Debt Advice Foundation 1 Anchor Court Commercial Road Darwen BB3 0DB Telephone: press.office@debtadvicefoundation.org Website: Facebook: /DebtAdviceFoundation If you are experiencing financial difficulties, please call the charity's helpline on The helpline is open Monday to Friday 8am to 8pm and Saturday 9am to 3pm. Authorised and regulated by the Financial Conduct Authority No Charity registered in England and Wales No Debt Advice Foundation 2016
Debt Statistics. A consumer focus. November 2016
 Debt Statistics A consumer focus November 2016 Contents 3. Message from the Chair 4. About Debt Advice Foundation 5. At-a-glance 6. Overview 7. Age group 8. Gender 9. Region 10. Residential status 11.
Debt Statistics. A consumer focus. October 2016
 Debt Statistics A consumer focus October 2016 Contents 3. Message from the Chair 4. About Debt Advice Foundation 5. At-a-glance 6. Overview 7. Age group 8. Gender 9. Region 10. Residential status 11. Employment
Debt Statistics. A consumer focus. December 2016
 Debt Statistics A consumer focus December 2016 Contents 3. Message from the Chair 4. About Debt Advice Foundation 5. At-a-glance 6. Overview 7. Age group 8. Gender 9. Region 10. Residential status 11.
Debt Statistics. A consumer focus. June 2016
 Debt Statistics A consumer focus June 2016 Contents 3. Message from the Chair 4. About Debt Advice Foundation 5. At-a-glance 6. Overview 7. Age group 8. Gender 9. Region 10. Residential status 11. Employment
Debt Statistics. A consumer focus. May 2017
 Debt Statistics A consumer focus May 2017 Contents 3. Message from the Chair 4. About Debt Advice Foundation 5. At-a-glance 6. Overview 8. Age group 9. Gender 10. Region 11. Residential status 12. Employment
Debt Statistics. A consumer focus. April 2017
 Debt Statistics A consumer focus April 2017 Contents 3. Message from the Chair 4. About Debt Advice Foundation 5. At-a-glance 6. Overview 8. Age group 9. Gender 10. Region 11. Residential status 12. Employment
Personal debt in the UK Jan-Dec Statistics
 Personal debt in the UK Jan-Dec 2017 Statistics Demand for debt advice Between January and December 2017, 619,946 people contacted StepChange Debt Charity for help, or 1 in 100 adults in the UK. 1,698
Personal debt Jan-June Statistics. An in-depth look at over 300,000 people struggling with problem debt.
 Personal debt Jan-June 2017 Statistics An in-depth look at over 300,000 people struggling with problem debt. Demand for debt advice 326,639 people contacted StepChange Debt Charity for help and support
ESF Support for Families with Multiple Problems statistics to July 2014
 ESF Support for Families with Multiple Problems statistics to July 2014 September 2014 Contents Introduction... 2 Key Findings... 2 Background... 3 Data and Results... 4 Tables... 9 Contacts... 19 Introduction
The Money Statistics. December.
 The Money Statistics December 2018 Welcome to the December 2018 edition of The Money Statistics, The Money Charity s monthly roundup of statistics about how we use money in the UK. If you have any questions,
Personal Debt Statistics. A look at the lives of half a million people in debt in the UK
 Personal Debt Statistics Yearbook A look at the lives of half a million people in debt in the UK Main findings Demand for debt advice 549,053 people contacted StepChange Debt Charity for help in. London
BTP Stop and Search Data - August 2012
 BTP Search Data - August 2012 Guidance Notes This analysis covers the period 01 September 2011 to 31 August 2012. These are the latest stop and search figures, compiled from data recorded on 03 October
Measuring Unemployment Some Key Terms
 Measuring Unemployment Some Key Terms Claimant Count (JSA) Labour Force Survey (LFS) The number of people officially claiming unemployment- related benefits must be actively seeking work All those actively
Statistics 2009/10 STATISTICS 2009/10 1
 Statistics 2009/10 STATISTICS 2009/10 1 STATISTICS 2009/10 VISITS TO OUR WEBSITES... 3 Participation in online self-help support services...3 CALLS TO THE HELPLINE AND NETLINE... 4 Calls... 4 Volume of
Chartered Society of Physiotherapy. CSP Membership (as at 1 st March 2018) & NHS Data (2009 to 2017) UK/England /N Ireland/Scotland/Wales
 & NHS Data (2009 to 2017) UK/England /N Ireland/Scotland/Wales") Chartered Society of Physiotherapy CSP Membership (as at 1 st March 2018) & NHS Data (2009 to 2017) UK/England /N Ireland/Scotland/Wales Summary 1. CSP Members by Country 2. CSP Total Members from 2014
Chartered Society of Physiotherapy CSP Membership (as at 1 st March 2018) & NHS Data (2009 to 2017) UK/England /N Ireland/Scotland/Wales Summary 1. CSP Members by Country 2. CSP Total Members from 2014
PERSONAL DEBT FIRST HALF Statistics
 PERSONAL DEBT FIRST HALF 2016 Statistics Mid-Yearbook An in-depth look at 300,000 people with 2.4bn of debt in the first half of 2016 Main findings from the first half of 2016 Demand for debt advice More
Review of Registered Charites Compliance Rates with Annual Reporting Requirements 2016
 Review of Registered Charites Compliance Rates with Annual Reporting Requirements 2016 October 2017 The Charities Regulator, in accordance with the provisions of section 14 of the Charities Act 2009, carried
Leeds Building Society Covered Bonds - Investor Report
 Leeds Building Society Covered Bonds - Investor Report Investors (or other appropriate third parties) can register at www.bankofengland.co.uk/markets to download further disclosures in accordance with
Personal Debt A look at the lives of half a million people in debt in the UK
 Personal Debt A look at the lives of half a million people in debt in the UK Main findings 2016 There was record demand for advice from StepChange Debt Charity in 2016. 599,026 people contacted us for
Leeds Building Society Covered Bonds - Investor Report
 Leeds Building Society Covered Bonds - Investor Report Investors (or other appropriate third parties) can register at www.bankofengland.co.uk/markets to download further disclosures in accordance with
A GUIDE TO IVAS Everything you need to know about an IVA
 A GUIDE TO IVAS Everything you need to know about an IVA THE FACTS An IVA (Individual Voluntary Arrangement) is a Debt Solution for people who cannot afford to pay their debts. It is a legal Agreement
Leeds Building Society Covered Bonds - Investor Report
 Leeds Building Society Covered Bonds - Investor Report Investors (or other appropriate third parties) can register at www.bankofengland.co.uk/markets to download further disclosures in accordance with
ICE LIBOR Holiday Calendar 2019
 ICE LIBOR Holiday Calendar Date Day Holiday GBP CHF JPY 01-Jan- Tuesday New Year's Day O O O O O 21-Jan- Monday Martin Luther King's Birthday () P No O/N P P P 18-Feb- Monday President's Day () P No O/N
The Growth of In-Work Housing Benefit Claimants: Evidence and policy implications
 bshf The Growth of In-Work Housing Benefit Claimants: Evidence and policy implications The Growth of In-Work Housing Benefit Claimants: Evidence and policy implications Ben Pattison March 2012 Building
YouGov / PHA Media Results
 YouGov / PHA Media Results Sample size: 2102 UK Adults Fieldwork: 13th - 15th August 2013 Gender Age Social Grade Region Male Female 18-24 25-34 35-44 45-54 55+ ABC1 C2DE North Midlands London South Wales
JSA claimant count rates as at October Devon Somerset Plymouth UK Torbay
 Job Seekers Allowance Latest Analysis November Unemployment in Devon For the first time since July the number of people claiming Job Seekers Allowance in Devon has fallen from 9,556 in September to 9,516
Approval levels fall back in February
 Approval levels fall back in February - Mortgage approvals decline slightly between January and February - Growth in number of first-time buyers and small deposit mortgages - Northern Ireland has highest
Unemployment Briefing
 National Assembly for Wales Research paper Unemployment Briefing July 2014 Research Service The National Assembly for Wales is the democratically elected body that represents the interests of Wales and
Unemployment Briefing
 National Assembly for Wales Research paper Unemployment Briefing June 2014 Research Service The National Assembly for Wales is the democratically elected body that represents the interests of Wales and
LONG-TERM DMP? Could you be debt-free quicker? TACKLING DEBT MONEY ADVICE LIFESTYLE BUDGETING
 LONG-TERM DMP? Could you be debt-free quicker? TACKLING DEBT BUDGETING LIFESTYLE MONEY ADVICE STUCK IN A LONG-TERM DMP? Could you be debt-free quicker? Like most of our clients, you probably felt a great
Introduction to the UK Economy
 Introduction to the UK Economy What are the key objectives of macroeconomic policy? Price Stability (CPI Inflation of 2%) Growth of Real GDP (National Output) Falling Unemployment / Raising Employment
YourPension. INSIDE Pensions Increase. Local Pensions Board. Fraud Prevention. Annual Forum. Pay Dates 2017/18. Pensioner Spring Newsletter 2017
 YourPension Pensioner Spring Newsletter 2017 INSIDE Pensions Increase Local Pensions Board Fraud Prevention Annual Forum Pay Dates 2017/18 YourPension 2017 Welcome......to the 2017 Spring Newsletter. As
Mortgage Trends Update
 Mortgage Trends Update UK Finance: Mortgage Trends Update December 218 of first-time reaches 12-year high in 218 Key data highlights: There were 37, new first-time buyer mortgages completed in 218, some
The Money Statistics. April
 The Money Statistics April 2018 Welcome to the April 2018 edition of The Money Statistics The Money Charity s monthly round-up of statistics about how we use money in the UK. These were previously published
Money Advice Performance Management Summary. East Renfrewshire Council
 Money Advice Performance Management Summary The Money Advice Performance Management Framework (MAPMF) has been developed in consultation with local authorities and other key stakeholders and it aims to
A guide to your new Prudential Annuity
 A guide to your new Prudential Annuity > Thank you for choosing Prudential to provide your pension annuity. You might be receiving your pension directly from us or we are paying it on behalf of your pension
about this mortgage 1. About this illustration
 about this mortgage Personalised illustration for: James Sample & Vicky Sample Date produced: Any Date Valid until: This illustration is valid only on the date produced. This is not a legally binding mortgage
Labour Market Trends
 STUC SG Biannual June 2013 Employment in is increasing and unemployment is decreasing. is outperforming the on all headline labour market measures, employment, unemployment and inactivity. Recent increases
Spheria Australian Smaller Companies Fund
 29-Jun-18 $ 2.7686 $ 2.7603 $ 2.7520 28-Jun-18 $ 2.7764 $ 2.7681 $ 2.7598 27-Jun-18 $ 2.7804 $ 2.7721 $ 2.7638 26-Jun-18 $ 2.7857 $ 2.7774 $ 2.7690 25-Jun-18 $ 2.7931 $ 2.7848 $ 2.7764 22-Jun-18 $ 2.7771
GCE AS/A Level 2520U20-1 NEW AS. ECONOMICS Unit 2 Economics in Action. A.M. MONDAY, 23 May hours PMT
 GCE AS/A Level 2520U20-1 NEW AS S16-2520U20-1 ECONOMICS Unit 2 Economics in Action A.M. MONDAY, 23 May 2016 2 hours 2520U201 01 ADDITIONAL MATERIALS In addition to this examination paper, you will need:
Money Advice Performance Management Summary. North Lanarkshire Council
 Money Advice Performance Management Summary North Lanarkshire Council The Money Advice Performance Management Framework (MAPMF) has been developed in consultation with local authorities and other key stakeholders
Regional overview Gisborne
 Regional overview Purchasing intentions - additional income-related rent subsidy (IRRS) places Area District 1 2 3 4+ TOTAL 3 35 5 7 total 3 35 5 7 7 8 9 1 11 Purchasing intentions - change within the
York, North Yorkshire And East Riding (Numbers)
") Labour Market Profile - The profile brings together data from several sources. Details about these and related terminology are given in the definitions section. Resident Population Total population (2017)
Labour Market Profile - The profile brings together data from several sources. Details about these and related terminology are given in the definitions section. Resident Population Total population (2017)
Household Debt Explained?
 Household Debt Explained? Personal Consumer Debt and its Relationship with Arrears Max Griffiths, Alliance & Leicester Agenda Macro-economic trends Key changes Household balance sheet Household balance
FOR RELEASE: MONDAY, MARCH 21 AT 4 PM
 Interviews with 1,012 adult Americans conducted by telephone by Opinion Research Corporation on March 18-20, 2011. The margin of sampling error for results based on the total sample is plus or minus 3
Insolvency Statistics and Debtor Profile Report 1 JULY 2015 TO 30 JUNE 2016
 Insolvency Statistics and Debtor Profile Report 1 JULY 2015 TO 30 JUNE 2016 MB12830 Contents Introduction 2 Annual Statistics 3 Key Characteristics of Debtors 11 Summary Instalment Orders 12 No Asset Procedures
Insolvency Statistics and Debtor Profile Report 1 JULY 2016 TO 30 JUNE 2017
 Insolvency Statistics and Debtor Profile Report 1 JULY 2016 TO 30 JUNE 2017 MB14340 Contents Introduction 2 Annual Statistics 3 Key Characteristics of Debtors 11 Summary Instalment Orders 12 No Asset Procedures
A Creditfix info pack
 A Creditfix info pack In this guide How we can help Our process What is an IVA? Aimee Mann case study About Creditfix With over 70 years experience between our insolvency practitioners in the financial
Release date: 16 May 2018
 Release date: 16 May 218 UK Finance: Mortgage Trends Update March 218 Remortgaging market softens in March after busy start to year Key data highlights: There was 51bn of new lending to first-time in the
Our fees and charges explained
 Our fees and charges explained and other important information about how your mortgage works - December 2016 What s in this booklet Keeping you informed 3 Application and valuation fees 3 Application fees
The Money Statistics. August
 The Money Statistics August 2018 Welcome to the August 2018 edition of The Money Statistics The Money Charity s monthly round-up of statistics about how we use money in the UK. These were previously published
Money Advice Performance Management Summary. Angus Council
 Money Advice Performance Management Summary The Money Advice Performance Management Framework (MAPMF) has been developed in consultation with local authorities and other key stakeholders and it aims to
Performance Report October 2018
 Structured Investments Indicative Report October 2018 This report illustrates the indicative performance of all Structured Investment Strategies from inception to 31 October 2018 Matured Investment Strategies
Regional overview Hawke's Bay
 Regional overview Purchasing intentions - additional income-related rent subsidy (IRRS) places Area Hastings Central 1 2 3 4+ TOTAL 5 5 25 125 3 3 1 7 total 8 8 35 195 7 8 9 1 11 Purchasing intentions
Release date: 12 July 2018
 Release date: 12 July 218 UK Finance: Mortgage Trends Update May 218 Mortgage market sees pre-summer boost as remortgaging continues strong upward trend Key data highlights: There were 32,2 new first-time
Regional overview Auckland
 Regional overview Purchasing intentions - additional income-related rent subsidy (IRRS) places Area North West Central South 1 2 3 4+ TOTAL 8 4 5 125 16 2 9 7 52 25 185 8 3 545 2 28 13 1 71 total 69 75
Money Advice Performance Management Summary. West Lothian Council
 Money Advice Performance Management Summary The Money Advice Performance Management Framework (MAPMF) has been developed in consultation with local authorities and other key stakeholders and it aims to
Market Monitor Q UK EQUITY RELEASE
 UK EQUITY RELEASE Market Monitor Q3 2014 EMBARGOED UNTIL 00:01 WEDNESDAY 12TH NOVEMBER 2014 Key Retirement, Baines House, 4 Midgery Court, Fulwood, Preston PR2 9ZH 02 03 04 05 06 08 Contents INTRODUCTION
Power Accountants Association Annual Meeting Potential Impacts from Oct 2015 Rate Change
 Power Accountants Association Annual Meeting Potential Impacts from Oct 2015 Rate Change Material Provided by: Chris Mitchell Chris Mitchell Management Consultants (CMMC) mail@chrismitchellmc.com 5/14/2015
Great Britain (Numbers) All People 836,300 8,947,900 63,258,400 Males 405,700 4,404,400 31,165,300 Females 430,500 4,543,500 32,093,100
 All People 836,300 8,947,900 63,258,400 Males 405,700 4,404,400 31,165,300 Females 430,500 4,543,500 32,093,100") Labour Market Profile - The profile brings together data from several sources. Details about these and related terminology are given in the definitions section. Resident Population Total population (2015)
Labour Market Profile - The profile brings together data from several sources. Details about these and related terminology are given in the definitions section. Resident Population Total population (2015)
XML Publisher Balance Sheet Vision Operations (USA) Feb-02
 Feb-02") Page:1 Apr-01 May-01 Jun-01 Jul-01 ASSETS Current Assets Cash and Short Term Investments 15,862,304 51,998,607 9,198,226 Accounts Receivable - Net of Allowance 2,560,786
Page:1 Apr-01 May-01 Jun-01 Jul-01 ASSETS Current Assets Cash and Short Term Investments 15,862,304 51,998,607 9,198,226 Accounts Receivable - Net of Allowance 2,560,786
Important information to help people in mortgage arrears
 Important information to help people in mortgage arrears September 2015 Contents Talk to your Lender 3 Explore your Options 4 Contact a Trusted Third Party for Advice - MABS (Money Advice & Budgeting Service)
Money Advice Performance Management Summary. West Dunbartonshire Council
 Money Advice Performance Management Summary The Money Advice Performance Management Framework (MAPMF) has been developed in consultation with local authorities and other key stakeholders and it aims to
ENSTAR Natural Gas Company 8/15/2014 Alaska Pipeline Company Gas Cost Adjustment Calculation 2014 Q4
 ENSTAR Natural Gas Company 8/15/2014 Alaska Pipeline Company Gas Cost Adjustment Calculation 2014 Q4 Contract Current Base Index Current Reimbursed Price Base Price Index Index Ratio Calculated Price Net
Protected Advantage Bond
 Protected Advantage Bond Protected Advantage Bond Aim Access to the performance of the Advantage Fund, with capital protection at the end of six years and six months. Risk Capital protected Funds available
Money Advice Performance Management Summary. Dumfries & Galloway Council
 Money Advice Performance Management Summary Dumfries & Galloway Council The Money Advice Performance Management Framework (MAPMF) has been developed in consultation with local authorities and other key
Insolvency Statistics and Debtor Profile Report 1 JULY 2013 TO 30 JUNE 2014
 Insolvency Statistics and Debtor Profile Report 1 JULY 2013 TO 30 JUNE 2014 Contents Introduction 2 Annual Statistics 3 Key Characteristics of Debtors 11 Summary Instalment Orders 12 No Asset Procedures
R3 Personal Debt Snapshot Wave 11 - June
 R Personal Debt Snapshot Wave June METHODOLOGY NOTE ComRes interviewed,00 GB adults online between st May and nd June 0. Data were weighted to be demographically representative of all British adults aged
Isle Of Wight half year business confidence report
 half year business confidence report half year report contents new company registrations closed companies (dissolved) net company growth uk company share director age director gender naming trends sic
Newark Income Tax Office Payroll Withholding
 Newark Income Tax Office Payroll Withholding Filed Period not later than Pay Period Jan 02-15-17 January 1 - January 31 Feb 03-15-17 February 1 - February 28 Mar 04-18-17 March 1 - March 31 Apr 05-15-17
Linstock Budget 2014 UK Sample : 24th - 25th March 2014
 Total Gender within Gender Male Female Base Male Female 18-24 25-34 35-44 45-54 55+ 18-24 25-34 35-44 45-54 55+ 18-24 25-34 35-44 45-54 55+ OLB_q1. Thinking about managing your finances in, which ONE of
Capturing equity gains whilst protecting portfolios
 Capturing equity gains whilst protecting portfolios Edward Park Q2 2018 MSCI North America Total Return in USD (2017 Discrete Calendar Months) 4.00% 3.50% 3.00% 2.50% 2.00% 1.50% 1.00% 0% 0.00% Jan-17
SCOTTISH WIDOWS BANK MORTGAGE CONDITIONS 2017
 SCOTTISH WIDOWS BANK MORTGAGE CONDITIONS 2017 PLEASE READ WE KNOW THAT HAVING TO READ A LEGAL CONTRACT CAN BE OFF PUTTING, SO WE HAVE DECIDED TO DO THINGS DIFFERENTLY. THIS BOOKLET CONTAINS: A brief explanation
Insolvency Statistics and Debtor Profile Report 1 JULY 2014 TO 30 JUNE 2015
 Insolvency Statistics and Debtor Profile Report 1 JULY 2014 TO 30 JUNE 2015 Contents Introduction 2 Annual Statistics 3 Key Characteristics of Debtors 11 Summary Instalment Orders 12 No Asset Procedures
Money Advice Performance Management Summary. Stirling Council
 Money Advice Performance Management Summary The Money Advice Performance Management Framework (MAPMF) has been developed in consultation with local authorities and other key stakeholders and it aims to
M&S INVESTMENT FUNDS Supplementary Information Document for investment in the M&S Unit Trust Funds
 M&S INVESTMENT FUNDS Supplementary Information Document for investment in the M&S Unit Trust Funds To be read in conjunction with the Key Investor Information Document for each of the M&S Unit Trust Funds.
Great Britain (Numbers) All People 138,500 6,168,400 64,169,400 Males 69,400 3,040,300 31,661,600 Females 69,000 3,128,100 32,507,800
 All People 138,500 6,168,400 64,169,400 Males 69,400 3,040,300 31,661,600 Females 69,000 3,128,100 32,507,800") Labour Market Profile - The profile brings together data from several sources. Details about these and related terminology are given in the definitions section. Resident Population Total population (2017)
Labour Market Profile - The profile brings together data from several sources. Details about these and related terminology are given in the definitions section. Resident Population Total population (2017)
Debt Dashboard Q2 2010
 Introduction Debt Dashboard Q2 Following the Government s announcement that it will review the debt solutions currently available in England and Wales 1, the focus of this quarter s Debt Dashboard is on
APPLiCAtion for financial ASSiStAnCE
 charity number 1106218 APPLiCAtion for financial ASSiStAnCE alternatively apply online via the trust s website www.britishgasenergytrust.org.uk Before completing the application form, please carefully
PRESS RELEASE. Securities issued by Hungarian residents and breakdown by holding sectors. October 2017
 11 December 2017 PRESS RELEASE Securities issued by Hungarian residents and breakdown by holding sectors October 2017 According to securities statistics, the amount outstanding of equity securities and
Great Britain (Numbers) All People 564,600 5,860,700 64,169,400 Males 279,200 2,904,300 31,661,600 Females 285,400 2,956,400 32,507,800
 All People 564,600 5,860,700 64,169,400 Males 279,200 2,904,300 31,661,600 Females 285,400 2,956,400 32,507,800") Labour Market Profile - The profile brings together data from several sources. Details about these and related terminology are given in the definitions section. Resident Population Total population (2017)
Labour Market Profile - The profile brings together data from several sources. Details about these and related terminology are given in the definitions section. Resident Population Total population (2017)
West Midlands (Met County) (Numbers)
 (Numbers)") Labour Market Profile - The profile brings together data from several sources. Details about these and related terminology are given in the definitions section. Resident Population Total population (2017)
Labour Market Profile - The profile brings together data from several sources. Details about these and related terminology are given in the definitions section. Resident Population Total population (2017)
Guidance on consumer credit debt counselling
 Guidance on consumer credit debt counselling The following guidance explains when firms providing advice to a client will be performing the consumer credit regulated activity of debt counselling. The guidance
R3 Personal Debt Snapshot Wave 10 - February
 R Personal Debt Snapshot Wave 0 February METHODOLOGY NOTE ComRes interviewed,00 adults online between st and rd February 0. Data were weighted to be demographically representative of all British adults
2018 Financial Management Classes
 2018 Financial Management Classes MONEY MANAGEMENT CLASS/BANKING OPERATONS (1ST & 3RD FRIDAY) INVESTING BASICS (2ND FRIDAY) CREDIT MANAGEMENT BLENDED RETIREMENT SYSTEM/THRIFT SAVINGS PLAN (4TH FRIDAY)
Cost Estimation of a Manufacturing Company
 Cost Estimation of a Manufacturing Company Name: Business: Date: Economics of One Unit: Manufacturing Company (Only complete if you are making a product, such as a bracelet or beauty product) Economics
First time buyer numbers rise by almost a quarter in 2015 as costs fall
 Under embargo until: 00:01 Tuesday 5 th January 2015 November 2015 First time buyer numbers rise by almost a quarter in 2015 as costs fall November sees 31,300 first-time buyer completions up 23.7% annually
Your account will be transferred to our Collections department if you fail to make the repayments due under this agreement.
 Your Loan Account Number XXXXXXXXXXX FIXED SUM LOAN AGREEMENT REGULATED BY THE CONSUMER CREDIT ACT 1974 These are the terms of an agreement between Us, Bank of Scotland plc trading as Halifax of Personal
Individual Voluntary Arrangements (IVAs)
") BRIEFING PAPER Number CPB5165, 6 April 2016 Individual Voluntary Arrangements (IVAs) By Lorraine Conway Inside: 1. Introduction 2. Alternatives to bankruptcy 3. Characteristics of an IVA 4. Who is eligible
BRIEFING PAPER Number CPB5165, 6 April 2016 Individual Voluntary Arrangements (IVAs) By Lorraine Conway Inside: 1. Introduction 2. Alternatives to bankruptcy 3. Characteristics of an IVA 4. Who is eligible
Release date: 14 August 2018
 Release date: 14 August 218 UK Finance: Mortgage Trends Update June 218 House purchase activity slows in June but remortgaging activity remains high Key data highlights: There were 34,9 new first-time
Unweighted Bases Effective Weighted Sample
 Table 24 In your opinion, which party is best able to negotiate Brexit? BMG UK Poll - OCTOBER 2016 Page 223 Gender Age Total Male Female 18 to 24 25 to 34 35 to 44 45 to 54 55 to 64 65+ Unweighted Bases
MARCH M T W T F S S
 0 0 JANUARY 0 0 0 FEBRUARY 0 0 MARCH 0 0 0 JANUARY 0 0 0 FEBRUARY 0 0 MARCH 0 0 0 APRIL 0 0 0 JULY 0 0 0 MAY 0 0 0 AUGUST 0 0 0 JUNE 0 0 0 SEPTEMBER 0 0 0 APRIL 0 0 0 JULY 0 0 0 MAY 0 0 0 AUGUST 0 0 0
YouGov / CCH Survey Results
 YouGov / CCH Survey Results Sample Size: 210 Fieldwork: 19th - 22nd October 2009 TOTAL Gender Age Social Grade Base Male Female 18-24 25-34 35-44 45-54 55+ ABC1 C2DE ALL Accountants 210 97 113 15 73 58
Constructing a Cash Flow Forecast
 Constructing a Cash Flow Forecast Method and Worked Example A cash flow forecast shows the estimates of the timing and amounts of cash inflows and outflows over a period of time. The sections of a cash
PRESS RELEASE. Securities issued by Hungarian residents and breakdown by holding sectors. January 2019
 7 March 2019 PRESS RELEASE Securities issued by Hungarian residents and breakdown by holding sectors January 2019 According to securities statistics, the amount outstanding of equity securities and debt
Contents. Contents. Introduction. Background. Commentary. Graphs and statistics. Annex A: Data sources. Annex B: Explanatory notes.
 Registry Trust Limited Public Statistics September 2017 Contents Contents Introduction Background Commentary Graphs and statistics Annex A: Data sources Annex B: Explanatory notes Annex C: Contacts 2 3
Albion No2 plc - Investor Report
 Albion No2 plc - Investor Report Investors (or other appropriate third parties) can register at www.bankofengland.co.uk/markets to download further disclosures in accordance with the Bank of England Market
Chapter 17 Accounting for Accruals and Deferrals
 Chapter 17 Accounting for Accruals and Deferrals o Understand Accrual and Deferrals o Accrued Expense o Accrued Revenue o Deferred Expense o Deferred Revenue 1 Accruals and Deferrals Accruals Expenses
Great Britain (Numbers) All People 186,600 6,130,500 63,785,900 Males 92,600 3,021,700 31,462,500 Females 94,000 3,108,900 32,323,500
 All People 186,600 6,130,500 63,785,900 Males 92,600 3,021,700 31,462,500 Females 94,000 3,108,900 32,323,500") Labour Market Profile - The profile brings together data from several sources. Details about these and related terminology are given in the definitions section. Resident Population Total population (2016)
Labour Market Profile - The profile brings together data from several sources. Details about these and related terminology are given in the definitions section. Resident Population Total population (2016)
Great Britain (Numbers) All People 267,500 9,080,800 64,169,400 Males 132,500 4,474,400 31,661,600 Females 135,000 4,606,400 32,507,800
 All People 267,500 9,080,800 64,169,400 Males 132,500 4,474,400 31,661,600 Females 135,000 4,606,400 32,507,800") Labour Market Profile - The profile brings together data from several sources. Details about these and related terminology are given in the definitions section. Resident Population Total population (2017)
Labour Market Profile - The profile brings together data from several sources. Details about these and related terminology are given in the definitions section. Resident Population Total population (2017)