CONTENTS INDEPENDENT AUDITOR S REPORT. 3 CONSOLIDATED ANNUAL REPORT. 5 SEPARATE AND CONSOLIDATED STATEMENTS OF FINANCIAL POSITION (BALANCE SHEET).
|
|
|
- Trevor Gibson
- 5 years ago
- Views:
Transcription
1 CITADELE BANKAS AB SEPARATE AND CONSOLIDATED FINANCIAL STATEMENTS FOR THE YEAR ENDED 31 DECEMBER 2015 PREPARED ACCORDING TO INTERNATIONAL FINANCIAL REPORTING STANDARDS AS ADOPTED BY THE EUROPEAN UNION PRESENTED TOGETHER WITH THE INDEPENDENT AUDITOR S REPORT
2 CONTENTS INDEPENDENT AUDITOR S REPORT... 3 CONSOLIDATED ANNUAL REPORT... 5 SEPARATE AND CONSOLIDATED STATEMENTS OF FINANCIAL POSITION (BALANCE SHEET). 17 SEPARATE AND CONSOLIDATED STATEMENTS OF PROFIT OR LOSS AND OTHER COMPREHENSIVE INCOME SEPARATE AND CONSOLIDATED STATEMENTS OF CHANGES IN EQUITY SEPARATE AND CONSOLIDATED STATEMENTS OF CASH FLOWS NOTE 1. GENERAL INFORMATION NOTE 2. SIGNIFICANT ACCOUNTING POLICIES NOTE 3. BALANCES WITH THE CENTRAL BANK NOTE 4. BALANCES WITH BANKS AND CREDIT INSTITUTIONS NOTE 5. DERIVATIVE FINANCIAL INSTRUMENTS NOTE 6. AVAILABLE-FOR-SALE FINANCIAL ASSETS NOTE 7. FINANCE LEASE RECEIVABLES NOTE 8. LOANS AND RECEIVABLES NOTE 9. PROPERTY, PLANT AND EQUIPMENT NOTE 10. INVESTMENT PROPERTY NOTE 11. INTANGIBLE ASSETS NOTE 12. INCOME TAX NOTE 13. OTHER ASSETS NOTE 14. DUE TO BANKS AND OTHER CREDIT INSTITUTIONS NOTE 15. DUE TO CUSTOMERS NOTE 16. OTHER LOANS NOTE 17. OTHER LIABILITIES NOTE 18. CAPITAL AND RESERVES NOTE 19. COMMITMENTS AND GUARANTEES NOTE 20. INTEREST INCOME AND INTEREST EXPENSE NOTE 21. SERVICE FEE AND COMMISSION INCOME AND EXPENSE NOTE 22. NET GAIN ON OPERATIONS WITH SECURITIES NOTE 23. NET GAIN ON OTHER OPERATIONS NOTE 24. OTHER INCOME NOTE 25. IMPAIRMENT (EXPENSE)/REVERSAL NOTE 26. OPERATING EXPENSES NOTE 27. INVESTMENT IN SUBSIDIARY NOTE 28. COMPLIANCE WITH PRUDENTIAL REQUIREMENTS TO MANAGE OPERATIONAL RISKS NOTE 29. CAPITAL ADEQUACY NOTE 30. RELATED-PARTY TRANSACTIONS NOTE 31. OPERATING LEASE COMMITMENTS AND CONTINGENCIES NOTE 32. CASH AND CASH EQUIVALENTS NOTE 33. RISK MANAGEMENT NOTE 34. FAIR VALUES OF FINANCIAL INSTRUMENTS NOTE 35. SUBSEQUENT EVENTS


3
4
5 CONSOLIDATED ANNUAL REPORT 1. Reporting period covered by the consolidated annual report The annual report has been prepared for the financial year The financial year coincides with the calendar year. 2. Contact details Company name Legal form public limited liability company Date of registration 16 July 1998 Company code Address of registered office K. Kalinausko g. 13, LT Vilnius Licence No. No. 17 Phone No. (8 5) Fax No. (8 5) Website address In this annual report, the bank is referred to as or the. 3. Information on branches and customer service units of the The has its branches established in the cities of Vilnius, Kaunas, Klaipėda, Panevėžys, Šiauliai, Alytus. The s customer service units of Vilnius branch: Gedimino, Vingio. 4. Group companies Company name Citadele Faktoringas ir Lizingas UAB Legal form private limited liability company Date of registration 3 June 2003 Company code Address of registered office K. Kalinausko g. 13, LT Vilnius Phone No. (8 5) Fax No. (8 5) lizingas@citadele.lt Website address 5. Type of activities and its subsidiary Citadele Faktoringas ir Lizingas UAB provide the following licensed financial services and non-licensed financial services established in the Law on s and the Law on Financial Institutions of the Republic of Lithuania: accept deposits and other refundable means from non-professional market participants, lend funds, perform cash transfers, provide finance and operating lease, issue payment cards and conduct transactions with them, issue warranties and financial guarantees, conclude transactions on their account or clients account in respect of money market instruments, perform currency purchase and sale and currency exchange transactions, rent safe-deposit boxes, offer consulting services on credit granting and repayment issues and perform other services. 6. Overview of the s and the Group s financial position, performance results and business development activities in the context of the Lithuanian market In 2015, and the Group generated audited net profit of EUR 3.4m and EUR 3.4m respectively. The result was calculated following the International Financial Reporting Standards, as adopted by the EU, legislative requirements of the of Lithuania and of the Republic of Lithuania. In 2015, the and the Group operated successfully and increased their corporate loan portfolio, deposit portfolio and interest income. If compared to 2014, the s assets increased by 1.7% or EUR 7.0m and amounted to EUR 405,9m as at As a result of temporary increased balances with banks and due to banks and other credit institutions at the end of 2014, the Group s assets decreased by 5.3% or EUR 22.7m and amounted to EUR 404.6m as at The s loan portfolio increased by 31.5% or EUR 56.7m if compared to 2014 and amounted to EUR 236.8m as at 31 December 2015; corporate loan portfolio increased by 64.4% or EUR 51.0m and amounted to EUR 130.1m as at 31 December
6 The net value of the leasing portfolio of the s subsidiary Citadele Faktoringas ir Lizingas UAB increased by EUR 8.6m in 2015 and amounted to EUR 37.8m at the end of the year. In 2015, the offered its clients favourable consumer credit conditions and in 2015 it granted 2.6 times more consumer credits if compared to 2014, i.e. EUR 4.7m. Aiming to increase the return on capital by earning higher interest income with an acceptable risk level, in 2015 the granted new corporate loans totalling EUR 97.5m, including a loan of EUR 39.3m granted to the s subsidiary Citadele Faktoringas ir Lizingas UAB. Based on the volumes of credits granted which were secured with guarantees issued by INVEGA guarantee fund (106 guarantees), for the third consecutive year the was rated the 1 st among all commercial banks operating in Lithuania. Significant crediting volumes secured by state guarantee funds mean a higher security level of the repayment of borrowings and lower capital requirement to grant such loans. In September 2015, the signed an amendment to the open credit line contract with INVEGA, which acts as the manager of INVEGA fund. The amendment extended the term of credit agreements with small and medium-sized entities until 30 June Based on the contract, the is entitled to grant publicly supported loans from the Open Credit Fund (OCF) with maturities of six years or less under a predefined repayment schedule, and credit line type loans with maturities of three years or less. The is the leader in granting preferential credits from OCF having granted over 50% of all preferential credits from OCF and has already granted preferential credits worth of more than EUR 36m from OCF and the 's own funds. During 2015, deposits held by the increased by 10.9% or EUR 32.1m and amounted to EUR 325.7m as at The s current deposits increased by 3.4% or EUR 6.2m if compared to the beginning of the year and amounted to EUR 185.0m at the end of the year. In 2015, the s term deposits increased by 22.6% or EUR 25.9m and amounted to EUR 140.7m at the end of the year. The deposit portfolio of clients-residents increased by 13.7% or EUR 26.0m during 2015 and amounted to EUR 216.3m as at In 2015, the further conducted active American Express cards development activities: increased sales of cards, expanded card servicing coverage to 75%, continued the development of its loyalty programme Membership Rewards. Aiming at the optimization of the consumer loans issuance process, the automated client assessment and request processing system was implemented, which allowed shortening the time needed to issue a consumer credit to ~30 minutes. In 2015, e-requests system was implemented, which allowed private individuals to become the s clients and order any services from home. The only thing required is electronic signature. In addition, the joined the SEPA payment system, which allows the clients to make payment transfers within the entire SEPA area as local transfers. At the end of the year, the implementation of electronic invoices system was being finalized. The system not only changes direct debit payments, but also significantly broadens the possibilities to receive invoices and make payments via e-banking. During 2015, the s net interest income increased by 18.9% and amounted to EUR 7.2m at the year-end. Interest received on loans increased by 11.1% or EUR 0.8m as compared to 2014 and amounted to EUR 7.8m. Interest income from securities increased by 14.9% or EUR 0.3m and amounted to EUR 2.2m. Interest income makes up 60.2 per cent of the s total income. In 2015, interest expenses for deposit holders increased by 3.1% or EUR 86t and amounted to EUR 2.9m at the end of the year. Net service fee and commission income decreased by 27.2% or EUR 0.7m as compared to 2014 and amounted to EUR 2.0m at the year-end. This decrease was mainly caused by the euro adoption resulting in the loss of net service fee and commission income of EUR 0.3m from income of base currency exchange services. Also, commissions from money transfers decreased by EUR 0.3m or 18.6%. Commission income accounts for 20.6% of the s total income. In 2015, the 's other income, which mainly comprises net profit from transactions with securities and net profit from foreign currency transactions, amounted to EUR 3.2m and was 5.2% or EUR 0.2m higher than in the previous year. Such income increased as a result of an increase of income from transactions with securities by EUR 0.1m and of an increase of other income by EUR 0.1m. The 's other income accounts for 19.2% of the s total income. During 2015, the 's operating expenses decreased by 9.1% or EUR 0.9m and amounted to EUR 9.0m at the year-end. The largest decrease was in personnel expenses (EUR 0.3m), provisions (EUR 0.3m), and amortisation and depreciation (EUR 0.2m). In 2015, reversal of impairment of the investment into subsidiary by EUR 355t counterbalanced the impairment charges of non-current intangible assets and property, plant and equipment (EUR 202 thousand) and costs for loan impairment (EUR 55t). Therefore, under its result, the recognised value reversal income of EUR 100t. During 2015, the generated net profit of EUR 3.4m, i.e. EUR 3.2m more if compared to the same period in As at 2015, the s return on equity (ROE) was 7.24%, and return on assets (ROA) 0.92%. 6
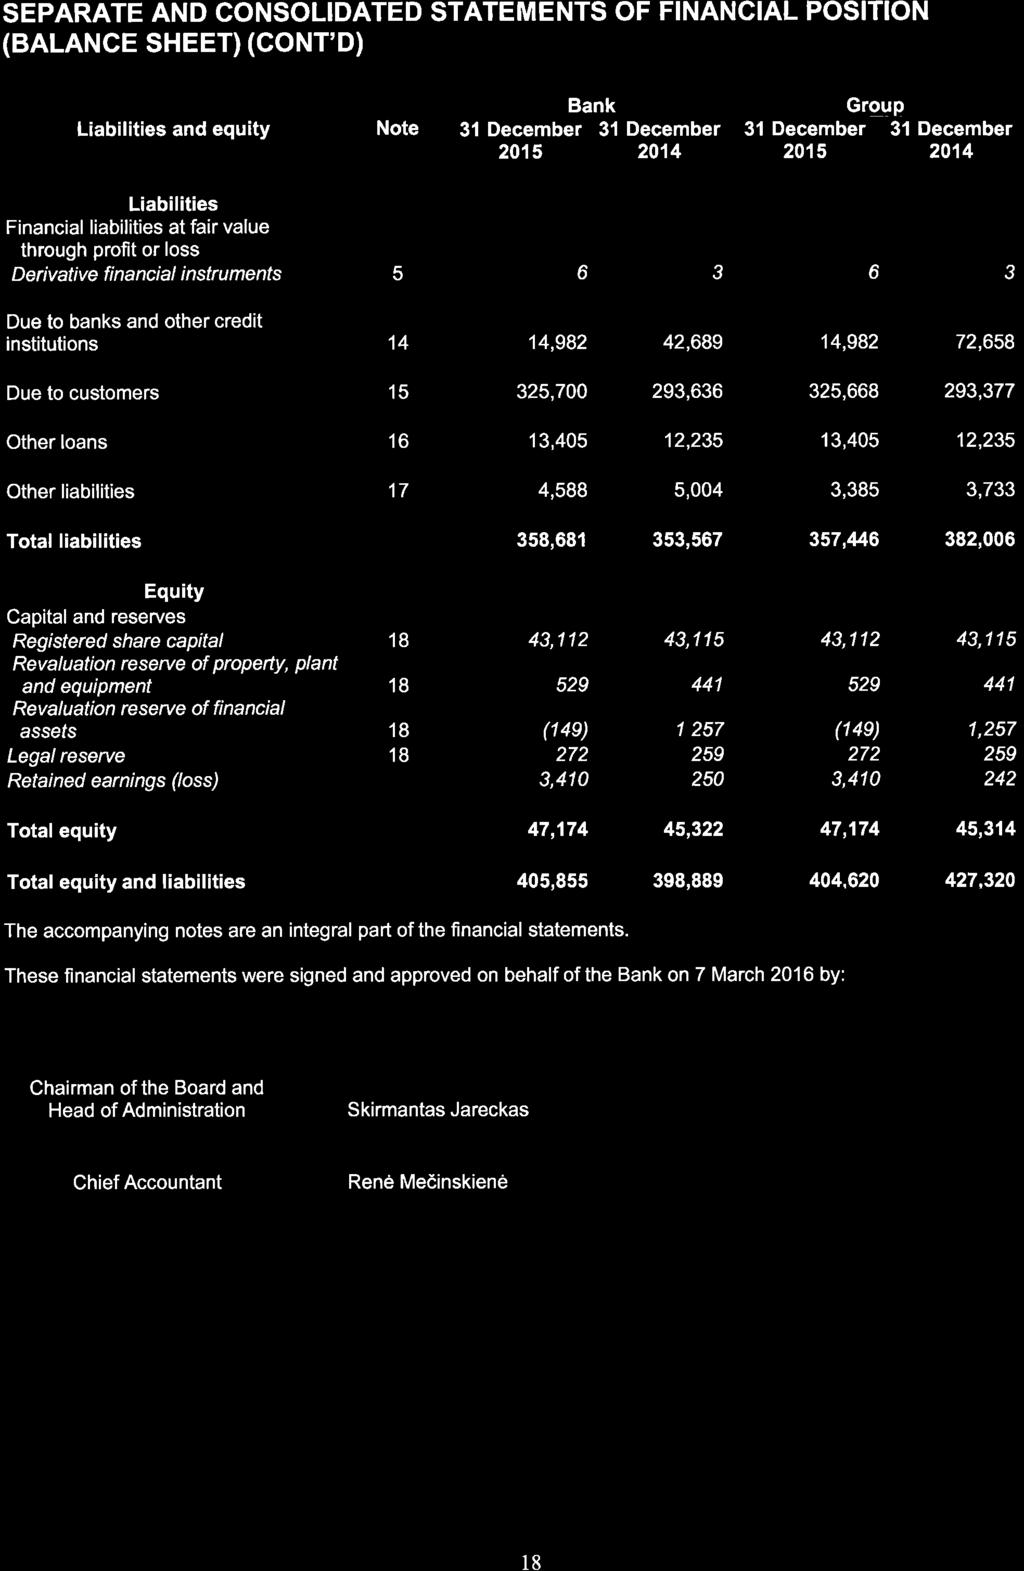
7 The tables below present the s and the Group s main items of the audited statements of financial position and profit or loss and other comprehensive income. Separate and consolidated statements of financial position (summarised), EUR thousand: Items from the statement of financial position Group Cash and balances with banks 33,157 88,327 33,157 88,327 Loans and receivables, including finance lease 236, , , ,300 Investments in securities 128, , , ,028 Property, plant, and equipment, intangible assets and investment property 2,928 2,965 3,124 3,377 Other assets 4,664 4,428 3,411 3,288 Total assets 405, , , ,319 Due to banks and other credit institutions 14,982 42,689 14,982 72,658 Due to customers 325, , , ,377 Other loans 13,405 12,235 13,405 12,235 Other liabilities 4,594 5,007 3,391 3,735 Total liabilities 358, , , ,005 Equity 47,174 45,322 47,174 45,314 Separate and consolidated statements of profit or loss and other comprehensive income (summarised), EUR thousand: Items from the statement of profit or loss and other Group comprehensive income Net interest income 7,173 6,032 8,091 6,826 Net service fee and commission income 2,006 2,754 1,962 2,700 Other income 3,204 3,046 3,425 3,155 Operating expenses (8,994) (9,892) (9,536) (10,444) Impairment (charges)/reversal 100 (2,165) (438) (2,471) Income tax benefit/(expense) (79) 474 (85) 474 Net profit 3, , The is a member of the following organisations: SWIFT, Association of Lithuanian s, the Lithuanian Business Employers Confederation, Vilnius Chamber of Commerce, Industry and Crafts, Kaunas Chamber of Commerce, Industry and Crafts, Klaipėda Chamber of Commerce, Industry and Crafts, Šiauliai Chamber of Commerce, Industry and Crafts, Panevėžys Chamber of Commerce, Industry and Crafts, the Latvian Chamber of Corporate Entities and association Investors Forum. 7. Risk management. Description of the main risk types Management of risk is an essential element of the Group s day-to-day operation and strategic management process. All staff members of the and its Subsidiary are directly involved in general risk management system of the. Risk management process involves risk assessment, ongoing monitoring of risks factors and implementation of preventive measures for risk mitigation. The s and the Subsidiary s management have established an objective to achieve a balance between an effective risk management and successful business development. The s business development activities are carried out with not higher than the average exposure to risk and only in respect to those fields of activities which are well known to the and in which the has positive historical experience. The s Board is responsible for the development of risk management system within the and the Subsidiary. At least once per year, the effectiveness of risk management system is reviewed by assessing the operation experience based on the best practice and analysing a potential impact of market changes on performance. Exposure to risk is limited by applying the internal limits system, and risk management is based on the principle of independence within the Group s structural units where there is a clear segregation of functions and definition of responsibilities for each employee. The Group treats credit, liquidity, operational and market risks as the most significant exposures. Credit risk Credit risk is the risk that the and the Group will incur loss because its customers or counterparties failed to discharge their contractual obligations. The assessment of credit risk of the counterparty is based on the Group s consideration of a customer s capability to fulfil his obligations, primarily whether the customer s cash flows are sufficient to cover his credit liabilities to the. 7
8 Collateral and other credit enhancement measures are deemed measures designated to reduce the Group s losses in case of default of its customers. The amount and type of collateral required depend on an assessment of the credit risk of the counterparty. When managing exposure to credit risk arising in relation to private individuals, the follows the Responsible Lending Regulations as approved by the of Lithuania. The carries out regular credit risk management procedures and for that purpose uses an internal customer assessment system, based on which the assigns ratings to its customers. The rating is established in order to set limits on crediting of customers with low rating value and to assign the customers with low rating value to higher risk group. The credits are assessed individually and collectively, based on the similarity of portfolio risk criteria. In view of management of relationship with the Group s and the s customers, the principal objective is to ensure a continuous monitoring of the customer s performance and financial position in order to determine customer needs and ensure a long-term cooperation based on credibility between the and a customer. The and the Group have established a credit quality review process to provide early identification of possible changes in the creditworthiness of counterparties, including the fair value of collateral and other credit enhancement measures. Risk concentration is managed by way of establishing acceptable risk management limits by type of customer, maximum exposure amount to a single borrower and industry sectors. Liquidity risk Liquidity risk is the risk that the or the Group will be unable to meet all current financial liabilities in time due to lack of availability of current financial resources. The level of liquidity risk may increase during periods of economic crisis. For the purpose of liquidity risk management it is important to establish possible risk management scenarios, define aforethought preventive measures for an adverse period, correctly assess the risk level of the counterparty, ensure availability of reliable short-term financial resources for the and the Group. Liquidity risk management is treated as a field of great importance by the 's management. Day-to-day liquidity is ensured by monitoring changes in financial flows and making immediate decisions on balancing cash flows. Actual liquidity ratios are determined on each working day. Dynamics of liquidity ratios, long-term liquidity ratio forecasts based on probable scenarios are regularly presented to management and considered at sittings of the 's Board at established time intervals. The and the Group comply with the required liquidity coverage ratio, maintain compulsory reserves with the of Lithuania. Operational risk Operational risk is the risk to incur direct and indirect losses due to inappropriate or unimplemented internal processes, technologies, employees actions or external factors and fraudulent actions of individuals. The objective of operational risk is to achieve that operations of the and its Subsidiary are organised in a way that is secure and able to guarantee a sustained process of services to the customers, effectively minimise possible future operational losses using appropriate means, and focus on operational risk prevention. The has developed the database of operational risk events registration, which accumulates historical data and allows forecasting sources of operational risk and preventing potential losses on a timely basis. Operational risk reports are submitted quarterly to the Board of the. The reports include an overview of the operational risk cases identified during the quarter, efficiency of operational risk management measures. At least once per year, the and the Subsidiary perform an internal self-assessment relating to operational risk, which involves identification of risks inherent to operations of the and the Subsidiary, definition of risk management measures and assessment of effectiveness of the measures implemented. Market risk Market risk is the risk that the or the Group will incur significant losses or loose net income of future periods due to changes in interest rates, currency exchange rates and market prices of securities. Exposure to potential threats arising from market risk is managed by entering into respective corrective contracts such as interbank deposit contracts, currency swaps, debt securities contracts, interest rate swaps. Market risk is minimised by applying limits approved by the s management. These limits are set with respect to gap, investments in securities, financial counterparties. Investments are diversified. Limits, scope and directions of investments are regularly reviewed and updated in consideration of global and local tendencies. The 's management is provided with reports on market risk management at regular intervals. 8
9 Capital adequacy The banks incorporated in Lithuania are required to comply with the following requirements for own funds: - a Common Equity Tier 1 capital ratio of 4.5%; - a Tier 1 capital ratio of 6%; - a total capital ratio of 8%. On 28 December 2015, the Supervision Service of the of Lithuania and the Commission of Finance and Capital Markets of Latvia signed a General Decision and set additional capital requirements for. Until the new General Decision is adopted, must comply with the following minimum own funds requirements: 11.0% Common Equity Tier 1 capital ratio and 14.5% total capital ratio. The requirements include the requirement for 2.5% capital conservation buffer. As at 2015, the s capital adequacy ratio was 16.32% and it exceeded the minimum required capital adequacy ratio by 1.82 percentage points. The s objective is to maintain such level of internal capital reserves, which, in case of unfavourable events, could ensure compliance with the minimum required capital adequacy ratio of the. In addition to the minimum capital adequacy ratio set by the of Lithuania, the calculates the additional internal capital requirement. The 's capital reserves ensure that the 's capital resources will be sufficient to ensure a stable business continuity if the outcome of scenario of stress testing relating to a significant deterioration of the Lithuanian economy comes true. 8. Prudential ratios of the Established by the of Compliance No. Ratio Lithuania At 2015 At Capital adequacy ratio 14.5% 16.32% 16.14% 2. Liquidity coverage ratio Not lower than 100% % % 3. Maximum exposure to a single borrower Loans to a single borrower may not exceed 25% of the s capital % 22.03% During the reporting period, the and the Group complied with all prudential ratios set by the of Lithuania. 9. Share capital The s authorised share capital registered with the Register of Legal Entities: Authorised share capital Type of shares Number of shares, Nominal value per share Total nominal Ownership ISIN code items (EUR) value (EUR) interest (%) Ordinary registered shares LT ,488, ,112, Total 1,488,681 43,112, The shareholders equity of the consists of the authorised share capital, legal reserve, revaluation reserve of property, plant and equipment, revaluation reserve of financial assets, retained profit for current year. 10. Shareholders Shareholders Shareholder Number of shares, items Ownership interest (%) Citadele a AS Company code ,488, Information about acquisition of own shares neither held nor acquired any own shares during No shares of the were acquired by its subsidiary Citadele Faktoringas ir Lizingas UAB. 12. Management of the The bodies of the are the s General Shareholders Meeting, the s Supervisory Council, the Board of the and the Head of the s Administration. The managing bodies of the are the Board of the and the Head of the s Administration. The s managing bodies must act solely for the benefit of the and its shareholders, to follow the laws and other legislation and the s Articles of Association.
10 The s Supervisory Council members ( 2015): Juris Jakobsons,, Chairman of the Supervisory Council since 8 May 2012 Valters Abele,, Member of the Supervisory Council since 28 March 2012 Santa Purgaile,, Member of the Supervisory Council since 29 July 2014 The s Board members ( 2015): Skirmantas Jareckas,, Chairman of the Board and Head of Administration since 15 December Chairman of the Board and Deputy Head of Administration in since 29 November 2014 until 14 December With no capital participation in the. Jonas Grincius,, Member of the Board since 14 April 2010, Director of Finance Service since 28 November With no capital participation in the. Dalia Udrienė,, Member of the Board since 25 July 2013, Director of Risk Management Service since 20 November With no capital participation in the. Chief Accountant: Renė Mečinskienė, Director of the Accounting and Reporting Department of, Chief Accountant since 7 May The has 8 committees ( 2015): Risk Management Committee, Activity Compliance and Reputation Risk Management Committee, Assessment Committee of Management, Loan Committee, Product Development Committee, Remuneration Committee, Internal Audit Committee, Ethics and Discipline Committee. On 2 July 2015, based on the decision of the Board of the, the Ethics and Discipline Committee was established. The Risk Management, Activity Compliance and Reputation Risk Management, Assessment of Management, Loan, Product Development, and Ethics and Discipline Committees are accountable to the Board of the. The Remuneration (as described in more detail in Chapter 16 of this Annual Report) and Internal Audit Committees are accountable to the Supervisory Council of the. The purpose of the Internal Audit Committee is to assist the s Supervisory Council to: - Assess the state and efficiency of the s internal control processes and system, risk management and to propose measures of improvement; - Coordinate and Assess the work of the s Internal Audit Department; - Discuss the work performed by external auditors, to plan the need for and recommend external auditors; - Ensure the compliance of the s activities with the laws and other legislation of the Republic of Lithuania, the s Articles of Association, the s strategy and activity policy prescribed by the s Council. The composition of the Internal Audit Committee approved on 4 November 2015 by the Resolution of the s Supervisory Council ( 2015): - The Chairman of the Committee Head of Internal Audit Department of Citadele a AS (Maksims Leščinskis); - Member of the Committee member of the Supervisory Council of Citadele a AS (Valters Abele); - Member of the Committee Head of Internal Audit Service of DK PZU Lietuva UAB / PZU Lietuva Gyvybės Draudimas UAB (Milda Paliulienė). 13. Accounting, financial reporting and audit The and the Group keep their accounting records in accordance with the Lithuanian regulatory legislation, the Policy of Accounting and Preparation of Financial Statements and International Financial Reporting Standards. The s and the Group s accounting records are kept and the financial statements are prepared in conformity with the following main principles: prudence; substance over form; materiality; going concern; consistency; accrual-based accounting; understandability; relevance; reliability; matching. The opening balances of the current reporting financial year of items reported in the financial statements agree with the closing balances of the previous financial year of the corresponding items reported in the financial statements. 10
11 The annual financial statements consist of: the statement of financial position; the statement of profit or loss and other comprehensive income; the statement of cash flows; the statement of changes in equity; the notes to the financial statements. The s separate and consolidated annual financial statements are subject to audit by an audit company, which issues an independent auditor s report based on the audit. The audit company KPMG Baltics, UAB performed the audit of the financial statements of the and the Group for the financial year 2015 and 2014 and issued the independent auditor s report thereon. 14. Supervisory institution The supervisory institution of the is the of Lithuania. 15. Analysis of non-financial performance results of the and the Group, information on environment- and personnel-related issues The and the Group seek to encourage individuals, large, small and medium-sized business entities to choose the financial solutions that are mostly suitable to ensure their sustainable financial position. The s and the Group s relationships with customers are based on long-term trustworthiness, service quality, responsibility and professional approach, as well as based on one of the most important principles of transparent banking know your customer. The and the Group take care about the environment in which they operate, support the athletics, as it is an important sport raising the global awareness of the name Lithuania, Čepkausko Autosportas VšĮ, and support education and teaching institutions. The and the Group focus significantly on the events encouraging the employees team spirit. In summer 2015, the Group s employees took part in the sports festival organized in Latvia for the employees of Citadele a AS group. The also encourages the sense of democracy. In January 2016, Christmas event was organized for the employees of the for the recognition of the best employees of the year. The nominees were elected by the s employees in democratic elections. The takes care of the health and well-being of its employees, they are encourage to take a healthy and active lifestyle; since the beginning of 2014, the, in cooperation with the insurance company Gjensidige Baltic AAS Lithuania Branch, partly covers the expenses of employees related to illness prevention, maintaining and improving health. During 2015, the gave EUR 32,550 for the programme of health improvement of employees. The and the Group focus significantly on training of employees. During the year 2015, 236 employees had the opportunity to upgrade their qualification in different internal and external training courses, which helped improve their professional knowledge and skills. Annual performance and competence appraisals are carried out for the s employees, the also has a qualification system in place. At the end of the year, the had 267 employees ( 2014: 284), of which 32 were on leave due to pregnancy, giving birth and childcare. The average number of employees at the in 2015 was 265 ( 2014: 293). The breakdown of the s employees by category is as follows: Number of employees Change Category At At Units % Management (7) (9.2) Specialists (8) (3.9) Support staff 2 4 (2) (50.0) Total (17) (6.0) The breakdown of the s employees by education is as follows: Number of employees Change Education At At Units % Higher university (13) (5.7) Higher non-university (2) (7.1) Advanced vocational education Secondary (and unfinished higher education) 4 10 (6) (60.0) Total (17) (6.0) 11
12 16. The Group s remuneration policy and its implementation This information has been prepared implementing the Description of the Minimum Remuneration Policy Requirements for Employees of Credit Institutions and Financial Brokerage Firms approved by Resolution No of 8 May 2015 of the Board of the of Lithuania, the provisions of Regulation (EU) No. 575/2013 of the European Parliament and of the Council, Article 450, and Remuneration Policy of Citadele a AS. The Remuneration Policy of Group is coordinated with the respective policy of Citadele a AS and approved by Resolution of the s Supervisory Council. The Group s Remuneration Policy is aimed at effectively motivating professional and bright employees to keep them focused on the achievement of the s and the Group s long-term and short-term goals. The aim of the policy is to define the Group s remuneration setting principles. With the help of this policy, the Group seeks to become an attractive employer and to properly organize the recruitment, maintaining and motivation of qualified specialists. The Remuneration Policy is aimed at encouraging efficient risk management and at taking measures that prevent assuming too large risks. The policy must be followed by all the employees of the and its Subsidiary. Information related to the decision making process applicable in establishing the remuneration policy, the number of meetings organised by the main body supervising remuneration in the financial year, information about the structure and authorizations of the remuneration committee, external advisor, which services were used in the development of the remuneration policy The Group follows the Remuneration Policy; the latest edition was approved on 22 April 2015 by the Resolution of the s Supervisory Council. The policy includes the list of jobs affecting the risks assumed by the. In the preparation of this Remuneration Policy, the services of external advisors were not used. The s Supervisory Council is responsible for the establishment of the key principles of Remuneration Policy, its approval and the control of implementation. The s Board is responsible for the improvement of the Remuneration Policy and approval of respective internal procedures. The s Remuneration Committee together with the Personnel Department of Citadele a AS coordinate the implementation of the Remuneration Policy within the Group. The Remuneration Committee was established in The Resolution (28 November 2014) of the s Supervisory Council approved the updated composition of the Remuneration Committee and the Committee Regulations. The decision on the establishment, composition, reorganisation or liquidation of the Committee is made by the s Supervisory Council. The Committee is managed by the member of the Supervisory Council, who, based on the allocation of duties of the Supervisory Council members, is responsible for the activities of the Remuneration Committee. The decisions taken by the Committee are submitted for approval to the s Supervisory Council. The period of the Committee s activity is not limited. The Committee comprises at least three members. From its members, the s Supervisory Council elects Committee members, Committee Chairman and Committee Deputy Chairman and appoints one independent manager as a member. The competence and working procedures of the Remuneration Committee are established by the Committee Regulations. Committee meetings are convened when necessary but not less than twice a year. The goal of the Remuneration Committee is to assist the Supervisory Council in the supervision of the Board s activities, i.e. to work on issues related to the implementation of the Remuneration Policy within the Group. The Committee is responsible for the review of the Group s Remuneration Policy. The tasks of the Remuneration Committee: - To discuss issues related to remuneration of the s Board and submit the recommendations to the Supervisory Council; - To discuss issues related to the establishment of salaries to top management, the salaries of which are equal to or exceed the minimum salary of the Board of the, or to the employees responsible for the s internal audit function, and to directly monitor the salaries of employees in the list of jobs impacting the risks; - To submit recommendations at the meetings of Supervisory Council and/or shareholders on the remuneration of the members of the s Supervisory Council; - According to the instructions of the Supervisory Council, to review the issues related to the Group s/the s Remuneration Policy, and submit the recommendations to the Supervisory Council; - To monitor the amendments of the laws and other regulations of the Republic of Lithuania and European Union related to the tasks of the Committee; - If necessary, to submit to the s Supervisory Council the recommendations regarding amendments to the s policies in the Committee s competence areas; - If necessary, in the Committee s competence areas, to discuss issues included Supervisory Council s meeting agenda before such meeting, and to provide recommendations to the Supervisory Council on decision making; - To submit suggestions to the Supervisory Council on decision making in order to improve the supervision of the Board in the Committee s competence areas. 12
13 Composition of the Remuneration Committee ( 2015): - The Chairman of the Committee the Chairman of the s Supervisory Council (Juris Jākobsons); - The Deputy Chairman of the Committee member of the s Supervisory Council (Santa Purgaile); - Committee member Head of the Personnel Department of Citadele a AS (Dace Gaigala). Information on the link between remuneration and performance results Remuneration setting principles are linked to the assessment of performance results of the Group s employees, i.e. when establishing the remuneration, the employee s performance assessment is taken into account. The Group s remuneration system comprises: - Fixed remuneration or monthly salary, which mostly reflects the level of the employee s professional experience and responsibilities set by the job description and in the employment contract; - Variable remuneration, if applicable, comprises sales bonuses, bonuses for the goal achievement in terms of quantity/quality, reflects the employee s performance results, exceeding the requirements prescribed by his/her job description, the continuity of such results and the assessment of current and potential risks. Information about the criteria used for assessment of performance results, about the assessment according to risk, remuneration assignment criteria and the principles of provisioning Fixed remuneration for employees is established as remuneration for working time. Fixed remuneration is established individually for each employee by the members of the Board of the based on his/her competencies and qualifications. In order to provide an objective assessment of the level of an employee s fixed remuneration in the labour market, the Group regularly orders the analyses of the remuneration in the respective sector(s). Variable remuneration is dependent on performance results. Within the Group, this remuneration may be paid out in cash or in non-monetary instruments. The employees performance is assessed on the basis of goals set for an employee/the /Subsidiary (for one year or longer period), comprising the following criteria, with regard to the responsibilities and functions performed by the employee: - Achievement of financial goals criteria are applied to the employee s control object (objects, if several); i.e. achievement of the budget, financial performance, liquidity; - The level of customer satisfaction with the s services internal, external, long-term, etc.; - Operating efficiency (speed of client service, document preparation, etc.); - Growth in the professional field (managing a project/field seeking to obtain a specific competency, diplomas acquired in the specific field); - Criteria for compliance with regulations, including compliance with the laws and internal as well as external regulations that have an impact on the Group s/the s or the Subsidiary s risks and financial performance. The criteria for goals are established for each employee and documented at least once a year. Variable remuneration for the employees who have an impact on the risks can be paid once a year based on the achievement of goals, after the shareholders have approved the s (the Group s) audited annual results. Part of variable remuneration (including the provisioned portion) shall be assigned and/or paid only when the group s financial position is sustainable and is linked to the performance results of the business unit and the respective person. If the financial performance of the s group is negative or does not meet the planned performance, the, without violation of the legislative requirements of the Republic of Lithuania, shall reduce the pay-out of the variable portion of remuneration, including the provisioned portion, for a certain period of time. When annual portion of the variable remuneration exceeds 100% of the fixed remuneration received during the year, 50% of the variable remuneration is paid out in cash, and the other 50% portion is paid out in the following forms: shares or other equivalent equity instruments of the and/or Subsidiary if the (Subsidiary) is listed in a stock exchange, or equivalent non-monetary instruments linked to shares, when the s (the Subsidiary s) shares are not listed in a stock exchange, and/or non-equity securities, which are annually selected and established, and coordinated with the Supervisory Council, by the members of the managing body of the and/or subsidiary, according to their field of competence. In case when the variable remuneration for the employees having an impact on the risks comprises: - Up to 35% of the employee s fixed remuneration in the reporting year, then at least 40% of the variable remuneration is deferred for a one-year period; - From 35% (inclusive) to 100% (exclusive) of the fixed remuneration of the respective employee in the reporting year, then at least 40% of the variable remuneration is deferred for a three-year period; - Over 100% of or exceeding the fixed remuneration of the respective employee in the reporting year, then at least 60% of the variable remuneration is deferred for a three-year period. 13
14 The terms and conditions for the pay-out of variable remuneration and the rights obtained by the employees having an impact on the risks are the following: - Actual pay-outs of the variable remuneration and the employee s entitlement to this pay-out depend on the following factors: o o Control object (objects) as indicated in the list of goals, business cycle and business risks; Individual results of an employee specified in the list of goals, which have an impact on the performance of the control object. - If the financial goals of the control object specified in the list of goals have not been achieved or are negative, the total amount of variable remuneration (including the deferred portion) shall be reduced. - In case when the portion of variable remuneration is assigned for performance results based on the erroneous information wilfully submitted by the employee, the or Subsidiary requires the employee to repay the paid out portion of the variable remuneration and fully eliminates or partly reduces the deferred portion of the variable remuneration. - The or Subsidiary reduces the deferred portion of the variable remuneration with regard to the rights which were not obtained based on the actual performance of the control object. - The deferred portion of variable remuneration may actually be paid out only after the employee has acquired the above-mentioned rights; in addition, no dividends and interest may be set, calculated and paid for the deferred portion of variable remuneration, to which these rights have not been obtained. General quantitative information about remuneration The tables below provide information of the remuneration amounts before tax (gross) in General quantitative information about remuneration based on the field of business: Group companies Fixed portion of remuneration, teur Variable portion of remuneration, teur Other payments*, teur Number of recipients** 3, Citadele Faktoringas ir Lizingas UAB Total 3, * Other payments comprise one-off payments, one-off allowances, allowances in the case of death, compensations for unused vacation, compensations for the employees made redundant and redundancy payments. ** Excluding employees on maternity and childcare leave. General quantitative information about remuneration, by employees in management positions: Remuneration amounts of the financial year, divided into fixed and variable portions of remuneration and other payments, and the number of recipients: Fixed portion of remuneration, teur Variable portion of remuneration, teur Other payments, teur Number of recipients The Board Employees assuming the Group risks, excluding Board members* 1, Employees 2, Total 3, Group Fixed portion of remuneration, teur Variable portion of remuneration, teur Other payments, teur Number of recipients The Board Employees assuming the Group risks, excluding Board members* 1, Employees 2, Total 3, *information on the remuneration of the employees assuming the Group risks is published according to the actual list approved by the s Supervisory Council on 22 April 2015 as an annex to the Group s Remuneration Policy; based on the list, the tables do not include the employees of Citadele a AS and the s lawyer, as their remuneration is not included in the s accounting. In addition, this list was expanded with regard to the fact that in 2015, one additional list of employees assuming the Group risks was effective (approved on 28 November 2014). 14
15 Variable remuneration divided into cash, bank shares, instruments linked to shares and other types: Cash payments of variable remuneration, teur shares, teur Financial instruments linked to shares, teur The Board Employees assuming the Group risks, excluding Board members Employees Total Group Cash payments of variable remuneration, teur shares, teur Financial instruments linked to shares, teur The Board Employees assuming the Group risks, excluding Board members Employees Total Amounts of the outstanding deferred variable remuneration for the year 2014, divided into assigned and not assigned portions: Deferred variable remuneration, teur 15 Assigned deferred variable remuneration, teur Not assigned deferred variable remuneration, teur The Board Employees assuming the Group risks, excluding Board members Employees Total The amounts of deferred variable remuneration assigned in the financial year, paid out and reduced on the basis of performance results: In 2015, the paid out the part of variable remuneration deferred in 2014 and Deferred variable remuneration in 2014 for the results of 2014, paid in 2015, teur Deferred variable remuneration in 2014 for the results of 2013, paid in 2015, teur Deferred variable remuneration in 2012 for the results of 2012, paid in 2015, teur The Board Employees assuming the Group risks, excluding Board members Employees Total The Subsidiary did not pay the deferred variable remuneration assigned in the financial year, paid and reduced on the basis of performance results. The amount of guaranteed variable remuneration under new contracts and the number of recipients: In 2015, no guaranteed variable remuneration was paid in the or in the Group. Redundancy payment amounts in the financial year, the number of recipients of such payments, and the maximum amount paid out per person: Number of redundancy payment recipients Total redundancy payments paid*, teur Maximum amount paid per person, teur * * Redundancy payment excluding compensation for unused vacation (gross).


16
17 SEPARATE AND CONSOLIDATED STATEMENTS OF FINANCIAL POSITION (BALANCE SHEET) Assets Note Group 2014 Cash 32 4,533 2,567 4,533 2,567 Balances with the central bank 3 24,357 9,092 24,357 9,092 Balances with banks and other credit institutions 4 4,267 76,668 4,267 76,668 Financial assets at fair value through profit or loss Available-for-sale financial assets 6 128, , , ,028 Finance lease receivables ,798 29,159 Loans and receivables 8 236, , , ,141 Investments in subsidiary 27 1,566 1, Property, plant, and equipment 9 2,928 2,965 2,929 2,967 Investment property Intangible assets Deferred income tax asset 12 1,467 1,179 1,467 1,179 Other assets 13 1,623 1,988 1,936 2,059 Total assets 405, , , ,320 (cont d on the next page) 17
18


19
20 SEPARATE AND CONSOLIDATED STATEMENTS OF CHANGES IN EQUITY Note Authorised share capital Revaluation reserve of property, plant and equipment Revaluation reserve of financial assets Other reserves Retained earnings (loss) Balance at , ,779 46,286 Transfers with owners Transfer to other reserves (89) - Dividends paid (1,690) (1,690) Comprehensive income Net profit Other comprehensive income Revaluation of property, plant and equipment Net gain (loss) on available-for-sale financial assets Income tax relating to components of other comprehensive income - - (84) - - (84) Other comprehensive income (expenses) Total comprehensive income (expenses) Balance at , , ,322 Total Transfer to other reserves (13) - Dividends paid (237) (237) Adjustment in relation to euro adoption under the Lithuanian legislation (3) (3) Comprehensive income Net profit ,410 3,410 Other comprehensive income Revaluation of property, plant and equipment Net gain (loss) on available-for-sale financial assets - - (1,654) - - (1,654) Income tax relating to components of other comprehensive income Other comprehensive income (expenses) - 88 (1,406) - - (1,318) Total comprehensive income (expenses) - 88 (1,406) - 3,410 2,092 Balance at , (149) 272 3,410 47,174 (cont d on the next page) 20

21

22
23 Note 1. General information (hereinafter the ) was established on 24 October 1996 under the name Industrijos as UAB. By the resolution of the of Lithuania No. 127 of 5 October 2000, the 's official name was changed from Industrijos as UAB to PAREX BANKAS AB. During the restructuring process of the Latvian Parex a AS in 2010, a new bank was established in Latvia entitled Citadele. Upon the approval of the shareholders of Parex a AS and Citadele a AS, it was resolved that Lithuania-based Parex as AB will become a part of the group of a new Latvian Citadele bank. On 19 August 2010, the Board of the of Lithuania gave its consent to the acquisition of shares of Parex as AB by the Latvian bank Citadele a AS, and to the registration of amendments to the Articles of Association of Parex as AB concerning the change of the bank s name, as well as amendment to the licence issued to the bank by specifying a new name. The address of the s registered office is as follows: K. Kalinausko g. 13 LT Vilnius Lithuania The has six branches established in the cities of Vilnius, Kaunas, Klaipėda, Šiauliai, Panevėžys and Alytus. By Resolution No. 134 of the of Lithuania of 16 July 1998, the was issued a licence No. 17 that entitled the to perform all operations of a commercial bank. The accepts deposits, grants loans, performs monetary and documentary settlements, exchanges currencies and grants monetary and other guarantees to its clients. The also trades in securities, provides consulting and safe-deposit services. The provides services to both corporate and private customers. The Group consists of the and Citadele Faktoringas ir Lizingas UAB, which is the s wholly owned subsidiary operating in Lithuania. The principal activity of the subsidiary is finance lease. As at 2015, the had 267 ( 2014: 284) employees. As at 2015, the Group had 270 ( 2014: 287) employees. As at 2015 and 2014, Citadele a AS (Latvia) was the sole shareholder of. As at 31 December 2014, shareholders of Citadele a AS were the Republic of Latvia with ownership interest of 75% minus 1 share and the European for Reconstruction and Development with ownership interest of 25% plus 1 share. As at 31 December 2015, 75% plus 1 share of Citadele a AS were held by an international investors group represented by Ripplewood Advisors LLC, and the remaining 25% minus 1 share were held by the European for Reconstruction and Development. The s authorised share capital is divided into 1,488,681 ordinary registered shares with a par value of EUR each. As at 2015 and 2014 all shares were fully paid. These financial statements were authorised for issue on behalf of the and the Group on 7 March 2016 by the Management Board. The s shareholders have a statutory right to approve or not to approve these financial statements and to require the preparation of a new set of the financial statements. Note 2. Significant accounting policies Basis of preparation These financial statements comprise the Group s consolidated financial statements and the s separate financial statements. These financial statements have been prepared on a historical cost basis, except for financial assets and financial liabilities at fair value through profit or loss, available-for-sale financial assets and derivative financial instruments stated at fair value, and land and buildings stated at revalued amounts. Statement of compliance These financial statements have been prepared in compliance with International Financial Reporting Standards (IFRSs) and their interpretations as adopted by the European Union. Functional and presentation currency Separate financial statements of the entities comprising the Group are presented in the currency of the primary economic environment in which the entities operate (functional currency). In the consolidated financial statements, the financial results and the financial position of each entity within the Group are presented in euro (EUR), which is the functional currency of the and the presentation currency of the Group s consolidated financial statements. 23
24 Note 2. Significant accounting policies (continued) Changes in accounting policies Except for the changes below, the and the Group have consistently applied the accounting policies set out in Note 2 to all periods presented in these financial statements. The and the Group have adopted the following new standards and amendments to standards, including any consequential amendments to other standards, with a date of initial application of 1 January The following amendments to standards with effective date of 1 January 2015 did not have any impact on these financial statements: - IFRIC 21 Levies - Annual improvements to IFRSs - IFRS 1 First-time Adoption of International Financial Reporting Standards - IFRS 2 Share-based Payment - IFRS 3 Business Combinations - IFRS 8 Operating Segments - IFRS 13 Fair Value Measurement - IAS 16 Property, Plant and Equipment, and IAS 38 Intangible Assets - IAS 24 Related Party Disclosures - IAS 40 Investment Property New standards and interpretations not yet adopted A number of new standards, amendments and interpretations are effective for annual periods beginning after 1 January 2016, and have not been applied in preparing these financial statements. Those which may be relevant to the and the Group as well as management s judgements regarding the possible impact of initial application of new and revised standards and interpretations are set out below. The and the Group do not plan to adopt these amendments, standards and interpretations early. (i) IFRS 11 Accounting for Acquisitions of Interests in Joint Operations (effective for annual periods beginning on or after 1 January 2016) These Amendments require business combination accounting to be applied to acquisitions of interests in a joint operation that constitutes a business. Business combination accounting also applies to the acquisition of additional interests in a joint operation while the joint operator retains joint control. The additional interest acquired will be measured at fair value. The previously held interests in the joint operation will not be remeasured. The and the Group are not parties to any joint arrangements. (ii) IAS 1 Presentation of Financial Statements (effective for annual periods beginning on or after 1 January 2016) The Amendments to include the five, narrow-focus improvements to the disclosure requirements contained in the standard. The and the Group expect that the amendments, when initially applied, will not have a material impact on the presentation of the financial statements. (iii) IAS 19 Defined Benefit Plans: Employee Contributions (effective for annual periods beginning on or after 1 February 2015) The amendments are relevant only to defined benefit plans that involve contributions from employees or third parties meeting certain criteria. When these criteria are met, a company is permitted (but not required) to recognise them as a reduction of the service cost in the period in which the related service is rendered. The and the Group do not expect the amendment to have any impact on the consolidated and separate financial statements since they do not have any defined benefit plans that involve contributions from employees or third parties. (iv) IAS 27 Separate Financial Statements (effective for annual periods beginning on or after 1 January 2016) The amendments allow an entity to use the equity method in its separate financial statements to account for investments in subsidiaries, associates and joint ventures. The does not expect that the amendments, when initially applied, will have a material impact on the financial statements as the intends to continue to carry its investments in subsidiaries, associates or joint ventures at their acquisition cost. 24
25 Note 2. Significant accounting policies (continued) (v) Annual improvements to IFRSs The improvements introduce ten amendments to ten standards and consequential amendments to other standards and interpretations. These amendments are applicable to annual periods beginning on or after either 1 February 2015 or 1 January 2016, with earlier adoption permitted. Many of these changes are not expected to have a significant impact on the financial statements of the and the Group. Basis of consolidation The consolidated financial statements comprise the financial data of the and its wholly owned subsidiary Citadele Faktoringas ir Lizingas UAB. Subsidiaries Subsidiaries, which are those entities in which the and the Group have an interest of more than one half of the voting rights, or otherwise have power to exercise control over their operations, are consolidated. Subsidiaries are consolidated from the date on which control is transferred to the and the Group and are no longer consolidated from the date that control ceases. All inter-company transactions, balances and unrealised gains on transactions between the Group companies are eliminated; unrealised losses are also eliminated but may result in recognising an impairment loss where the transaction provides evidence of an impairment of the asset transferred. Accounting policies applied by subsidiaries are consistent with those applied by the Group. The subsidiary s assets and liabilities are measured at fair value at the date of acquisition of the subsidiary. The positive difference between the acquisition cost and the fair value of the assets acquired is recognised as goodwill. Investments in a subsidiary in the s separate financial statements are accounted for at cost, which is adjusted for impairment losses, if any. Foreign currencies On 1 January 2015, Lithuania adopted the euro and became the 19 th member of the eurozone. With effect from 2 February 2002 until 2014, the litas (the national currency of Lithuania until 2014) was pegged to the euro at the rate of LTL to EUR 1. Amounts denominated in other currencies than EUR are translated into EUR at the most recent EUR to foreign currency exchange rate announced by the of Lithuania before the date of transaction. Gains and losses resulting from these transactions and from the translation of monetary assets and liabilities denominated in other currencies than LTL are recognised in profit or loss. Monetary assets and liabilities denominated in other currencies than EUR are translated to EUR at the most recent EUR to a respective foreign currency exchange rate announced by the of Lithuania before the reporting date. The official exchange rates of the main currencies were as follows: USD RUB Non-monetary items carried at cost are translated using the exchange rate until the date of the transaction, while nonmonetary assets carried at fair value or revalued amount are translated at the exchange rate announced by the of Lithuania until the date of valuation of fair value or revalued amount. Revenue and expense recognition Interest income and interest expense items are recognised on an accrual basis using the effective interest rate method. Loan origination fees for loans issued to customers are deferred (together with related direct costs) and recognised as an adjustment to the effective yield of the loans. Fees, commissions and other income and expense items are generally recorded on an accrual basis when the service has been provided. Portfolio and other management service fees are recorded based on the applicable service contracts. Late payment interest income represents interest on delayed payment. Interest on late payment is recognised when it is highly probable to receive it. Dividend income is recognised when a shareholder s right to receive dividends is established. 25
26 Note 2. Significant accounting policies (continued) The effective interest rate method is a method of calculating the amortised cost of a financial asset or a financial liability and of allocating the interest income or interest expense over the relevant period. The effective interest rate is the rate that exactly discounts estimated future cash payments or receipts through the expected life of the financial instrument or, when appropriate, a shorter period to the net carrying amount of the financial asset or financial liability. When calculating the effective interest rate, the Group estimates cash flows considering all contractual terms of the financial instruments (for example, prepayment options) but does not consider future credit losses. The calculation includes all fees paid or received between parties to the contract that are an integral part of the effective interest rate, transaction costs and all other premiums or discounts. Intangible assets The s and the Group s intangible assets include computer software and licences. Intangible assets acquired separately are initially measured at cost. Following initial recognition, intangible assets are carried at cost less any accumulated amortisation and impairment losses. The useful lives of intangible assets are assessed to be either finite or indefinite. Intangible assets with finite lives are amortised over the useful lives of 1 to 7 years and assessed for impairment whenever there is an indication that the intangible asset may be impaired. Amortisation periods and methods for intangible assets with finite useful lives are reviewed at least at each financial year-end. The and the Group do not have intangible assets with infinite useful life. Costs associated with the maintenance of computer software are recorded as operating expenses as incurred. Property, plant and equipment Property, plant and equipment, excluding land and buildings, are stated at acquisition cost less accumulated depreciation and accumulated impairment losses. The cost includes replacement costs of property, plant and equipment as incurred, provided these costs meet capitalisation criteria. Land and buildings are recorded at revalued amounts, being their fair value at the date of the revaluation less any subsequent accumulated depreciation and subsequent accumulated impairment losses. Revaluations are made with sufficient regularity such that the carrying amount does not differ materially from that which is determined using fair value at the reporting date. The fair value of the buildings is determined by appraisals undertaken by certified independent appraisers. The depreciation of buildings is calculated on a straight-line basis over the estimated useful lives of assets. The revaluation reserve for buildings is reduced by depreciation of revalued buildings. In the case of revaluation, when the estimated fair value of an asset is higher than its carrying amount, the carrying amount of this asset is increased to fair value and such increase is recorded in the revaluation reserve of property, plant and equipment in the shareholder s equity. However, such an increase in value is recognised as income if in prior periods a decrease in value has been recognised as expenses in profit or loss. In case of revaluation, when the estimated fair value of an asset is lower than its carrying amount, the carrying amount of this asset is immediately reduced to the fair value and such impairment is recognised as expenses. However, such impairment is deducted from the previous revaluation increase of the asset accounted for in the revaluation reserve, to the extent it does not exceed the amount of such increase, and thereafter recognised in profit or loss. Parts of some items of property, plant and equipment may require replacement at regular intervals. Items of property, plant and equipment may also be acquired to make a less frequently recurring replacement. Under the recognition principles for property, plant and equipment, the and the Group add to the carrying amount of property, plant and equipment such replacement costs when incurred, provided these costs meet capitalisation criteria. Leasehold improvements are amortised over the shorter of the lease term and the life of the related leased asset. The asset s residual values, useful lives and methods are reviewed, and adjusted as appropriate, at each financial year-end. An item of property, plant and equipment is derecognised upon disposal or when no future economic benefits are expected from its use or disposal. Any gain or loss arising from the derecognition of property, plant and equipment (estimated as the difference between net proceeds from disposal and the carrying value of the assets) is accounted for in profit or loss in the reporting period during which assets were derecognised. Depreciation is calculated on a straight-line basis over estimated useful lives, as follows as to the respective groups of assets: Depreciation (number of Category of assets years) Buildings Office equipment 5 8 Vehicles 6 Land is not depreciated. 26
27 Note 2. Significant accounting policies (continued) Useful lives are reviewed periodically to ensure that the period of depreciation is consistent with the pattern of economic benefits expected to be derived from items of property, plant and equipment. Depreciation charge for the year is included in profit or loss. Repairs, and renewals that do not meet the recognition criteria for property, plant and equipment, are charged to profit or loss when the expenditure is incurred. Investment property Property held for long-term rental yields or for capital appreciation or both, and not occupied by the Group companies, is classified as investment property. Investment property is recognised if it is probable that future economic benefits that are attributable to the asset will flow to the and the Group and the cost of asset can be measured reliably. Investment property is measured initially at cost, including transaction costs. Subsequently, investment property is carried at cost, less accumulated depreciation and any accumulated impairment. Depreciation is calculated on a straight-line basis over the average estimated useful lives (the same as for property, plant and equipment). Financial assets and financial liabilities The and the Group recognise a financial asset in the statement of financial position when, and only when, the and the Group become a party to the contractual provisions of the instrument. Financial assets in the scope of IAS 39 are classified as either financial assets at fair value through profit or loss, loans and receivables, held-to-maturity financial assets, or available-for-sale financial assets, as appropriate. Financial liabilities are classified as either financial liabilities at fair value through profit or loss and other liabilities measured at amortised cost. Financial assets are initially recognised at fair value and except for financial assets classified at fair value through profit or loss, include directly attributable transaction costs. The and the Group determine the classification of its financial assets on initial recognition and, where allowed and appropriate, re-evaluates this classification at each financial year-end. All regular way purchases and sales of investments are recognised using settlement date accounting. Settlement date accounting refers to the recognition of an asset on the day it is transferred to the and the Group and to the derecognition of an asset on the day that it is transferred by the and the Group. All other purchases or sales are recognised as derivative instruments until settlement occurs. When settlement date accounting is applied, the and the Group account for any change in the fair value of the asset to be received during the period between the trade date and the settlement date in the same way as it accounts for the acquired asset. Cash and cash equivalents Cash and cash equivalents comprise notes and coins on hand, compulsory reserves at the central bank and liquid financial assets with maturity of 3 months or less and insignificant fair value fluctuation risk. Cash and cash equivalents are used to ensure the fulfilment of current liabilities. Cash and cash equivalents are recognised in the statement of financial position at fair value. Financial assets and financial liabilities at fair value through profit or loss Financial assets or financial liabilities held for trading Financial assets or financial liabilities classified as held for trading other than derivatives are included in the category financial assets and financial liabilities at fair value through profit or loss. Financial assets or financial liabilities are classified as held for trading if they are acquired for the purpose of selling in the near term. Such assets or liabilities are initially accounted for at fair value and are subsequently revalued at fair value, which is the market price. Related gains and losses on revaluation are charged directly to profit or loss. Interest income and expense and dividends on such investments are recognised as interest revenue and expense and dividend revenue respectively. Derivative financial instruments In the normal course of business, the Group and the enter into various derivative financial instruments including futures, forwards and swaps in foreign exchange markets. Such financial instruments are primarily held for trading and are initially recognised in accordance with the policy for initial recognition of financial instruments and are subsequently measured at fair value. The fair values are estimated based on quoted market prices or pricing models that take into account the current market and contractual prices of the underlying instruments and other factors. Derivatives are carried as assets when their fair value is positive and as liabilities when it is negative. Gains and losses resulting from these instruments are included in profit or loss as net result of operations with derivative financial instruments. 27
28 Note 2. Significant accounting policies (continued) Held-to-maturity investments Non-derivative financial assets with fixed or determinable payments and fixed maturity are classified as held-to-maturity when the and the Group have the positive intention and ability to hold to maturity. Investments intended to be held for an undefined period are not included in this classification. Other long-term investments that are intended to be held-tomaturity, such as debt securities, are subsequently measured at amortised cost. Amortised cost is computed as the amount initially recognised minus principal repayments, plus or minus the cumulative amortisation using the effective interest method of any difference between the initially recognised cost and the maturity amount. This calculation includes all fees and points paid or received between parties to the contract that are an integral part of the effective interest rate, transaction costs and all other premiums and discounts. For investments carried at amortised cost, gains and losses are recognised in profit or loss when the investments are derecognised or impaired. Loans and receivables Loans and receivables are non-derivative financial assets with fixed or determinable payments that are not quoted in an active market. Such assets are accounted for when the Group and the lend money, sell goods or render services to the debtor and do not intend to trade in the amount receivable. Such assets are carried at amortised cost using the effective interest method. Gains and losses are recognised in profit or loss when the loans and receivables are derecognised or impaired. Loans and receivables are recognised on drawdown. From the date of signing a contractual agreement until the drawdown date, they are accounted for as off-balance sheet items. Write-offs When the loans and receivables cannot be recovered and all collateral has been realised, they are written-off and charged against impairment for incurred credit losses. The management of the and the Group make the decision on writing-off loans. Recoveries of loans previously written off are credited to profit or loss. Factoring A factoring transaction is a funding transaction wherein the and the Group finance their customers through buying their claims. Companies assign rights to invoices due at a future date to the and the Group. Factoring transactions provided by the and the Group comprise factoring transactions with a right to recourse (the and the Group are entitled to selling the overdue claim back to the customer) and factoring transactions without a right to recourse (the and the Group are not entitled to selling the overdue claim back to the customer). The factor s revenue comprises the lump-sum contract fee charged on the conclusion of the contract, commission fees charged for processing the invoices, and interest income depending on the duration of the payment term set by the purchaser. The fees are treated and accounted for in similar manner as loans related fees. The factoring balance includes the aggregate amount of factored invoices outstanding as of the reporting date and all amounts accrued for the unpaid amount. Available-for-sale financial assets Available-for-sale financial assets are those non-derivative financial assets that are designated as available-for-sale or are not classified in any of the three preceding categories. After initial recognition available-for-sale financial assets are measured at fair value based on available market prices or quotes of brokers. For investments where there is no active market, fair value is determined using valuation techniques. Such techniques include using recent arm s length market transactions, reference to the current market value of another instrument, which is substantially the same, and discounted cash flow analysis. The result of revaluation of available-for-sale securities is recognised in revaluation reserve of financial assets, reported under equity. Revaluation of available-for-sale debt securities is calculated as the difference between market value and amortised cost calculated using the effective interest rate method. When the securities are disposed of, the related accumulated fair value revaluation is included in profit or loss as gain (loss) from sale of available-for-sale financial assets. If there is objective evidence that the value of an investment has been impaired, the cumulative net loss that has been recognised in other comprehensive income is charged to profit (loss) for the year. Interest earned while holding available-for-sale financial assets is reported as interest income. Liabilities carried at amortised cost Financial liabilities that are not designated as at fair value through profit or loss fall into this category and are measured at amortised cost. Financial liabilities carried at amortised cost are deposits from banks or customers, other loans not carried at fair value through profit or loss. 28
29 Note 2. Significant accounting policies (continued) Derecognition of financial assets and liabilities Financial assets are derecognised when the contractual rights to receive the cash flows from these assets have ceased to exist or the assets have been transferred and substantially all the risks and rewards of ownership of the assets are also transferred (that is, if substantially all the risks and rewards have not been transferred, the and the Group test control to ensure that continuing involvement on the basis of any retained powers of control does not prevent derecognition). Financial liabilities are derecognised when they have been redeemed or otherwise extinguished. Collateral (shares and bonds) furnished by the under standard repurchase agreements and securities lending and borrowing transactions is not derecognised because the retains substantially all the risks and rewards on the basis of the predetermined repurchase price, and the criteria for derecognition are therefore not met. Reclassification of financial assets The Group and may choose to reclassify a non-derivative financial asset held for trading out of the held-for-trading category if the financial asset is no longer held for the purpose of selling it in the near-term. Financial assets other than loans and receivables are permitted to be reclassified out of the held for trading category only in rare circumstances arising from a single event that is unusual and highly unlikely to recur in the near-term. In addition, the Group and the may choose to reclassify financial assets that would meet the definition of loans and receivables out of the held-for-trading or availablefor-sale categories if the Group and the have the intention and ability to hold these financial assets for the foreseeable future or until maturity at the date of reclassification. Reclassifications are made at fair value as of the reclassification date. Fair value becomes the new cost or amortised cost as applicable, and no reversals of fair value gains or losses recorded before reclassification date are subsequently made. Effective interest rates for financial assets reclassified to loans and receivables and held-to-maturity categories are determined at the reclassification date. Offsetting Financial assets and liabilities are offset and the net amount is reported in the statement of financial position when there is a currently enforceable legal right to set off the recognised amounts and there is an intention to settle on a net basis, or to realise the asset and settle the liability simultaneously. Balances with banks, loans and receivables from customers For balances with banks, loans and receivables from customers carried at amortised cost, the and the Group first assess individually whether objective evidence of impairment exists for financial assets that are individually significant, or collectively for financial assets that are not individually significant. If the and the Group determine that no objective evidence of impairment exists for an individually assessed financial asset, whether significant or not, they include the asset in a group of financial assets with similar credit risk characteristics and collectively assess them for impairment. Assets that are individually assessed for impairment and for which an impairment loss is, or continues to be recognised, are not included in a collective assessment of impairment. If there is objective evidence that an impairment loss has been incurred, the amount of the loss is measured as the difference between the asset s carrying amount and the present value of estimated future cash flows (excluding future expected credit losses that have not yet been incurred). The carrying amount of the asset is reduced through the use of an allowance account and the amount of the loss is recognised in profit or loss. If, in a subsequent year, the amount of the estimated impairment loss increases or decreases because of an event occurring after the impairment was recognised, the previously recognised impairment loss is increased or reduced by adjusting the allowance account. The present value of the estimated future cash flows is discounted at the financial asset s original effective interest rate. If loan has a variable interest rate, the discount rate for measuring any impairment loss is the current effective interest rate. The calculation of the present value of the estimated future cash flows of a collateralised financial asset reflects the cash flows that may result from foreclosure less costs for obtaining and selling the collateral, whether or not foreclosure is probable. For the purpose of a collective evaluation of impairment, financial assets are grouped on the basis of the s and the Group s internal credit rating system that considers credit risk characteristics such as asset type, industry, geographical location, collateral type, past-due status and other relevant factors. Future cash flows on a group of financial assets that are collectively evaluated for impairment are estimated on the basis of historical loss experience for assets with credit risk characteristics similar to those in the and the Group. Historical loss experience is adjusted on the basis of current observable data to reflect the effects of current conditions that did not affect the years on which the historical loss experience is based and to remove the effects of conditions in the historical period that do not exist currently. Estimates of changes in future cash flows reflect, and are directionally consistent with, changes in related observable data from year to year. The methodology and assumptions used for estimating future cash flows are reviewed regularly to reduce any differences between loss estimates and actual loss experience. 29
30 Note 2. Significant accounting policies (continued) Held-to-maturity investments For held-to-maturity investments, the and the Group assess individually whether there is objective evidence of impairment. If there is objective evidence that an impairment loss has been incurred, the amount of the loss is measured as the difference between the assets carrying amount and the present value of estimated future cash flows. The carrying amount of the asset is reduced and the amount of the loss is recognised in profit or loss. If, in a subsequent year, the amount of the estimated impairment loss decreases because of an event occurring after the impairment was recognised, any amounts formerly charged are credited to profit or loss. Available-for-sale investments The Group and the Company assess at each date of preparation of the statement of financial position whether there is objective evidence that a financial asset or a group of financial assets is impaired. Renegotiated loans The and the Group renegotiate loans to customers in financial difficulties (referred to as forbearance activities ) to maximise collection opportunities and minimise the risk of default. Under the Group s forbearance policy, loan forbearance is granted on a selective basis if the debtor is currently in default on its debt or if there is a high risk of default, there is evidence that the debtor made all reasonable efforts to pay under the original contractual terms and the debtor is expected to be able to meet the revised terms. Where possible, the and the Group seek to restructure loans rather than to take possession of collateral. This may involve extending the payment arrangements and the agreement of a new loan conditions. Once the terms have been renegotiated, the loan is no longer considered past due. Management continuously reviews renegotiated loans to ensure that all criteria are met and that the future payments are likely to occur. The loans continue to be the subject to an individual or collective impairment assessment, calculated using the loan s original effective interest rate. If the terms of a financial asset are renegotiated or modified or an existing financial asset is replaced with a new one due to financial difficulties of the borrower, then an assessment is made of whether the financial asset should be derecognised. If the cash flows of the renegotiated asset are substantially different, then the contractual rights to cash flows from the original financial asset are deemed to have expired. In this case, the original financial asset is derecognised and the new financial asset is recognised at fair value. The impairment loss before an expected restructuring is measured as follows. If the expected restructuring will not result in derecognition of the existing asset, then the estimated cash flows arising from the modified financial asset are included in the measurement of the existing asset based on their expected timing and amounts discounted at the original effective interest rate of the existing financial asset. If the expected restructuring will result in derecognition of the existing asset, then the expected fair value of the new asset is treated as the final cash flow from the existing financial asset at the time of its derecognition. This amount is discounted from the expected date of derecognition to the reporting date using the original effective interest rate of the existing financial asset. Impairment of financial assets The and the Group assesses at each reporting date whether there is any objective evidence that a financial asset or a group of financial assets is impaired. A financial asset or a group of financial assets is deemed to be impaired if there is objective evidence of impairment as a result of one or more events that have occurred after the initial recognition of the asset (an incurred loss event ) and that loss event (or events) has a negative impact on the estimated future cash flows of the financial asset or the group of financial assets that can be reliably estimated. Evidence of impairment may include indications that: the borrower or a group of borrowers is experiencing significant financial difficulty; default or delinquency in interest or principal payments; the probability that the borrower will enter bankruptcy or other financial reorganisation etc. The criteria that the Group and the use to determine that there is objective evidence of an impairment loss include: - significant financial difficulties of the borrower or issuer; - breach of the contract, such as a default or delinquency in interest or principal payments for more than 60 days; - due to economic or legal reasons pertaining to financial difficulties of the borrower, the borrower benefits from allowance, which otherwise would not be granted by the lender; - the borrower has entered bankruptcy or other financial reorganisation procedure; - decrease in value or liquidity of collateral in case of assessment of loans the repayment conditions whereof directly depend upon the collateral value; - there is information on the lien attached upon the funds in the and the Group account or other assets of the borrower to whom the loan has been granted, where the occurrence of the fact may affect the discharge of the borrower's obligations in the future; 30
31 Note 2. Significant accounting policies (continued) - there is information on a deterioration of the financial performance of the persons related to the borrower, where such deterioration may affect the discharge of the borrower's obligations; - the disappearance of an active market for that financial asset because of financial difficulties; - the implementation of financed investment project is postponed for more than 1 year, where this may affect the discharge of the borrower's obligations; - loan has not been used according to the purpose, stated in the loan agreement, where this fact may affect the discharge of the borrower's obligations; - there is information on the change of management bodies or shareholders of the borrower, where this may affect the discharge of the borrower's obligations; - there is other information that allows concluding that the borrower faces financial difficulties. Impairment of non-financial assets The and the Group assess at each reporting date whether there is an indication that an asset, other than deferred tax assets, may be impaired. If any such indication exists, or when annual impairment testing for an asset is required, the and the Group make an estimate of the asset's recoverable amount. An asset's recoverable amount is the higher of an asset's or cash-generating unit's fair value less costs to sell and its value in use and is determined for an individual asset, unless the asset does not generate cash inflows that are largely independent of those from other assets or groups of assets. Where the carrying amount of an asset exceeds its recoverable amount, the asset is considered impaired and is written down to its recoverable amount. In assessing value in use, the estimated future cash flows are discounted to their present value using a pre-tax discount rate that reflects current market assessments of the time value of money and the risks specific to the asset. Impairment losses of continuing operations are recognised in profit or loss in those expense items that are consistent with the function of the impaired asset. An assessment is made at each reporting date as to whether there is any indication that previously recognised impairment losses may no longer exist or may have decreased. If such indication exists, the recoverable amount is estimated. A previously recognised impairment loss is reversed only if there has been a change in the estimates used to determine the asset's recoverable amount since the last impairment loss was recognised. If that is the case, the carrying amount of the asset is increased to its recoverable amount. That increased amount cannot exceed the carrying amount that would have been determined, net of depreciation (if any), had no impairment loss been recognised for the asset in prior years. Such reversal is recognised in profit or loss. After such a reversal the depreciation charge (if any) is adjusted in future periods to allocate the asset's revised carrying amount, less any residual value, on a systematic basis over its remaining useful life. Repossessed assets In certain circumstances, collateral is repossessed following defaults with respect to repayment of loans. Repossessed assets are initially recognised at fair value. Subsequently repossessed assets are measured at the lower of carrying amount and fair value less costs to sell and reported within Other assets. Fair values of financial assets and liabilities The fair values of financial assets and financial liabilities traded in active markets are measured on the basis of quoted market prices or the dealer-established prices. The fair value of all other financial instruments is measured using other valuation techniques. Valuation techniques The fair value is established using the fair value hierarchy presented below. The fair value hierarchy reflects the values of the inputs used. Level 1: inputs are quoted prices (unadjusted) in active markets for identical instruments. Level 2: directly (i.e. as prices) or indirectly (i.e. derived from prices) observable inputs. This category includes instruments measured using the quoted prices of similar instruments in active markets, the quoted prices of identical or similar instruments in less active markets or other valuation techniques, for which all significant inputs are either directly or indirectly observable from market data. Level 3: unobservable inputs. This category includes all instruments measured using unobservable inputs that have significant effect on the valuation of instruments. Instruments in this category are measured on the basis of quoted prices of similar instruments; to reflect the differences between instruments, unobservable adjustments or assumptions are necessary. The following valuation techniques are used: net present value and discounted cash flow models, comparison with similar instruments, for which observable market prices exist, and other techniques. Assumptions and inputs used for measurement include a risk-free and base interest rate, credit and other premiums used for discount rate measurement, prices of bonds and shares, foreign exchange rates, prices of stocks and stock indices. 31
32 Note 2. Significant accounting policies (continued) The purpose of measurement is to establish the fair value which would reflect the price that would be received to sell an asset or paid to transfer a liability in an orderly transaction between knowledgeable market participants at the measurement date. When applicable, the and the Group measure the fair value of an instrument using quoted price in an active market for that instrument. A market is regarded as active if transactions for the asset or liability take place with sufficient frequency and volume to provide pricing information on an ongoing basis. When there is no quoted price in an active market, the and the Group use valuation techniques that maximise the use of relevant observable inputs and minimise the use of unobservable inputs. The chosen valuation technique incorporates all the factors that market participants would take into account in pricing a transaction. The best evidence of the fair value of a financial instrument at initial recognition is normally the transaction price, i.e. the fair value of the consideration given or received. If the and the Group determine that the fair value at initial recognition differs from the transaction price and the fair value is evidenced neither by a quoted price in an active market for an identical asset or liability nor based on a valuation technique that used only data from observable markets, the financial instrument is initially measured at fair value, adjusted to defer the difference between the fair value at initial recognition and the transaction price. Subsequently, that difference is recognised in profit or loss on an appropriate basis over the life of the instrument but no later than when the valuation is supported wholly by observable market data or the transaction is closed out. Portfolios of financial assets and financial liabilities that are exposed to market risk and credit risk that are managed by the and the Group on the basis of the net exposure to either market or credit risk, are measured on the basis of a price that would be received to sell a net long position (or paid to transfer a net short position) for a particular risk exposure. Those portfolio-level adjustments are allocated to the individual assets and liabilities on the basis of the relative risk adjustment of each of the individual instruments in the portfolio. The and the Group recognise transfers between levels of the fair value hierarchy as of the end of the reporting period during which the change has occurred. For further analysis of basis for fair value, see Note 34. Leases Finance lease the and the Group are lessees The and the Group recognise finance leases as assets and liabilities in the statement of financial position at the date of commencement of the lease term at amounts equal to the fair value of the leased property or, if lower, at the present value of the minimum lease payments, each determined at the inception of the lease. In calculating the present value of the minimum lease payments the discount factor used is the interest rate implicit in the lease, when it is practicable to determine; otherwise, the s and the Group s incremental borrowing rate is used. Initial direct costs incurred are included as part of the asset. Lease payments are apportioned between the finance charge and the reduction of the outstanding liability. The finance charge is allocated to periods during the lease term so as to produce a constant periodic rate of interest on the remaining balance of the liability for each period. Finance lease the and the Group are lessors The and the Group recognise finance lease receivables in the statements of financial position at an amount equal to the net investment in the lease, starting from the date of commencement of the lease term. Income from finance lease is based on a pattern reflecting a constant periodic rate of return on the net investment outstanding. Initial direct costs are added during the initial recognition of finance lease receivables. Operating lease the and the Group are lessees Leases of assets under which the risks and rewards of ownership are effectively retained by the lessor are classified as operating leases. Lease payments under an operating lease are expensed on a straight-line basis over the lease term and included into operating expenses. Operating lease the and the Group are lessors The and the Group present assets subject to operating leases in the statement of financial position according to the nature of the asset. Income from operating leases is recognised as income in profit or loss on a straight-line basis over the period of the lease. The aggregate cost of incentives provided to lessees is recognised as a reduction of rental revenue over the lease term on a straight-line basis. Initial direct costs incurred specifically to earn revenues from an operating lease are added to the carrying amount of the leased asset. The depreciation policy for depreciable leased assets is consistent with the lessor s normal depreciation policy for similar items of property, plant and equipment, and depreciation is calculated in accordance with accounting policies, used for the s and the Group s property, plant and equipment. 32
33 Note 2. Significant accounting policies (continued) Loans granted to the and deposits Loans granted to the and deposits are classified as held-to-maturity financial liabilities carried at amortised cost and they are measured at amortised cost using the effective interest rate method or at historical cost if the settlement date is not known. Sale and repurchase agreements of securities Securities sold under repurchase agreements ( repos ) are classified in the financial statements as collateral when the transferee has the right by contract or custom to sell or repledge the collateral; the counterparty s liability is included in deposits from banks or deposits from customers, as appropriate. Securities purchased under repurchase agreements ( reverse repos ) are recorded as loans and amounts due from other banks or customers, as appropriate. The difference between sale and repurchase price is treated as interest and accrued over the life of the agreements using the effective interest rate method. Share capital Share capital is shown in the statement of financial position at its nominal value. Income tax Income tax charge is based on profit for the year and considers deferred taxation. Income tax is calculated based on the Lithuanian regulatory legislation on taxation. Standard income tax rate in Lithuania was 15 per cent in the years 2015 and Tax losses can be carried forward for an indefinite period, except for the losses incurred as a result of disposal of securities and/or derivative financial instruments. Such carrying forward is disrupted if the and the Group change their activities from which these losses incurred except when the and the Group do not continue their activities due to reasons which do not depend on the or the Group itself. The losses from disposal of securities and/or derivative financial instruments can be carried forward for five consecutive years and only be used to reduce the taxable income earned from the transactions of the same nature. When calculating the income tax for 2014 and subsequent years, only 70% of the taxable result for the period can be set off against tax loss utilised. Deferred tax assets and liabilities are calculated using the liability method. Deferred income taxes reflect the net tax effects of temporary differences between the carrying amounts of assets and liabilities for financial reporting purposes and the amounts used for income tax purposes, except where the deferred income tax arises from the initial recognition of goodwill or of an asset or liability in a transaction that is not a business combination and, at the time of the transaction, affects neither accounting profit nor taxable profit or loss. Deferred tax assets and liabilities are measured using a tax rate that is expected to be used when deferred tax assets are utilised or deferred tax liability is covered taking account of tax rates adopted or actually effective at the reporting date. Deferred tax assets are recognised in the statement of financial position to the extent the management believes it is probable that they will be realised in the foreseeable future, based on taxable profit forecasts. If it is believed that part of the deferred tax asset is not going to be realised, this part of the deferred tax asset is not recognised in the financial statements. Off-balance sheet items All obligations that, depending on how they evolve, might give rise to the statement of financial position exposures are accounted for as off-balance sheet exposures. This allows the and the Group to assess capital requirement and to allocate funds required to cover those obligations. Related parties In accordance with IAS 24 Related Party Disclosures, parties are considered to be related if one party has the ability to unilaterally or jointly control the other party or exercise significant influence over the other party in making financial or operational decisions, or where parties are under common control. In addition, members of key management personnel as well as their close family members, and close family members of individuals that unilaterally or jointly control the or the Group or exercise significant influence over them are related parties. In considering each possible related party relationship, attention is directed to the substance of the relationship, not merely the legal form. Credit-related commitments and financial guarantees Credit-related commitments represent unused portions of authorisations to extend credit in the form of loans, guarantees or letters of credit. The and the Group have the authority to cancel such agreement if the client s risk increases. Creditrelated commitments are treated as risk-bearing assets for capital adequacy calculation purposes. 33
34 Note 2. Significant accounting policies (continued) In the ordinary course of business, the and the Group issue financial guarantees, consisting of letters of credit, guarantees and acceptances. Financial guarantees are initially recognised in the financial statements at fair value, under Other liabilities, being premium received. Subsequent to initial recognition, the s and the Group's liability under each guarantee is measured at the higher of the unamortised premium and the best estimate of probable expenditure required in settling any financial obligation arising as a result of the guarantee. Any increase in the liability relating to financial guarantees is recorded in profit or loss under Impairment expense'. The premium received is recognised in profit or loss as net fee and commission income on a straight-line basis over the life of guarantee. A guarantee represents an irrevocable assurance that the and the Group will make payments in the event that a customer fails to meet his obligations to third parties. In the event that payments under such guarantee become probable, it is subsequently accounted for as an item on the statement of financial position and is subject to impairment assessment. Until a guarantee is executed, it is treated as risk-bearing asset for capital adequacy calculation purposes. Documentary and commercial letters of credit represent written undertakings by the and the Group on behalf of a customer authorising a third party to draw drafts on the and the Group up to a stipulated amount under specific terms and conditions. Letters of credit are collateralised by the underlying shipments of goods. Letters of credit are treated as riskbearing assets for capital adequacy calculation purposes. Provisions Provisions are recognised when the and the Group have a legal obligation or irrevocable commitment as a result of a past event, and it is probable that an outflow or recourses embodying economic benefits will be required to settle the obligation and a reliable estimate can be made of the amount of the obligation. The expense relating to any provision is recognised in profit or loss. If the effect of the time value of money is material, provisions are discounted using current pretax rate that reflects, where appropriate, the risks specific to the liability. Where discounting is used, the increase in the provision due to the passage of time is recognised as borrowing costs. Employee benefits Social security contributions The and the Group pay social security contributions to the state Social Security Fund (hereinafter the Fund ) on behalf of its employees based on the defined contribution plan in accordance with the local legal requirements. A defined contribution plan is a plan under which the pays fixed contributions into the Fund and will have no legal or constructive obligations to pay further contributions if the Fund does not hold sufficient assets to pay all employees benefits relating to employee service in the current and prior periods. The social security contributions are recognised as an expense on an accrual basis and are included within staff costs. Each year, social security contributions are allocated by the Fund for pension, health, sickness, maternity and unemployment payments. Termination benefits Termination benefits are payable when employment is terminated by the or the Group before the normal retirement date, or whenever an employee accepts voluntary redundancy in exchange for these benefits. The and the Group recognise termination benefits when they are demonstrably committed to either: terminating the employment of current employees according to a detailed formal plan without possibility of withdrawal; or providing termination benefits as a result of an offer made to encourage voluntary redundancy. Benefits falling due more than 12 months after the reporting date are discounted to present value. Contingencies Contingent liabilities are not recognised in the financial statements. They are disclosed unless the possibility of an outflow of resources embodying economic benefits is remote. A contingent asset is not recognised in the financial statements but disclosed when an inflow of income or economic benefits is probable. Use of critical estimates and judgements in the preparation of the financial statements The preparation of the financial statements in conformity with the International Financial Reporting Standards requires management to make estimates and assumptions that affect the reported amounts of assets, liabilities, income and expenses and disclosure of contingencies. The significant areas of estimation used in the preparation of the accompanying financial statements relate to assessment of impairment for loans, receivables and available-for-sale financial assets, recognition of deferred income tax assets, impairment of investment in subsidiary, recognition of finance lease and retention of held-to-maturity investments. The estimates and assumptions that have a significant risk of causing a material adjustment to the carrying amounts of assets and liabilities within the next financial year are outlined below. 34
35 Note 2. Significant accounting policies (continued) Assessment of impairment for loans and receivables and other assets The and the Group regularly review their loans and receivables to assess impairment. The and the Group use their experienced judgement to estimate the amount of any impairment loss in cases where a borrower is in financial difficulties and there is limited available historical data relating to similar borrowers. Similarly, the and the Group estimate changes in future cash flows based on the observable data indicating that there has been an adverse change in the payment status of borrowers in a group, or national or local economic conditions that correlate with defaults on assets in the group. Management uses estimates based on historical loss experience for assets with credit risk characteristics and objective evidence of impairment similar to those in the group of loans and receivables when scheduling its future cash flows. The and the Group use their own judgement based on previous experience and observable data to adjust loans and receivables, finance lease receivables and repossessed assets to reflect current circumstances. The methodology and assumptions used for estimating both the amount and timing of future cash flows are reviewed regularly to reduce any differences between loss estimates and actual loss experience. For carrying amounts, see Notes 7, 8 and 13. The sensitivity analysis of loans and receivables is disclosed in Note 33. Deferred income tax Deferred income tax assets are recognised for all unused tax losses and other temporary differences to the extent that it is probable that taxable profit will be available against which the losses can be utilised. Significant management judgment is required to determine the amount of deferred tax assets that can be recognised, based upon the likely timing and level of future taxable profits together with future tax planning strategies. For carrying amounts of deferred income tax, see Note 12. Impairment of investment in subsidiary When indications of impairment are identified, the tests the investment in subsidiary for impairment. The calculates the recoverable amount of the investment in subsidiary using the equity method. For the testing purposes, assets and liabilities of the subsidiary are compared. Initial recognition of related-party transactions In the normal course of business, the and the Group enter into transactions with their related parties. IAS 39 requires initial recognition of financial instruments based on their fair values. Judgement is applied in determining if transactions are priced at market or non-market rates, where there is no active market for such transactions. The basis for judgement is pricing for similar types of transactions with unrelated parties and effective interest rate analysis. The judgements made in applying accounting policies that have the most significant effect on the amounts recognised in the financial statements are outlined below. Recognition of finance lease The management determines whether substantially all the risks and rewards of ownership of financial assets and assets leased under finance lease contracts are transferred to the contractual party by considering, first, what risks and rewards are the most significant and what are substantially all the risks and rewards. The Group has determined that substantially all the risks and rewards are considered to be transferred when the present value of minimum lease payments is almost equal to the acquisition cost of assets leased; the title of ownership is transferred upon expiry of the lease term; the lessee has a possibility to acquire the asset for a price, which is expected to be significantly lower than the fair value at the moment the assets are available for acquisition, and on inception of the lease it will be certain that such possibility will be exercised; the lease term covers the major portion of the economic life even if the title of ownership is not transferred; the assets leased is of specialised nature so that only the lessee will be able to use it without major modifications. Fair value of property, plant and equipment Land, buildings and other real estate are carried at revalued amount which is their fair value as at the revaluation date less subsequently accumulated depreciation and impairment. Revaluations are carried out regularly ensuring that the carrying amount of buildings does not significantly differ from their fair values as at the reporting date. The fair value of buildings is established by certified independent real estate valuers. Depreciation is calculated on a straight-line basis over the estimated useful lives of the assets. The revaluation reserve of buildings is reduced by an equivalent amount of annual depreciation charged on revalued buildings each year and is transferred directly to retained earnings. In case of revaluation, when the estimated fair value of the assets exceeds their carrying value, the carrying value is increased to the fair value and the amount of increase is included into revaluation reserve of property and equipment as other comprehensive income in equity. However, such increase in revaluation is recognized as income to the extent it does not exceed the decrease of previous revaluation recognized in profit or loss. Depreciation is calculated from the depreciable amount which is equal to acquisition cost less residual value of an asset. 35
36 Note 3. Balances with the central bank Group 2014 Balances with the central bank 21,503-21,503 - Compulsory reserves 2,854 9,092 2,854 9,092 Total 24,357 9,092 24,357 9,092 The compulsory reserves held in the of Lithuania comprise an amount which is based on the value of attracted funds. The amount is estimated on a monthly basis with reference to the value of the s liabilities at the end of the previous month. An average monthly amount is expected to be equal to the compulsory reserve estimated according to the requirements of the of Lithuania. With effect from 10 January 2013, the compulsory reserve rate is 3% for liabilities included into the base of compulsory reserve based on Resolution No of the of Lithuania. With the effect from 1 January 2015, the of Lithuania by its Resolution No. S 2014 ( ) established a 1% rate of compulsory reserve and the terms used in the calculations of the amounts of compulsory reserves. The of Lithuania makes payments for holding compulsory reserves; the amount of payments is calculated based on a predefined formula. In 2015, the received a payment of EUR 1,328 for compulsory reserves. In 2014, the received a payment of EUR 22 for compulsory reserves. Note 4. Balances with banks and credit institutions Group 2014 Correspondent accounts with banks 3,364 26,654 3,364 26,654 Overnight deposits - 40,315-40,315 Term deposits 903 9, ,699 Total 4,267 76,668 4,267 76,668 Note 5. Derivative financial instruments The tables below include the notional amounts and fair values of derivative financial instruments of the and the Group: At 2015 Notional amount Fair value Assets Liabilities Assets Liabilities Spots Swaps 13,987 13, Forwards 1,185 1, Total 15,815 15, At 2014 Notional amount Fair value Assets Liabilities Assets Liabilities Spots Swaps 3,909 3, Forwards Total 5,366 5, Note 6. Available-for-sale financial assets As at 2015, the s and the Group s available-for-sale debt securities comprised Lithuanian Government bonds amounting to EUR 43,428 thousand ( 2014: EUR 73,742 thousand), foreign government bonds of EUR 21,471 thousand ( 2014: EUR 6,703 thousand), bonds of banks of EUR 13,658 thousand ( 2014: EUR 7,785 thousand), bonds of financial institutions of EUR 7,068 thousand ( 2014: EUR 9,625 thousand) and corporate bonds of EUR 42,651 thousand ( 2014: EUR 25,157 thousand). As at 2015 and 2014, the s and the Group s available-for-sale equity securities comprised equity securities of unlisted companies. 36
37 Note 6. Available-for-sale financial assets (continued) Initial yields and maturities of debt securities are as follows: Yield Maturity Yield Maturity Available-for-sale financial assets % Feb 2016 Nov % Sep 2015 Feb 2023 Note 7. Finance lease receivables Group Categories of assets: Vehicles 31,158 22,909 Real estate 4,460 5,899 Manufacturing equipment Other assets 4,695 2,930 Total 40,481 32,113 Less: impairment (Note 25) (2,683) (2,954) Finance lease receivables net 37,798 29,159 Gross investment in the lease Present value of minimum finance lease payments Finance lease payments: No later than 1 year 16,980 11,847 15,639 10,843 Later than 1 year and no later than 5 years 24,995 22,112 23,654 20,831 Later than 5 years 1, , Total 43,163 34,408 40,481 32,113 Less: unearned income (2,682) (2,295) - - Minimum finance lease payments before impairment 40,481 32,113 40,481 32,113 Less: impairment (Note 25) (2,683) (2,954) (2,683) (2,954) Present value of minimum finance lease payments 37,798 29,159 37,798 29,159 Group Finance lease portfolio: Corporate entities 37,847 29,978 Private individuals 2,634 2,135 Total 40,481 32,113 Less: recognised impairment for corporate entities (Note 25) (2,636) (2,951) Less: recognised impairment for private individuals (Note 25) (47) (3) Finance lease portfolio, net 37,798 29,159 37
38 Note 7. Finance lease receivables (continued) In 2015, 1,216 new agreements were signed for the financing in the amount of EUR 26,430 thousand; receivables under terminated agreements amounted to EUR 1,107 thousand. In 2014, 803 new agreements were signed for the financing in the amount of EUR 16,925 thousand; receivables under terminated agreements amounted to EUR 1,153 thousand. Note 8. Loans and receivables Group 2014 Loans to financial institutions 38, Loans to corporate entities: Public sector 5,716 1,586 5,716 1,586 Large corporate customers 19,278 18,019 19,278 18,019 Small and medium-sized enterprises 79,602 62,414 79,602 62,414 Loans to private individuals: Mortgages 80,344 86,021 80,344 86,021 Other loans 20,405 22,359 20,405 22,359 Total 243, , , ,933 Individual impairment (Note 25) (5,619) (9,299) (5,619) (9,299) Collective impairment (Note 25) (1,547) (1,493) (1,547) (1,493) Loans and receivables, net 236, , , ,141 As at 2015 and 2014, the and the Group had no reverse repurchase agreements. Note 9. Property, plant and equipment Changes in property, plant and equipment during the year 2015 are presented in the tables below: Land and buildings Vehicles Office equipment and other Total Cost or revalued amount Balance at , ,029 Additions Disposals and write-offs - (78) (177) (255) Balance at , ,929 Accumulated depreciation and impairment Balance at ,064 Charge for the year Disposals and write-offs - (60) (86) (146) Impairment (Note 25) - (13) Balance at ,001 Net book amount Balance at , ,965 Balance at , ,928 38
39 Note 9. Property, plant and equipment (continued) Group Land and buildings Vehicles Office equipment and other Total Cost or revalued amount Balance at , ,063 Additions Disposals and write-offs - (78) (177) (255) Balance at , ,963 Accumulated depreciation and impairment Balance at ,096 Charge for the year Disposals and write-offs - (60) (86) (146) Impairment (Note 25) - (13) Balance at ,034 Net book amount Balance at , ,967 Balance at , ,929 As at 2015 and 2014, the s and the Group s buildings and land were accounted for at revalued amounts. Valuations were performed in 2014 to determine the fair value of assets. The valuation was carried out by independent property appraisers from Centro Kubas-Nekilnojamasis Turtas UAB having the necessary and recognised qualifications and the up-to-date experience related to the place and category of the assets under valuation. The fair value of buildings and land equal to EUR 2,905 thousand is considered Level 3 under the hierarchy of fair value. The valuation was performed using the market comparison technique. Due to the fact that there were no significant market developments during the year 2015, the s management considers the fair value of the buildings and land unchanged. The table below shows all significant unobservable inputs used for fair value measurement and their effect on the established fair value: Assets Building at K. Kalinausko g. 13, Vilnius (fair value: EUR 2,079 thousand) Building at Vilniaus g. 114, 114a, 116, Šiauliai (fair value: EUR 174 thousand) Land at K. Kalinausko g. 13, Vilnius (fair value: EUR 652 thousand) Significant unobservable inputs EUR 845 per square meter EUR 510 per square meter EUR 41,506 per are Sensitivity of fair value measurement to changes in unobservable inputs The fair value would increase with an increase in price per square meter and decrease with a decrease in price per square meter. The fair value would increase with an increase in price per square meter and decrease with a decrease in price per square meter. The fair value would increase with an increase in price per are and decrease with a decrease in price per are. Had no valuations been performed, the carrying amount of the s and the Group s land and buildings would have been EUR 2,280 thousand as at 2015 ( 2014: EUR 2,379 thousand). Depreciation charges are included in operating expenses. 39
40 Note 9. Property, plant and equipment (continued) Changes in property, plant and equipment during the year 2014 are presented in the tables below: Land and buildings Vehicles Office equipment and other Total Cost or revalued amount Balance at , ,190 4,511 Additions Revaluation (110) - - (110) Disposals and write-offs - (54) (527) (581) Balance at , ,029 Accumulated depreciation and impairment Balance at ,098 Charge for the year Revaluation - (48) (474) (522) Impairment (Note 25) Balance at ,064 Net book amount Balance at , ,413 Balance at , ,965 Group Land and buildings Vehicles Office equipment and other Total Cost or revalued amount Balance at , ,222 4,543 Additions Revaluation (110) - - (110) Disposals and write-offs - (54) (527) (581) Balance at , ,063 Accumulated depreciation and impairment Balance at ,131 Charge for the year Revaluation - (48) (474) (522) Impairment (Note 25) Balance at ,097 Net book amount Balance at , ,412 Balance at , ,966 40
41 Note 10. Investment property Group Land and buildings Total Cost Balance at Disposals (336) (336) Balance at Accumulated depreciation and impairment Balance at Charge for the year Impairment (Note 25) (70) (70) Depreciation on disposals (58) (58) Balance at Net book amount Balance at Balance at As at 2015, the had no investment property. In September 2014, the s investment property was sold. The fair value of investment property of the Group as at 2015 approximated its net book value. The fair value of investment property was determined by independent appraisers. Accumulated impairment on the Group s investment property amounted to EUR 103 thousand as at 2015 ( 2014: EUR 172 thousand). The and the Group account for their investment property using the cost method. Depreciation charges are included in operating expenses. In 2015, the and the Group earned no income from lease of investment property (2014: EUR 12 thousand). The s and the Group s direct operating expenses associated with investment property recognised in profit or loss amounted to EUR 3 thousand (2014: EUR 21 thousand). Note 11. Intangible assets Changes in intangible assets during the year 2015 are presented in the tables below: Software Licences Total Cost Balance at ,010 1,569 Additions Write-offs (93) (43) (136) Balance at ,495 Accumulated amortisation and impairment Balance at ,010 1,569 Write-offs (65) (21) (86) Impairment (Note 25) 32 (20) 12 Balance at ,495 Net book amount Balance at Balance at
42 Note 11. Intangible assets (continued) Group Software Licences Total Cost Balance at ,010 1,751 Additions Write-offs (93) (43) (136) Balance at ,682 Accumulated amortisation and impairment Balance at ,010 1,749 Charge for the year 1-1 Write-offs (65) (21) (86) Impairment (Note 25) 32 (20) 12 Balance at ,676 Net book amount Balance at Balance at Changes in intangible assets during the year 2014 are presented in the tables below: Software Licences Total Cost Balance at ,266 3,859 Additions Write-offs (87) (2,364) (2,451) Balance at ,010 1,569 Accumulated amortisation Balance at ,039 3,560 Charge for the year Write-offs (87) (2,241) (2,328) Impairment (Note 25) Balance at ,010 1,569 Net book amount Balance at Balance at Group Software Licences Total Cost Balance at ,266 4,039 Additions Write-offs (87) (2,364) (2,451) Balance at ,010 1,751 Accumulated amortisation Balance at ,039 3,740 Charge for the year Write-offs (87) (2,241) (2,328) Impairment (Note 25) Balance at ,010 1,749 Net book amount Balance at Balance at Amortisation charges are included in operating expenses. 42
43 Note 12. Income tax Group Income tax (134) (53) (140) (53) Change in deferred income tax Income tax benefit (expense) (79) 474 (85) 474 Components of deferred income tax Group Deferred income tax assets Accumulated tax losses 4,055 4,189 4,862 5,150 Impairment of receivable leasing interest, repossessed assets and other receivables Revaluation of property, plant and equipment Accrued vacation reserve and other accruals Impairment for non-current assets Deferred income tax assets 4,407 4,573 5,290 5,599 Not recognised part of deferred income tax assets (2,871) (3,067) (3,754) (4,093) Recognised deferred income tax assets 1,536 1,506 1,536 1,506 Deferred income tax liability Fair value reserve 26 (222) 26 (222) Revaluation of property, plant and equipment (93) (78) (93) (78) Revaluation of derivative financial instruments - (7) - (7) Capitalised VAT - (18) - (18) Other (2) (2) (2) (2) Recognised deferred income tax liability (69) (327) (69) (327) Deferred income tax, net 1,467 1,179 1,467 1,179 Net deferred income tax as at 1 January 1, , Deferred income tax change recognised in other comprehensive income 248 (84) 248 (84) Deferred income tax change recognised in profit (loss) Revaluation results of non-current assets (15) - (15) - Total change in deferred income tax Net deferred income tax as at 1,467 1,179 1,467 1,179 Income tax at the rate of 15 per cent was used in the calculation of deferred income tax in 2015 and As at 2015, the s and the Group s tax losses carried forward for an indefinite period, for which no deferred income tax assets have been recognised, amounted to EUR 19,147 thousand and EUR 24,524 thousand, respectively (2014: EUR 20,041 thousand and EUR 25,256 thousand, respectively). As at 2015, the Group s other temporary differences, for which no deferred income tax assets were recognised, amounted to EUR 180 thousand ( 2014: EUR 1,176 thousand). As at 2015, the recognised deferred income tax assets in the amount of EUR 1,467 thousand and expects to earn sufficient taxable profit to cover its tax losses and other temporary differences in the foreseeable future. The changes in deferred income tax related to revaluation of property and available-for-sale securities are recognised in other comprehensive income. 43
44 Note 12. Income tax (continued) Income tax expense on the result for the year can be reconciled with income tax expense calculated using a statutory income tax rate for profit before tax as follows: Profit before tax 3,489 (224) Tax calculated at statutory 15% tax rate 15% (523) 15% 33 Tax exempt income 1% 47 84% (190) Non-deductible expenses 2% % 981 Recognition of tax losses previously unrecognized 9% % (350) Recognition of other temporary differences previously unrecognized Total income tax benefit (expense) 2% (79) 211% 474 Group Profit before tax 3,504 (233) Tax calculated at statutory 15% tax rate 15% (526) 15% 35 Tax exempt income 2% 73 81% (190) Non-deductible expenses 1% % 979 Recognition of tax losses previously unrecognized 9% % (350) Recognition of other temporary differences previously unrecognized Total income tax benefit (expense) 2% (85) 203% 474 Note 13. Other assets Group 2014 Financial assets Card payments Stock exchange transactions related to operations with securities Funds transferred to Citadele a AS for repayment of deposits held with Snoras AB bank Non-financial assets Supplies for operations Advance payments for goods and services Repossessed assets* - 1, ,237 Other assets 1, , ,268 1,871 1,629 1,985 Impairment of repossessed assets (Note 25) - (423) (4) (466) Impairment of other assets (Note 25) (17) (18) (61) (18) Total other assets, net 1,623 1,988 1,936 2,059 One of apartments repossessed for debts and a commercial building in Šiauliai were sold in In 2015, 13 items (including investment property) of repossessed assets were sold, and newly repossessed assets due to insolvency of customers and termination of contracts amounted to 18 items. Vehicles and real estate comprise the Group s repossessed assets. The objective is to sell repossessed assets during the shortest possible period. 44
45 Note 14. Due to banks and other credit institutions Group 2014 Correspondent accounts with banks 11,764 40,450 11,764 40,450 Term deposits from banks Deposits from other credit institutions 1, , Credit lines * ,969 Transfers until settlement date 984 2, ,012 Total 14,982 42,689 14,982 72,658 * As at 2014, the subsidiary Citadele Faktoringas ir Lizingas UAB had a credit line from Citadele a AS, which was refinanced by in February Note 15. Due to customers Group 2014 Demand deposits 185, , , ,596 Term deposits 140, , , ,781 Total 325, , , ,377 Amounts due to customers include accounts with the following types of customers: Group Corporate clients 155, , , ,118 Individuals 166, , , ,274 Financial institutions Government institutions 1,846 1,228 1,846 1,228 State and municipal enterprises 631 1, ,146 Amounts due to customers 325, , , ,377 Note 16. Other loans and Group and Group Investicijų ir Verslo Garantijos UAB EUR 13,300 11,915 Žemės Ūkio Paskolų Garantijų Fondas UAB EUR Liability to the of Lithuania for the cash in EUR received until the adoption date EUR ,405 12,235 The loan granted by Investicijų ir Verslo Garantijos UAB represent loans obtained from the EU structural funds to finance small and medium-sized enterprises. The loan matures on 2020 (the Agreement No. 8/ of 2 May 2014 on the amendment of the open credit line agreement of 7 July 2009 (edition of 20 November 2012), the term was extended (the term before extension was 2018)), the interest rate is 3-month EURIBOR plus 0.1% margin. The funds are 100% re-lent to clients. Loans granted by Žemės Ūkio Paskolų Garantijų Fondas UAB represent loans obtained to finance agricultural projects. The loans mature on 28 December 2017 and 21 October 2019, their interest rate is 6-month EURIBOR less 1%, but not lower than 1%. The funds are 100% re-lent to clients. 45
46 Note 17. Other liabilities Group 2014 Financial liabilities Liabilities under guarantee agreements 1,409 1, Other payment-related liabilities Incoming payments until settlement date Wages and salaries payable Funds received from Indėlių ir Investicijų Draudimas VĮ Amounts paid by residents to service suppliers Other financial liabilities ,736 3,460 1,287 2,051 Non-financial liabilities Accrued charges Accrued vacation pay Accrued bonuses Taxes other than income tax Other liabilities ,852 1,544 2,098 1,682 4,588 5,004 3,385 3,733 Movement of provisions during the year: 2014 Increase Decrease 2015 Accrued expenses 444 6,587 6, Vacation accruals Accrued bonuses ,333 7,091 6,922 1,502 Note 18. Capital and reserves As at 2015 and 2014, the s share capital amounted to EUR 43,112, and it was divided into 1,488,681 ordinary registered shares with par value of EUR each. All shares are fully paid. The holders of ordinary shares are entitled to receive dividends as declared from time to time and are entitled to one vote per share at annual and general meetings of the. For 2014, dividends per share amounted to EUR All shares rank equally with regard to the s residual assets. Revaluation reserve of property, plant and equipment The revaluation reserve of property, plant and equipment is used to record increases in the fair value of land and buildings and decreases, net of deferred taxes, to the extent that such decrease relates to the increase on the same asset previously recognised in equity. Revaluation reserve of financial assets The revaluation reserve of financial assets is used to record changes in the fair value of available-for-sale financial assets, net of deferred taxes. No gain or loss is recognised in profit or loss as long as the assets have not been disposed or impaired. Legal reserve Based on the legislation effective in the Republic of Lithuania, the must form the legal reserve which must make up 1/10 of its authorised capital and which may only be used for loss coverage. When distributing its profits, the allocates 1/20 of the net profit of the financial year to legal reserve each year. 46
47 Note 19. Commitments and guarantees Commitments and guarantees comprise as follows: Group 2014 Commitments and guarantees Credit-related commitments 26,022 24,867 25,122 24,867 Guarantees and warranties issued 4,094 3,307 2,685 1,899 Total commitments and guarantees 30,116 28,174 27,807 26,766 The amounts for guarantees in the above table represent the maximum amount that could become payable. The amounts expected to be paid under such guarantee contracts are recognised as liabilities. Note 20. Interest income and interest expense Group Interest income arising on: loans and receivables 7,528 6,845 6,767 6,846 available-for-sale debt securities 2,229 1,831 2,229 1,831 held-to-maturity investments cash balances with banks and other credit institutions loans past due and receivables (late payment interest) finance lease receivables 14-1,771 1,530 compulsory reserves at the of Lithuania Total interest income 10,058 8,978 11,054 10,509 Interest expense for: amounts due to deposit holders (2,861) (2,774)* (2,860) (2,775) amounts due to banks and other credit institutions (22) (170) (103) (906) finance leases (2) (2) - (2) Total interest expense (2,885) (2,946) (2,963) (3,683) Interest income, net 7,173 6,032 8,091 6,826 Compulsory deposit insurance contributions are recognised as interest expense. Insurance contributions (EUR 1,315 thousand in 2015 and EUR 1,033 thousand in 2014) are calculated as a fixed rate on the deposit base and actually represent a part of effective interest on deposits. * Interest expenses for amounts due to deposit holders for 2014 were reduced by EUR 10 thousand reclassifying income from termination of deposit agreements from other income (Note 24). The changes were implemented to unify the reports with those submitted by the parent bank. 47
48 Note 21. Service fee and commission income and expense Group Service fee and commission income Payment cards servicing 1,628 1,771 1,628 1,771 Commission on money transfers 1,140 1,400 1,138 1,398 Foreign exchange commission Cash disbursement commission On operations with securities Payment collection services On guarantees and warranties issued Other income * Total service fee and commission income 3,446 4,348 3,403 4,301 Service fee and commission expense Payment cards servicing (1,125) (1,007) (1,125) (1,007) Accounts servicing (147) (155) (148) (155) On operations with securities (56) (64) (56) (64) Base currency exchange - (86) - (86) Other (112) (282)** (112) (289) Total service fee and commission expense (1,440) (1,594) (1,441) (1,601) Net service fee and commission income 2,006 2,754 1,962 2,700 * Other service fee and commission income for 2014 was reduced by EUR 322 thousand reclassifying income received from services rendered to the subsidiary as reversal of expenses of EUR 307 thousand under operating expenses (Note 26) and EUR 15 thousand as fees for services rendered under other income (Note 24). In addition, income was reduced by EUR 41 thousand reclassifying income from rent of safe deposit boxes as other income (Note 24). The changes were implemented to unify the reports with those submitted by the parent bank. ** Other service fee and commission income for 2014 was increased by EUR 248 thousand reclassifying expenses from SWIFT membership fee and services of data processing centres from operating expenses (Note 26). The changes were implemented to unify the reports with those submitted by the parent bank. Note 22. Net gain on operations with securities Group Realised gain on available-for-sale securities 1,935 1,906 1,935 1,906 Sales result of held-to-maturity securities - (89) - (89) Net gain on operations with securities 1,935 1,817 1,935 1,817 Due to changes in market conditions, in 2014 a part of held-to-maturity securities was sold. The remaining part of held-tomaturity investments was reclassified as available-for-sale financial assets. More information is disclosed in Note 6. Note 23. Net gain on other operations Group Gain (loss) on revaluation of monetary assets and liabilities in foreign currencies, net (112) (1,753) (112) (1,753) Realised gain on foreign exchange transactions, net 1,173 2,837 1,173 2,840 Gain (loss) on revaluation of derivative financial instruments, net Net gain on other operations 1,062 1,131 1,062 1,133 48
49 Note 24. Other income Group Gain on sale of repossessed assets Lease of movable and immovable property Other income * Other income * Other income for 2014 was increased by EUR 41 thousand reclassifying income received from rent of safe deposit boxes and fee of EUR 15 thousand received for services rendered to the subsidiary from service fee and commission income (Note 21). The changes were implemented to unify the reports with those submitted by the parent bank. Note 25. Impairment (expense)/reversal Group Financial assets impairment (expense)/reversal Impairment in respect of loan portfolio (Note 8) (55) (1,134) (55) (1,134) Costs of liabilities under guarantee agreements Impairment in respect of finance lease portfolio (Note 7) - - (161) (178) (55) (1,134) (216) (1,312) Reversal of impairment of investments in subsidiaries Impairment of other assets and investment property (Notes 13 and 10) 1 (2) (21) (130) Impairment of intangible assets and property, plant and equipment (Notes 9 and 11) (201) (1,029) (201) (1,029) Impairment (expense)/reversal 100 (2,165) (438) (2,471) 49
50 Note 25. Impairment (expense)/reversal (continued) Change in impairment during 2015 and 2014 is presented in the table below: Group Impairment at 1 January ,441 14,147 Impairment (charged)/credited to profit or loss Financial institutions - - Loans to corporate entities: Public sector 1 1 Large corporate customers (10) (10) Small and medium-sized enterprises Loans to individuals: Mortgages Other loans (206) (206) Finance lease portfolio: Corporate entities Private individuals - 18 Other assets and investment property Property, plant and equipment and intangible assets Investment in subsidiary - - Impairment of off-balance sheet commitments Impairment charged to profit or loss 2,165 2,471 Impairment of repossessed assets and investment property written off for realised assets Impairment written off for loans (449) (449) Impairment written off for other assets (194) (572) Finance lease impairment written off for terminated contracts: Corporate entities - (406) Private individuals - - Foreign exchange effect Impairment at ,006 15,235 Impairment (charged) credited to profit or loss Financial institutions Loans to corporate entities: Public sector Large corporate customers Small and medium-sized enterprises Loans to individuals: Mortgages (49) (49) Other loans (483) (483) Finance lease portfolio: Corporate entities Private individuals - 28 Other assets and investment property (1) 21 Property, plant and equipment and intangible assets Investment in subsidiary (355) - Impairment charged to profit or loss (100) 438 Impairment of repossessed assets and investment property written off for realised assets - (86) Impairment written off for loans (3,684) (3,684) Impairment written off for other assets (666) (666) Impairment written off for off-balance sheet commitments (114) (114) Finance lease impairment written off for terminated contracts: Corporate entities - (433) Private individuals Foreign exchange effect 3 3 Impairment at ,445 10,693 Whereof impairment for: loans and receivables (Notes 8 and 9) 7,166 9,849 investments in subsidiaries (Note 27) 6,177 - property, plant and equipment (Note 9) investment property (Note 10) intangible assets (Note 11) repossessed assets and other assets (Note 13) off-balance sheet commitments (Note 17) 1,
51 Note 26. Operating expenses Group Wages and salaries of employees 3,642 3,735 3,895 3,775 Office equipment and ATM and POS maintenance expenses 1,434 1,353 1,447 1,378 Social security contributions 1,178 1,251 1,258 1,263 Taxes other than income tax Advertising and marketing Payments to service providers of the bank Termination benefits Maintenance expenses of buildings Transportation, post and communication expenses Amortisation and depreciation Provisions (114) 195 (114) 195 Write-off losses related to assets not fully depreciated Rent of buildings Insurance expenses Revaluation of property, plant and equipment Expenses related to loan recovery Office supplies Shortages and losses Other expenses Total 8,994 9,892* 9,536 10,444 * Operating expenses for 2014 were reduced by EUR 555 thousand reclassifying reversal of expenses of EUR 307 thousand from service fee and commission income (Note 21) and reclassifying the expenses of SWIFT membership fee and services of data processing centres amounting to EUR 248 thousand to service fee and commission expense (Note 21). The changes were implemented to unify the reports with those submitted by the parent bank. Note 27. Investment in subsidiary Investment in subsidiary Acquisition cost of investments 7,743 7,744 Impairment (6,177) (6,533) Investment in subsidiary, net 1,566 1,211 The has an investment in subsidiary Citadele Faktoringas ir Lizingas UAB, located at K. Kalinausko g. 13, Vilnius. The controls 100% of shares. In 2015, the reversal of impairment of share value was made (EUR 355 thousand). The main financial figures of Citadele Faktoringas ir Lizingas UAB: Items of the statement of financial position Cash and balances with banks Finance lease receivables 39,253 30,628 Property, plant and equipment, intangible assets and investment property Other assets Total assets 39,794 31,368 Liabilities to banks and other financial institutions 37,976 29,969 Other liabilities Total liabilities 38,228 30,166 Equity 1,566 1,202 51
52 Note 27. Investment in subsidiary (continued) Items of the statement of profit or loss Net interest income Net commission income (6) (9) Other income Operating expenses (734) (824) Impairment (expense)/reversal 145 (306) Net profit 364 (9) Note 28. Compliance with prudential requirements to manage operational risks In 2015 and 2014, the and the Group acted in compliance with the prudential requirements set by the of Lithuania. As at 2015 Compliance by No. Prudential requirement Ratio Group 1. Capital adequacy 14.5% Liquidity coverage ratio Not lower than 100% % % Overall open currency position 25%, Maximum open position in 3. per single currency 15% 0.00% 0.00% foreign currency of the bank s capital 0.37% (USD) 0.37% (USD) 4. Maximum exposure to a single borrower Per single borrower not in excess of 25% of the bank s capital 23.12% 22.39% As at 2014 Compliance by No. Prudential requirement Ratio Group 1. Capital adequacy 8% Liquidity Not lower than 30% Overall open currency position 25%, Maximum open position in 3. per single currency 15% 0.48% foreign currency of the bank s capital 0.28% (USD) 4. Maximum exposure to a single borrower 0.48% 0.28% (USD) Per single borrower not in excess of 25% of the bank s capital 22.03% 22.03% Note 29. Capital adequacy Capital adequacy refers to the sufficiency of the s capital reserves to cover the credit and similar risks arising from the s portfolio of assets and off-balance sheet item exposures. The rules for calculation of capital adequacy include assessment of risks of credit, market, foreign exchange, interest rate, equity securities and other risks. To maintain the required capital adequacy level, the and its subsidiary identify the risks inherent to their operations, assess and control the level of acceptable risks, including the risk levels set out by internal regulations of the and its subsidiary and by legislation prescribed by supervisory authorities. The s objective is to maintain such level of internal capital reserves which, in case of unfavourable events, could ensure compliance with the minimum required capital adequacy ratio of the. In addition to the minimum capital adequacy ratio set by the of Lithuania, the calculates the additional internal capital requirement. The 's capital reserves ensure that the 's capital resources will be sufficient to ensure a stable business continuity if the outcome of scenario of stress testing relating to a significant deterioration of the Lithuanian economy comes true. 52
53 Note 29. Capital adequacy (continued) To identify whether the chosen risk assessment method is conservative enough and ensures the adequate calculation of capital requirement, the regularly assesses the scope that the assumptions and forecasts made in the capital planning stage reflect the actual data. In addition, to ensure that the methodologies used by the reflect the correct actual and planned level of credit risk, calculations and assessments are made under the provisions of reliability of credit risk assessment methodologies. The s management immediately notifies the s Supervisory Council on potential significant decrease in capital base. The banks incorporated in Lithuania are required to comply with the following requirements for own funds: - a Common Equity Tier 1 capital ratio of 4.5%; - a Tier 1 capital ratio of 6%; - a total capital ratio of 8%. Under the provisions of Directive No. 2013/36/EU, gradual transition period applies to capital conservation and countercyclical capital buffers from 1 January 2016 until 2018 or from the initial application of the Directive. The of Lithuania decided not to apply the transitional period and set capital conservation buffer of 2.5% in As at 2015, the countercyclical capital buffer was 0% in Lithuania, 1% in Sweden and Norway. On 28 December 2015, the Supervision Service of the of Lithuania and the Commission of Finance and Capital Markets of Latvia signed a General Decision and set additional capital requirements for. Until the new General Decision is adopted, must comply with the following minimum own funds requirements: 11.0% Common Equity Tier 1 capital ratio and 14.5% total capital ratio. The requirements include the requirement for 2.5% capital conservation buffer. Capital adequacy ratio calculation summary is presented in the table below: Capital adequacy calculation Nominal Weighted Nominal Weighted Tier I capital 43,107 43,107 43,334 43,334 Tier II capital Deductions from capital (1,467) (1,467) (1,179) (1,179) Recalculated capital 41,640 41,640 42,155 42,155 Capital adequacy ratio, % The calculated capital consists of Tier I and Tier II capital. Tier I comprises the authorised share capital, retained earnings (excluding current year profit and including current year loss), reserve capital, legal reserve and negative difference between quarters of revaluation reserves of financial assets and property, plant and equipment. Tier II capital includes subordinated longterm loans, 85% of positive change between quarters of revaluation reserves of financial and non-current assets. Group Capital adequacy calculation Nominal Weighted Nominal Weighted Tier I capital 43,098 43,335 43,335 Tier II capital Deductions from capital (1,473) (1,180) (1,180) Recalculated capital 41,625 42,155 42,155 Capital adequacy ratio, %
54 Note 30. Related-party transactions During the years 2015 and 2014 a number of bank transactions were entered into with related parties in the normal course of business. The related parties of the and the Group are considered Citadele Group companies, related parties to the Parent and key management personnel. The and the Group earn income from foreign currency transactions, servicing of payment cards, operations with securities, and interest income from related parties. The and the Group incur expenses of servicing payment cards, interest and other expenses relating to transactions with related parties. Transactions conducted by the with related parties during 2015 and balances arising from these transactions as at 31 December 2015 were as follows: Amounts due Amounts due to from Income Expenses Citadele a AS (Latvia) AP Anlage und Privatbank, AG 11, Citadele Faktoringas ir Lizingas UAB 78 37,976 1,177 - Transactions conducted by the Group with related parties during 2015 and balances arising from these transactions as at 2015 were as follows: Amounts due Amounts due to from Income Expenses Citadele a AS (Latvia) AP Anlage und Privatbank, AG 11, Transactions conducted by the with related parties during 2014 and balances arising from these transactions as at 31 December 2014 were as follows: Amounts due Amounts due to from Income Expenses Citadele a AS (Latvia) 40,573 54,141 2, AP Anlage und Privatbank, AG Citadele Faktoringas ir Lizingas UAB 1, Transactions conducted by the Group with related parties during 2014 and balances arising from these transactions as at 2014 were as follows: Amounts due Amounts due to from Income Expenses Citadele a AS (Latvia) 40,573 54,141 2,129 1,053 AP Anlage und Privatbank, AG As at 2015, the and the Group had several contracts on financial derivative instruments with Citadele a AS. As at 2015, assets and liabilities arising from the financial derivative instrument contracts amounted to EUR 4 thousand and EUR 2 thousand, respectively. As at 2014, assets and liabilities arising from the financial derivative instrument contracts with Citadele a AS amounted to EUR 39 thousand and EUR 1 thousand, respectively. The s and the Group s settlements with related parties are usually made in cash. The s Management Board consists of the Chairman of the Board and two Board Members, who are also the s management, and each is responsible for a specific division: Finance, Treasury and Risk Management. Remuneration of the s Management Board amounted to EUR 334 thousand and related social security contributions amounted to EUR 103 thousand in 2015 (2014: EUR 410 thousand and EUR 127 thousand, respectively). The s Management Board received loans amounting to EUR 217 thousand in 2015 (EUR 232 thousand in 2014). Deposits placed by the s Management Board amounted to EUR 207 thousand in 2015 (EUR 179 thousand in 2014). The Group s Management Board consists of five members. Remuneration of the Group s management amounted to EUR 401 thousand and related social security contributions amounted to EUR 124 thousand as at 2015 (2014: EUR 449 thousand and EUR 139 thousand, respectively). The Group s management received loans amounting to EUR 217 thousand in 2015 (2014: EUR 232 thousand). Deposits placed by the Group s management amounted to EUR 207 thousand in 2015 (2014: EUR 179 thousand). Loans with related parties are secured with collaterals. Real estate was pledged for the amount of EUR 362 thousand. 54
55 Note 31. Operating lease commitments and contingencies The and the Group have entered into a number of operating lease agreements for premises and other facilities. Lease terms and conditions do not contain any restrictions on the s and the Group s activities concerning dividends, additional loans or additional lease. The future minimum lease payments under operating leases are as follows: Group No later than 1 year Later than 1 year and no later than 5 years Total The s and the Group s operating lease expenses in 2015 amounted to EUR 166 thousand and were included into operating expenses (2014: EUR 166 respectively). The tax authorities may at any time inspect the books and records within 5 years subsequent to the reported tax year, and may impose additional tax assessments and penalties. The s management is not aware of any circumstances which may give rise to a potential material liability in this respect. Note 32. Cash and cash equivalents Group 2014 Cash 4,533 2,567 4,533 2,567 Balances with the central bank (Note 3) 24,357 9,092 24,357 9,092 Balances with banks (Note 4) 4,267 76,668 4,267 76,668 Cash and cash equivalents 33,157 88,327 33,157 88,327 The has no restrictions and can freely dispose cash and cash equivalents except for the compulsory reserves with the central bank and guarantee deposits held with banks relating to settlement risk arising from American Express payment cards and securities, the balance of which amounted to EUR 903 thousand as at 2015 ( 2014: EUR 655 thousand). Note 33. Risk management The s and the Group s risk management takes decisions necessary to mitigate risks and to manage inevitable risks by implementing detective and preventive risk mitigation measures. Risk management covers all products and services. The s and the Group s risk management system comprises as follows: risk identification to determine significant risks; risk assessment to determine the approach for assessing risk degree and exposure limitation measures: system of limits, customer rating methods; risk control to implement risk mitigation measures and monitor whether the s/group s exposure to risk does not exceed the acceptable exposure level; monitoring and communication system to assess on a regular basis the credibility of determination, assessment and monitoring of the s/group s level of exposure and the approach chosen. The /Group have established and apply the following key risk management measures: risk avoidance, risk mitigation and risk forecasting. The /Group apply the following risk avoidance measures: assuming risks only in those fields of activities which are well-known to the /Group and which enable to avoid too high level of risk; avoidance of transactions pertaining to high risk of legal nature or uncertainties relating to liability; following the principles of prudence, carefulness and conservatism in case of any doubts as to the adequacy of risk management. 55
56 Note 33. Risk management (continued) The /Group apply the following risk internal control measures: system of limits and development of other preventive measures (diversification of assumed risks, hedging); risk management in the s/group s structural units with clear segregation of functions and definition of responsibilities; continuous monitoring and control over the level of assumed risks; certification of employees, upgrading professional qualification and training. The /Group apply the following risk forecasting measures: forecasting of assumed risk to determine potential risk occurrence events, ways and scope and measures necessary to mitigate the impact of such risk; performance of stress tests to assess the s/group s sensitivity in case of unexpected events. The s Board is responsible for the development of risk management system, internal control system and preventive risk mitigation measures in the, as well as for the reporting of key risk management details to the s Supervisory Council. Risk management is the responsibility of the Risk Management Committee and line officers who are monitoring risks on the daily basis. In the ordinary course of business, the and Group are exposed to various risks. Those risks include credit risk, market risk (currency risk and interest rate risk), liquidity risk and operational risk. In order to manage these risks, the and the Group have approved the risk management policies which are summarised below. Credit risk Credit risk is the risk that the and the Group will incur losses because of the failure of their customers or counterparties to discharge their contractual obligations. The and the Group manage and control credit risk by setting acceptable risk limits for individual borrowers and for industry sectors, and by monitoring possible non-compliance cases with such limits. The and the Group have established a credit quality review process to provide early identification of possible changes in the creditworthiness of counterparties, including regular collateral revision. The credit quality review process allows the and the Group to assess their potential losses and to take remedial action. The and the Group issue guarantees to their customers, based on which the creditors can demand payment from the and the Group. They expose the and the Group to similar risks as loans and these are mitigated by the same control procedures and policies. Credit risk is the largest risk to which the and the Group are exposed in performing their activities; therefore, this exposure is placed under a particularly close surveillance. The Credit Risk Management Division under the Risk Management Department is responsible for the management of and control over the credit risk. The Credit Risk Management Division regularly reports on the credit risk management related matters to the s Board. In case of standardised small credits, when the credit amount does not exceed the credit amounts established at the for small businesses and the client s performance indicators comply with the standard indicators established at the, a manager, based on the business description and financial statements submitted by the client, fills in the credit issuance form, in which, after having assessed the historical data of financial statements and the company s activities, the client risk level is established. The completed credit issuance form and the established client risk level is submitted to the Credit Committee for final decision. In case of non-standardised credits, the manager, based on the assessment of the client s activities and financial results, prepares an application for corporate loans. Subsequently, the application is reviewed by the Credit Risk Management Division under the Risk Assessment Department, which then prepares an analysis and conclusions, including the approval on the compliance with credit policy. The Credit Committee reviews the loan applications and takes decisions based on the recommendations of the Risk Management Department. Individual transactions are also reviewed by the s Legal Department and the Group s Risk Department depending on the level of risk. The and the Group regularly monitor credit risk exposures and regularly reassess the creditworthiness of their clients. The review is based on the data of the client s latest financial statements and other information submitted by the loan receiver or otherwise obtained by the or the Group. The current market value of collaterals is revalued regularly by independent appraisers or specialists of the and the Group and, in case of unfavourable fluctuations of market prices, the loan receiver is asked to secure the loan by additional collateral. 56
57 Note 33. Risk management (continued) Maximum exposure to credit risk The table below shows the maximum exposure to credit risk arising from the items of the statement of financial position and off-balance sheet items. The maximum exposure is shown gross, before the collateral. Items of the statement of financial position before trading and investing activities Group Balances with the central bank 24,357 9,092 24,357 9,092 Balances with banks 4,267 76,668 4,267 76,668 Loans and receivables from customers 236, , , ,141 Finance lease receivables, net ,798 29,159 Other financial assets Off-balance sheet items Guarantees and letters of credit 4,094 3,307 2,685 1,899 Credit-related commitments 26,022 24,867 25,122 24,867 Total items of the statement of financial position and off-balance sheet items before trading and investing activities 295, , , ,384 Trading and investing activities Available-for-sale financial assets 128, , , ,028 Held-to-maturity investments Total trading and investing activities 128, , , ,028 Gross credit exposure 424, , , ,412 The tables below present bonds by type and rating. and Group Lithuanian Government bonds 43,428 73,742 Bonds issued by foreign governments 21,471 6,703 Bonds of banks 13,658 7,785 Bonds of financial institutions 7,068 9,625 Corporate bonds 42,651 25,157 Total 128, ,012 and Group Bonds exposure by rating: High rating 96,566 24,221 Standard rating 31,710 93,283 Not rated - 5,508 Total 128, ,012 57
58 Note 33. Risk management (continued) For trading and investing activities, the high rating and standard rating categories include bonds with AAA to A ratings and BBB to B ratings, respectively. When assessing asset exposures, the uses the data of the most famous and recognised in international markets credit rating agencies: Moody's, Standard & Poor's, Fitch Ratings. In case an exposure is assigned with two different ratings, the lower rating is assigned. In case an exposure is assigned with more than two different ratings, two assessments are used to establish two highest ratings. In case two highest ratings are different, the lower one is assigned. The table below presents trading and investing activities (excluding equity securities) by geographical area: Bonds by geographical area Government Corporate Government Corporate bonds bonds bonds bonds Ireland - 1, Australia - 5,087-4,520 Brazil - 2,210-2,129 Chile - 2,069-1,942 Denmark 6, Great Britain - 2, Japan USA - 17,895-11,719 Hong Kong India - 1, Canada - 1, Korea - 3, Latvia 7, , Lithuania 43,428-73,742 - Mexico - 1, The Netherlands - 2,194-4,785 Norway - 4,495-4,054 France - 2,889-1,044 Singapore - 1,691-1,548 Finland 1, ,508 Sweden 6, Switzerland - 2,705-2,604 Turkey - 1, Germany - 4, Total 64,899 63,377 80,445 42,567 The and the Group have no impaired or overdue amounts within trading and investing activities. Concentration of maximum exposure to credit risk Concentration of risk is managed by customer, by geographical area and by industry sector. The s maximum exposure to credit risk, before taking into account collateral, arising from 10 major customers amounted to EUR 70,789 thousand as at 2015 ( 2014: EUR 22,803 thousand), and the s credit-related commitments amounted to EUR 7,247 thousand as at 2015 ( 2014: EUR 8,029 thousand). The Group s maximum exposure to credit risk, before taking into account collateral, arising from 10 major customers amounted to EUR 37,067 thousand as at 2015 ( 2014: EUR 26,272 thousand), and the Group s credit-related commitments amounted to EUR 6,347 thousand as at 2015 ( 2014: EUR 8,029 thousand). 58
59 Note 33. Risk management (continued) Exposure by industry sector Large corporate entities are defined as entities employing more than 250 employees. Small and medium-sized enterprises are defined as entities employing less than 250 employees with the carrying amount of assets not exceeding EUR 27 million or annual turnover not exceeding EUR 40 million. The s and the Group s loans and receivables by industry sector (including finance lease receivables and credit commitments), before taking into account collateral held, are as follows: 2015 Financial institutions Public sector Loans to corporate entities Large corporate customers Small and mediumsized enterprises Loans to private individuals Mortgages Other loans Guarantees and letters of credit issued Total Mortgages to private individuals , ,842 Retail and wholesale trade - - 1,151 19, ,831 Real estate, rent and other - - 1,301 13, ,987 Financial intermediation 39, ,608 41,143 Construction , ,863 Transport, storage and telecommunications , ,950 Agriculture, hunting and forestry , ,295 Processing industry ,849 11, ,706 Other utility, social and service activities , ,595 Hotels and restaurants , ,923 Electricity, gas and water supply - 1,276-1, ,754 Other loans to private individuals , ,446 Other loans to corporate entities - 4,407 4,255 7, ,595 Total loans and receivables, net of impairment* 39,535 5,683 23,556 84,775 77,842 31,445 4, ,930 * Loans EUR 236,814 thousand (Note 8), guarantees EUR 4,094 thousand (Note 33), credit-related commitments EUR 26,022 thousand (Note 33). 59
60 Note 33. Risk management (continued) 2014 Financial institutions Public sector Loans to corporate entities Large corporate customers Small and mediumsized enterprises Loans to private individuals Mortgages Other loans Guarantees and letters of credit issued Total Mortgages to private individuals , ,244 Retail and wholesale trade - - 4,898 18, ,427 Real estate, rent and other - - 1,474 8, ,351 Financial intermediation ,411 1,945 Construction , ,632 Transport, storage and telecommunications , ,581 Agriculture, hunting and forestry , ,400 Processing industry ,614 8, ,525 Other utility, social and service activities , ,081 Hotels and restaurants , ,380 Electricity, gas and water supply , ,551 Other loans to private individuals , ,576 Other loans to corporate entities ,475 4, ,622 Total loans and receivables, net of impairment* 534 1,613 25,487 63,555 83,244 30,575 3, ,315 * Loans EUR 180,141 thousand (Note 8), guarantees EUR 3,307 thousand (Note 33), credit-related commitments EUR 24,867 thousand (Note 33). 60
61 Note 33. Risk management (continued) Group 2015 Financial institutions Loans to private individuals Other loans Finance lease Loans to corporate entities Large Small and corpo- mediumrate sized Public custo- enterprises sector mers Mortgages Corporate entities Private individuals Guarantees and letters of credit issued Total Mortgages to private individuals , ,842 Retail and wholesale trade - - 1,151 19, , ,122 Real estate, rent - - 1,301 13, , ,388 Financial intermediation ,080 Construction , , ,301 Transport, storage and telecommunications , , ,911 Agriculture, hunting and forestry , , ,352 Processing industry ,849 11, ,312 Other utility, social and service activities , ,595 Hotels and restaurants , ,155 Electricity, gas and water supply - 1,276-1, ,754 Other loans to private individuals ,445-2, ,033 Other loans to corporate entities - 4,407 4,255 7, , ,598 Total loans and receivables, net of impairment* 659 5,683 23,556 84,775 77,842 31,445 35,211 2,587 2, ,443 * Loans EUR 198,838 thousand (Note 8), guarantees EUR 2,685 thousand (Note 33), credit-related commitments EUR 25,122 thousand (Note 33), finance lease receivables EUR 37,798 thousand (Note 7). 61
62 Note 33. Risk management (continued) Group 2014 Financial institutions Loans to private individuals Other loans Finance lease Loans to corporate entities Large Small and corpo- mediumrate sized Public custo- enterprises sector mers Mortgages Corporate entities Private individuals Guarantees and letters of credit issued Total Mortgages to private individuals , ,244 Retail and wholesale trade - - 4,898 18, , ,128 Real estate, rent and other - - 1,474 8, , ,469 Financial intermediation Construction , , ,922 Transport, storage and telecommunications , , ,544 Agriculture, hunting and forestry , ,249 Processing industry ,614 8, , ,612 Other utility, social and service activities , ,081 Hotels and restaurants , ,639 Electricity, gas and water supply , ,551 Other loans to private individuals ,574-2, ,707 Other loans to corporate entities ,476 4, , ,170 Total loans and receivables, net of impairment* 534 1,614 25,487 63,555 83,244 30,574 27,027 2,132 1, ,066 * Loans EUR 180,141 thousand (Note 8), guarantees EUR 1,899 thousand (Note 33), credit-related commitments EUR 24,867 thousand (Note 33), finance lease receivables EUR 29,159 thousand (Note 7). Exposure by geographical area 2015 Financial institutions Public sector Loans to corporate entities Large corporate customers Small and mediumsized enterprises Mortgages Loans to private individuals Guarantees and letters of credit issued Other loans Total Lithuania 38,946 5,683 20,426 84,775 77,842 31,239 3, ,483 Germany - - 3, ,130 Latvia Russia USA Great Britain ,074 Other Total* 39,535 5,683 23,556 84,775 77,842 31,445 4, ,930 * Loans EUR 236,814 thousand (Note 8), guarantees EUR 4,094 thousand (Note 33), credit-related commitments EUR 26,022 thousand (Note 33). 62
63 Note 33. Risk management (continued) 2014 Financial institutions Public sector Loans to corporate entities Large corporate customers Small and mediumsized enterprises Mortgages Loans to private individuals Other loans Guarantees and letters of credit issued Lithuania 5 1,613 22,568 63,555 83,154 30,310 2, ,031 Germany - - 2, ,919 Latvia Russia USA Great Britain ,014 Other Total Total* 534 1,613 25,487 63,555 83,244 30,575 3, ,315 * Loans EUR 180,141 thousand (Note 8), guarantees EUR 3,307 thousand (Note 33), credit-related commitments EUR 24,867 thousand (Note 33). Group 2015 Financial institutions Loans to private individuals Finance lease Guarantees Other loans Loans to corporate entities Large Small and corpo- mediumrate sized Public custo- enterprises sector mers Mortgages Corporate entities Private individuals and letters of credit issued Lithuania 70 5,683 20,426 84,775 77,842 31,239 35,211 2,587 2, ,996 Germany - - 3, ,130 Latvia Russia USA Great Britain ,074 Other Total* 659 5,683 23,556 84,775 77,842 31,445 35,211 2,587 2, ,443 * Loans EUR 198,838 thousand (Note 8), guarantees EUR 2,685 thousand (Note 33), credit-related commitments EUR 25,122 thousand (Note 33), finance lease receivables EUR 37,798 thousand (Note 7). Total Group 2014 Financial institutions Loans to private individuals Finance lease Guarantees Other loans Loans to corporate entities Large Small and corpo- mediumrate sized Public custo- enterprises sector mers Mortgages Corporate entities Private individuals and letters of credit issued Lithuania 5 1,614 22,568 63,555 83,154 30,309 27,020 2,132 1, ,775 Germany - - 2, ,919 Latvia Russia USA Great Britain ,014 Other Total* 534 1,614 25,487 63,555 83,244 30,574 27,027 2,132 1, ,066 * Loans EUR 180,141 thousand (Note 8), guarantees EUR 1,899 thousand (Note 33), credit-related commitments EUR 24,867 thousand (Note 33), finance lease receivables EUR 29,159 thousand (Note 7). Total 63
64 Note 33. Risk management (continued) Collateral and other credit enhancements The amount and type of collateral required depends on an assessment of the credit risk of the counterparty. In addition, guidelines are implemented regarding the acceptability of types of collateral and valuation parameters. The ability to repay a loan is the primary criterion in loan evaluation, though the and the Group always demand collateral. Acceptable collateral is classified into real estate, movable properties, guarantees, insurance, financial assets and other. While estimating the present value of a loan, assets accepted as collateral are estimated at their fair value, taking into account the costs for repossessing and selling the collateral. When valuation of real estate is reviewed, the and the Group also take into account its liquidity, useful life and time to sell. Loans and issued guarantees by main types of collateral are as follows (amounts before impairment and not including credit commitments): 2015 Financial institutions Loans to corporate entities Large corporate customers Public sector Loans to private individuals Small and mediumsized enterprises Mortgages Other loans Guarantees and letters of credit issued Total Commercial and other real estate 49 1,234 5,648 49,653 8,406 5,629 1,392 72,011 Residential buildings ,966 71,592 3, ,670 Guarantees , ,045 Machinery ,638 8, ,851 Deposits ,275 1,434 Other pledged assets ,992 11, ,068 Total secured loans 49 1,703 19,278 76,473 80,109 9,782 2, ,079 Unsecured loans 38,586 4,013-3, ,623 1,409 57,995 Total* 38,635 5,716 19,278 79,602 80,344 20,405 4, ,074 * Loans before impairment EUR 243,980 thousand (Note 8), guarantees EUR 4,094 thousand (Note 33) Financial institutions Loans to corporate entities Large corporate customers Public sector Loans to private individuals Small and mediumsized enterprises Mortgages Other loans Guarantees and letters of credit issued Total Commercial and other real estate ,344 33,102 9,240 6,571 1,055 57,023 Residential buildings ,270 76,396 4, ,699 Guarantees , ,081 Machinery - - 9,521 9, ,218 Deposits ,468 Other pledged assets ,154 10, ,721 Total secured loans 534 1,319 18,019 59,674 85,764 12,001 1, ,210 Unsecured loans , ,358 1,408 15,030 Total* 534 1,586 18,019 62,414 86,021 22,359 3, ,240 * Loans before impairment EUR 190,933 thousand (Note 8), guarantees EUR 3,307 thousand (Note 33). 64
65 Note 33. Risk management (continued) Group 2015 Loans to corporate entities Public sector Large corporate customers Loans to private individuals Other loans Financial institutions Guarantees and letters of credit issued Finance lease Small and mediumsized enterprises Mortgages Corporate entities Private individuals Total Commercial and other real estate 49 1,234 5,648 49,653 8,406 5,629 1, ,009 Residential buildings ,966 71,592 3, ,670 Guarantees , ,045 Machinery ,638 8, ,097-22,948 Deposits , ,434 Other pledged assets ,992 11, ,772 2,614 50,454 Total secured loans 49 1,703 19,278 76,473 80,109 9,782 2,685 37,867 2, ,560 Unsecured loans 610 4,013-3, , ,610 Total* 659 5,716 19,278 79,602 80,344 20,405 2,685 37,867 2, ,170 * Loans before impairment EUR 206,004 thousand (Note 8), guarantees EUR 2,685 thousand (Note 33), finance lease receivables before impairment EUR 40,481 thousand (Note 7). Group 2014 Loans to corporate entities Public sector Large corporate customers Loans to private individuals Other loans Financial institutions Guarantees and letters of credit issued Finance lease Small and mediumsized enterprises Mortgages Corporate entities Private individuals Total Commercial and other real estate ,344 33,102 9,240 6,570 1,055 1,065-58,087 Residential buildings ,270 76,396 4, ,699 Guarantees , ,081 Machinery - - 9,521 9, ,218 Deposits ,469 Other pledged assets ,154 10, ,912 2,136 44,769 Total secured loans 534 1,319 18,019 59,674 85,764 12,001 1,899 29,977 2, ,323 Unsecured loans , , ,622 Total* 534 1,586 18,019 62,414 86,021 22,359 1,899 29,977 2, ,945 * Loans before impairment EUR 190,933 thousand (Note 8), guarantees EUR 1,899 thousand (Note 33), finance lease receivables before impairment EUR 32,113 thousand (Note 7). Credit quality by the category of financial assets The credit quality of financial assets is managed by the and Group using an internal credit rating system. 65
66 Note 33. Risk management (continued) Rating of loans During evaluation of loans, the and the Group apply specific valuation criteria and procedures to borrowers. The main criterion for evaluation is the analysis of the borrower s financial position. The financial position of the borrower is analysed based on constantly updated financial reports, also taking into account variations in certain financial ratios, which affect the borrower s operations. Ratings are assigned to the customers based on a set of defined rating criteria. Lower risk is assigned to reliable transactions, i.e. the customer s operations are stable, the customer complies with the terms and conditions of loan agreements, adequate liquidity of collateral, and the customer s financial position is stable. Higher risk is assigned to transactions with identified default risk, customers with minor breaches of contractual provisions, the customer s financial position and liquidity are unstable/doubtful. The credit quality of loans and receivables and finance lease receivables is analysed below (amounts before impairment and not including credit commitments) Neither past due nor impaired Past due or individually Low risk Higher risk impaired TOTAL Loans to financial institutions 38, ,635 Loans to corporate entities: Public sector 5, ,716 Large corporate customers 19, ,278 Small and medium-sized enterprises 61,691 6,144 11,767 79,602 Loans to private individuals: Mortgages 62,681 7,717 9,946 80,344 Other loans 14,624 1,691 4,090 20,405 TOTAL 202,517 15,552 25, , Neither past due nor impaired Past due or individually Low risk Higher risk impaired TOTAL Loans to financial institutions Loans to corporate entities: Public sector 1, ,586 Large corporate customers 18, ,019 Small and medium-sized enterprises 46,337 7,083 8,994 62,414 Loans to private individuals: Mortgages 67,056 7,767 11,198 86,021 Other loans 12,045 2,281 8,033 22,359 TOTAL 145,577 17,131 28, ,933 Group 2015 Neither past due nor impaired Past due or individually Low risk Higher risk impaired TOTAL Loans to financial institutions Loans to corporate entities: Public sector 5, ,716 Large corporate customers 19, ,278 Small and medium-sized enterprises 61,691 6,144 11,767 79,602 Loans to private individuals: Mortgages 62,681 7,717 9,946 80,344 Other loans 14,624 1,691 4,090 20,405 Finance lease portfolio: Corporate entities 24,881 2,547 10,440 37,868 Private individuals 2, ,613 TOTAL 191,734 18,155 36, ,485 66
67 Note 33. Risk management (continued) Group 2014 Neither past due nor impaired Low risk Higher risk Past due or individually impaired TOTAL Loans to financial institutions Loans to corporate entities: Public sector 1, ,586 Large corporate customers 18, ,019 Small and medium-sized enterprises 46,337 7,083 8,994 62,414 Loans to private individuals: Mortgages 67,056 7,767 11,198 86,021 Other loans 12,045 2,281 8,033 22,359 Finance lease portfolio: Corporate entities 16,945 3,881 9,153 29,979 Private individuals 1, ,135 TOTAL 164,450 21,012 37, ,047 Ageing analysis of past due but not impaired loans by category of financial assets: 2015 Less than 30 days 31 to 60 days 61 to 90 days More than 91 days Total Fair value of collateral Category of assets Loans to financial institutions Loans to corporate entities: Public sector Large corporate customers Small and medium-sized enterprises 4, ,322 6,312 5,963 Loans to individuals: Mortgages 3,014 1, ,153 6,128 Other loans 1, , TOTAL 8,198 2,277 1,138 2,719 14,332 12, Less than 30 days 31 to 60 days 61 to 90 days More than 91 days Total Fair value of collateral Category of assets Loans to financial institutions Loans to corporate entities: Public sector Large corporate customers Small and medium-sized enterprises 2, ,744 3,715 Loans to individuals: Mortgages 3,376 1,096 1, ,057 5,948 Other loans 1, ,237 1,160 TOTAL 7,324 2,329 1,268 1,117 12,038 10,823 67
68 Note 33. Risk management (continued) Group 2015 Less than 30 days 31 to 60 days 61 to 90 days More than 91 days Total Fair value of collateral Category of assets Loans to financial institutions Loans to corporate entities: Public sector Large corporate customers Small and medium-sized enterprises 4, ,322 6,312 5,963 Loans to individuals: Mortgages 3,014 1, ,153 6,128 Other loans 1, , Finance lease portfolio: Corporate entities 3, ,210 5,153 Private individuals 1, , TOTAL 12,998 3,395 1,686 3,330 21,409 18,970 Group 2014 Less than 30 days 31 to 60 days 61 to 90 days More than 91 days Total Fair value of collateral Category of assets Loans to financial institutions Loans to corporate entities: Public sector Large corporate customers Small and medium-sized enterprises 2, ,744 3,715 Loans to individuals: Mortgages 3,376 1,096 1, ,057 5,948 Other loans 1, ,237 1,160 Finance lease portfolio: Corporate entities 2, ,438 2,877 Private individuals TOTAL 10,044 2,981 1,536 1,122 15,683 13,974 These past due but not impaired loans are those for which contractual interest or principal payments are past due but the and the Group believes that impairment is not appropriate on the basis of the level of security or collateral available and/or the stage of collection of amounts owed to the or the Group. The and the Group did not have past due or impaired balances due from banks as at 2015 and Impaired loans and receivables by category of assets: 2015 Gross value of loans impaired Impairment Fair value of collateral Loans to financial institutions Loans to corporate entities: Public sector Large corporate customers Small and medium-sized enterprises 5,455 2,568 5,023 Loans to individuals: Mortgages 3,793 1,740 3,106 Other loans 2,221 1,311 1,372 TOTAL 11,469 5,619 9,501 68
69 Note 33. Risk management (continued) 2014 Gross value of loans impaired Impairment Fair value of collateral Loans to financial institutions Loans to corporate entities: Public sector Large corporate customers Small and medium-sized enterprises 5,251 3,029 4,229 Loans to individuals: Mortgages 5,142 1,889 4,135 Other loans 5,796 4,381 1,978 TOTAL 16,189 9,299 10,342 Group 2015 Gross value of loans impaired Impairment Fair value of collateral Loans to financial institutions Loans to corporate entities: Public sector Large corporate customers Small and medium-sized enterprises 5,455 2,568 5,023 Loans to individuals: Mortgages 3,793 1,740 3,106 Other loans 2,221 1,311 1,372 Finance lease portfolio: Corporate entities 5,229 2,675 2,554 Private individuals TOTAL 16,717 8,302 12,066 Group 2014 Gross value of loans impaired Impairment Fair value of collateral Loans to financial institutions Loans to corporate entities: Public sector Large corporate customers Small and medium-sized enterprises 5,251 3,029 4,229 Loans to individuals: Mortgages 5,142 1,889 4,135 Other loans 5,796 4,381 1,978 Finance lease portfolio: Corporate entities 5,714 2,678 3,036 Private individuals TOTAL 21,903 11,977 13,378 Interest income on impaired loans in 2015 amounted to EUR 504 thousand (2014: EUR 352 thousand). Were the net present value of estimated cash flows from loans and receivables to differ by -/+5%, the impairment loss of the is estimated to be EUR 513 thousand higher or EUR 327 thousand lower as at 2015 ( 2014: EUR 745 thousand higher or EUR 555 thousand lower, respectively) and of the Group EUR 551 thousand higher or EUR 358 lower as at 2015, respectively ( 2014: EUR 767 thousand higher or EUR 533 thousand lower as at 2014). Were the expected realisation term of collateral to differ by -/+ 1 year, the amount of impairment losses for the s individually assessed loans is estimated to be EUR 162 thousand lower or EUR 198 thousand higher as at 2015, respectively, and of the Group EUR 173 thousand lower or EUR 213 thousand higher, respectively. 69
70 Note 33. Risk management (continued) Liquidity risk The rules for management and control of the s and the Group s liquidity risk are contained in the s and the Group s liquidity risk management policy, which defines the main requirements for the control of the s and the Group s liquidity risk. Liquidity risk is the risk that the or the Group will not have sufficient funds to meet commitments at any given point in time. The s and the Group s liquidity management is based on the current and anticipated structure of the statement of financial position. The s and the Group s liquidity forecasts are made in line with annual budgeting and estimation of total required liquidity and its profile. The 's and the Group s policy is to maintain an adequate level of liquidity required to cover all obligations that may arise in the event of unexpected circumstances in the market in which the and the Group operate. Other tasks of liquidity management are as follows: to comply with the required liquidity ratio; to optimise the risk/return ratio adequate liquidity as compared to required funds, to respond to significant changes in operating environment in an appropriate and timely manner. According to the requirements of the of Lithuania, as at 2014 the and the Group have to comply with the required liquidity ratio (liquid assets divided by current liabilities) at the level of not less than 30%. Starting from 2015, liquidity coverage ratio is applied, which shall not be lower than 100%. Liquidity ratio is monitored through Asset/Liability structure by maturity gaps reports. Liquidity management Liquidity management includes: Daily supply of funds by monitoring future cash flows in order to ensure that the level of required funds is fully met. This involves replenishment of funds after they are paid out upon maturity. To this end, the is actively involved in various tenders during which banks are selected for project financing using funds of the State budget and various funds of the EU. Management of marketable asset portfolio which can be easily sold with the aim of safeguarding against an unexpected interruption in cash flow. The makes investments in debt securities issued by the Lithuanian Government. Monitoring of the s and the consolidated liquidity coverage ratios. Monitoring and reporting procedures involve the assessment of monthly cash flows and liquid assets. Monitoring results are presented to the supervisory authority the of Lithuania on a monthly basis Management of debt maturity dates and concentration. The Treasury Department continuously monitors different maturity profiles of funds, unfulfilled credit-related commitments and overdrafts. Liquidity coverage ratio Group Liquid assets 123, , , ,657 Outflows 80, ,336 80, ,047 Inflows 5,429 69,210 5,908 69,682 Liquidity coverage ratio, % % % % % 70
71 Note 33. Risk management (continued) The tables below present liquidity reports (analysis of undiscounted financial liabilities by contractual due date follows the liquidity reports). Liquidity gap () 2015 On demand Up to 3 months 3 to 12 months 1 to 5 years Over 5 years Undefined maturity Total Assets Cash 4, ,533 Balances with the central bank 24, ,357 Balances with banks 3, ,267 Financial assets at fair value through profit or loss Available-for-sale financial assets - 4,354 15, ,506 3, ,292 Investments in subsidiary * ,566 1,566 Loans and receivables - 47,418 29,227 81,801 73,274 5, ,814 Other assets * ,062 6,018 Total assets 32,254 52,842 44, ,307 76,303 12, ,855 Liabilities Financial liabilities at fair value through profit or loss Due to banks 13,460 1, ,982 Due to customers 185,020 41,848 76,251 19,724 2, ,700 Equity * ,174 47,174 Other liabilities * 1,323 1, ,298-1,890 17,993 Total liabilities and equity 199,803 44,412 76,697 33,022 2,857 49, ,855 Net assets (liabilities) (167,549) 8,430 (32,083) 154,285 73,446 (36,529) - Credit-related commitments (26,022) (26,022) Net assets (liabilities) including credit-related commitments (193,571) 8,430 (32,083) 154,285 73,446 (36,529) (26,022) Gap as a percentage of total assets, % (47.69) 2.08 (7.91) (9.00) (6.41) Total current assets ** 161,664 Total current liabilities ** 325,230 Liquidity ratio, % * Also includes non-financial instruments ** Current assets comprise liquid assets on demand and with maturity of less than 1 month and all debt securities. Current liabilities comprise liabilities on demand and with maturity of less than 1 month and the total amount of term deposits of private individuals. In terms of assuring liquidity, the possibility to ensure the fulfilment of the current liabilities to clients based on the cash flows tendencies and a liquidity ratio of not less than L>30% each day are considered when estimating the demand for current assets. 71
72 Note 33. Risk management (continued) Liquidity gap () 2014 On demand Up to 3 months 3 to 12 months 1 to 5 years Over 5 years Undefined maturity Total Assets Cash 2, ,567 Balances with the central bank 7,986 1, ,092 Balances with banks 26,653 49, ,668 Financial assets at fair value through profit or loss Available-for-sale financial assets - - 2,936 89,128 21,710 5, ,298 Investments in subsidiary * ,211 1,211 Available-for-sale financial assets pledged as collateral - 3, ,730 Loans and receivables - 8,768 30,359 61,730 76,457 2, ,141 Other assets * ,516 6,132 Total assets 37,206 63,728 33, ,858 98,167 15, ,889 Liabilities Financial liabilities at fair value through profit or loss Due to banks 40,677 2, ,689 Due to customers 180,423 42,174 59,074 9,868 2, ,636 Equity * ,322 45,322 Other liabilities * 1,182 1, ,908 1,950 17,239 Total liabilities and equity 222,282 46,138 59,074 10,118 13,952 47, ,889 Net assets (liabilities) (185,076) 17,590 (25,770) 140,740 84,215 (31,699) - Credit-related commitments (24,867) (24,867) Net assets (liabilities) including credit-related commitments (209,943) 17,590 (25,770) 140,740 84,215 (31,699) (24,867) Gap as a percentage of total assets, % (52.63) 4.41 (6.46) (7.95) (6.23) Total current assets 199,671 Total current liabilities 326,530 Liquidity ratio, % * Also includes non-financial instruments 72
73 Note 33. Risk management (continued) Liquidity gap (Group) 2015 On demand Up to 3 months 3 to 12 months 1 to 5 years Over 5 years Undefined maturity Total Assets Cash 4, ,533 Balances with the central bank 24, ,357 Balances with banks 3, ,267 Financial assets at fair value through profit or loss Available-for-sale financial assets - 4,354 15, ,506 3, ,292 Held-to-maturity investments Debt securities pledged as collateral Loans and receivables (including finance lease receivables) - 13,556 39, ,532 73,279 5, ,636 Other assets * - 1, ,259 6,527 Total assets 32,254 19,056 55, ,038 76,308 11, ,620 Liabilities Financial liabilities at fair value through profit or loss Due to banks 13,460 1, ,982 Due to customers 184,988 41,848 76,251 19,724 2, ,668 Equity * ,174 47,174 Other liabilities * 1,323 1, , ,790 Total liabilities and equity 199,771 44,606 76,709 33,022 2,857 47, ,620 Net assets (liabilities) (167,517) (25,550) (21,208) 177,016 73,451 (36,192) - Credit-related commitments (25,122) (25,122) Net assets (liabilities) including credit-related commitments (192,639) (25,550) (21,208) 177,016 73,451 (36,192) (25,122) Gap as a percentage of total assets, % (47.61) (6.32) (5.24) (8.94) (6.21) Group Total current assets 162,227 Total current liabilities 324,492 Liquidity ratio, % * Also includes non-financial instruments 73
74 Note 33. Risk management (continued) Liquidity gap (Group) 2014 On demand Up to 3 months 3 to 12 months 1 to 5 years Over 5 years Undefined maturity Total Assets Cash 2, ,567 Balances with the central bank 7,986 1, ,092 Balances with banks 26,653 49, ,668 Financial assets at fair value through profit or loss Available-for-sale financial assets - - 2,936 89,128 21,710 5, ,299 Held-to-maturity investments Debt securities pledged as collateral - 3, ,730 Loans and receivables (including finance lease receivables) ,389 36,926 81,379 76,457 2, ,300 Other assets * ,998 6,614 Total assets 37,528 66,349 39, ,507 98,167 14, ,320 Liabilities Financial liabilities at fair value through profit or loss Due to banks 40,677 2,012 29, ,658 Due to customers 180,164 42,174 59,074 9,868 2, ,377 Equity * ,314 45,314 Other liabilities * 1,183 1, , ,968 Total liabilities and equity 222,024 46,134 89,184 10,118 13,952 45, ,320 Net assets (liabilities) (184,496) 20,215 (49,313) 160,389 84,215 (31,012) - Credit-related commitments (24,867) (24,867) Net assets (liabilities) including credit-related commitments (209,363) 20,215 (49,313) 160,389 84,215 (31,012) (24,867) Gap as a percentage of total assets, % (48.99) 4.73 (11.54) (7.26) (5.82) Group Total current assets 200,190 Total current liabilities 326,267 Liquidity ratio, % * Also includes non-financial instruments 74
75 Note 33. Risk management (continued) The table below presents the s and the Group s undiscounted financial liabilities by contractual due date. Financial liabilities () 2015 On demand Up to 3 months 3 to 12 months 1 to 5 years Over 5 years Total Carrying amount Payables under contracts for financial derivatives Due to banks and other credit institutions 13,460 1, ,987 14,982 Due to customers 185,020 42,127 77,070 20,446 8, , ,700 Other loans - 1,894 5,048 6,698-13,640 13,405 Other financial liabilities 2, ,736 2,736 Credit-related commitments 26, ,022 - Guarantees and warranties issued 4, ,094 - Total undiscounted financial liabilities 231,332 45,038 82,634 27,144 8, , ,829 Financial liabilities () 2014 On demand Up to 3 months 3 to 12 months 1 to 5 years Over 5 years Total Carrying amount Payables under contracts for financial derivatives Due to banks and other credit institutions 40,677 2, ,689 42,689 Due to customers 178,855 44,152 59,818 10,399 7, , ,636 Other loans - 1,463 4,108 6, ,754 12,235 Other financial liabilities 2,240 1, ,460 3,460 Credit-related commitments 24, ,867 - Guarantees and warranties issued 3, ,307 - Total undiscounted financial liabilities 249,946 48,850 63,926 17,073 8, , ,023 Financial liabilities (Group) 2015 On demand Up to 3 months 3 to 12 months 1 to 5 years Over 5 years Total Carrying amount Payables under contracts for financial derivatives Due to banks and other credit institutions 13,460 1, ,987 14,982 Due to customers 184,988 42,127 77,070 20,446 8, , ,668 Other loans - 1,894 5,048 6,698-13,640 13,405 Other financial liabilities 1, ,287 1,287 Credit-related commitments 25, ,122 - Guarantees and warranties issued 2, ,685 - Total undiscounted financial liabilities 227,542 45,038 82,634 27,144 8, , ,348 75
76 Note 33. Risk management (continued) Financial liabilities (Group) 2014 On demand Up to 3 months 3 to 12 months 1 to 5 years Over 5 years Total Carrying amount Payables under contracts for financial derivatives Due to banks and other credit institutions 40,676 32, ,812 72,658 Due to customers 178,597 44,152 59,818 10,399 7, , ,377 Other loans - 1,463 4,107 6, ,753 12,235 Other financial liabilities 831 1, ,051 2,051 Credit-related commitments 24, ,867 - Guarantees and warranties issued 3, ,307 - Total undiscounted financial liabilities 248,278 78,974 63,925 17,073 8, , ,324 Currency risk Foreign exchange risk is the risk that the relevant exchange rates might move against the s and the Group's net open position in foreign currencies emerging either because of foreign exchange trading positions and/or because of the exposures caused by its overall assets and liabilities. The and the Group maintain a minimal (reasonable) level of foreign exchange positions necessary to offer services to customers. The and the Group seek to minimise foreign exchange risk arising on lending and other funding operations by matching the asset and liability side by currencies in such a way that it always complies with the established risk ratios. The and the Group manage foreign exchange position risk by establishing maximum exposure limits as a percentage of the capital. The table below includes information on the s and the Group s open foreign currency positions (non-financial instruments are included for information purposes only): Statement of financial position Off-balance sheet items Equity and 2015 Assets liabilities Claims Liabilities Open position Position as % of capital EUR 306, ,412 13, (247) (0.59) USD 97,691 83, , GBP CHF (3) (0.01) RUB (4) (0.01) Other Total 405, ,855 15,815 15, Total long positions Total short positions (254) (0.61) On 1 January 2015, the Republic of Lithuania joined the eurozone and the Lithuanian national currency litas was replaced by the euro. 76
77 Note 33. Risk management (continued) Statement of financial position Off-balance sheet items Equity and 2014 Assets liabilities Claims Liabilities Open position Position as % of capital LTL 182, , (265) (0.63) EUR 142, , , USD 72,900 74,740 2, GBP RUB 530 1, LVL (4) (0.01) Other Total 398, ,889 5,367 5, Total long positions Total short positions (268) (0.64) LTL is pegged to EUR at a fixed rate, i.e. LTL for EUR 1. Group Statement of financial position Off-balance sheet items Equity and 2015 Assets liabilities Claims Liabilities Open position Position as % of capital EUR 305, ,177 13, (247) (0.59) USD 97,691 83, , GBP CHF (3) (0.01) RUB (4) (0.01) Other Total 404, ,620 15,815 15, Total long positions Total short positions (254) (0.61) Group Statement of financial position Off-balance sheet items Equity and 2014 Assets liabilities Claims Liabilities Open position Position as % of capital LTL 181, , (812) (1.93) EUR 171, , , USD 72,900 74,740 2, GBP RUB 530 1, LVL (4) (0.01) Other Total 427, ,320 5,366 5, Total long positions Total short positions (815) (1.94) 77
78 Note 33. Risk management (continued) Sensitivity to foreign exchange risk Foreign exchange (FX) risk is limited by amounts of open FX positions. For calculation of sensitivity to FX risk all exposures shall be converted into possible loss i.e. open FX position is multiplied by possible change in FX rate. Possible change is a possible change in FX rate as a percentage of current market price. In the management s opinion, all the presented currencies should strengthen against the euro. and Group Currency Impact on profit Possible change Impact on profit Possible change % (loss) and equity % (loss) and equity GBP RUB 50.0 (2) 25.0 (1) SEK USD CHF (11.0) - JPY NOK Other (13) Total 19 4 Interest rate risk Interest rate risk arises from the potential adverse effect arising from fluctuations of interest rates on the s and the Group s income and economic value. Interest rate risk is assessed and decisions are made by the Risk Management Committee. Subsequently the decisions are approved by the s Management Board. Risk is managed by competent structural units in accordance with the Group s internal procedures. The Risk Management Committee sets the acceptable level of interest rate risk, defines internal limits for the and the Group, monitors compliance with the required limits, and supervises how risk management measures are used. The fundamental component of interest rate risk management is a clear, accurate, and timely risk assessment. To assess interest rate risk on cash flows and interest-bearing financial instruments, scenario analyses are applied. Interest rate risk arises from the possibility that changes in interest rates will affect future cash flows or the fair values of financial instruments. The Board has established limits on the interest rate gaps for defined maturities. Positions are monitored on a monthly basis. Interest rate risk is managed by forecasting the market interest rates and managing the mismatches between assets and liabilities by re-pricing maturities. The and the Group apply the interest rate risk management methods allowing to measure the s and the Group s sensitivity to interest rate changes by computing the impact to annual net interest income (which equals the impact on profit before tax) in case of parallel shift by 1% in the interest rates. 78
79 Note 33. Risk management (continued) The tables below include the s and Group s interest rate gap reports as at 2015 and 2014 (assets and liabilities by the time remaining until revaluation). Financial assets and financial liabilities bearing variable interest rates are split by their terms based on the payment schedules until the date of interest rate change, on which the total outstanding part of the financial instrument is treated as revalued. Financial assets and financial liabilities bearing fixed interest rates are attributed to certain periods based on the final payment terms or are split based on payment schedules. As at 2015 Less than 1 month 1 to 3 months 3 to 6 months 6 months to 1 year 1 to 3 years More than 3 years Noninterestbearing Assets: Cash and balances with banks 3, ,400 33,157 Investments in equity securities and derivatives Investments in available-forsale debt securities - 4,355 8,560 6,825 73,390 35, ,276 Investments in subsidiary * ,566 1,566 Loans and receivables (including finance lease receivables) 43,663 87,318 85,267 2,708 11,110 1,656 5, ,814 Other assets * ,018 6,018 Total 47,420 91,673 93,827 9,533 84,500 36,802 42, ,855 Liabilities: Due to banks 11, ,713 14,982 Due to customers 19,746 21,838 28,820 46,895 18,101 4, , ,700 Other liabilities and equity * 13, ,722 65,173 Total 44,928 22,038 28,820 47,233 18,101 4, , ,855 Total interest sensitivity gap 2,492 69,635 65,007 (37,700) 66,399 32,733 (198,566) - * Also includes non-financial instruments As at 2015, the s assets bearing fixed interest amounted to EUR 144,590 thousand, liabilities EUR 151,738 thousand. Total 79
80 Note 33. Risk management (continued) As at 2014 Less than 1 month 1 to 3 months 3 to 6 months 6 months to 1 year 1 to 3 years More than 3 years Noninterestbearing Assets: Cash and balances with banks 59, ,221 88,327 Investments in equity securities and derivatives Investments in available-forsale debt securities 11 3,719-2,936 57,284 53,555 5, ,012 Investments in subsidiary * ,211 1,211 Loans and receivables (including finance lease receivables) 40,381 50,711 75,304 2,826 7, , ,141 Other assets * ,132 6,132 Total 99,498 54,430 75,304 5,762 64,481 54,455 44, ,889 Liabilities: Due to banks ,689 42,689 Due to customers 19,046 23,090 26,805 32,175 9,267 2, , ,636 Other liabilities and equity * ,158 50,398 62,564 Total 19,054 23,090 26,805 32,175 9,267 14, , ,889 Total interest sensitivity gap 80,444 31,340 48,499 (26,413) 55,214 39,672 (228,756) - Total * Also includes non-financial instruments As at 2014, the s assets bearing fixed interest amounted to EUR 182,893 thousand, liabilities EUR 113,008 thousand. 80
81 Note 33. Risk management (continued) Group As at 2015 Less than 1 month 1 to 3 months 3 to 6 months 6 months to 1 year 1 to 3 years More than 3 years Noninterestbearing Total Assets: Cash and balances with banks 3, ,400 33,157 Investments in equity securities and derivatives Investments in debt securities - 4,355 8,560 6,825 73,390 35, ,276 Loans and receivables (including finance lease receivables) 43,587 87,158 85,292 2,708 11,109 1,656 5, ,636 Other assets * ,527 6,527 Total 47,344 91,513 93,852 9,533 84,499 36,802 41, ,620 Liabilities: Due to banks 11, ,713 14,982 Due to customers 19,746 21,838 28,820 46,895 18,101 4, , ,668 Other liabilities and equity * 13, ,519 63,970 Total 44,928 22,038 28,820 47,233 18,101 4, , ,620 Total interest sensitivity gap 2,416 69,475 65,032 (37,700) 66,398 32,733 (198,354) - * Also includes non-financial instruments As at 2015, the Group s assets bearing fixed interest amounted to EUR 144,624 thousand, liabilities EUR 151,738 thousand. Group As at 2014 Less than 1 month 1 to 3 months 3 to 6 months 6 months to 1 year 1 to 3 years More than 3 years Noninterestbearing Total Assets: Cash and balances with banks 59, ,221 88,327 Investments in equity securities and derivatives Investments in debt securities 11 3,719-2,936 57,284 53,555 5, ,012 Loans and receivables (including finance lease receivables) 40,489 79,525 75,372 2,897 7, , ,300 Other assets * ,615 6,615 Total 99,606 83,244 75,372 5,833 64,547 54,455 44, ,320 Liabilities: Due to banks - 29, ,688 72,658 Due to customers 19,046 23,090 26,805 32,175 9,267 2, , ,377 Other liabilities and equity * ,158 49,119 61,285 Total 19,054 53,060 26,805 32,175 9,267 14, , ,320 Total interest sensitivity gap 80,552 30,184 48,567 (26,342) 55,280 39,672 (227,913) - * Also includes non-financial instruments As at 2014, the Group s assets bearing fixed interest amounted to EUR 183,113 thousand, liabilities EUR 142,977 thousand. 81
82 Note 33. Risk management (continued) The table below summarises the impact of interest rate increases/decreases by 1 percentage point (p.p.) on equity. Group Impact of interest rate increase by 1 p.p. on equity * 916 1, ,261 Impact of interest rate decrease by 1 p.p. on equity * (916) (1,269) (914) (1,261) * Impact on equity does not include interest rate fair value risk summarised below. The table below summarises the impact of change in the value of debt securities on equity, in case the yield increases / decreases by 1 p.p. Impact on equity, EUR thousand Yield change Available-for-sale debt securities 1 p.p. 2,797 3,382 (1 p.p.) (2,681) (3,540) Operational risk Operational risk is the risk to incur direct and indirect losses due to inappropriate or unimplemented internal processes, technologies, employees actions or external factors. The objective of operational risk management is to achieve that operations of the and its subsidiary are organised in a way that ensures profitability of the s or its subsidiary s activities, that is secure and able to guarantee a sustained process of services to the customers, effectively minimise possible future operational losses using appropriate means, and focus on operational risk prevention. Operational risk management is an integral part of the s overall risk management system and it is included in the s overall risk management policy. The and the Group apply various means and methods of operational risk management in their daily activities: 4 eyes principle and segregation of functions, continuous monitoring of the level of operational risk, as well as introduction of preventive measures to mitigate the risk. In addition, mitigating the risk related to money laundering prevention, the applies various preventive measures, such as Know Your Client, stricter monitoring procedures of clients and client transactions, etc. The has developed the database of operational risk events registration, which accumulates historical data and allows forecasting sources of operational risk and preventing potential losses on a timely basis. The worst-case scenario testing The worst-case scenario testing and scenario analysis are widely used in assessing high risk, which the may incur, including concentration risk. This analysis helps to determine the factors that expose the to high risk and to assess an overall possible impact. The worst-case scenario testing helps to determine the losses that the would incur in the event of extremely unfavourable conditions for the s operations. While performing the testing, the values of unfavourable risk factors are determined and the testing is performed by assessing all main types of risk: credit, market, liquidity and operational risks. The main objective of the worst-case scenario testing is to estimate its possible impact on equity of the and the whole group of the and prepare a plan of actions to ensure business continuity. The worst-case scenario testing based on scenario analysis comprising four main types of risk (credit, market and interest, liquidity, operational risk) is performed at least once a year. 82
83 Note 34. Fair values of financial instruments Fair value is the price that would be received to sell an asset or paid to transfer a liability in an orderly transaction under current market conditions in the main (or the most favourable) market independent on whether this price is directly observable or established using valuation techniques. The following methods and assumptions are used by the and the Group to estimate the fair value of the financial instruments: Cash. Cash represents cash on hand stated at value equal to the fair value. Balances with the of Lithuania. Balances in current accounts with the of Lithuania are stated at fair value. Financial assets and financial liabilities at fair value through profit or loss. These investments were measured at fair values; therefore, their fair values are equal to their carrying amounts. Amounts due from banks. For assets with maturities less than 3 months, the carrying amount approximates the fair value due to the relatively short term of these financial instruments. For longer-term deposits, the fair value was estimated by discounting future cash flows using the market interest rates for similar maturities prevailing at the end of the reporting period. Available-for-sale and held-to-maturity investments. The fair values of investments are estimated with reference to quoted market prices. Loans to customers and finance lease receivables. The estimate was made by discounting future cash flows per each loan during the maturity using the market interest rates prevailing at the end of the reporting period. Amounts due to customers and banks, finance lease and other loans. For balances with maturities less than 3 months, the carrying amount approximates the fair value due to the relatively short term of these financial instruments. For longer term fixed interest-bearing deposits and other financial liabilities the fair value was estimated by discounting cash flows using interest rates for new debts with similar remaining maturities. Fair values are categorised within different levels in a fair value hierarchy, which disclosed the significance of initial inputs used in the valuation techniques. The fair value hierarchy consists of these levels: Level 1 quoted prices (unadjusted) in active markets for identical assets or liabilities; Level 2 original inputs other than quoted prices included within Level 1 that are observable for the asset or liability, either directly (i.e. as prices) or indirectly (i.e. derived from prices); Level 3 original inputs for the asset or liability that are not based on observable market data (unobservable original inputs). Financial instruments measured at fair value Specification of financial instruments measured at fair value by fair value levels: and Group at 2015 Level 1 Level 2 Level 3 Total Financial assets Derivative financial instruments Available-for-sale financial assets 128, ,292 Financial liabilities Derivative financial instruments and Group at 2014 Level 1 Level 2 Level 3 Total Financial assets Derivative financial instruments Available-for-sale financial assets 123, ,028 Financial liabilities Derivative financial instruments
84 Note 34. Fair values of financial instruments (continued) The following table shows the valuation techniques and significant unobservable inputs for financial assets and liabilities, measured at Level 2 fair values: Type Financial assets at fair value through profit or loss Financial liabilities at fair value through profit or loss Significant unobservable Valuation technique inputs Market comparison technique: the Not applicable fair values are based on quoted prices. Similar contracts are traded in an active market and the quotes reflect the actual transactions in similar instruments. Market comparison technique: the Not applicable fair values are based on quoted prices. Similar contracts are traded in an active market and the quotes reflect the actual transactions in similar instruments. Inter-relation between significant unobservable inputs and fair value measurement Not applicable Not applicable Financial instruments not measured at fair value The table below discloses the carrying amounts and fair values of the financial instruments which are not stated at fair value in the financial statements. The table does not include the fair values of non-financial assets and liabilities: 2015 Level 1 Level 2 Level 3 Total fair value Total carrying amount Assets Cash and balances with the central bank - 28,890-28,890 28,890 Balances with banks and other credit institutions - - 4,267 4,267 4,267 Loans and other receivables , , ,814 Other financial assets Liabilities Due to banks and other credit institutions - 14,982-14,982 14,982 Due to customers - 325, , ,700 Other loans ,299 13,299 13,405 Other financial liabilities - - 2,736 2,736 2, Assets Cash and balances with the central bank - 11,659-11,659 11,659 Balances with banks and other credit institutions ,680 76,680 76,668 Loans and other receivables , , ,141 Other financial assets Liabilities Due to banks and other credit institutions - 42,689-42,689 42,689 Due to customers - 294, , ,636 Other loans ,034 12,034 12,235 Other financial liabilities - - 3,460 3,460 3,460 84


85
Management Report 3. Management of the Bank 5. Condensed Interim Statements of Income 6. Condensed Interim Statements of Comprehensive Income 7
 Table of Contents Management Report 3 Management of the Bank 5 Condensed Interim Financial Statements: Condensed Interim Statements of Income 6 Condensed Interim Statements of Comprehensive Income 7 Condensed
CONTENTS OF FINANCIAL STATEMENTS
 BANK S PREPARED IN ACCORDANCE WITH INTERNATIONAL FINANCIAL REPORTING STANDARDS AS ADOPTED BY THE EUROPEAN UNION PRESENTED TOGETHER WITH INDEPENDENT AUDITOR S REPORT CONTENTS OF FINANCIAL STATEMENTS INDEPENDENT
CONFIRMATION FROM THE RESPONSIBLE PERSONS
 CONFIRMATION FROM THE RESPONSIBLE PERSONS We, Chief Executive Officer of Šiaulių bankas AB Vytautas Sinius and Chief Accountant Vita Adomaitytė, confirm that as far as we know, the financial statements
FINANCIAL STATEMENTS
 FINANCIAL STATEMENTS 2 ab LIETUVOS PAŠTAS FINANCIAL STATEMENTS 2010 CONTENTS Contents 3 5 7 8 9 11 29 Independent auditors report to the shareholder of PUBLIC LIMITED company Lietuvos paštas BALANCE SHEET
AS LATVIJAS PASTA BANKA. Interim condensed financial statements for the six-month period ended 30 June 2015
 for the six-month period ended 30 June 2015 CONTENTS Lapa Management Report 3 The Council and the Board 4 Statement of Management s Responsibility 5 Independent Auditors Report 6-7 Interim Condensed Financial
FINANCIAL STATEMENTS 31 MARCH 2007
 FINANCIAL STATEMENTS MARCH TILŽĖS ST. 149, LT-76348 ŠIAULIAI TEL.(41) 595607, FAX (41) 430774 E-MAIL INFO@SB.LT WWW.SB.LT RESPONSIBLE PERSONS CONFIRMATION We, Chairman of the Bord Algirdas Butkus and Chief
AS LATVIJAS PASTA BANKA
 *Translation from Latvian original AS LATVIJAS PASTA BANKA Financial statements of the Bank for the year ended 31 December 2016 CONTENTS Page Management Report 3-5 Statement of Management s Responsibility
for the twelve month period ended 31 December 2017
 INTERIM INFORMATION for the twelve month period ended 31 December 2017 Tilžės 149, LT-76348 Šiauliai Tel. (8 41) 595 607, fax (8 41) 430 774 E-mail info@sb.lt www.sb.lt 1 / 36 I N T E R I M I N F O R M
MOKILIZINGAS UAB FINANCIAL STATEMENTS OF THE COMPANY FOR THE YEAR 2014, PREPARED IN ACCORDANCE WITH BUSINESS ACCOUNTING STANDARDS AND PRESENTED
 MOKILIZINGAS UAB FINANCIAL STATEMENTS OF THE COMPANY FOR THE YEAR, PREPARED IN ACCORDANCE WITH BUSINESS ACCOUNTING STANDARDS AND PRESENTED TOGETHER WITH INDEPENDENT AUDITOR S REPORT pwc This version of
AS LTB Bank. Condensed Interim Financial Statements for the six month period ended 30 June 2011
 AS LTB Bank Condensed Interim Financial Statements for the six month period ended 30 June 2011 CONTENTS Page Management Report 3-4 Members of the Council and the Board 5 Condensed Statement of Comprehensive
AS LATVIJAS PASTA BANKA. Financial statements of the Bank for the year ended 31 December 2010
 for the year ended 31 December 2010 CONTENTS Page Management Report 3-4 The Council and the Board 5 Statement of Management s Responsibility 6 Auditors Report 7 Bank s Financial Statements: Statement of
RIETUMU BANK AS. Condensed Interim Bank Separate and Group Consolidated Financial Statements For the six month period ended 30 June 2015
 RIETUMU BANK AS Condensed Interim Bank Separate and Group Consolidated Financial Statements For the six month period ended 30 June 2015 Contents Report of Council and Board 3 Independent auditors Report
for the nine month period ended 30 September 2017
 INTERIM INFORMATION for the nine month period ended 30 September 2017 Tilžės 149, LT-76348 Šiauliai Tel. (8 41) 595 607, fax (8 41) 430 774 E-mail info@sb.lt www.sb.lt 1 / 38 I N T E R I M I N F O R M
Regulations and guidelines 4/2018
 Regulations and guidelines 4/2018 Management of credit risk by supervised entities in the financial sector 3 J. No. FIVA 13/01.00/2017 Issued 5 March 2018 1 July 2018 FINANCIAL SUPERVISORY AUTHORITY tel.
Pieno Žvaigždės, AB. Financial statements for the year ended 31 December 2014
 Financial statements for the year Table of contents Company details 1 Management s statement on the financial statements 2 Independent auditor s report 3 Statement of comprehensive income 5 Statement of
CONTENTS DIRECTOR S REVIEW INFORMATION ABOUT THE COMPANY OVERVIEW OF THE COMPANY S ACTIVITIES AND DEVELOPMENT
 ANNUAL REPORT 2009 CONTENTS DIRECTOR S REVIEW...3 INFORMATION ABOUT THE COMPANY...5 OVERVIEW OF THE COMPANY S ACTIVITIES AND DEVELOPMENT...7 Guarantees Issued to Credit Institutions...7 Volume of Guarantees
AS LATVIJAS PASTA BANKA. Interim condensed financial statements for the six-month period ended 30 June 2012
 for the six-month period ended 30 June 2012 CONTENTS Page Management Report 3-4 The Council and the Board 5 Statement of Management s Responsibility 6 Independent Auditors Report 7 Interim Condensed Financial
AB INVALDOS NEKILNOJAMOJO TURTO FONDAS
 AB INVALDOS NEKILNOJAMOJO TURTO FONDAS ANNUAL REPORT, COMPANY S FINANCIAL STATEMENTS FOR THE YEAR 2014 PREPARED ACCORDING TO INTERNATIONAL FINANCIAL REPORTING STANDARDS AS ADOPTED BY THE EUROPEAN UNION,
AS Akciju komercbanka Baltikums Consolidated Financial Statement as of 30 June, 2006
 AS Akciju komercbanka Baltikums Consolidated Financial Statement as of 30 June, 2006 Contents Report of Management 3 Consolidated Income Statement 5 Consolidated Balance Sheet 6 Consolidated Statement
Additional informatikon regarding the nature of capital and risk of Šiaulių Bankas AB
 Additional informatikon regarding the nature of capital and risk of Šiaulių Bankas AB Hereby we provide additional information following the chapter eight of Regulation (EU) No 575/2013 of the European
AS LATVIJAS PASTA BANKA. Interim condensed financial statements for the six-month period ended 30 June 2013
 for the six-month period ended 30 June 2013 CONTENTS Page Management Report 3-4 The Council and the Board 5 Statement of Management s Responsibility 6 Independent Auditors Report 7 Interim Condensed Financial
ARTICLES OF ASSOCIATION OF SPECIAL CLOSED-END TYPE REAL ESTATE INVESTMENT COMPANY INVL BALTIC REAL ESTATE
 ARTICLES OF ASSOCIATION OF SPECIAL CLOSED-END TYPE REAL ESTATE INVESTMENT COMPANY INVL BALTIC REAL ESTATE The Articles of Association were signed in Vilnius on [ ] [ ] [ ] Authorised person: [ ] [ ] 1
for the three month period ended 31 March 2018
 INTERIM INFORMATION for the three month period ended 31 March 2018 Tilžės 149, LT-76348 Šiauliai Tel. (8 41) 595 607, fax (8 41) 430 774 E-mail info@sb.lt www.sb.lt 1 / 40 I N T E R I M I N F O R M A T
Nordax Group AB (publ) Combined financial statements 1 January 31 December 2012, 2013, 2014
 Combined financial statements 1 January 31 December 2012, 2013, 2014") Nordax Group AB (publ) Combined financial statements 1 January 31 December 2012, 2013, 2014 Contents Income statement...2 Statement of financial position...3 Cash flow statement...4 Statement of changes
Nordax Group AB (publ) Combined financial statements 1 January 31 December 2012, 2013, 2014 Contents Income statement...2 Statement of financial position...3 Cash flow statement...4 Statement of changes
Universal Investment Bank AD Skopje. Financial Statements for the year ended 31 December 2007
 for the year ended 31 December 2007 Contents Auditors' report Balance sheet 1 Income statement 2 Statement of changes in equity 3 Statement of cash flows 4 Notes to the financial statement 5 Income
CONFIRMATION FROM THE RESPONSIBLE PERSONS
 CONFIRMATION FROM THE RESPONSIBLE PERSONS We, Chief Executive Officer of Šiaulių Bankas AB Vytautas Sinius and Chief Accountant Vita Adomaitytė, confirm that as far as we know, the financial statements
Cayman National Bank and Trust Company (Isle of Man) Limited. Report and financial statements. for the year ended 30 September 2016
 Limited. Report and financial statements. for the year ended 30 September 2016") Report and financial statements for the year ended 30 September 2016 Contents Page Directors' report 1 Statement of Directors' Responsibilities 2 Independent auditor's report 3 Statement of Financial Position
Report and financial statements for the year ended 30 September 2016 Contents Page Directors' report 1 Statement of Directors' Responsibilities 2 Independent auditor's report 3 Statement of Financial Position
ENERGIJOS SKIRSTYMO OPERATORIUS AB THE COMPANY'S CONDENSED INTERIM FINANCIAL INFORMATION
 2018 ENERGIJOS SKIRSTYMO OPERATORIUS AB THE COMPANY'S CONDENSED INTERIM FINANCIAL INFORMATION THE COMPANY'S CONDENSED INTERIM FINANCIAL INFORMATION FOR THE SECOND QUARTER OF 2018 AND SIX-MONTH PERIOD ENDED
CHARTER OF ING BANK ŚLĄSKI SPÓŁKA AKCYJNA. 1. The business name of the Bank shall be: ING Bank Śląski Spółka Akcyjna.
 CHARTER OF ING BANK ŚLĄSKI SPÓŁKA AKCYJNA Consolidated Text As adopted by way of the ING Bank Śląski S.A. Supervisory Board Resolution No. 58/XII/2015 of 17 September 2015, recorded under Rep. A No. 1023/2015,
A/S REĢIONĀLĀ INVESTĪCIJU BANKA. Financial statements for the fifteen months period ended 31 December 2002
 A/S REĢIONĀLĀ INVESTĪCIJU BANKA Financial statements for the fifteen months period ended 31 December 2002 CONTENTS Report of the Management 3 The Council and the Board of the Bank 4 Statement of responsibility
AB INVL Baltic Farmland Consolidated Annual Report, Consolidated and Company s Financial Statements for the year ended 31 December 2017
 AB INVL Baltic Farmland Consolidated Annual Report, Consolidated and Company s Financial Statements for the year ended 31 December 2017 prepared in accordance with International Financial Reporting Standards
PILLAR 3 Disclosures
 PILLAR 3 Disclosures Published April 2016 Contacts: Rajeev Adrian Sedjwick Joseph Chief Financial Officer Chief Risk Officer 0207 776 4006 0207 776 4014 Rajeev.adrian@bank-abc.com sedjwick.joseph@bankabc.com
AS Citadele banka Risk management and capital adequacy report for 2016
 INTRODUCTION As stipulated in the part eight of the Regulation (EU) No 575/2013 the institution at least annually should disclose information on the major risks of its operations and its risk management
Banking Activity Review
 A C T I V I T I E S O F F I N A N C I A L M A R K E T P A R T I C I P A N T S Banking Activity Review 17 ISSN 233-8327 (ONLINE) Reproduction for educational and non-commercial purposes is permitted provided
Nova KBM s Consolidated Disclosures for the Financial Year 2016
 Nova KBM s Consolidated Disclosures for the Financial Year 2016 Maribor, March 2017 Contents 1. PRELIMINARY OBSERVATIONS 8 2. RISK MANAGEMENT OBJECTIVES AND POLICIES 9 2.1 STRATEGIES AND PROCESSES TO MANAGE
Banking Activity Review
 Banking Activity Review 18 / Q1 ISSN 233-8319 (ONLINE) Reproduction for educational and non-commercial purposes is permitted provided that the source is acknowledged. Lietuvos bankas, 18 Gedimino pr. 6,
AMENDMENT No. 2 TO THE DEPOSITORY SERVICES AGREEMENT No [...] [...] 2017 Vilnius
![AMENDMENT No. 2 TO THE DEPOSITORY SERVICES AGREEMENT No [...] [...] 2017 Vilnius](/thumbs/81/84745932.jpg "AMENDMENT No. 2 TO THE DEPOSITORY SERVICES AGREEMENT No [...] [...] 2017 Vilnius") AMENDMENT No. 2 TO THE DEPOSITORY SERVICES AGREEMENT No. 2016-11 [...] [...] 2017 Vilnius AB SEB bankas (hereinafter referred to as the Depository), having its registered office at Gedimino Ave. 12, Vilnius,
AMENDMENT No. 2 TO THE DEPOSITORY SERVICES AGREEMENT No. 2016-11 [...] [...] 2017 Vilnius AB SEB bankas (hereinafter referred to as the Depository), having its registered office at Gedimino Ave. 12, Vilnius,
AS REĢIONĀLĀ INVESTĪCIJU BANKA INTERIM CONDENSED FINANCIAL STATEMENTS FOR THE 6 MONTH PERIOD ENDED 30 JUNE 2012
 AS REĢIONĀLĀ INVESTĪCIJU BANKA CONTENTS Report of the Management 3 The Council and the Board of Directors of the Bank 5 Statement of Responsibility of the Management 6 Auditors Report 7 Financial Statements:
AND SEPARATE FINANCIAL STATEMENTS FOR THE YEAR ENDED , 6, 31 DECEMBER
 AB SNAIGĖ CONSOLIDATED AND SEPARATE FINANCIAL STATEMENTS FOR THE YEAR ENDED 31 DECEMBER 2017 PREPARED IN ACCORDANCE WITH INTERNATIONAL FINANCIAL REPORTING STANDARDS AS ADOPTED BY THE EUROPEAN UNION PRESENTED
AS CAPITALIA. Unaudited consolidated interim financial statements For the period
 AS CAPITALIA Unaudited consolidated interim financial statements For the period 01.01.2016 30.06.2016 Prepared in accordance with the international financial reporting standards as adopted by EU Information
Balance Sheet 3. Profit and Loss Statement 5. Cash Flow Statement 8
 BANK OF LATVIA FINANCIAL STATEMENTS OF THE BANK OF LATVIA FOR THE YEAR ENDED 31 DECEMBER 2008 INDEPENDENT AUDITORS' REPORT TO THE COUNCIL OF THE BANK OF LATVIA CONTENTS Balance Sheet 3 Profit and Loss
AB SNAIGĖ CONSOLIDATED INTERIM FINANCIAL STATEMENTS FOR THE NINE MONTHS PERIOD ENDED 30 SEPTEMBER 2017 (UNAUDITED) page 1
 page 1") AB SNAIGĖ FOR THE NINE MONTHS PERIOD ENDED 30 SEPTEMBER 2017 (UNAUDITED) page 1 CONTENTS I. GENERAL PROVISIONS 3 II. FINANCIAL STATUS 4 III. EXPLANATORY NOTES 10 page 2 I. GENERAL PROVISIONS 1. Accounting
AB SNAIGĖ FOR THE NINE MONTHS PERIOD ENDED 30 SEPTEMBER 2017 (UNAUDITED) page 1 CONTENTS I. GENERAL PROVISIONS 3 II. FINANCIAL STATUS 4 III. EXPLANATORY NOTES 10 page 2 I. GENERAL PROVISIONS 1. Accounting
OP Mortgage Bank Report by the Board of Directors and Financial Statements 2017
 OP Mortgage Bank Report by the Board of Directors and Financial Statements 2017 OP Contents Report by the Board of Directors 1 Income statement 9 Balance sheet 10 Cash flow statement 11 Statement of changes
RIETUMU BANKA AS. Condensed Interim Bank Separate and Group Consolidated Financial Statements For the six month period ended 30 June 2016
 RIETUMU BANKA AS Condensed Interim Bank Separate and Group Consolidated Financial Statements For the six month period ended Contents Report of Council and Board of Directors 3 Independent auditors Report
ARTICLES OF ASSOCIATION OF SPECIAL CLOSED-ENDED TYPE PRIVATE CAPITAL INVESTMENT COMPANY INVL TECHNOLOGY
 ARTICLES OF ASSOCIATION OF SPECIAL CLOSED-ENDED TYPE PRIVATE CAPITAL INVESTMENT COMPANY INVL TECHNOLOGY The Articles of Association were signed in Vilnius on 2016. Authorised person 1 I. GENERAL INFORMATION
PRA RULEBOOK CRR FIRMS INSTRUMENT 2013
 PRA RULEBOOK CRR FIRMS INSTRUMENT 2013 Powers exercised A. The Prudential Regulation Authority (the PRA ) makes this instrument in the exercise of the following powers and related provisions in the Financial
Report of the Management 3. The Supervisory Council and the Board of Directors of the Bank 4. Statement of Responsibility of the Management 5
 A/S REĢIONĀLĀ INVESTĪCIJU BANKA ANNUAL REPORT FOR THE YEAR ENDED 31 DECEMBER 2006 CONTENTS Report of the Management 3 The Supervisory Council and the Board of Directors of the Bank 4 Statement of Responsibility
Consolidated Interim Report 3rd quarter and nine months ended 30 September 2018
 Consolidated Interim Report 3rd quarter and nine months ended 30 September 2018 (translation of the Estonian original) EfTEN Real Estate Fund III AS Commercial register number: 12864036 Beginning of financial
AMENDMENT No. 2 TO THE DEPOSITORY SERVICES AGREEMENT No [...] April 2018 Vilnius
![AMENDMENT No. 2 TO THE DEPOSITORY SERVICES AGREEMENT No [...] April 2018 Vilnius](/thumbs/81/84745952.jpg "AMENDMENT No. 2 TO THE DEPOSITORY SERVICES AGREEMENT No [...] April 2018 Vilnius") AMENDMENT No. 2 TO THE DEPOSITORY SERVICES AGREEMENT No. 2016-05 [...] April 2018 Vilnius AB SEB bankas (hereinafter referred to as the Depository), having its registered office at Gedimino Ave. 12, Vilnius,
AMENDMENT No. 2 TO THE DEPOSITORY SERVICES AGREEMENT No. 2016-05 [...] April 2018 Vilnius AB SEB bankas (hereinafter referred to as the Depository), having its registered office at Gedimino Ave. 12, Vilnius,
COUNCIL OF LATVIJAS BANKA. 16 September 2013 Procedure (internal regulation) No. 213/9 Riga
 No. 213/9 Riga") COUNCIL OF LATVIJAS BANKA K. VALDEMĀRA IELA 2A RĪGA LV-1050 LATVIJA TĀLRUNIS +371 67022300 FAKSS +371 67022420 E-PASTS INFO@BANK.LV WWW.BANK.LV 16 September 2013 Procedure (internal regulation) No. 213/9
COUNCIL OF LATVIJAS BANKA K. VALDEMĀRA IELA 2A RĪGA LV-1050 LATVIJA TĀLRUNIS +371 67022300 FAKSS +371 67022420 E-PASTS INFO@BANK.LV WWW.BANK.LV 16 September 2013 Procedure (internal regulation) No. 213/9
Pillar 3 Disclosures. Sterling ISA Managers Limited Year Ending 31 st December 2017
 Pillar 3 Disclosures Sterling ISA Managers Limited Year Ending 31 st December 2017 1. Background and Scope 1.1 Background Sterling ISA Managers Limited (the Company) is supervised by the Financial Conduct
OTP Mortgage Bank Ltd. December 31, 2013
 OTP Mortgage Bank Ltd. Separate Financial Statements in accordance with International Financial Reporting Standards as adopted by the European Union and Independent Auditors Report December 31, 2013 CONTENTS
EUR millions H H Change H H Change
 The Group at a Glance KEY FIGURES EUR millions Group Bank H1 H1 Change H1 H1 Change Net interest income 31.1 29.5 5% 23.6 23.7 (0%) Net commission and fee income 18.3 17.2 6% 13.1 12.3 6% Operating income
RIETUMU BANKA AS. Condensed Interim Bank Separate and Group Consolidated Financial Statements For the six month period ended 30 June 2017
 RIETUMU BANKA AS Condensed Interim Bank Separate and Group Consolidated Financial Statements For the six month period ended 30 June 2017 Contents Report of Council and Board of Directors 3 Statement of
EUROSTANDARD Banka AD Skopje. Consolidated Financial Statements for the year ended 31 December 2007
 Consolidated Financial Statements for the year ended 31 December 2007 Contents Auditors' report Financial Statements Consolidated balance sheet 2 Consolidated income statement 3 Consolidated statement
PILLAR 3 DISCLOSURES MERCER UK AUGUST 2016
 PILLAR 3 DISCLOSURES MERCER UK AUGUST 2016 CONTENTS 1. Background... 1 1.1 Basis of Disclosures... 2 1.2 Frequency of Publication... 2 1.3 Verification... 2 1.4 Media & Location of Publication... 2 2.
OP Corporate Bank plc Corporate Governance Statement 2017
 OP Corporate Bank plc Corporate Governance Statement 2017 OP OP Corporate Bank plc s Corporate Governance Statement 2017 1 OP Corporate Bank plc s Corporate Governance Statement 2017 Contents 1 Applicable
AB BANKAS NORD/LB LIETUVA FINANCIAL STATEMENTS FOR THE YEAR ENDED 31 DECEMBER 2005
 CONTENTS Page AUDITOR'S REPORT 3 REPORT ON THE PERFORMANCE OF THE BANK 4 THE GROUP AND BANK INCOME STATEMENT 7 THE GROUP AND BANK BALANCE SHEET 8 GROUP STATEMENT OF CHANGES IN SHAREHOLDERS EQUITY 9 BANK
Havin Bank Limited Report and Financial Statements
 Report and Financial Statements 31 December 2010 Registered No: 1074897 Directors O Lopez G Roca (Appointed Chairman - 11 May 2010) I Bacallao A Victoria N Martinez (Resigned as Chairman and from Board
DECREE. No. 163/2014 Coll. on the performance of the activities of banks, credit unions and investment firms
 DECREE No. 163/2014 Coll. on the performance of the activities of banks, credit unions and investment firms The Czech National Bank stipulates, pursuant to Article 8b(7), Article 8c(3), Article 10a(3),
DECREE. No. 23/2014 Coll. on the performance of the activities of banks, credit unions and investment firms
 DECREE No. 23/2014 Coll. on the performance of the activities of banks, credit unions and investment firms Pursuant to Article 8b(5), Article 11a(9), Article 12a(10), Article 15, Article 22(2), Article
CAPITAL REQUIREMENTS DIRECTIVE PILLAR 3 DISCLOSURE DOCUMENT 31 ST MARCH P a g e
 CAPITAL REQUIREMENTS DIRECTIVE PILLAR 3 DISCLOSURE DOCUMENT 31 ST MARCH 2017 1 P a g e CONTENTS Page 1. Introduction 3 2. Risk Management Objectives and Policies 3-7 3. Capital Resources 7 4. Capital Adequacy
DECISION ON RISK MANAGEMENT BY BANKS
 RS Official Gazette, Nos 45/2011, 94/2011, 119/2012, 123/2012, 23/2013 other decision 1, 43/2013, 92/2013, 33/2015, 61/2015, 61/2016, 103/2016 and 119/2017 Pursuant to Article 28, paragraph 7, Article
Alpha Bank AD Skopje. Financial Statements for the year ended 31 December 2007
 for the year ended 31 December 2007 Contents Auditors' report Balance sheet 2 Income statement 3 Statement of changes in equity 4 Statement of cash flows 5 Notes to the financial statement 6 Balance sheet
Disclosure Report 2017 in accordance with Article 13 CRR ProCredit Bank sh.a., Kosovo
 Disclosure Report 2017 in accordance with Article 13 CRR ProCredit Bank sh.a., Kosovo ProCredit Bank sh.a. Kosovo 1 Introduction ProCredit Bank Kosovo (hereinafter the Bank ) is a significant subsidiary
BOM/BSD 12/December 2003 BANK OF MAURITIUS. Guideline on Credit Risk Management
 BOM/BSD 12/December 2003 BANK OF MAURITIUS Guideline on Credit Risk Management December 2003 Revised March 2017 Revised August 2017 TABLE OF CONTENTS INTRODUCTION... 1 AUTHORITY... 2 INTERPRETATION...
GOLDENBURG GROUP LIMITED PILLAR III DISCLOSURES BASEL III
 GOLDENBURG GROUP LIMITED PILLAR III DISCLOSURES BASEL III YEAR ENDED 31 DECEMBER 2014 May 2015 ACCORDING TO SECTION 4 (PAR. 32) OF THE CYPRUS SECURITIES AND EXCHANGE COMMISSION DIRECTIVE DI144-2014-14
FINASTA ASSET MANAGEMENT UAB
 FINASTA ASSET MANAGEMENT UAB COMPANY S PREPARED ACCORDING TO INTERNATIONAL FINANCIAL REPORTING STANDARDS, AS ADOPTED BY THE EUROPEAN UNION, PRESENTED TOGETHER WITH INDEPENDENT AUDITOR S REPORT ANNUAL
Home Credit a.s. Financial Statements for the year ended 31 December 2009
 Financial Statements Translated from the Czech original Financial Statements Contents Independent Auditor s Report 3 Statement of Financial Position 5 Statement of Comprehensive Income 6 Statement of Changes
AB DnB NORD Bankas Interim Condensed Financial Information. (in accordance with IFRS, unaudited)
") AB DnB NORD as Interim Condensed Financial Information (in accordance with IFRS, unaudited) II quarter AS AT 30 JUNE GTHE GROUP AND BANK INCOME (EXPENSE) STATEMENT Notes Interest income 119,488 167,171
AB DnB NORD as Interim Condensed Financial Information (in accordance with IFRS, unaudited) II quarter AS AT 30 JUNE GTHE GROUP AND BANK INCOME (EXPENSE) STATEMENT Notes Interest income 119,488 167,171
AB SEB bankas Capital Adequacy and Risk Management Report (Pillar 3) 2017
 2017") Capital Adequacy and Risk Management Report (Pillar 3) 2017 Table of contents Basis for the report... 3 Internal capital adequacy assessment process... 4 Own funds and capital requirements... 5 Credit
Capital Adequacy and Risk Management Report (Pillar 3) 2017 Table of contents Basis for the report... 3 Internal capital adequacy assessment process... 4 Own funds and capital requirements... 5 Credit
Basel III Pillar III DISCLOSURES REPORT
 Basel III Pillar III DISCLOSURES REPORT Pillar III Disclosures Report December 31st 2016 ARESBANK PILAR III DISCLOSURES (December 31 st, 2016) TABLE OF CONTENTS 1. INTRODUCTION... 3 2. INTERNAL GOVERNANCE
BASEL II - PILLAR III
 BASEL II - PILLAR III DISCLOSURES 2009 ARESBANK PILAR III DISCLOSURES (December 31 st 2009) TABLE OF CONTENTS 1. INTRODUCTION... 2 2. INTERNAL GOVERNANCE STRUCTURE... 3 3. RISK GOVERNANCE... 5 4. CAPITAL
T I T L E P A G E INDEPENDENT AUDITOR S REPORT
 T I T L E P A G E INDEPENDENT AUDITOR S REPORT FINANCIAL STATEMENTS AND ANNUAL REPORT 31 December 2017 C O N T E N T S INDEPENDENT AUDITOR S REPORT TO THE SHAREHOLDERS OF ŠIAULIŲ BANKAS AB... 3 FINANCIAL
REPORT ON RISK AND CAPITAL MANAGEMENT PILLAR3 OF THE BASEL FOR THE YEAR ENDED 31 DECEMBER 2016
 PILLAR3 OF THE BASEL FOR THE YEAR ENDED 31 DECEMBER 2016 CONTENTS INTRODUCTION... 2 REPRESENTATION REGARDING SUITABILITY OF RISK MANAGEMENT MEASURES... 2 CONDENSED RISK REPORT... 2 ORGANIZATIONAL STRUCTURE...
AB DnB NORD Bankas Interim Condensed Financial Information. (in accordance with IFRS, unaudited)
") AB DnB NORD as Interim Condensed Financial Information (in accordance with IFRS, unaudited) I quarter 2010 THE GROUP AND BANK INCOME (EXPENSE) STATEMENT Notes 31 March 2010 31 March 2009 31 March 2010
AB DnB NORD as Interim Condensed Financial Information (in accordance with IFRS, unaudited) I quarter 2010 THE GROUP AND BANK INCOME (EXPENSE) STATEMENT Notes 31 March 2010 31 March 2009 31 March 2010
SCOTIA INVESTMENTS TRINIDAD AND TOBAGO LIMITED FINANCIAL RESULTS AS AT 31 OCTOBER 2015
 FINANCIAL RESULTS AS AT 31 OCTOBER Independent Auditors' Report to the Shareholder of Scotia Investments Trinidad and Tobago Limited Statement of Profit or Loss Year ended October 31, Notes We have audited
UAB NEO Finance Board report 2017Q4 Vilnius
 UAB NEO Finance Board report 217Q4 Vilnius 218-1-1 Press releases Social events October Training sessions for beginners and experts in P2P lending in Kaunas Special event with Practica Capital in Vilnius
1 SIGNIFICANT ACCOUNTING POLICIES The principal accounting policies adopted in the preparation of these financial statements as set out below have
 1 SIGNIFICANT ACCOUNTING POLICIES The principal accounting policies adopted in the preparation of these financial statements as set out below have been applied consistently to all periods presented in
Banka Kombetare Tregtare Sh.a. - Kosovo Branch
 Banka Kombetare Tregtare Sh.a. - Kosovo Branch Financial statements for the year ended 31 December 2010 (with independent auditor s report thereon) Banka Kombetare Tregtare Sh.a. Kosovo Branch Contents
SC Citadele banka Public financial report for the 2 nd quarter of 2012
 1 Citadele Bank Declared in 2012 to be Best-Governed State-Owned Company in Baltic States During the first half of 2012, the Citadele Bank continued on its successful development by attracting new clients
SHARE ISSUE PROSPECTUS OF THE VARIABLE CAPITAL INVESTMENT COMPANY OMX BALTIC BENCHMARK FUND THE ISSUE IS FOR PUBLIC DISTRIBUTION
 SHARE ISSUE PROSPECTUS OF THE VARIABLE CAPITAL INVESTMENT COMPANY OMX BALTIC BENCHMARK FUND THE ISSUE IS FOR PUBLIC DISTRIBUTION Risk factors related to the acquisition of securities: market risk, indexing
International Endesa B.V. Financial Statements 2011
 International Endesa B.V. Financial Statements 2011 Index Page Financial Statements 2011 Management Board report 2 Financial Statements 6 Balance sheet 7 Profit and loss 8 Statement of cash flows 9 Statement
SPP INFRASTRUCTURE FINANCING B.V.
 SPP INFRASTRUCTURE FINANCING B.V. Financial Statements 31 December 2015 SPP Infrastructure Financing B.V. Financial Statements: Table of Contents Page Directors' Report for the year ended 31 December 2015
FOR THE YEAR ENDED 31 DECEMBER 2012
 INDEPENDENT AUDITOR S REPORT, AND STAND-ALONE ANNUAL REPORT CONTENTS Pages INDEPENDENT AUDITOR S REPORT 3-4 5 42 STATEMENT OF COMPREHENSIVE INCOME 5 BALANCE SHEET 6 STATEMENT OF CHANGES IN EQUITY 7 STATEMENT
Telia Försäkring AB Annual Report 2016
 Annual Report 2016 Table of contents Table of contents... 2 Administration Report... 3 Proposed appropriation of earnings... 5 Five-year summary and KPIs... 6 Performance analysis... 7 Income statement...
Bigbank AS Interim condensed consolidated financial statements for the period ended 31 March 2017
 Interim condensed consolidated financial statements for the period ended 31 March 2017 Bigbank AS Interim condensed consolidated financial statements for the period ended 31 March 2017 Business name Bigbank
OP Mortgage Bank Report by the Board of Directors and Financial Statements 2016
 OP Mortgage Bank Report by the Board of Directors and Financial Statements 2016 OP Contents Report by the Board of Directors 1 Income statement and balance sheet 9 Cash flow statement 10 Statement of changes
AB SNAIGĖ CONSOLIDATED INTERIM FINANCIAL STATEMENTS FOR THE NINE MONTHS PERIOD ENDED 30 SEPTEMBER 2018 (UNAUDITED)
") AB SNAIGĖ FOR THE NINE MONTHS PERIOD ENDED 30 SEPTEMBER 2018 (UNAUDITED) page 1 CONTENTS I. GENERAL PROVISIONS 3 II. FINANCIAL STATUS 4 III. EXPLANATORY NOTES 10 page 2 I. GENERAL PROVISIONS 1. Accounting
AB SNAIGĖ FOR THE NINE MONTHS PERIOD ENDED 30 SEPTEMBER 2018 (UNAUDITED) page 1 CONTENTS I. GENERAL PROVISIONS 3 II. FINANCIAL STATUS 4 III. EXPLANATORY NOTES 10 page 2 I. GENERAL PROVISIONS 1. Accounting
STATEMENT ON CORPORATE GOVERNANCE PRINCIPLES FOR YEAR 2016
 Joint-stock company DITTON PIEVADĶĒŽU RŪPNĪCA Reg.No.40003030187 STATEMENT ON CORPORATE GOVERNANCE PRINCIPLES FOR YEAR 2016 Corporate Governance Report Annex to the Annual Report 2016 Daugavpils 2017 I
The la Caixa Group: Statutory Documentation for 2006
 The la Caixa Group: Statutory Documentation for 2006 Auditors Report Consolidated Financial Statements Consolidated balance sheets Consolidated income statements Consolidated statements of changes in equity
General Provisions 2. Listing Procedure 3. Listing Application 10. Listing Prespectus 13. General Requirements for Listing of Securities 16
 CONTENTS General Provisions 2 Listing Procedure 3 Listing Application 10 Listing Prespectus 13 General Requirements for Listing of Securities 16 Special Requirements for Listing Shares 19 Special Requirements
LAO PEOPLE S DEMOCRATIC REPUBLIC PEACE INDEPENDENCE DEMOCRACY UNITY PROSPERITY
 LAO PEOPLE S DEMOCRATIC REPUBLIC PEACE INDEPENDENCE DEMOCRACY UNITY PROSPERITY President s Office No. 02/PO DECREE of the PRESIDENT of the LAO PEOPLE S DEMOCRATIC REPUBLIC On the Promulgation of the Law
Joint Stock Company AFI INVESTĪCIJAS
 - - Joint Stock Company AFI INVESTĪCIJAS ANNUAL REPORT FOR THE YEAR ENDED 31 DECEMBER 2016 PREPARED IN ACCORDANCE WITH THE LAWS OF THE REPUBLIC OF LATVIA TOGETHER WITH INDEPENDENT AUDITORS REPORT CONTENTS
INVL TECHNOLOGY. Interim report and interim condensed unaudited financial statements for the six months ended 30 June 2018
 INVL TECHNOLOGY Interim report and interim condensed unaudited financial statements for the six months ended 30 June 2018 prepared according to International Financial Reporting Standards as adopted by
ACT ON BANKS. The National Council of the Slovak Republic has adopted this Act: SECTION I PART ONE BASIC PROVISIONS. Article 1
 ACT ON BANKS The full wording of Act No. 483/2001 Coll. dated 5 October 2001 on banks and on changes and the amendment of certain acts, as amended by Act No. 430/2002 Coll., Act No. 510/2002 Coll., Act
Pillar 3 Disclosures. 31 December 2013
 Pillar 3 Disclosures 31 December 2013 Contents 1. Overview... 3 1.1 Background... 3 1.2 Scope of application... 3 1.3 Basis and frequency of disclosures... 3 1.4 External audit... 3 2. Risk Management
Consolidated Interim report for the 4th quarter
 EfTEN Real Estate Fund III AS Commercial register number: 12864036 Consolidated Interim report for the 4th quarter and 12 months of 2017 Address: A. Lauteri 5, 10114 Tallinn Email address: info@eften.ee
CVR NO RISK REPORT 2013
 CVR NO. 27 49 26 49 RISK REPORT 2013 INTRODUCTION The purpose of this risk report is to provide a description of 1) risk and capital management and 2) the composition of the capital base and risks in relation
DARLINGTON BUILDING SOCIETY CAPITAL REQUIREMENTS DIRECTIVE
 DARLINGTON BUILDING SOCIETY CAPITAL REQUIREMENTS DIRECTIVE PILLAR 3 DISCLOSURE DOCUMENT AS AT 31 st DECEMBER 2016 CONTENTS Section Title 1 Introduction 2 Risk Management Objectives and Policies 3 Capital