Business Results Q
|
|
|
- Alvin Walker
- 5 years ago
- Views:
Transcription


1 Business Results Q
2 Disclaimer Statement The financial information contained herein has neither been reviewed or audited by independent auditors. Therefore, no assurance is given that the financial information contained herein is accurate or complete, and such financial information may differ from the financial information to be contained in our financial statements audited by independent auditors. The information contained herein is subject to change without further notice. We also note the following: 1) Financial information has been prepared in accordance with the Korean IFRS. 2) Financial information for the years ended December 31, 2011, 2012 and 2013 have been retroactively restated to reflect changes in accounting policies. 3) The financial figures have been derived following K-IFRS No.1109, Financial instruments and K-IFRS No.1115, Revenue from Contracts with Customers for the year beginning on January 1, (Financial information for periods prior to December 31, 2017 has not been restated) This presentation material is available at our website,


3 Contents Q Business Results Highlights. Income. Assets & Liabilities. Asset Quality. Capital Adequacy. Appendix
4 2018 3Q Business Result Highlights 1 1,899 Group Net Income 2,706 2, Interest Income* Annual NI 2, Non- Interest Income* 2, SG&A* 2, Absence of write-back from SHC* 2, , Provision for Noncredit Operating losses * Income* Quarterly NI -2% +9% Plus Factors Minus Factors 156 Tax 2,643 2, Bank-centric consistent profit stream despite increasing market volatility Solid core earnings growth achieved by active SME loan growth along with NIM stabilization Continuously stabilizing credit cost through prudent credit risk management (2018 3Q Net Income) (SHB Quarterly SME growth and NIM) Group-wide disciplined cost management bringing Cost-to-Income Ratio down to the lowest level in 6 years (2018 3Q Cost-to-Income Ratio, Accumulated) * Earnings before income tax (NPL as of Sep & Q Credit Costs, Accumulated)
5 2018 3Q Business Result Highlights 2 Interest Income (%, KRW bil.) SHB Loan Growth NIM SHB NII Growth (YoY) Total Loans(YTD) Corporate(YTD) Retail(YTD) , , ,790 6, ,605 2,851 2,701 6,352 2,423 2,528 5,771 2, ,223 2, , ,351 4,367 4,165 4,504 3,648 4, SHB + SHC Cumulative Figs. SHB Quarterly Figs Q17 2Q17 4Q17 1Q18 2Q18 NII Riding Upward Trajectory SFG s Interest income increased by 10.1% YoY and 2.4% QoQ attributed to resilient loan growth coupled with continuous margin improvement. Interest Income from domestic increased by 8.6% YoY whereas global hiked 33.0% YoY improving its contribution to the Group NII from 6.1% in 1H17 to 7.4% in 1H18. NII improvement is attributed to constant drive to focus on qualitative asset growth. Strong SME Loan Growth KRW loan balance as end of marked 205 tril. up by 5.0% YTD and 2.0% QoQ. Corporate : SOHO loans increased by 2.3% in 3Q, bringing up corporate loan growth to 2.5% QoQ. Retail : Personal loans including unsecured Personal loans and Jeonse loans increased by 2.9% in 3Q, shoring up retail loan growth to 1.5% QoQ. Deposit grew by 4.1% YTD reaching to 205 tril. Low costs deposits increased by 5.3% YTD. with year-round efforts to draw more low-cost funding. Margin Stabilization SHB s NIM decreased only by 1bp QoQ, despite the pressures on lending yields in tandem with falling interest rates during 3Q. NIM Stabilizing Factor : 1) lucrative SME loans remaining the focus of the growth, 2) funding rates climbing at a slower pace than lending rates due to a high base for low-cost deposits. SHB s NIM incl. Global is standing at 1.67%, evidencing its higher profitability in Overseas. Group NIM including credit card marked 2.10%, 1bp contraction QoQ.
6 2018 3Q Business Result Highlights 3 Non-Interest Income (%, KRW bil.) G&A Expenses (%, KRW bil.) Credit Cost (%, KRW bil.) 1, , Fees & Commission 1) 1, , ,793 1,032 1, ,577 1,170 1,566 Securities Related & F/X Trading/ Derivatives 1, ,711-1,159-1,195 1, , , , ,203 2, ,385 Salary & Employee Benefits D & A 6.2 4,463 2, ,410 G&A Growth (YoY) 0.3 4,475 2, , ,509 2, , ,811 3, ,423 Other Expenses ,224 2, , ,303 2, , ,184 Credit Cost Ratio , ,165 Provision for Credit Losses 2013~2017 Average Note 1) Including Insurance Fees on Deposits, Contribution Expenses etc. Note 1) Excluding write-backs from Shinhan Card Strong Fee Income Disciplined Cost Management Continuously Stabilizing Credit Cost Fee income increased by 15.3% YoY, attributed to increase in fees from brokerage and sales of financial products despite sluggish credit card fees from dropping merchant fee rate. Non-interest income increased only by 5.1% YoY, despite strong fee income mainly due to absence of non-recurring sales gains from securities disposal in 1H17. Whereas dropped by 48% QoQ, attributed to decrease in evaluation gains from FVPL financial instruments. Cost-to-Income ratio fell down to the lowest level in 6 years marking 44.0% in, through disciplined cost control. SG&A excluding employee related expenses well-tamed with negative growth for three consecutive years through groupwide tightened cost control. However YoY has slightly inched up due to increase in temporary expenses. Group credit costs marked 27bp in, 15bp lower than 5-year average. SHB s provision has decreased by 26.8% YoY, attributed to stable asset quality and elimination of one-off provision burdens related to restructuring companies. SHC s provision hiked temporarily by 29.6% QoQ, due to only a two business day effect after the Chuseok holiday in September. Whereas YoY increase is due to reversal of allowances in 1Q17 caused by the adoption of IRB approach.
7 2018 3Q Business Result Highlights 4 Asset Quality Capital Adequacy ROE & ROA NPL Ratio Delinquency Ratio SFG SHB SHB Shinhan Card BIS Tier SFG SHB ROE ROA CET (e) (e) Note) Based on Basel 3 Note 1) excluding deferred tax asset effect (2016), write-backs from Shinhan Card (2017), ERP Cost (2016 & 2017) Benign Asset Quality Concern Strong Capital Base ROE and ROA Improvement NPL ratio for the Group and SHB recorded 0.55% and 0.47%, improved by 4bp QoQ respectively. NPL coverage ratio for the Group and SHB each marked 170% and 143%, increasing by 5%p and 2%p QoQ respectively. SHB s delinquency ratio improved by 1bp to 0.26%. Whereas SHC s delinquency ratio increased by 12bp to 1.44% attributed to shorter business days after payment date due to the Chuseok holiday in September. Based on BASEL3, Group s Common Equity Tier1 and BIS ratio each estimated 13.0% and 15.3% driven by growth in earnings with suitable level of risk weighted asset growth. Based on BASEL3, SHB s Common Equity Tier1 and BIS ratio each estimated 13.3% and 16.4%. Group ROE recorded 10.7%, 1.5%p hike YTD driven by solid earning growth. Group ROA recorded 0.81%, 0.10%p improvement YTD attributed to strong operating performance both from bank and non-bank subsidiaries with healthy trend in NIM and credit cost.
 +10% NI from Domestic 2) (YoY) +7% Group NI 2) (YoY) +9% Cost-to Income Ratio 44.")
 One Shinhan Corporate Culture Communityoriented NI from Non-Banks 3) (YoY) +14% Non Banks NI Contribution 31% Fee Income (YoY) +15% Non-Interest Income Proportion 25% 4) NI from Global")
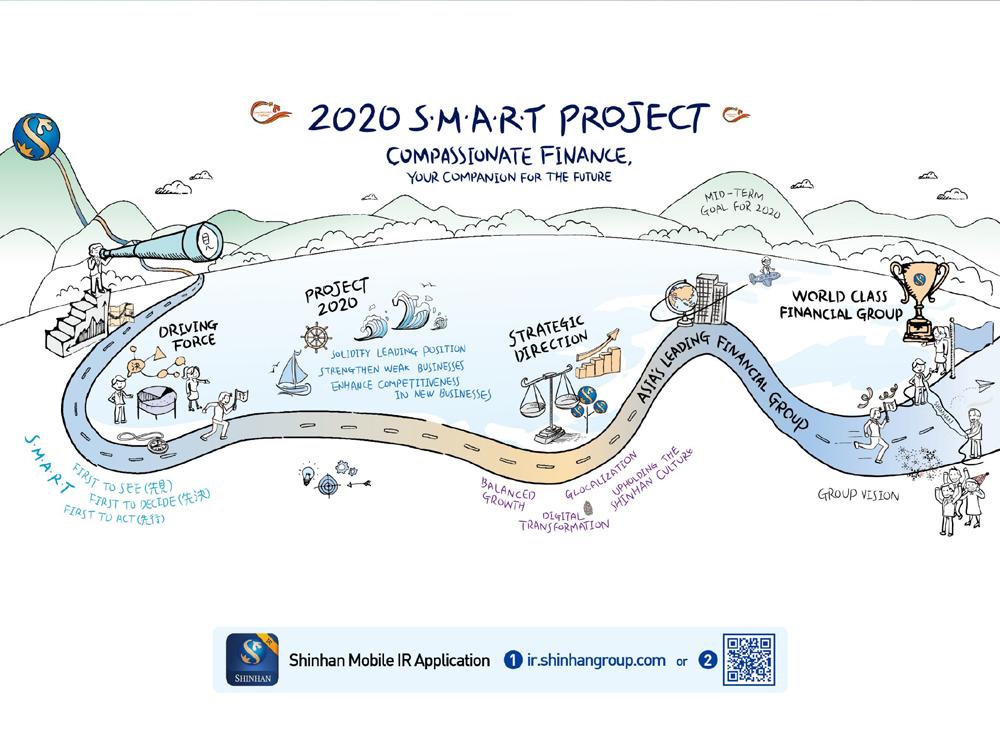
8 Project 2020 Initiatives : Year of Tangible Results 1 Balanced Growth Bank Interest Income Domestic Organic Analog (Off-line) Entity Centric Business Strategy Corporateoriented NI from Banks (YoY) +13% Interest Income (YoY) +10% NI from Domestic 2) (YoY) +7% Group NI 2) (YoY) +9% Cost-to Income Ratio 44.0% Customized Strategy for each of the subsidiaries Mid-term Business Strategy 2020 SMART Project Creative Culture, The Shinhan Leader Non-Banks Non-Interest Income Overseas Inorganic Digital (On-line) One Shinhan Corporate Culture Communityoriented NI from Non-Banks 3) (YoY) +14% Non Banks NI Contribution 31% Fee Income (YoY) +15% Non-Interest Income Proportion 25% 4) NI from Global Business (SHB, YoY) +24% Global NI Contribution 13% New Business Lines + M&As REITs, ANZ Vietnam, PVFC, Archipelago Asset Mgmt. Operating Income through Digital Platform 713bil. Matrix Business Lines, Cross-Selling Ratio 39.9% ESG Recognition A + Grade from CGS Compassionate Finance Society of Hope Project 2 Global 3 Digital 4 Expansion Transformation Uphold Corp. Culture 1) Financial Figures are as of Sep. 30, ) Excluding write-backs from SHC 3) Excluding non-recurring write-backs and sales gains from securities disposal from SHC 4) Excluding Interest expenses related to Provision for policy reserves of Shinhan Life
9 . Income 1. SFG Income 2. SFG Non-Interest Income 3. SFG G&A Expenses 4. Subsidiaries Income (1) 5. Subsidiaries Income (2) 6. SHB Income / NIM 7. SHB Non-Interest Income 8. Shinhan Card Income
10 SFG Income , SFG Interest Income & NIM (Quarterly) ,772 1, ,893 1, ,915 1, , (%, KRW bil.) ,058 2, , Operating Income (a=b+c) Interest Income (b) Non-Interest Income (c) 7, , , , , ,105.1 YoY% 2Q18 QoQ% , , , , ,066 1,098 1,137 1,204 1,170 1,212 1,267 1,344 1,335 1,379 1,415 G&A Expenses (d) 3, , , , Q16 2Q16 3Q16 4Q16 1Q17 2Q17 4Q17 1Q18 2Q18 Pre-Provision Oper. Income (e=a-d) 4, , , , SFG NIM (Excluding Merchant Fee) SHB SFG Earnings before Income Tax Non-Operating Income (f) , ,414 2, ,278 3, ,793 3, ,577 3,796 1,341 3, ,105 3, ,161 Pre-Provision Income (g=e+f) Provision for Credit Losses (h) 4, , , , ,605 6,790 6,693 7,205 7,843 5,771 6,352 Earnings before Income Tax (i=g-h) 3, , , , ,203-1,184 Interest Income -4, Non-Interest Income -4,475-1,037-4,509-1,165 Non-Operating Income -4, G&A Expenses -3, , Provision for Credit Losses Income Tax Consolidated Net Income 1) 2,643.4 Note 1) Net Income in Controlling Interest ,
11 SFG Non-Interest Income SFG Non-Interest Income 1,793 1,577 1,414 1, ,032 1,170 1,386 1,469 1,621 1,566 1, ,711 1,161 1, ,475 1,279 Non-Interest Income Fees & Commission Securities Related & FX Trading/Derivatives (Gains on FVPL Financial Instruments) 1, , , , YoY% 2Q18 QoQ% Fees & Commission ,159 Securities Related & F/X Trading/ Derivatives Note 1) Including Insurance Fees on Deposits, Contribution Expenses etc. 1, SFG Fees & Commission 1, , , ,195 1, , ) , (Gains on Derivatives & F/X) (Contribution Expenses) (Insurance Fees on Deposits) (Provision for Policy Reserves) 1) Note 1) Interest expenses related to Provision for policy reserves of Shinhan Life YoY% 2Q18 QoQ% Fees & Commission 1, , Credit Card Fee Income Brokerage Commissions Fund/Bancassurance Fees Trust Fee Income Credit Card Brokerage Fund/ Bancassurance Trust
12 SFG G&A Expenses SFG G&A Expenses SFG G&A Expenses YoY% 2Q18 QoQ% 4,203 2,498 4,463 2,740 4,475 2,769 4,509 2,826 4,811 3,148 3,224 3,303 G&A Expenses Salary & Employee Benefits (Early Retirement Program Expenses) 3, , , , , , ,043 2,071 D & A , , , , , , ,048 Other Expenses (Advertising Expenses) 1, (Taxes and Dues) Salary & Employee Benefits D & A Other Expenses SHB G&A Expenses Cost-Income Ratio % YoY% 2Q18 QoQ% G&A Expenses Salary & Employee Benefits 2, , , , (Early Retirement Program Expenses) D & A Other Expenses (Advertising Expenses) SFG SHB (Taxes and Dues) Note 1) Excluding ERP Cost
13 Subsidiaries Income 1 Non-Bank Subsidiaries Net Income Contribution by Subsidiaries 1) 4% 7% 4% 29% Bank 56% Non-Bank Subsidiaries 14% 8% 5% 4% Bank 69% Bank (a) Shinhan Bank Jeju Bank Non-Bank (b) Net Income [A] 1, , Ownership Net Income (A x Ownership) [B] [C=AB] 100.0% 68.9% 1, , Adjustment [D] Net Income (Consolidated) [E=C+D] 1, , Shinhan Card % Shinhan Card Shinhan Life Insurance Shinhan Investment Corp. Shinhan Capital & Shinhan Investment Corp. Shinhan Life Insurance % 100.0% Note 1) After reflecting ownership by SFG Shinhan BNPP AM % Net Income Contribution by Non-Bank Subsidiaries 1) Shinhan Capital % % 38.7% 42.0% 34.8% 44.2% 39.9% 31.3% Shinhan Savings Bank Shinhan Data System Shinhan AITAS % 100.0% 99.8% ,046 1,371 1, , ,958 1,387 1,465 1,503 1,728 1,712 Bank Non-Bank NI contribution Note 1) After reflecting ownership by SFG 881 1,932 Shinhan Credit Information Shinhan Alternative Investment Shinhan REITs Management SFG (c) % 100.0% 100.0% Total (d=a+b+c) 1) 2, , ) ,643.4 Note 1) Net Income in Controlling Interest 2) SFG (Separate): Brand Fee Income KRW 37.3bil., Interest Expense KRW bil., G&A etc. KRW -58.3bil.
14 Subsidiaries Income 2 Non-Bank Net Income (Reflecting SFG Ownership, KRW bil.) YoY% 2Q18 QoQ% , , , , Bank (a) Shinhan Bank Jeju Bank Non-Bank (b) Shinhan Card Shinhan Investment Corp. 1, , , , , ROA Shinhan Card Shinhan Life Insurance Shinhan Investment Corp Shinhan Life Insurance Shinhan BNPP AM Shinhan Capital Shinhan Savings Bank Shinhan Data System Shinhan AITAS Shinhan Credit Information Shinhan Alternative Investment Shinhan REITs Management Total (a+b) 2.8 2, , SFG Shinhan Bank Shinhan Card Shinhan Investment Corp. Shinhan Life Insurance Consolidate Net Income 1) 2,643.4 Note 1) Net Income in Controlling Interest 2,
15 SHB Income / NIM Net Income YoY% 2Q18 QoQ% 1,373 1,455 1,490 1,940 1,711 1,696 1,917 Operating Income (a=b+c) Interest Income (b) Non-Interest Income (c) 4, , , , , , , , G&A Expenses (d) 2, , Pre-Provision Oper.Income (e=a-d) 2, , Non-Operating Income (f) Pre-Provision Income (g=e+f) Provision for Credit Losses (h) 2, , ,066 Interest Income/NIM(Quarterly) , , ,204 1,170 1, , , ,335 (%, KRW bil.) , ,415 Earnings before Income Tax (i=g-h) Income Tax Net Income 1) 2, , , , Note 1) Net Income in Controlling Interest 1Q16 2Q16 3Q16 4Q16 1Q17 2Q17 4Q17 1Q18 2Q18 NIS (a-b) (quarterly) Loan interest rate (a) Deposit interest rate (b) NIM (quarterly) Q16 2Q16 3Q16 4Q16 1Q17 2Q17 4Q17 1Q18 2Q18 NIM (cumulative figures) NIM Interest Income
16 SHB Non-Interest Income Non-Interest Income 1, Non-Interest Income Fees & Commission Securities Related & YoY% 2Q17 QoQ% FX Trading/Derivatives (Gains on FVPL Financial Instruments) (Gains on Derivatives & F/X) Fees & Commission Securities Related & F/X Trading/ Derivatives Note 1) Including Insurance Fees on Deposits, Contribution Expenses etc. 1) (Contribution Expenses) (Insurance Fees on Deposits) Fees & Commission Fees & Commission Fund Fee Income Bancassurance Fee Income FX Fee Income Trust Fee Income YoY% 2Q18 QoQ% Fund Bancassurance FX Trust
17 Shinhan Card Income Operating Yield and PPOP Ratio YoY% 2Q18 QoQ% Operating Revenue (a) Card Business 3, , , , , , , , Installment Finance Lease (Derivatives & FX) Operating Yield G&A + Other Expense Ratio PPOP Ratio Interest Expense Ratio Interest Expense (b) Note) Net of Derivatives & F/X G&A Expenses (c) Recovery from Written-off Assets Commissions & Other Expenses (d) 1, , tril. 4.7% 6.3% 5.9% 5.7% 6.2% 6.2% 6.3% (Derivatives & FX) Pre-Provision Income (e=a-b-c-d) Written -off Assets Provision for Credit Losses (f) Earnings before Income Tax (g=e-f) Income Tax , Recovery Rate Recovery from written-off assets Net Income 1) Note 1) Net Income in Controlling Interest
18 . Assets & Liabilities 1. SFG Asset Growth 2. SHB Loan / Deposit Growth 3. Shinhan Card Asset Growth
19 SFG Asset Growth Asset Contribution by Subsidiary (KRW bil.) YTD% QoQ% Life Insurance & etc. 8% Asset Management 8% Bank (a) Shinhan Bank 416, , , , , , Investment 9% Jeju Bank 5, , , Credit Card 5% Bank 70% Non-Bank (b) 170, , , Shinhan Card 29, , , Shinhan Investment Corp. 53, , , SFG Total Assets (KRW tril.) Shinhan Life Insurance 31, , , Shinhan BNPP AM 45, , , Shinhan Capital Shinhan Savings Bank Shinhan Data System Shinhan AITAS Shinhan Credit Information Shinhan Alternative Investment Shinhan REITs Management 5, , , , , , , n.m , , , Total 1) 591, , , Bank Shinhan Card Shinhan Investment Corp. Shinhan BNPP AM Consolidate Total Assets 457, , ,282.0 Note 1) Trust A/C of Shinhan Bank, Shinhan Investment Corp. and AUM(Including discretionary assets) of Shinhan BNPP AM, Shinhan AI, Shinhan REITs are included. 1.0
20 SHB Loan / Deposit Growth Loan Composition Funding Composition YTD% QoQ% Corporate 49.7% SME 40.9% L. Corp. 8.8% SOHO 20.4% Registered 8.1% Unregistered 12.4% Mortgage 25.9% 24.4% Retail 50.3% Debentures 9.2% 3.7% Low Cost Deposits 40.0% Time Savings 47.2% Loan in KRW Retail Mortgage 1) Corporate SME SOHO Large Corporate etc. 205, ,160 53,192 49, ,028 83,973 41,898 18, ,497 98,877 52,808 46,069 96,620 78,556 38,610 18, , ,720 53,097 48,623 99,574 82,219 41,005 17, KRW Loan Growth (KRW tril.) 10.5% 1) 8.8% 6.4% 5.9% 4.4% 5.0% % 62 Low Cost Deposits 19.9% 9.9% (KRW tril.) 9.5% 5.3% Loan in FX 7,516 7, , Note 1) Including Unsecured Personal Loans, Secured Loans, Jeonse Loans etc. YTD% QoQ% Total Deposits in KRW Low Cost Deposits Demand Savings Time Savings 205,408 94,187 28,256 65, , ,355 89,462 26,936 62, , ,682 92,280 28,455 63, , Time Deposits 102,605 99, , Accumulative etc. 8,616 8, , Growth Rate(YTD) Total Loans Growth Rate(YTD) Low Cost Deposits Certificate of Deposits Debentures in KRW 8,709 21,627 6,973 20, ,679 20, Note 1) Including Loans Securitized
21 Shinhan Card Asset Growth (15.4) Transaction Volume (19.4) (23.3) (25.7) (28.2) (20.8) (KRW tril.) (22.5) Earning Assets Credit Purchase Cash Advances Card Loan (Re-aged Loan) Installment Finance Lease etc. YTD% QoQ% 26,708 13,695 1,896 6, ,557 2,293 24,553 12,620 1,921 5, ,270 1, ,116 13,107 1,897 6, ,446 2, Effective Cardholders (in thousands) 12,473 12, , Lump-Sum Install. Purchase Cash Advance Card Loan Note) Figs. in parenthesis represent debit card transaction volume Total Transaction Volume Merchants (in thousands) 2,786 2, , Funding Composition YTD% QoQ% 3% CP 8% Total Funding Debentures 18,494 13,411 15,840 11, ,831 12, ABS 16% ABS 2,918 2, , Debenture 73% CP 1,465 1, ,
22 . Asset Quality 1. SFG Asset Quality 2. SHB Asset Quality 3. Shinhan Card Asset Quality 4. Provision for Credit Losses / Write-offs
23 SFG Asset Quality Precautionary & below Ratio/NPL Ratio YTD% QoQ% Total Loans 1) Normal Precautionary Substandard 281, ,501 2, , ,957 2, , ,075 2, Doubtful Precautionary & below Ratio NPL Ratio Estimated Loss NPL Coverage Ratio Substandard & Below 1,550 1, , NPL Ratio 0.55% 0.62% -0.07%p 0.59% -0.04%p Loan Loss Allowance 2) Reserve for credit losses 3) (New) NPL Coverage Ratio 4) 4,507 1, % 4,246 2, % %p 4,490 1, % %p (Old) NPL Coverage Ratio 291% 260% 31%p 276% 15%p (New) NPL Coverage Ratio(excluding RCL) (Old) NPL Coverage Ratio Note 1) Sum of Shinhan Bank, Jeju Bank, Shinhan Card, Shinhan Investment Corp., Shinhan Life Insurance, Shinhan Capital and Shinhan Savings Bank 2) Sum of IFRS standard LLA and reserves for credit losses 3) Excluding reserve for contingent acceptances & guarantees and unused credit lines 4) Excluding reserve for credit losses in accordance with the revision of relevant regulation (Dec. 2016)
24 SHB Asset Quality NPL Coverage Ratio & NPL Ratio Total Loans Normal Precautionary YTD% QoQ% 232, ,710 1, , ,941 1, , ,223 1, Substandard Doubtful (New) NPL Coverage Ratio (Old) NPL Coverage Ratio (excluding RCL) Delinquency Ratio NPL Ratio Estimated Loss Total Delinquency Substandard & Below 1,101 1, , NPL Ratio 0.47% 0.55% -0.08%p 0.51% -0.04%p SME(+SOHO) 0.55 SOHO Loan Loss Allowance 1) Reserve for credit losses 2) (New) NPL Coverage Ratio 3) 3,053 1, % 2,914 1, % %p 3,096 1, % %p Retail (Old) NPL Coverage Ratio 277% 242% 36%p 266% 11%p Note) 1 month overdue Note 1) Sum of IFRS standard LLA and reserves for credit losses 2) Excluding reserve for contingent acceptances & guarantees and unused credit lines 3) Excluding reserve for credit losses in accordance with the revision of relevant regulation (Dec. 2016)
25 Shinhan Card Asset Quality NPL Ratio & NPL Coverage Ratio YTD% QoQ% Total Loans Normal 27,885 26,785 25,250 24, ,587 25, Precautionary Substandard Doubtful NPL Coverage Ratio NPL Ratio Estimated Loss Delinquency Ratio Substandard & Below NPL Ratio 1.06% 1.04% 0.02%p 1.10% -0.04%p Loan Loss Allowance 1) 1,155 1, , Reserve for credit losses NPL Coverage Ratio 392% 411% -19%p 382% 10%p Note 1) Sum of IFRS standard LLA and reserves for credit losses (Excluding reserve for unused credit lines) Note) 1 month overdue from total credit
26 Provision for Credit Losses / Write-Offs 1, Provision for Credit Losses Shinhan Bank Shinhan Card Credit Cost Ratio SFG 1, Shinhan Bank Write-Offs & NPL Sales Write-Offs 1, NPL Sales Shinhan Card Note 1) Normalized credit cost excluding write-backs from SHC : Group 0.34%, SHC 1.50% Note 2) Normalized credit cost excluding write-backs from SHC : Group 0.27%, SHC 1.35% 2, ,381 1, ,029 1, ,173 1, ,199 1, , , Provision for Credit Losses Shinhan Bank 1) Retail Corporate Shinhan Card Total Note 1) SHB figures are separate basis Write-Offs & NPL Sales FY FY ,188 1Q18 2Q Q18 2Q18 1Q17 2Q17 4Q ,427 1Q17 2Q17 4Q
27 . Capital Adequacy & Key Financial Indices 1. Capital Adequacy 2. Key Financial Indices
28 Capital Adequacy Group BIS Ratio BIS Ratio Tier 1 CET 1 Shinhan Bank BIS Ratio (e) Group BIS Ratio (e) YTD% QoQ% Risk-Weighted Assets Capital CET 1 Tier 1 BIS Ratio CET 1 Tier 1 223,497 34,196 29,072 30, % 13.0% 13.8% 207,769 30,713 26,757 27, % 12.9% 13.3% %p 0.1%p 0.5%p 217,751 32,370 28,390 29, % 13.0% 13.5% %p 0.0%p 0.3%p Note) Based on Basel3 Shinhan Bank BIS Ratio (e) Risk-Weighted Assets (e) YTD% QoQ% 170, , , BIS Ratio Tier 1 CET 1 Capital 27,970 25, , Shinhan Card Capital Adequacy Ratio CET 1 22,695 20, , Tier 1 23,194 21, , BIS Ratio CET % 13.3% 15.6% 12.8% 0.8%p 0.5%p 16.2% 13.2% 0.2%p 0.1%p (e) Note) Figs. from Group/Bank based on Basel3, Figs. up to , Group based on Basel1, Bank based on Basel2 Tier 1 Note) Based on Basel3 13.6% 13.2% 0.4%p 13.5% 0.1%p
29 Key Financial Indices Dividend (KRW) SHB Loan Growth Rate 11.5% 1.83% % 1.80% % 1.37% % 2.01% % 2.95% 1, % 3.06% 1, % 2.85% 1, Dividend Payout Ratio Dividend Yield Dividend per Share Total Loans Corporate Retail ROA / ROE BPS / EPS (KRW) ,738 5,837 52,142 4,684 54,604 3,810 58,076 4,195 61,146 4,789 64,554 5,742 68,316 6, ,400 FY11 FY12 ROE ROA BPS EPS Note 1) Excluding write-backs from Shinhan Card, ROE based on common stock Note) Based on common stock
30 . Appendix 1. SFG Subsidiaries 2. SHB SME Loans 3. SHB Retail Loans 4. SHB International Business
31 SFG Subsidiaries_Shinhan Investment Corp. 1 Net Income Condensed I/S & Key Financial Indices YoY% 2Q18 QoQ% Operating Revenue Fees & Commission Proprietary Trading Operating Expense Operating Income G&A Expenses Commission Expense Provision for Credit Losses Operating Income Net Income Net Capital Ratio 609% 826% -217%p 609% 735% -126%p ROE ROA 9.4% 1.1% 6.7% 0.8% 2.7%p 0.3%p 9.4% 1.1% 11.3% 1.3% -1.9%p -0.2%p Operating Income Operating Revenue Operating Expense Note) ROE, ROA are calculated on a cumulative basis
32 SFG Subsidiaries_Shinhan Investment Corp. 2 Fees & Commission % IB 16% Financial Product Fees % Brokerage Fees 56% Fees & Commission Fees & Commission Brokerage Fees Financial Product Fees 98.6 IB YoY% 2Q18 QoQ% Brokerage Fees Financial Product Fees IB Financial Products (KRW tril.) Beneficiary Certificate Trust Account ELS 1) Financial Product Balance Note 1) Sum of Wrap, RP and Micro Debentures Balance of Financial Products (KRW tril.) YTD% QoQ% Financial Products Beneficiary Certificate Trust Account ELS
33 SFG Subsidiaries_Shinhan Life Insurance 1 Premium Income 4,719 4,833 4,505 4,399 4,800 3,615 3,455 Premium Breakdown Prem. Received 3,465.2 New Premium , YoY% 2Q18 QoQ% , , Monthly Premium Non-Monthly Premium Recurring Premium 3, , , , Note) Excluding non-monthly premium and Retirement Pension Note) Excluding Retirement Pension Net Income Profitability & Key Financial Indices YoY% 2Q18 QoQ% Operating Income Separate Account profit & Loss Net Income ROE % % %p % % %p ROA 0.6% 0.5% 0.1%p 0.6% 0.5% 0.1%p Operating Income Net Income Note) ROE, ROA are calculated on a cumulative basis.
34 SFG Subsidiaries_Shinhan Life Insurance 2 Operating Assets (KRW tril.) Operating Assets Operating Assets Cash & Deposits Fixed Income YTD% QoQ% 26, , , , , , , Loans 5, , , Operating Assets 1.5 Cash & Deposits 1.8 Fixed Income 1.5 Loans 1.2 Equities 0.4 Equities , , , Equity & Capital Adequacy Ratio 253.1% 230.7% 204.2% 178.3% 175.4% (%, KRW tril.) 197.4% 1.7 Equity & Capital Adequacy Ratio YTD% QoQ% Shareholders Equity 1, , , Capital & Retained Earnings 1, , , Accumulated Other Comprehensive Income RBC Ratio 197.4% 175.4% 22.0%p 199.6% -2.2%p RBC Ratio Shareholders Equity
35 SFG Subsidiaries_Shinhan BNPP AM Net Income Condensed I/S & Key Financial Indices Operating Revenue Operating Expense YoY% 2Q18 QoQ% (G&A Expenses) Operating Income Operating Income Net Income Net Income ROE % % %p % % %p Assets Under Management Equity Type Bond Type (KRW tril.) MMF Derivatives Total AUM Note) ROE is calculated on a cumulative basis Assets Under Management (KRW tril.) YTD% QoQ% Total AUM Equity Type Bond Type MMF Derivatives
36 SHB SME Loans SME % 8% 18% 26% 3% 26% Loans % 8% 17% 26% 3% 27% % 8% 16% 26% 3% 30% % 7% 16% 25% 2% 31% % 7% 16% 26% 2% 32% Note 1) SOHO 50%, Registered 20%, Unregistered 30% (KRW tril.) % 7% 16% 26% 2% 31% Total Accommodations & Restaurants Wholesalers & Retailers Real Estate & Renting Construction Manufacturing Delinquency Total Wholesalers & Retailers Real Estate & Renting Manufacturing Collateral Deposits etc. 4% Guarantee 13% Collateralized 72% Real Estate 55% Unsecured 28% SOHO % 13% 18% 40% 1% 12% % 13% 18% 41% 1% 12% % 12% 17% 41% 1% 13% % 12% 16% 41% 1% 14% % 11% 17% 42% 1% 14% % 11% 16% 43% 1% 13% Total Accommodations & Restaurants Wholesalers & Retailers Real Estate & Renting Construction Manufacturing Total Accommodations & Restaurants Wholesalers & Retailers Real Estate & Renting Manufacturing Deposits etc. 3% Guarantee 10% Unsecured 20% Real Estate 67% Collateralized 80%
37 SHB Retail Loans Loans (KRW tril.) Retail Personal Loans Note 1) Including unsecured personal loans, collective loans, home equity loans etc (KRW tril.) Loan Composition Personal Jeonse Loans 15% 48% Secured Mortgage 7% 1 8% High credit Unsecured 18% 52% Retail Loans Mortgage Personal Loans High credit Unsecured Personal Loans Secured Loans Jeonse Loans 1) Note 1) Including unsecured personal loans, collective loans, home equity loans etc. Delinquency LTV Collateral Unsecured 25% Guarantee 24% Real Estate 50% Retail Loans Personal Loans Mortgage Deposits etc. 1% Collateralized 75%
38 SHB International Business Net Income Contribution by International Business 13.7% 11.6% 11.6% 8.4% 8.6% 9.3% 24% 7.0% % % Net Income Composition Shinhan Bank America 1% Subsidiaries 74% Shinhan Asia 7% Shinhan Bank China 10% 7% Shinhan Bank Japan 18% Overseas Branch 26% Shinhan Vietnam 31% NI Contribution Global Net Income Asset Contribution by International Business 8.2% 8.2% 8.6% Asset Composition 6.3% 14, % 14, % 16, % 18, % 20, , , ,856 Subsidiaries 73% Shinhan Bank China 18% Shinhan Bank America 5% 12% Shinhan Bank Japan 24% Overseas Branch 27% Shinhan Vietnam 14% Asset Contribution Global Assets
39
To the Asia s Leading Financial Group. Shinhan Financial Group
 To the Asia s Leading Financial Group Shinhan Financial Group 1 About SFG Korea # 1 Financial Institution Realizing highest net income among peers (consecutive 9 years since 2008) Market Cap ranked 1 st
KEB Operating Results for 1H 2009
 KEB Operating Results for 1H 2009 August 2009 The information contained in this presentation material has not yet been audited by a third-party independent auditor and is subject to change during the accounting
Aim Higher and Creatively Pioneering Ahead Shinhan Financial Group
 Aim Higher and Creatively Pioneering Ahead Shinhan Financial Group 1 About SFG Korea s Leading Financial Institution Sustainable Net Income growth driven by solid core earnings and consistent ROE enhancing
2012 Hana Financial Group Business Results
 2012 Hana Financial Group Business Results - This information contained in this presentation material is not audited by a third party independent auditor and is subject to change - KEB s figures are reclassified
KEB Operating Results for 2009
 KEB Operating Results for 2009 February 2010 The information contained in this presentation has not been audited by an independent auditor and is subject to change during the accounting audit of KEB. A.
KEB IR Team. Contents
 Contents Disclaimer The information contained in this presentation material has not yet been audited by a third-party independent auditor and is subject to change during the accountig audit of KEB. Since
TMB Bank Plc. Building the Best Transactional Bank. Make THE Difference. Day with Executive Management
 TMB Bank Plc. Building the Best Transactional Bank Day with Executive Management November 1, 215 Make THE Difference AGENDA 3Q15 Financial Performance 9M15 Financial Performance Looking Forward [2] Executive
Fubon Financial Holdings Year 2017 Overview
 Fubon Financial Holdings Year 2017 Overview 2018.03.23 Disclaimer This meeting may contain forward-looking statements with respect to the financial condition, results of operations and business of the
SIAM COMMERCIAL BANK PCL.
 SIAM COMMERCIAL BANK PCL. 1Q17 Financial Results Analyst Meeting Presentation April 21 st, 2017 IMPORTANT DISCLAIMER: Information contained in this document has been prepared from several sources and the
Business Review 2Q18
 Business Review 2Q18 Disclaimer This presentation may include forward looking statements. All statements, other than statements of historical facts, that address activities, events or developments that
3Q 2013 consolidated financial results. November 7, 2013
 BANK HANDLOWY W WARSZAWIE S.A. 3Q 2013 consolidated financial results November 7, 2013 3Q 2013 in Citi Handlowy summary Gains on sale of AFS FX & trading 86 1 85 2011: PLN 333 MM -17% YoY Financial Markets
CONTENTS. Introduction to HFG Fundamentals KEB Acquisition DISCLAIMER
 Financial Group This information contained in this presentation material is not audited by a third party independent auditor and is subject to change. CONTENTS Introduction to HFG Fundamentals KEB Acquisition
Record full-year and quarterly earnings DBS Group Holdings 4Q 2017 financial results February 8, 2018
 Record full-year and quarterly earnings DBS Group Holdings 4Q 2017 financial results February 8, 2018 Disclaimer: The information contained in this document is intended only for use during the presentation
First Quarter 2017 Results Presentation 09 May 2017
 First Quarter 2017 Results Presentation 09 May 2017 Disclaimer: This material should be read as an overview of OCBC s current business activities and operating environment. It should not be solely relied
Bank Handlowy w Warszawie S.A. 2Q 2014 consolidated financial results
 Bank Handlowy w Warszawie S.A. 2Q 2014 consolidated financial results August 1, 2014 Preliminary financial results of the Capital Group of Bank Handlowy w Warszawie S.A. for 2Q 2014 Summary of 2Q 2014
Management Discussion and Analysis
 Management Discussion and Analysis For the second quarter and first half ended June 30, 2018 The Siam Commercial Bank Public Company Limited The Siam Commercial Bank Public Company Limited 9 Ratchadapisek
1Q18 Financial Results
 1Q18 Financial Results Analyst Meeting Presentation 23 April 2018 IMPORTANT DISCLAIMER: Information contained in this document has been prepared from several sources and the Bank does not confirm the accuracy
2Q15 Quarterly Supplement
 2Q15 Quarterly Supplement July 14, 2015 2015 Wells Fargo & Company. All rights reserved. Table of contents 2Q15 Results - 2Q15 Highlights Page 2 - Year-over-year results 3 - Balance Sheet and credit overview
2017 Full Year Results Presentation 14 February 2018
 2017 Full Year Results Presentation 14 February 2018 Disclaimer: This material should be read as an overview of OCBC s current business activities and operating environment. It should not be solely relied
ABU DHABI COMMERCIAL BANK PJSC REPORTS FIRST HALF 2018 NET PROFIT OF AED BILLION, SECOND QUARTER 2018 NET PROFIT OF AED 1.
 Abu Dhabi Commercial Bank Sheikh Zayed Bin Sultan Street P. O. Box: 939, Abu Dhabi http://www.adcb.com ABU DHABI COMMERCIAL BANK PJSC REPORTS FIRST HALF 2018 NET PROFIT OF AED 2.332 BILLION, SECOND QUARTER
Analyst Briefing First Half 2017 Financial Results
 Analyst Briefing First Half 2017 Financial Results Jakarta, 25 July 2017 PT Bank Danamon Indonesia, Tbk. Terdaftar dan diawasi oleh Otoritas Jasa Keuangan First Half 2017 Financial Highlights Assets and
2015 Full Year Results Presentation
 2015 Full Year Results Presentation 17 February 2016 Disclaimer: This material should be read as an overview of OCBC s current business activities and operating environment. It should not be solely relied
Fourth Quarter 2018 Earnings Review
 Citi Investor Relations Fourth Quarter 2018 Earnings Review January 14, 2019 Overview 4Q 18 showed continued progress in a challenging environment Continued momentum in Institutional accrual businesses
Third Quarter 2017 Results Presentation 26 October 2017
 Third Quarter 2017 Results Presentation 26 October 2017 Disclaimer: This material should be read as an overview of OCBC s current business activities and operating environment. It should not be solely
4Q15 Quarterly Supplement
 4Q15 Quarterly Supplement January 15, 2016 These results do not reflect the impact of the agreement in principle Wells Fargo & Company reached with the United States government on February 1, 2016 to pay
UOB - Premier Regional Bank
 UOB - Premier Regional Bank First Half / Second Quarter 2004 Group Results Briefing Address by Mr Kuek Tong Au Executive Vice President Corporate Services 30 July 2004 Disclaimer : This material that follows
Fubon Financial 1H2012 Interim Update
 Fubon Financial 1H2012 Interim Update 2012.08.10 Disclaimer This meeting may contain forward-looking statements with respect to the financial condition, results of operations and business of the company.
2014 Full Year Results Presentation
 2014 Full Year Results Presentation 11 February 2015 Disclaimer: This material should be read as an overview of OCBC s current business activities and operating environment. It should not be solely relied
1Q17 Quarterly Supplement
 1Q17 Quarterly Supplement April 13, 2017 2017 Wells Fargo & Company. All rights reserved. Table of contents 1Q17 Results Year-over-year results Retail Banking customer activity 1Q17 Highlights Page 2 Balance
2014 record earnings, broad-based income growth
 record earnings, broad-based growth DBS Group Holdings 4Q financial results February 10, 2015 Disclaimer: The information contained in this document is intended only for use during the presentation and
KASIKORNBANK. Presentation for Analyst Meeting as of 4Q17. January 2018
 KASIKORNBANK Presentation for Analyst Meeting as of 4Q17 January 218 For further information, please contact the Investor Relations Unit or visit our website at www.kasikornbank.com 1 KASIKORNBANK at a
BBVA earns 4.32 billion in the first nine months
 Press release 10.30.2018 January-September 2018 BBVA earns 4.32 billion in the first nine months Transformation: Digital and mobile customers as well as digital sales continued to grow across all geographies,
Analyst Presentation 1Q18 Results
 CIMB Group Analyst Presentation 1Q18 Results 30 May 2018 Key Financial Highlights Net Profit (RM) ROE Gross Loan (RM) ^ *^ ~ 1,306mil +10.7% Y-o-Y 10.2% -10bps Y-o-Y 323.1bn +0.5% Y-o-Y Cost-to-Income
Siam Commercial Bank PCL
 Siam Commercial Bank PCL CLSA Investors Forum 2011 September 2011 1. Agenda Review of Result 2Q11 Page 3-17 2. Going Forward 19-23 IMPORTANT DISCLAIMER: Information contained in this document has been
Record 2015 earnings. DBS Group Holdings 4Q 2015 financial results. February 22, 2016
 Record earnings DBS Group Holdings 4Q financial results February 22, 2016 Disclaimer: The information contained in this document is intended only for use during the presentation and should not be disseminated
KKP Analyst Meeting 1Q16
 KKP Analyst Meeting 1Q16 April 28, 2016 1Q16 Financial Performance Kiatnakin Phatra April 2016 1 Table of Contents Performance Highlights Commercial Banking Business Capital Market Business Appendix 1Q16
3Q17 Quarterly Supplement
 3Q17 Quarterly Supplement October 13, 2017 2017 Wells Fargo & Company. All rights reserved. Table of contents 3Q17 Results 3Q17 Highlights Year-over-year results Page 2 Balance Sheet and credit overview
Third Quarter Results 2018
 Lima, Peru, November 07 th, 2018 Credicorp (NYSE: BAP) announced its unaudited results for the third quarter of 2018. These results are consolidated according to IFRS in Soles. Third Quarter Results 2018
Second Quarter 2017 Results Presentation 27 July 2017
 Second Quarter 2017 Results Presentation 27 July 2017 Disclaimer: This material should be read as an overview of OCBC s current business activities and operating environment. It should not be solely relied
First Half 2002 GROUP FINANCIAL RESULTS. For The Six Months Ended 30 June 2002
 First Half 2002 GROUP FINANCIAL RESULTS For The Six Months Ended 30 June 2002 5 August 2002 Contents Media Release 2 Financial Review 5 Highlights 5 Financial Summary 6 Net Interest Income 7 Non-Interest
Analysts Presentation First Half 2018 Financial Results. Dato' Khairussaleh Ramli Group Managing Director RHB Banking Group 30 August 2018
 Analysts Presentation First Half Financial Results Dato' Khairussaleh Ramli Group Managing Director RHB Banking Group 30 August Executive Summary H1 Financial Results Strategy Update Summary and Outlook
TMB Bank Plc. To be the Most Advocated Transactional Bank in Country. Investor Presentation 9M17 Analyst Meting 18 October 2017
 TMB Bank Plc. To be the Most Advocated Transactional Bank in Country Investor Presentation 9M17 Analyst Meting 18 October 2017 AGENDA 9M17 & 3Q17 Financial Performance Asset Quality 2017 Target 2 Continue
UOB Group First Half 2009 Briefing. Financial Highlights. Lee Wai Fai Chief Financial Officer. 5 August 2009
 UOB Group First Half 2009 Briefing Financial Highlights Lee Wai Fai Chief Financial Officer 5 August 2009 Disclaimer : This material that follows is a presentation of general background information about
Hansabank Group Financial Results Q2 2008
 Hansabank Group Financial Results 2008 Content Highlights Volumes Income Expenses Risk 2 Highlights 2008 Following larger one-off events affected performance: Sale of Russian business unit. On 12 May 2008,
INVESTOR PRESENTATION
 INVESTOR PRESENTATION CLSA ASEAN CORPORATE ACCESS FORUM 2013 14 th March 2013 Agenda Page 1. Review of Result 2012 3-19 2. Future Positioning 21-23 IMPORTANT DISCLAIMER: Information contained in this document
The Board of Directors of DBS Group Holdings Ltd ( DBSH ) reports the following:
 reports the following:") DBS Group Holdings Ltd Incorporated in the Republic of Singapore Company Registration Number: 199901152M To: Shareholders The Board of Directors of DBS Group Holdings Ltd ( DBSH ) reports the following:
DBS Group Holdings Ltd Incorporated in the Republic of Singapore Company Registration Number: 199901152M To: Shareholders The Board of Directors of DBS Group Holdings Ltd ( DBSH ) reports the following:
1Q15 Quarterly Supplement
 1Q15 Quarterly Supplement April 14, 2015 2015 Wells Fargo & Company. All rights reserved. Table of contents 1Q15 Results - 1Q15 Highlights Page 2 - Year-over-year results 3-1Q15 Revenue diversification
Abu Dhabi Commercial Bank PJSC Earnings presentation
 Abu Dhabi Commercial Bank PJSC 2017 Earnings presentation January 2018 Disclaimer THIS PRESENTATION IS NOT AN OFFER OR SOLICITATION OF AN OFFER TO BUY OR SELL SECURITIES. IT IS SOLELY FOR USE AS AN INVESTOR
Third Quarter 2018 Earnings Review
 Citi Investor Relations Third Quarter 2018 Earnings Review October 12, 2018 Overview Solid operating results in 3Q 18 Continued momentum in Institutional accrual businesses and strong results in Fixed
FY 2017 Results Presentation. 16 January 2018
 FY 217 Results Presentation 16 January 218 2 Important Information Disclaimer The material in this presentation is general background information about the activities of Emirates NBD Bank PJSC (Emirates
Earnings resilience despite market volatility DBS Group Holdings 1Q 2008 financial results May 7, 2008
 Earnings resilience despite market volatility DBS Group Holdings financial results May 7, Disclaimer: The information contained in this document is intended only for use during the presentation and should
Samsung Securities Co., Ltd.
 Samsung Securities Co., Ltd. Samsung Group Asia Conference August 2016 Investor Relations Samsung Securities Contents 1. 2Q16 Earnings Review Income statement Net revenues Operating expenses Wealth management
Analysts Presentation 3 rd Quarter 2018 Financial Results. Dato' Khairussaleh Ramli Group Managing Director RHB Banking Group 27 November 2018
 Analysts Presentation 3 rd Quarter Financial Results Dato' Khairussaleh Ramli Group Managing Director RHB Banking Group 27 November Executive Summary 3 rd Quarter Financial Results Strategy Update Summary
Commenting on the performance, Bill Winters, Group Chief Executive, said:
 31 October 2018 Standard Chartered PLC - Interim Management Statement Standard Chartered PLC (the Group) today releases its Interim Management Statement for the period 30 September 2018. All figures are
FY2010 Earnings & EV Results
 FY2010 Earnings & EV Results May 12, 2011 This document is intellectual property of Samsung Life. Therefore, it is strictly prohibited to copy or send to outside of your organization without formal permission
Samsung Securities Co., Ltd.
 Samsung Securities Co., Ltd. 3Q 2016 Earnings Release November 2016 Investor Relations Samsung Securities Contents Income Statement (summary) Net revenues Brokerage Financial product sales Trading & interest
OCBC Group Reports Full Year 2007 Net Profit of S$2,071 million. Core Net profit rose 30% to S$1,878 million for the year
 Media Release OCBC Group Reports Full Year 2007 Net Profit of S$2,071 million Core Net profit rose 30% to S$1,878 million for the year Singapore, 21 February 2008 - Oversea-Chinese Banking Corporation
INVESTOR PRESENTATION
 INVESTOR PRESENTATION J.P. MORGAN THAILAND CONFERENCE 2011 Deepak Sarup, CFO 17 th March 2011 AGENDA Pages I. Review of Results 2010 3-15 II. Future Positioning 17-27 III. 2011 Targets 29 IMPORTANT DISCLAIMER:
2018/1Q Analyst Meeting. May 29 th, 2018
 2018/1Q Analyst Meeting May 29 th, 2018 Disclaimer This presentation and the presentation materials distributed herewith may include forward-looking statements. 2018/1Q financial data are preliminary.
Fidelity Bank Investor Presentation
 Fidelity Bank Investor Presentation Audited Financial Results for the 6 months ended June 30, 2018 Outline 1. Overview of Fidelity Bank 2. The Operating Environment 3. Financial Highlights 4. Financial
Analyst Presentation 1H18 Results
 Analyst Presentation 1H18 Results CIMB Group Holdings 29 August 2018 Key Financial Highlights Net Profit (RM) ROE Gross Loan (RM) ^ *^ ~ 2,359mil +3.3% Y-o-Y 9.7% -20bps Y-o-Y 329.9bn +3.4% Y-o-Y Cost-to-Income
QNB Finansbank Q3 17 Earnings Presentation. October 2017
 QNB Finansbank Earnings Presentation October 2017 Banking sector growth continued in thanks to accommodative policy measures Macro Dynamics Banking Sector Dynamics 13 12 11 CBRT Rates Late liquidity O/N
1Q18 EARNINGS PRESENTATION. Based on BRSA Consolidated Financials April 26 th 2018
 1Q18 EARNINGS PRESENTATION Based on BRSA Consolidated Financials April 26 th 2018 ROBUST EARNINGS PERFORMANCE NET INCOME (TL million) 2.2% ROAA vs. 1.9% in 2017 31% 2,011 1,537 1,702 18% 18.3% ROAE vs.
Another record quarter DBS Group Holdings 1Q 2018 financial results April 30, 2018
 Another record quarter DBS Group Holdings 1Q 2018 financial results April 30, 2018 Disclaimer: The information contained in this document is intended only for use during the presentation and should not
Royal Bank of Canada Third Quarter Results August 26, 2015
 Royal Bank of Canada Third Quarter Results August 26, 2015 All amounts are in Canadian dollars and are based on financial statements prepared in compliance with International Accounting Standard 34 Interim
United Overseas Bank Limited
 United Overseas Bank Limited GROUP FINANCIAL PERFORMANCE FOR FIRST QUARTER 2003 2 May 2003 Contents I) Highlights & Performance Indicators Key Indicators 2 Other Indicators 3 II) Review of Financial Performance
Investor Presentation
 Investor Presentation Sumitomo Mitsui Banking Corporation August, 2001 Agenda Part 1 : From pre-merger to post-merger 1. From pre-merger to post-merger 2. FY2000 Performance 3. Balance sheet merger benefits
2Q16 Quarterly Supplement
 2Q16 Quarterly Supplement July 15, 2016 2016 Wells Fargo & Company. All rights reserved. Table of contents 2Q16 Results 2Q16 Highlights Page 2 Year-over-year results 3 Balance Sheet and credit overview
The figures presented do not constitute any form of commitment by BCP in regard to future earnings
 Disclaimer The information in this presentation has been prepared under the scope of the International Financial Reporting Standards ( IFRS ) of BCP Group for the purposes of the preparation of the consolidated
The Board of Directors of DBS Group Holdings Ltd ( DBSH or the Company ) reports the following:
 reports the following:") To: Shareholders The Board of Directors of DBS Group Holdings Ltd ( DBSH or the Company ) reports the following: Audited Financial Results for the Year/ Fourth Quarter Ended 31 December 2017 Details of
To: Shareholders The Board of Directors of DBS Group Holdings Ltd ( DBSH or the Company ) reports the following: Audited Financial Results for the Year/ Fourth Quarter Ended 31 December 2017 Details of
Q1 FY19 FINANCIALS JUNE 30, 2018
 Q1 FY19 FINANCIALS JUNE 30, 2018 Key Highlights: Q1 FY19 (In lacs) 16.0 10.1 No. of Customers (Total: 30.8 lacs IBL customers: 13.4 lacs) 19.4 11.1 23.3 12.2 5.9 8.3 11.0 27.0 30.8 12.9 14.1 13.4 17.4
Financial Results. Fiscal Year 3/2013 -Supplementary Information- Sumitomo Mitsui Financial Group, Inc. Sumitomo Mitsui Banking Corporation
 Financial Results Fiscal Year 3/2013 -Supplementary Information- Sumitomo Mitsui Financial Group, Inc. Sumitomo Mitsui Banking Corporation Financial highlights for Table of contents Page 1. Income analysis
Mirae Asset Life Insurance Q1 Results
 Mirae Asset Life Insurance 2017 Results Contents I. Financial Highlights Condensed Financial Statements 3 II. Insurance & Fee-Biz Results Insurance Results 5 Fee-Biz Results 8 III. Business Efficiency
Third Quarter 2017 Earnings Review
 Citi Investor Relations Third Quarter 2017 Earnings Review October 12, 2017 Overview 3Q 17 showed strong results and balanced performance across the franchise Revenue growth and positive operating leverage
The Board of Directors of DBS Group Holdings Ltd ( DBSH or the Company ) reports the following:
 reports the following:") To: Shareholders The Board of Directors of DBS Group Holdings Ltd ( DBSH or the Company ) reports the following: Unaudited Financial Results for the Nine Months/ Third Quarter Ended 30 September Details
To: Shareholders The Board of Directors of DBS Group Holdings Ltd ( DBSH or the Company ) reports the following: Unaudited Financial Results for the Nine Months/ Third Quarter Ended 30 September Details
VoNB (Value of New Business) APE (Annualized Premium Equivalent) Protection APE (+2.2%) 1,211 1,329 (+9.8%) NBM (New Business Margin)
 APE (Annualized Premium Equivalent) Protection APE (+2.2%) 1,211 1,329 (+9.8%) NBM (New Business Margin)") The financial information contained herein has not been completely reviewed by our external auditor. Therefore, no assurance is provided that our financial statements are fully accurate, and thus our final
The financial information contained herein has not been completely reviewed by our external auditor. Therefore, no assurance is provided that our financial statements are fully accurate, and thus our final
UOB Group Full Year 2008 Briefing. Financial Highlights. Lee Wai Fai Chief Financial Officer. 27 February 2009
 UOB Group Full Year 2008 Briefing Financial Highlights Lee Wai Fai Chief Financial Officer 27 February 2009 Disclaimer : This material that follows is a presentation of general background information about
Second Quarter 2018 Earnings Review
 Citi Investor Relations Second Quarter 2018 Earnings Review July 13, 2018 Overview Solid operating results in 2Q 18 Revenue growth in all regions and across products in Consumer Continued momentum in Institutional
Management Discussion and Analysis
 OVERVIEW 2002 2001 + / (-) Selected profit and loss data: Net interest income 1,509 1,392 8.4 Fees and commissions 374 292 27.9 Dividends 34 36(7.0) Rental income 77 81 (5.2) Other income 228 412 (44.7)
Analysts Presentation 3 rd Quarter 2017 Financial Results. Dato' Khairussaleh Ramli Group Managing Director RHB Banking Group 27 November 2017
 Analysts Presentation 3 rd Quarter Financial Results Dato' Khairussaleh Ramli Group Managing Director RHB Banking Group 27 November Executive Summary 3 rd Quarter Financial Results Strategy Update Summary
Slovakia: Eurozone country with high growth potential
 Erste Group 8 th Capital Markets Day, Jozef Síkela, CEO, Slovenská sporiteľňa Disclaimer Cautionary note regarding forward-looking statements THE INFORMATION CONTAINED IN THIS DOCUMENT HAS NOT BEEN INDEPENDENTLY
3Q18 Quarterly Supplement
 3Q18 Quarterly Supplement October 12, 2018 2018 Wells Fargo & Company. All rights reserved. Table of contents 3Q18 Results 3Q18 Highlights Pages 2 3Q18 Earnings 3 Year-over-year results 4 Balance Sheet
Consolidated financial results for 3Q 2017
 Consolidated financial results for 3Q 2017 November 14 th, 2017 www.citihandlowy.pl Bank Handlowy w Warszawie S.A. 3Q 2017 Summary Positive trends continued: Build-up of client assets in Retail Banking
Q Results Presentation. 18 April 2018
 Q1 218 Results Presentation 18 April 218 2 Important Information Disclaimer The material in this presentation is general background information about the activities of Emirates NBD Bank PJSC (Emirates
First Quarter 2018 Earnings Review
 Citi Investor Relations First Quarter 2018 Earnings Review April 13, 2018 Overview 1Q 18 showed strong operating results and balanced franchise performance Revenue growth in both Cards and Retail Banking
Mashreq Bank. YE 2016 Results
 Mashreq Bank YE 2016 Results 2 Disclaimer The material in this presentation is general background information about MashreqBank s activities current at the date of the presentation. It does not constitute
No. 11/2018. Performance of the Thai Banking System in 2017
 No. 11/218 Performance of the Thai Banking System in 217 Ms. Daranee Saeju, Senior Director, Financial Institutions Strategy Department, Bank of Thailand, reported on the Thai banking system s performance
April Q 2018 Results Update
 April 2018 1Q 2018 Results Update Contents Overall financial update Update on new digital businesses Maintained Strong Liquidity and Asset Quality despite Flat Loans Growth Unit: IDR billion Cash & Liquid
Samsung Securities Co., Ltd.
 Samsung Securities Co., Ltd. 2Q 2017 Earnings Release August 2017 Investor Relations Contents Income Statement (summary) Net revenues Brokerage Financial product sales Trading & interest income Investment
2018 1H Interim Results Fubon Financial Holdings
 2018 1H Interim Results Fubon Financial Holdings 2018.08.29 Disclaimer This meeting may contain forward-looking statements with respect to the financial condition, results of operations and business of
Financial Results for the Fiscal Year ended March 31, 2018 (Consolidated Data) May 14, 2018
 May 14, 2018") Financial Results for the Fiscal Year ended March 31, 2018 (Consolidated Data) May 14, 2018 Company Name: Senshu Ikeda Holdings, Inc. Stock exchange listing: Tokyo Stock Exchange Stock Code: 8714 URL http://www.senshuikeda-hd.co.jp/
Financial Results for the Fiscal Year ended March 31, 2018 (Consolidated Data) May 14, 2018 Company Name: Senshu Ikeda Holdings, Inc. Stock exchange listing: Tokyo Stock Exchange Stock Code: 8714 URL http://www.senshuikeda-hd.co.jp/
UOB - Premier Regional Bank
 UOB - Premier Regional Bank 2004 Group Results Briefing Address by Kuek Tong Au Executive Vice President Corporate Services 24 February 2005 Disclaimer : This material that follows is a presentation of
P T B a n k D a n a m o n I n d o n e s i a T b k
 P T B a n k D a n a m o n I n d o n e s i a T b k A n a l y s t B r i e f i n g 1 st H a l f 2 0 1 8 Jakarta, 25 July 2018 PT Bank Danamon Indonesia Tbk terdaftar dan diawasi oleh OJK L o n g - t e r m
Record first quarter earnings
 Record first quarter earnings DBS Group Holdings 2015 financial results April 27, 2015 Disclaimer: The information contained in this document is intended only for use during the presentation and should
0 V3 12/11/58 15:51 น.
 0 1 Management Discussion and Analysis Overview of the Economy and Banking Thai Economy in the Third Quarter of Thailand s economy in the third quarter of recovered at a moderate pace. Domestic demand
Samsung Securities Co., Ltd.
 Samsung Securities Co., Ltd. 3Q 2017 Earnings Release November 2017 Investor Relations Contents Income Statement (summary) Net revenues Brokerage Financial product sales Trading & interest income Investment
Summary of Financial Results for Fiscal 2017 <Under Japanese GAAP> May 15, 2018
 Summary of Financial Results for Fiscal 07 May 5, 08 Contents Overview of Income Statement Overview of Balance Sheet Overview of Loans Non-interest Income P. P.3 P.4 P.5 Financial
H1 FY19 FINANCIALS OCTOBER 25, 2018
 H1 FY19 FINANCIALS OCTOBER 25, 2018 3 Key Highlights: H1 FY19 19.4 11.1 8.3 11.0 No of Customers (Total: 34.6 lacs IBL: 14.9 lacs) 23.3 12.2 27.0 12.9 14.1 30.8 13.4 34.6 14.9 17.4 19.8 8.2% CASA to Deposits
The figures presented do not constitute any form of commitment by BCP in regard to future earnings.
 Disclaimer The information in this presentation has been prepared under the scope of the International Financial Reporting Standards ( IFRS ) of BCP Group for the purposes of the preparation of the consolidated